Abstract
Offshore oil and gas activities are crucial in the petroleum industry. Offshore oil and gas installations require different cargo to operate. A heterogeneous fleet of platform supply vessels (PSVs) transports cargo supply to installations. The PSV fleet management in Brazil faces challenges such as the non-availability of the spot market, variations and uncertainties in delivery order demands and due dates, inspection and corrective vessel maintenance, and multiple time windows for service at installations. PSV fleet management aims to satisfy cargo delivery requests in time and quantity, avoid delays, and achieve a balance among delivery service levels, vessel costs, and greenhouse gas emissions. We develop several PSV fleet management policies with delivery service level or fuel consumption goals, composed of new fleet management procedures such as vessel control, vessel assignment to voyages including cargo selection, vessel routing, speed selection, and dynamic re-routing. The results of tests on a real Brazilian case demonstrate that the developed policies with the incorporated fleet management procedures improve fleet performance indicators. The comparative analysis of policies shows their different impacts on indicators, allowing managers to select the best fleet management policy by considering the trade-offs between delivery service level, costs, and emissions, depending on their goals.
1. Introduction
Offshore oil and gas exploration and production activities are crucial in the energy industry, accounting for a large share of total energy production. Offshore oil and gas installations performing offshore activities require many types of cargos to operate. In Brazilian offshore logistics, the upstream supply chain includes the land transportation of cargos from warehouses to the supply base and the maritime transportation of cargos from the supply base to installations (Figure 1).
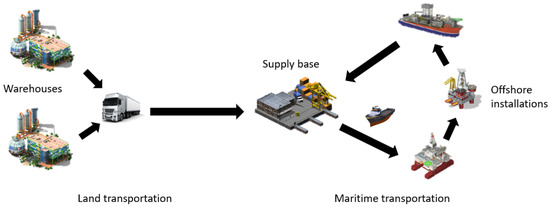
Figure 1.
Offshore logistics supply chain [authors].
Offshore supply vessels (OSVs) come in different types, sizes, and vessel designs, being the most important logistics resource in the offshore upstream supply chain [1]. The platform supply vessels (PSVs) are the OSVs most used to perform maritime cargo transportation [2]. PSVs deliver deck cargos, such as equipment and general cargo, together with water, diesel, and different bulk cargos. Most of the delivered cargos, such as rented equipment, empty containers, and used bulk, are returned to the supply base as backlogs. PSVs can vary in capacity and size and are equipped with tanks and pumps to perform the loading and unloading operations. Skoko et al. [3] give more details about the PSV infrastructure and Queiroz and Mendes [4] highlight some challenges faced by PSV operations in Brazil. Regular on-time deliveries by the PSV fleet are of vital importance in upstream offshore logistics, ensuring that the exploration and production operations run without breakdowns. Considering their specificities, Skoko et al. [5] say that PSVs represent the most expensive resource in offshore logistics, and Skoko et al. [1] show the instability in their price and the strong correlation with the crude oil price. The major cost contribution comes from hiring a PSV, around USD 45,000 per day in 2022 [6]. The PSV fleet’s fuel consumption also adds to the costs and is the largest source of greenhouse gas emissions (GHG) in offshore oil and gas logistics. Adland et al. [7] show that, on average, a PSV consumes around 9.3 tons of diesel daily; however, this can vary depending on the type, year of construction, and size of the PSV. The consumption of diesel by a PSV emits around 28.9 tons of CO2 daily (considering a conversion rate of 3.11 from used diesel to emitted CO2 [8]).
PSV fleet management, as other vessel fleet management, includes strategic decisions such as fleet sizing and composition, planning the schedules of voyages on the tactical level, and on the operational level, assigning vessels to planned voyages, routing vessels, and selecting sailing speed. The common objectives for fleet management in maritime transportation are cost minimization caused by fleet hiring and fuel consumption and the minimization of GHG emissions. The major difference in the fleet management goal for offshore supply vessels such as PSVs is maximization in the delivery service level, while in shipping, the goal is profit maximization from sales. For PSVs, the policies on how to manage the fleet are primarily aimed at the satisfaction of mandatory installation demands in time and quantity, avoiding delays in deliveries. Nevertheless, economic considerations such as cost efficiency and the development of shipping policies addressing sustainability are equally important for the PSVs and, for example, the liner shipping fleet management [9]. In this paper, we aim to develop and analyze service-reliable, cost-efficient, and low-emission PSV fleet management policies on the operational level for the case of the largest offshore energy operator in Brazil.
The PSV fleet management in Brazil is highly challenging because of the location of the offshore installations being a long distance from the shore, in ultra-deep waters, and the produced oil being transported to land mainly by oil tankers. The research on the PSV planning conducted by the Brazilian industry researchers in cooperation with academia recently reviewed in Silva [10] emphasizes the importance and the challenges of PSV fleet management in Brazil.
The major challenge in PSV fleet management in Brazil comes from the non-consolidated spot market for PSVs due to regulatory difficulties. All offshore operators hire PSV fleets on long-term contracts from shipping companies and plan vessel activities based on the expected demands trying to minimize the hiring cost of the fleet required. In practice, planned vessel schedules are often disrupted due to multiple uncertain factors such as varying demands from installations, ad hoc deliveries, weather conditions, etc.; hence, having enough vessels available when needed is vital to ensure a high delivery service level. In other offshore operational areas, for example, on the Norwegian Continental Shelf, the spot market for PSVs facilitates hiring spot vessels in case there is a need. Maisiuk and Gribkovskaia [11] study how many long-term PSVs should be hired annually to avoid disruptions in planned deliveries caused by weather uncertainty, considering the use of the PSV spot market. Kisialiou et al. [12] present an approach for the construction of service-reliable PSV schedules under demand and weather uncertainty utilizing vessels from the spot market. Because of the absence of the PSV spot market in Brazil, the industry requires the PSV fleet management policies which can provide a high delivery service level despite various uncertainties using only long-term PSVs [13].
Another issue related to the Brazilian case is the temporal reduction in the available PSVs in a fleet due to the periodic inspection and sporadic corrective maintenance mentioned in Bittencourt et al. [14]. In the areas with the spot market, temporarily unavailable vessels can be replaced by the spot vessels. In Brazil, on the contrary, the fleet management policies should handle temporary unavailability with other long-term PSVs. Despite studies [15,16,17] showing the potential gains of considering preventive maintenance in fleet management for other vessel types, no studies have been found accounting for fleet management due to inspection and preventive maintenance for PSVs. Inspection and preventive maintenance add perturbations to PSV fleet management. Raqabi et al. [18] consider re-optimization as a key technique to deal with real perturbation in operation. Shaabani et al. [19] and Dong et al. [20] show the gains of re-optimization under uncertain operational scenarios.
There is one more derivative challenge in the operational PSV fleet management in Brazil, namely delivery due dates for installation orders. On the tactical planning level, the schedule of voyages to the predefined clusters of installations is built specifying, for each voyage, the start time, installations to serve, and estimated voyage duration. Fleet management decisions on the operational level are made prior to the start of each voyage in the schedule, when installations reveal their demands represented by the multiple delivery orders with specified cargo volumes and due dates. The delivery order due date says when installation requires the order to be delivered, reflecting its urgency. Delivery order due dates are considered in several recent Brazilian works on PSV planning and fleet management, like [10,14,21,22,23,24,25]. It is different from how installation demand is defined in the other literature on operational PSV planning, such as Mardaneh et al. [26] and Eskandari and Mahmoodi [27], where it is given by cargo volume. Delivery order due dates add complexity to the PSV operational fleet management policies as due dates influence cargo assignment to voyages and the delivery service level. An order delivered before its due date increases the delivery service level; otherwise, it decreases.
One more particularity in the Brazilian case presents multiple service time windows of various durations at installations. They happen due to PSVs waiting for other activities to be performed at installations such as helicopter visits, diving operations for the maintenance of pipelines, crude oil offloading, etc. Based on their restrictions and importance, these activities have priority over the unloading supply operations performed by the PSVs. The originality of the fleet management policies developed in this work is to allow the service at installations to be performed in more than one service time window during the same visit, reflecting real supply operations. Silva [10] and Yamashita et al. [28] also consider multiple service time windows; however, in these works, the service at installation must be finished in a single service time window.
The PSV fleet management is multi-objective with conflicting objectives. The ultimate goal of a high delivery service level may require extra vessels with a large hiring cost, while less vessels sailing fast may decrease costs but increase emissions. The trade-off between PSV planning objectives was first studied by Norlund et al. [29] for the generation of robust PSV sailing schedules. It was shown that it is possible to ensure the robustness of PSV schedules and reduce costs and emissions by applying speed optimization strategies on the scheduled PSV voyages [30,31]. Norlund et al. [29] highlighted that a 20% reduction in sailing speed may lead to a nearly 50% reduction in fuel consumption and a more than 30% reduction in fuel consumption per distance sailed, following from the cubic relation to correlating sailing speed with fuel consumption presented in Psaraftis and Kontovas [32]. Works related to maritime transportation, for example [8,33,34,35], focus on speed reduction policies to analyze cost-efficient ways to reduce emissions. To address the trade-off between the three objectives in the PSV fleet management on an operational level in Brazil, with uncertainties in the due dates of the delivery orders and vessel availability, optimal speed selection may yield improvements in the PSV fleet performance. In this paper, optimal speed selection is used as a means to improve the service level, cost efficiency, and sustainability. However, only the speed optimization on the fixed routes of the scheduled voyages may not be enough to address all the challenges in the PSV fleet management in the Brazilian case. Thus, in addition, the sequences of visits on the scheduled voyages are optimized to couple with the uncertainty of the order due dates and the uncertainty of the vessel availability, enabling a dynamic assignment of vessels and cargos to the scheduled voyages.
For the evaluation and analysis of the developed PSV fleet management policies on the long-time horizon, discrete-event simulation is selected as the most appropriate methodology due to the various uncertain factors. Many papers on offshore fleet management such as Santos et al. [36] and Kromodihardjo and Kromodihardjo [37] on rig fleets, Halvorsen-Weare et al. [38] on liquefied natural gas fleets, Raknes et al. [39] on maintenance fleets for offshore wind farms, and refs. [11,12,26,27] on PSV fleets using discrete-event simulation to evaluate their policies.
The research on PSV planning in Brazil has been increasing recently. There are some studies on PSV scheduling [13,40,41,42] and some studies on PSV routing [10,23,43]. However, there are only three studies [14,21,22] on PSV fleet management in Brazil, using a developed discrete-event simulation tool named APOLO, which is described in detail in [14]. APOLO simulates the process of the PSV fleets’ scheduled activities, such as sailing and performing services at installations according to the different fleet management policies. Vianna and Ferreira Filho [21] analyze the impact of different fleet composition strategies on the delivery service level. Vianna et al. [22] evaluate the impacts of different strategies for cargo and vessel assignment on the delivery service level, also taking backlogs into account. Bittencourt et al. [14] study the impact of different vessel assignment procedures on the delivery service level considering fleet size reduction. These studies on PSV fleet management in Brazil have limitations; namely, a single delivery service level objective, assuming voyage routes and sailing speeds are fixed in the schedule and not considering service time windows at installations.
The present work extends the line of research on PSVs fleet management using APOLO for the evaluation of fleet management policies and fills the research gaps identified by also including economic factors, accounting policies that allow the re-optimization of the sequences of visits on scheduled voyages and sailing speed, and consideration of the inspection and preventive maintenance in PSV fleet management. The innovations of this work can be summarized as follows: (i) to consider the trade-offs between delivery service level, costs, and emissions in PSV fleet management; (ii) to add perturbation in PSV fleet management caused by inspection and preventive maintenance; (iii) to dynamically re-route scheduled voyages and optimize sailing speeds to mitigate schedule disruptions caused by the temporal fleet reduction; (iv) to allow the service at installations to be performed in more than one service time window during the same visit, reflecting real supply operations.
The goal of this work is to develop several new operational PSV fleet management policies relevant to the Brazilian case, characterized by the absence of PSV spot markets and fleet management procedures used to mitigate uncertainties with the long-term hired PSV fleet, delivery orders with due dates, and the possibility of split delivery service between multiple time windows during an offshore installation visit. The research objectives are as follows: (i) to develop new, more service-reliable, cost-efficient, and sustainable PSV fleet management policies, accounting for most of the Brazilian challenges; (ii) to consider preventive and sporadic corrective vessel inspection and maintenance as an additional uncertainty factor in fleet management; (iii) to develop a procedure ensuring the required number of available vessels in the anchor area at the start of a voyage by controlling voyage duration; (iv) to allow the possibility of dynamic re-routing and/or the sailing speed selection of ongoing voyages to mitigate schedule disruptions; (v) to conduct experiments on a real case, perform a comparative analysis of fleet management policies under conflicting objectives, and discuss the reasons for the differences among the policies’ performances. Our hypotheses are expected to show the advantages of the developed policies, resulting in potential fleet and cost reduction, an increased delivery service level, decreased fuel consumption, and, hence, emissions based on introducing novel developed procedures.
The main scientific contributions of the present work include the following: (i) the introduction of several new and more service-reliable, cost-efficient, and sustainable operational PSV fleet management policies based on (a) the control of vessel availability before a scheduled voyage starts, (b) the dynamic assignment of vessels and cargos to voyages, (c) a routing procedure that selects the optimal visiting sequence and sailing speeds prior to each voyage, and (d) a dynamic re-routing procedure when there is a temporary fleet reduction due to inspection and maintenance; (ii) the development of a simulation model for the evaluation and analysis of the new PSV fleet management policies performance for a long PSV fleet operation period; (iii) the computational experiments run on the real case to analyze the advantages of the new fleet management policies.
The following section provides the details of the operational PSV fleet management in Brazil. Section 3 presents the developed PSV fleet management procedures and policies. Section 4 provides the results of the experiments conducted on the real Brazilian case for the evaluation and comparative analysis of the new fleet management policies. Finally, Section 5 concludes the work and suggests directions for future research.
2. PSV Fleet Management on an Operational Level
To better understand the problem being addressed here, this section details the main elements of the fleet management system, the decisions and the goals of PSV fleet management, and how the system works.
2.1. Elements of the Fleet Management System
All elements of the fleet management system described here have an impact on the fleet management decisions: installations, PSV fleets, schedule of the voyages, and uncertainties.
2.1.1. Installations
The offshore installations are customers in upstream offshore logistics, with demands for delivery/pickup services from/to the supply base. They are located at offshore oil and gas fields and can be up to 220 km (119 nautical miles) far from the shore and the supply base in Brazil. Usually, they are relatively close to each other, with several installations in the same area, and are grouped in clusters depending on their activities and distances. The offshore installations are divided into production and drilling units. The drilling units are responsible for drilling, completion, and workover operations. Due to their activities, the variation in demands is higher and hard to predict. The drilling units are constantly moving, increasing the planning complexity. There are several types of production units, such as fixed platforms, semi-submersible platforms, TLPs (tension leg platforms), spar platforms, and FPSO (floating, production, storage, and offloading) platforms. These have more deterministic and constant demands. A consequence of the specific characteristics of Brazilian basins is the need for a large and complex fleet of mixed-type production units. The FPSOs are commonly used as production units in Brazil, ranging in length from 310 to 370 m. Despite the size and complexity of an FPSO, the limited deck capacity is a challenge for the supply logistics operations. Figure 2 shows a drilling unit on the left and an FPSO on the right.
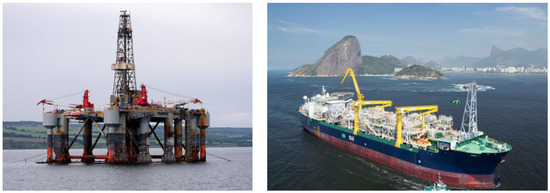
Figure 2.
Production platform Ocean Nomad [44] (reproduced with permission from David Dixon; published by Wikimedia Commons, 2016) and FPSO OSX-1 [45] (reproduced with permission from Eder Sguerri; published by Wikimedia Commons, 2011).
The installation demands represent multiple delivery orders such as deck cargos (pipes, equipment, and containers, measured by square meters or number of lifts) and bulk cargos (chemicals, diesel, and water, measured in tons or cubic meters). The installation demand for deck cargos can vary from 300 to 3000 lifts per year, and for diesel, it can vary from 1500 to 35,000 cubic meters per year. The installation demand depends on the performed operation, type, and size of the installation. Each order has a due date representing when the installation needs the order delivered to avoid delays or breakdowns.
The offshore installations require different types of operations, such as handling helicopters, subsea maintenance, production relief, loading and onloading cargos, etc. These operations are scheduled and may happen during the same day, but they cannot happen at the same time for security reasons. The loading and unloading supply operation has no priority over the other operations. Thus, the supply operation must consider these other conflicting activities in its planning, avoiding a long waiting time for the service time window opening to operate. The events that prohibit loading and unloading supply operations are as follows:
- Helicopter visits: Necessary for the crew change. They are short, and their frequency varies with the number of personnel on board.
- Subsea maintenance: In some basins in Brazil, the offshore operation happens in ultra-deep water, leading to high corrosion in the production pipelines. Thus, regular pipeline maintenance is required to avoid leaks.
- Production relief: Brazil does not have an oil pipeline system to flow the oil production from the platforms to the cost. Thus, the oil production relief is conducted by oil tankers. The frequency depends on the installation storage capacity and the daily oil production rate.
- Night closed: Some installations cannot receive supply operations during the night.
- Weather conditions: under severe weather conditions, it is not possible to perform any loading or unloading at installations.
2.1.2. PSV Fleet
The PSVs deliver cargo from the supply base to the offshore installations and are hired by the operating company from the shipping companies on long-term contracts with high daily rates. In Brazil, the PSVs have different capacities and sizes, hence charter costs, composing a heterogeneous fleet. Figure 3 shows two different PSVs. They have other compartments beyond the deck area, supplying different types of bulks and deck cargos at the same time. The PSVs can also vary in speed, ranging from 7 to 14 knots, and in the fuel consumption rate. A PSV must attend periodic inspections for safety reasons and sporadic corrective maintenance. In both cases, the PSV returns to the supply base when the maintenance or inspection ends.
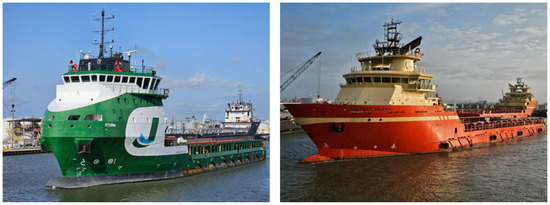
Figure 3.
PSV Storm [46] (reproduced with permission from Guava Train; published by Wikimedia Commons, 2024) and PSV Fantasy Island [47] (reproduced with permission from Guava Train; published by Wikimedia Commons, 2024).
2.1.3. Voyages
The PSV voyages have fixed schedules, sailing around two times per week, with pre-determined starts and a set of installations to serve (three to six). The voyage schedule is usually valid for a long-term period (around half a year). Due to the distances from installations to the supply base, different voyages for different clusters have different durations, from 3 to 7 days. Different voyages for the same cluster can also have different durations due to the variations in the installation demands. Figure 4 shows an example of a weekly sailing schedule for three installation clusters. The start of the voyage and the set of installations are repeated weekly, but the voyage duration can vary.
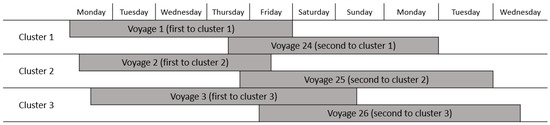
Figure 4.
Example of planned scheduled voyages [authors].
2.1.4. Uncertainties
The supply operation comprises many uncertainties, such as delivery demands (number of orders, their sizes, and due dates), service time windows (number, time in between, and durations), duration and frequency of inspections and maintenance, weather conditions, etc. Uncertainties have impacts on voyage duration, delivery service level, fleet sizing (more vessels as a buffer against uncertainties), and emissions (the efficient utilization of fleets and fuel).
2.2. PSV Fleet Management Decisions and Goals
A full understanding of which decisions in the operational fleet management are made considering the trade-off goals is vital to perceive the importance of the fleet management of PSVs.
2.2.1. Fleet Management Decisions
Fleet management decisions comprise all aspects of how to manage and control the fleet. The fleet management decisions covered in this work are (i) controlling how many vessels and their capacities will be engaged in operation and are available before each voyage start; (ii) assigning of vessels to voyages based on the available vessels and the revealed demands; (iii) assigning of cargos to voyages based on the revealed demands with volumes and due dates; (iv) deciding the sequence of visits on each voyage; (v) defining the sailing speed on each sailing leg of a voyage; (vi) how to manage the engaged fleet to suppress the temporal vessel unavailability due to inspection and maintenance.
2.2.2. Fleet Management Goals
As in any management of fleets, the goals are cost-efficiency and sustainability of the supply operations. A cost-efficient operation aims to minimize the fleet size, ensuring that there are enough vessels to handle uncertainties (in demands and availabilities). The sustainability in fleet management is summarized in the GHG emissions, directly correlated with fuel consumption, hence sailing speed. The lower the sailing speed is, the lower the fuel consumption and emissions are. The particular goal of the PSV fleet management in Brazil is the high delivery service level based on orders with due dates. The delivery service level is the fraction of orders delivered before their due dates to all delivered orders. The sailing speed decision is vital in the PSV fleet management as it provides high adaptability for fleet management, ensuring that the orders will be delivered before their due dates and mitigating the temporal reduction in the available fleet. However, it implies extra costs in fuel consumption and more emissions when increasing the sailing speed to deliver orders within due dates and to manage the available fleet. The natural trade-off between the three main goals of the PSV fleet management in Brazil (delivery service level, costs, and emissions) guides the fleet management decisions.
2.3. Fleet System Dynamics
The vessel performs voyages comprised loading and unloading at the supply base, sailing between installations and the supply base, waiting for service time windows, loading and unloading at installations, and staying at the dock for inspection or maintenance. The fleet system state is defined by vessels, installations, and a supply base with their associated data. There is a set of events changing the system state: departure from the base, arrival to the installation, the start and end of waiting for the service time window, the start and end of service at installation, the departure from installation, the arrival back to base, the start and end of inspection or maintenance at the dock, etc. While the scheduled voyages’ departures from a base are known, other unpredictable or unscheduled events happen. Deterministic system parameters are the loading rate at the base and the loading rates at installations (installation-type dependent). Stochastic system parameters are installation orders in quantities and due dates, service time windows at installations, inspection durations, and maintenance frequencies and durations. The performance of fleet management policies can be evaluated by various measures such as gain in delivery service level, fuel consumption reduction, delay in voyage starts, etc. The used measures are detailed in Section 4.1.
3. Fleet Management Procedures and Policies
Nine PSV fleet management policies are developed in this work, one based on the current policy and eight based on four new fleet management procedures.
3.1. Fleet Management Procedures
Several novel fleet management procedures are developed to cover all fleet management decisions with respect to goals.
3.1.1. Vessel Control Procedure
The vessel control procedure ensures a minimum number of available vessels in the anchor area before the start of each voyage. The procedure controls the number of available vessels by defining each voyage duration. When more available vessels before the start of each voyage are required, the voyage duration is shortened. A shorter voyage duration requires higher sailing speeds. Figure 5 presents a scheme of how the procedure works for different required minimum numbers of available vessels: (a) Vessel 1 assigned to Voyage 2 with duration d arrives before Voyage 21 starts to ensure two available vessels (Vessel 1 plus one other vessel) at Voyage 21 start; (b) Vessel 1 assigned to Voyage 2 with duration d + α arrives before Voyage 22 starts to ensure one available vessel (only Vessel 1) at Voyage 22 start; (c) Vessel 1 assigned to Voyage 2 with duration d − β arrives before Voyage 20 starts to ensure three available vessels (Vessel 1 plus two other vessels) at Voyage 20 start.
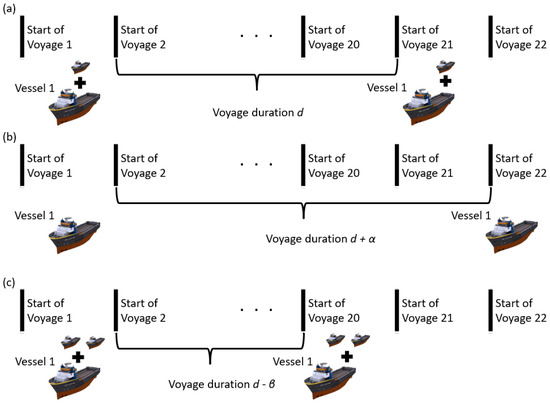
Figure 5.
Illustration of the vessel control procedure. (a) planned schedule for two available vessels. (b) planned schedule for one available vessel. (c) planned schedule for three available vessels [authors].
3.1.2. Vessel Assignment to Voyages Including Cargo Selection Procedure
The procedure assigns the vessel with a capacity for as many orders as possible while avoiding idle capacity. If a smaller vessel is assigned, it may not carry all the voyage demand, requiring the postponement of some orders and increasing the chance of delayed delivery. If a larger vessel is assigned, it may travel with idle space, wasting a valuable resource, and may cause postponed orders in the subsequent planned voyages.
The procedure assigns a vessel, among the available vessels, before the start of the voyage, maximizing the number of delivered orders as the main goal. If more than one vessel is required to deliver all the orders, the procedure minimizes the idle space, selecting the second vessel with the smallest capacity. If any available vessel has the capacity to deliver all the orders, the procedure selects the vessel with the largest capacity and prioritizes the orders with shorter due dates.
3.1.3. Vessel Routing and Speed Selection Procedure
The vessel routing and speed selection procedure is based on the solution of a mixed integer optimization model that determines the optimal visiting sequence and/or the optimal sailing speeds on a voyage, serving a pre-defined set of installations with given cargo delivery due dates and multiple service time windows while respecting the planned voyage duration. The objective function is a weighted sum of the delivery service level and fuel consumption, where weights depend on the PSV fleet management policy. The procedure is applied to optimize voyages with a small number of installations to visit, so the solutions are generated by a commercial solver in a short computational time.
The model allows the service time at installation to be split between several consecutive time windows of various durations. Performing service during one visit in many time windows of small durations and long waiting times between them may substantially increase voyage duration, affecting overall efficiency in terms of delivery service level, costs, and emissions.
3.1.4. Dynamic Voyage Re-Routing Procedure
The dynamic voyage re-routing procedure re-routes voyages when a disruption such as temporary fleet reduction happens due to inspection and/or maintenance. The procedure re-routes the ongoing voyages that end before the return of the vessel under inspection and/or maintenance. Each re-routed voyage has a new and shorter voyage duration, ensuring the pre-defined minimum of available vessels before the start of the following voyages. The dynamic re-routing procedure can select new optimal visiting sequences of installations and/or new optimal sailing speeds considering the new voyage duration.
Figure 6a presents the initial schedule for Voyages 2, 3, and 4. Vessel 1 was assigned to Voyage 2 with duration d2, arriving before the start of Voyage 21. Vessel 2 was assigned to Voyage 3 with duration d3, arriving before the start of Voyage 22. Vessel 3 was assigned to Voyage 4 with duration d4, arriving before the start of Voyage 23. Figure 6b presents the modified Voyages 3 and 4 for the case when Vessel 1 needs inspection or maintenance and becomes unavailable before the start of Voyage 21. Voyage 3 is then re-optimized with shorter voyage duration d3 − α, ensuring Vessel 2 arrives before the start of Voyage 21. Voyage 4 is re-optimized with shorter voyage duration d4 − β, ensuring Vessel 3 arrives before the start of Voyage 22.
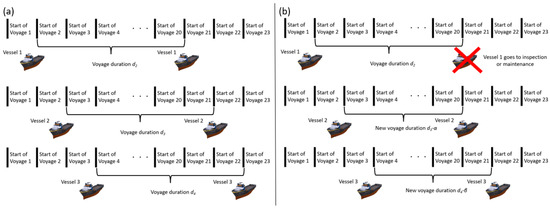
Figure 6.
Illustration of the dynamic re-routing procedure. (a) initial planned schedule. (b) new planned schedule generated by the re-routing procedure [authors].
3.2. Fleet Management Policies
The Base policy extends the policy of Bittencourt et al. [14] by adding service time windows at installations and is used for comparisons. All new policies execute vessel assignment to voyages including cargo selection, dynamic voyage re-routing, and vessel control procedures, consecutively, voyage after voyage, during the evolution of the system. Some policies execute vessel routing and speed selection procedures simultaneously, selecting the optimal route and sailing speed (RS), while other policies select the optimal route with a fixed sailing speed (R) or select an optimal sailing speed with a fixed route (S). The minimum number of available vessels in the anchor area before the start of each voyage is defined a priori as the input parameter of the vessel control procedure. Different values for this parameter differentiate the policies, as explained in Section 3.1.1. Two different goals for fleet management policies are considered:
- Delivery Service Level (DSL): The maximization of each voyage delivery service level together with fuel consumption reduction. However, fuel consumption reduction is not allowed if it results in delivery service level reduction.
- Fuel Consumption (FC): The minimization of fuel consumption while ensuring a required cumulative delivery service level for voyages performed under the current system state. A reduction in fuel consumption is allowed if the cumulative delivery service level is above the minimum required.
All policies with their names are presented in Table 1.

Table 1.
Fleet management policies.
4. Analysis of the Fleet Management Policies
The advances in APOLO, APOLO itself, and the fleet management procedures are implemented in Python 3.8, with parameters imported from a spreadsheet. To solve the optimization model (vessel routing and speed selection procedure), Gurobi 8.0 is used. All tests are run on an Intel Xeon CPU E5-2620 v4 @ 2.10 GHz with two processors, 256 GB of RAM, and a Windows Server operating system.
4.1. Case Description
We tested the fleet management policies on a real case from the largest Brazilian energy company operating in the Espírito Santo and Campos basins along the Espírito Santo and Rio de Janeiro coasts. The test case has 90 offshore installations (drilling and production units) divided into 23 predefined clusters with 3–6 installations. A heterogeneous fleet of 28 PSVs serves each cluster two times per week with voyage departures evenly spread, totaling 46 voyages per week. All tests considered 90 days of warm-up plus 180 days of simulation, with 30 replications. Each replication has 1183 voyages delivering around 70,000 orders. For the development and analysis of the new fleet management policies, the APOLO tool was advanced by incorporating the new fleet management procedures from Section 3.1, working as an optimization-embedded simulation tool as defined by Zhou et al. [48]. The same entities, locations, and resources that composed the Base policy in APOLO, validated by the company experts, are detailed in Bittencourt et al. [14].
Key performance indicators (KPIs) are essential to evaluate policies, providing planners’ tools for the best decisions. We present four KPIs where (1) and (2) have a higher importance for the energy company goals to ensure the delivery service level and reduce costs and emissions, while (3) and (4) measure the impact of demands and no-availability uncertainties in demands and the non-availability of vessels at the voyage start’s reliability:
- Gain in delivery service level: The gain above the minimum required delivery service level. We considered the minimum required delivery service level to be 98%, the same as the Base policy.
- Reduction in fuel consumption: Fuel consumption reduction in percentage. The fuel consumption base to calculate a reduction is the fuel consumption in Base policy.
- Number of delayed voyages: A number of voyages did not start at the planned schedule time due to a lack of available vessels.
- Total hours of delays: Total hours delayed in the planned schedule time due to a lack of available vessels.
4.2. Presentation and Analysis of Results
In this section, we present the results of the comparative analysis of policies, showing the impact of the vessel control procedure and vessel routing and speed selection procedures on KPIs. Table A1 in Appendix A presents the 95% confidence interval for the four KPIs for all policies.
4.2.1. Vessel Routing and Speed Selection Procedure Impacts
We compare RS/FC/1, RS/DSL/1, S/DSL/1, and R/DSL/1 policies with the Base policy for one available vessel to show the impact of vessel routing and speed selection on performance. The results are visualized in Figure 7. All policies improve the indicators compared to the Base policy. R/DSL/1 yields a high delivery service level, providing good reliability for subsequent voyages. However, it gives the lowest fuel consumption reduction. S/DSL/1 provides a good fuel consumption reduction, while the delivery service level and the delays are near Base policy. Simultaneous routing and speed selection for both objectives (RS/DSL/1 and RS/FC/1) yield the best results in fuel consumption reduction and avoid more voyage delays than Base and S/DSL/1. The different goals have similar performances for other indicators.
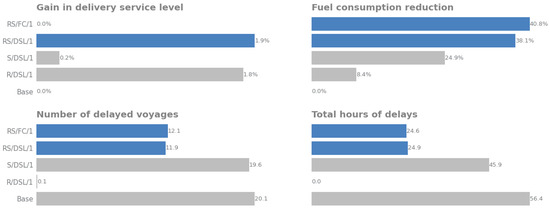
Figure 7.
Vessel routing and speed selection procedure results. The blue chart emphasizes routing and speed optimization (RS) policies and grey the other policies [authors].
The results indicate that routing optimization by itself is enough to increase the delivery service level, allowing the better management of the delivery of priority orders at the same time as decreasing lost time in non-service time windows. The speed selection by itself is not enough to increase the delivery service level, considering that it cannot prioritize orders; however, it can significantly decrease the fuel consumption by better managing the sailing speed to avoid non-service time windows or reduce the waiting time to a service time window and meet the desired voyage duration. When optimizing routing and speed, the best of each is added together. It is possible to prioritize the orders simultaneously to manage the sailing speed better. The different goals of the DSL and FC work as expected. In contrast, the DSL goal prioritizes any order delivered on time over fuel consumption reduction, reaching a higher delivery service level. The FC goal prioritizes the reduction in fuel consumption when the minimum delivery service level is reached. The FC goal allows some orders to be delivered late if the fuel consumption cost to deliver on time is too high, hence achieving a higher reduction in fuel consumption.
The two KPIs related to delays for only the routing policy show that this policy can achieve almost no delays. This performance is due to the fact that the policy uses a pre-defined sailing speed, which can produce a shorter voyage duration than the desired one. While this behavior is unsuitable for saving fuel consumption costs, it ensures that the vessel will be at the harbor as soon as possible. When a speed selection is applied, the desired voyage duration is used as the upper bound to reduce the sailing speed and, hence, the fuel consumption. While this behavior is good for saving costs related to fuel consumption, it increases the chances of the vessels not being available when a fleet reduction happens. The dynamic re-routing procedure mitigates these delays, but it is not enough to avoid delays when the minimum number of available vessels is defined as one.
4.2.2. Vessel Control Procedure Impacts
We evaluated all policies with different numbers of available vessels in the vessel control procedure, considering vessel routing and speed selection for both goals, presented in Figure 8. Pareto’s dominance concept shows that the Base policy is dominated by all other considered policies. The policy with only speed selection (S/DSL/1) is dominated by policies RS/FC/3, RS/DSL/1, RS/DSL/2, and RS/DSL/3. The policy with only routing (R/DSL/1) is dominated by policy RS/DSL/3.
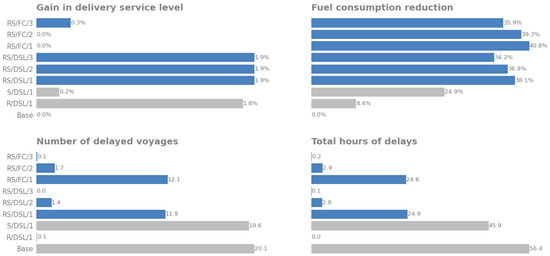
Figure 8.
Vessel control procedure results. The blue chart emphasizes routing and speed optimization (RS) policies and grey the other policies [authors].
Variations in the minimum number of available vessels in the anchor area before the start of the voyage strongly impact the KPIs. Figure 8 shows that more available vessels do not translate into higher delivery service levels for policies with DSL goals. This is because they reached a 99.9% delivery service level, leaving little room for improvement. For policy RS/FC/3, the number of available vessels indirectly impacts the delivery service level due to respecting voyage duration. In addition, the policy of vessel assignment to voyages, including the cargo selection procedure (Section 3.1.2), has more vessel options to choose from, collaborating to increase the service level. The shorter-time average voyage duration of this policy may require a higher sailing speed, leading to more orders being delivered on time than the minimum required despite the high fuel consumption cost. When comparing policies with the same goal, routing optimization, and speed selection, a higher number of available vessels has an expected increase in fuel consumption. This is caused by shorter-time voyages defined by vessel control procedures when increasing the number of available vessels. Shorter-time voyages may demand an increase in sailing speed, increasing fuel consumption.
There is a substantial improvement in both KPIs related to delays when comparing policies with one and two available vessels. In policies with three available vessels, the delays are almost eliminated. This performance in KPIs related to delays is expected. One additional vessel in the anchor area at the start of the voyage may help to satisfy the planned schedule of the voyage when periodic inspection or sporadic corrective maintenance happens. If an unscheduled periodic inspection or sporadic corrective maintenance happens, an available vessel becomes temporarily unavailable; more expected available vessels in the anchor area before the start of the voyage can deal with it, as most likely, at least one vessel will be in the anchor area available to start the voyage on time. This analysis is valid for both goals.
As there is no dominance between the policies with simultaneous routing and speed selection, it would be necessary to analyze the trade-off between fuel consumption and delivery service level to answer the question: How much does one pay for fuel consumption to achieve a desirable service level? Production installations with higher oil production rates prioritize the delivery service level as the main goal, as the breakdown cost is high [29]. In contrast, production installations with lower oil production rates (income) are more concerned with costs. When considering drilling installations, the high daily rent cost and the possible production loss of new or recovered wells tend to prioritize the delivery service level as the main goal. The broad spectrum of developed policies allows decision-makers to choose the best policy for their goals.
4.3. Impact on Fleet Size and Cost/Emission Reductions
The fleet size is not determined directly by the fleet management policies; however, it is possible to analyze the potential fleet reduction with the policies. Different sizes of fleets are tested for each policy. The fleet reduction analysis is performed under the premise that Base policy KPIs are desirable; thus, a fleet reduction is only accepted if all KPIs are better or equivalent to the Base policy with the given fleet.
Figure 9 shows the potential fleet reduction obtained for each policy. The fleet reduction for RS/DSL and RS/FC policies with two and three available vessels is significant (four and five, respectively). R/DSL/1 yields a potential reduction of three vessels. RS/DSL/1 has a potential reduction of one vessel. S/DSL/1 and RS/FC/1 do not provide potential fleet reductions. The required KPIs related to voyage delays are a limitation for further fleet reductions for all policies. If more delayed voyages are allowed, the fleet size can be further reduced while keeping the desirable delivery service level and fuel consumption.
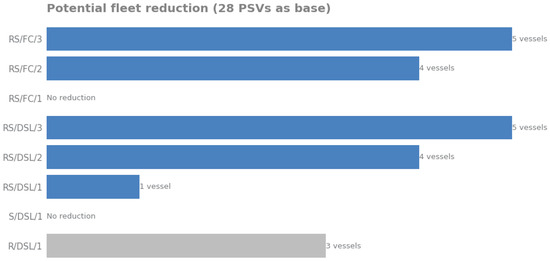
Figure 9.
Potential fleet reduction results. The blue chart emphasizes routing and speed optimization (RS) policies and grey the other policies [authors].
Table 2 shows the potential reduction in the vessel hiring and fuel costs for the lowest fleet size for each policy compared with the Base policy. The greenhouse gas emissions are assumed proportional to the fuel consumption; thus, the potential reduction in greenhouse gas emissions is the same as the potential fuel cost reduction. Table A1 in Appendix A presents the 95% confidence interval for the four KPIs for the reduced fleet.
Table 2.
Potential economic impact of the fleet management policies.
5. Conclusions and Future Work
The goals of offshore energy operators are to ensure the delivery service level for offshore installations and to reduce costs and emissions from the PSV fleet. The PSV fleet management in Brazil is challenging due to its particularities, such as the non-availability of the PSV spot market, a temporary reduction in the hired fleet due to inspection and/or maintenance, delivery orders with due dates, short and multiple service time windows at installations, etc. To deal with these challenges, we developed four PSV fleet management procedures: vessel control; vessel assignment to voyages, including cargo selection; vessel routing and speed selection; and dynamic voyage re-routing. Nine fleet management policies were created by incorporating these procedures into different configurations with delivery service level and fuel consumption goals to analyze the trade-offs between delivery service level, costs, and emissions. We tested the policies using a discrete-event simulation tool on a real case in the Espírito Santo and Campos basins with 90 offshore installations and 28 PSVs.
The experiments on a real case show that the developed PSV fleet management policies can ensure a higher delivery service level, lower fuel consumption, hence greenhouse gas emissions, and a potential fleet size reduction compared with the Base policy. The Base policy is worse or equal in all KPIs than all developed policies.
The eight newly developed PSV fleet management policies (excluding the Base policy) have different impacts on the KPIs and thus enable fleet managers to select the appropriate policy considering the trade-offs between delivery service level, costs, and emissions, depending on the offshore operator’s goals. Suppose a high delivery service level is desired, the policies with a delivery service level (DSL) goal, simultaneously selecting an optimal route and sailing speed (RS), and considering more available vessels are the best option. If low cost is desired, the policies with a fuel consumption (FC) goal, simultaneously selecting an optimal route and sailing speed (RS), and considering less available vessels are the best options. If starting voyages at the scheduled time is desired, the policies that simultaneously select the optimal route and sailing speed (RS) or only select optimal routes (R) and consider more available vessels are the best option.
The developed fleet management policies we have proposed allow decision-makers to select policies with different trade-offs between delivery service level, fleet and fuel consumption costs, and emissions. The simulation tool provides the possibility to estimate the potential economic impact, including fleet size reduction and potential cost reduction utilizing fleet management policies for real industry cases. The tool with incorporated fleet management policies can be easily adopted and implemented by the industry in Brazil and other countries with non-consolidated PSV spot markets. It offers offshore operating companies a decision support tool for PSV fleet management, providing various possibilities for achieving financial gains while reducing GHG emissions.
However, there are limitations in this study that need further improvement. The uncertainty arising from weather was not considered, even though it could affect the loading time at offshore installations and the sailing speed. Considering weather uncertainties in fleet management policies is a necessary topic for future research. A regression or correlation analysis could be a valuable addition to this study to better quantify the impact of increasing the number of available vessels at the start of voyages on the policies’ performance. Other directions for future research include routing and speed selection optimization model extensions by adding more parameters and routing options common in real operations and testing different solution techniques to deal with the multiple objectives and KPIs considered.
Author Contributions
Formal analysis, I.G.P.V. and P.C.R.; funding acquisition, I.G. and P.C.R.; investigation, I.G.P.V.; methodology, I.G.P.V. and P.C.R.; project administration, V.J.M.F.F.; resources, V.J.M.F.F.; software, I.G.P.V.; supervision, P.C.R., I.G. and V.J.M.F.F.; validation, I.G.P.V. and P.C.R.; visualization, I.G.P.V.; writing—original draft, I.G.P.V.; writing—review and editing, I.G.P.V., P.C.R., I.G. and V.J.M.F.F. All authors have read and agreed to the published version of the manuscript.
Funding
This research was funded by the National Council for Scientific and Technological Development—CNPq; Petrobras—Petróleo Brasileiro S.A.; FAPERJ, grant number E-26/210.621/2019; Norwegian–Brazilian cooperation in oil, gas, and renewable energy logistics project supported by Norwegian Directorate for Higher Education and Skills, grant number UTFORSK/10075 (2017–2023) and The APC was funded by Molde University College.
Data Availability Statement
The original contributions presented in this study are included in the article. Further inquiries can be directed at the corresponding author.
Acknowledgments
Thanks are due to the referees for their valuable comments.
Conflicts of Interest
The authors declare no conflicts of interest.
Abbreviations
The following abbreviations are used in this manuscript:
| OSV | Offshore Supply Vessel |
| PSV | Platform Supply Vessel |
| GHG | Greenhouse Gas |
| TLP | Tension Leg Platform |
| FPSO | Floating Production Storage and Offloading Platform |
| RS | Routing and Speed Optimization |
| R | Routing Optimization |
| S | Speed Optimization |
| DSL | Delivery Service Level |
| FC | Fuel Consumption |
| KPI | Key Performance Indicator |
| CO2 | Carbon Dioxide |
Appendix A
Table A1.
All KPI results with a 95% confidence interval.
Table A1.
All KPI results with a 95% confidence interval.
| Policy | Fleet Size | Gain in Delivery Service Level | Reduction in Fuel Consumption | Number of Delayed Voyages | Total Hours of Delays |
|---|---|---|---|---|---|
| Base | 28 | 0 ± 0.03% | 0 ± 0.19% | 20.1 ± 5.2 | 56.36 ± 17.7 |
| R/DSL/1 | 28 | 1.85 ± 0.01% | 8.39 ± 0.21% | 0.07 ± 0.09 | 0.05 ± 0.07 |
| R/DSL/1 | 25 | 1.64 ± 0.05% | 12.38 ± 0.18% | 14 ± 4.86 | 39.96 ± 18.54 |
| S/DSL/1 | 28 | 0.23 ± 0.08% | 24.85 ± 0.43% | 19.57 ± 3.93 | 45.9 ± 12.47 |
| RS/DSL/1 | 28 | 1.88 ± 0.02% | 38.11 ± 0.21% | 11.93 ± 2.79 | 24.92 ± 6.98 |
| RS/DSL/1 | 27 | 1.78 ± 0.04% | 37.37 ± 0.39% | 18.57 ± 3.66 | 37.64 ± 9.7 |
| RS/DSL/2 | 28 | 1.92 ± 0.01% | 36.8 ± 0.3% | 1.43 ± 0.8 | 2.85 ± 2.2 |
| RS/DSL/2 | 24 | 1.39 ± 0.2% | 26.24 ± 1.05% | 11.37 ± 3.02 | 25.75 ± 8.3 |
| RS/DSL/3 | 28 | 1.94 ± 0.01% | 34.15 ± 0.3% | 0.03 ± 0.07 | 0.09 ± 0.19 |
| RS/DSL/3 | 23 | 1.8 ± 0.02% | 11.94 ± 1.04% | 14.7 ± 3.9 | 45.99 ± 15.78 |
| RS/FC/1 | 28 | 0.01 ± 0.01% | 40.81 ± 0.3% | 12.13 ± 2.33 | 24.65 ± 6.16 |
| RS/FC/2 | 28 | 0.04 ± 0.01% | 39.32 ± 0.35% | 1.7 ± 0.69 | 2.89 ± 1.75 |
| RS/FC/2 | 24 | 0.31 ± 0.12% | 27.32 ± 0.93% | 12.43 ± 2.38 | 27.83 ± 7.92 |
| RS/FC/3 | 28 | 0.32 ± 0.05% | 35.91 ± 0.51% | 0.13 ± 0.17 | 0.18 ± 0.27 |
| RS/FC/3 | 23 | 1.27 ± 0.03% | 12.71 ± 0.91% | 14.2 ± 4.31 | 42.94 ± 16.33 |
References
- Skoko, I.; Lušić, Z.; Pušić, D. Commercial and strategic aspects of the offshore vessels market. Zesz. Nauk. Akad. Morskiej Szczecinie 2020, 62, 18–25. [Google Scholar] [CrossRef]
- Aas, B.; Halskau, Ø.; Wallace, S.W. The role of supply vessels in offshore logistics. Marit. Econ. Logist. 2009, 11, 302–325. [Google Scholar] [CrossRef]
- Skoko, I.; Lušić, Z.; Sanchez-Varela, Z.; Boko, Z. Optimization model for selection of the offshore fleet structure. J. Mar. Sci. Eng. 2024, 12, 263. [Google Scholar] [CrossRef]
- Queiroz, M.M.; Mendes, A.B. Critical success factors of the Brazilian offshore support vessel industry: A flexible systems approach. Glob. J. Flex. Syst. Manag. 2020, 21, 33–48. [Google Scholar] [CrossRef]
- Skoko, I.; Jurčević, M.; Božić, D. Logistics aspect of offshore support vessels on the west Africa market. Pro.-Traf. Trans. 2013, 25, 587–593. [Google Scholar] [CrossRef]
- The Rising Cost of Labor in the Offshore Supply Vessels (OSV) Industry. Available online: https://www.spglobal.com/commodityinsights/en/ci/research-analysis/the-rising-cost-of-labor-in-the-offshore-supply-vessels-osv-in.html (accessed on 14 January 2025).
- Adland, R.; Cariou, P.; Wolff, F.C. When energy efficiency is secondary: The case of Offshore Support Vessels. Trans. Res. Part D Trans. Environ. 2019, 72, 114–126. [Google Scholar] [CrossRef]
- Psaraftis, H.N. Speed optimization versus speed reduction: Are speed limits better than a bunker levy? Marit. Econ. Logist. 2019, 21, 524–542. [Google Scholar] [CrossRef]
- Vejvar, M.; Lai, K.-H.; Lo, C.K.Y. A citation network analysis of sustainability development in liner shipping management: A review of the literature and policy implications. Marit. Policy Manag. 2019, 47, 1–26. [Google Scholar] [CrossRef]
- Silva, V.A. Deterministic and Stochastic Modeling for Planning of Platform Supply Vessels Operations in Offshore Oil and Gas Logistics. Ph.D. Thesis, Federal University of Rio de Janeiro, Rio de Janeiro, Brazil, 2023. [Google Scholar]
- Maisiuk, Y.; Gribkovskaia, I. Fleet sizing for offshore supply vessels with stochastic sailing and service times. Proc. Comp. Sci. 2014, 31, 939–948. [Google Scholar] [CrossRef]
- Kisialiou, Y.; Gribkovskaia, I.; Laporte, G. Periodic supply vessel planning under demand and weather uncertainty. INFOR 2021, 59, 411–438. [Google Scholar] [CrossRef]
- Cruz, R.; Mendes, A.B.; Bahiense, L. Schedule robustness in the periodic supply vessels planning problem with stochastic demand and travel time. Int. Tran. Oper. Res. 2024, 31, 2338–2365. [Google Scholar] [CrossRef]
- Bittencourt, G.C.; Chagas, R.D.S.; Silva, V.A.; Vianna, I.G.P.; Longhi, R.P.; Ribas, P.C.; Filho, V.J.M.F. A solution framework for the integrated problem of cargo assignment, fleet sizing, and delivery planning in offshore logistics. Comp. Ind. Eng. 2021, 161, 107653. [Google Scholar] [CrossRef]
- Evazabadian, F.; Arvan, M.; Ghodsi, R. Short-term crude oil scheduling with preventive maintenance operations: A fuzzy stochastic programming approach. Int. Trans. Oper. Res. 2019, 26, 2450–2475. [Google Scholar] [CrossRef]
- Panda, D.; Ramteke, M. Dynamic hybrid scheduling of crude oil using structure adapted genetic algorithm for uncertainty of tank unavailability. Chem. Eng. Res. Des. 2020, 159, 78–91. [Google Scholar] [CrossRef]
- Hou, Y.; Zhang, Y.; Wu, N.; Zhu, Q. Constrained multi-objective optimization of short-term crude oil scheduling with dual pipelines and charging tank maintenance requirement. Inf. Sci. 2022, 588, 381–404. [Google Scholar] [CrossRef]
- Er Raqabi, E.M.; Wu, Y.; El Hallaoui, I.; Soumis, F. Towards resilience: Primal large-scale re-optimization. Transp. Res. Part E Logist. Transp. Rev. 2024, 192, 103819. [Google Scholar] [CrossRef]
- Shaabani, H.; Hvattum, L.M.; Laporte, G.; Hoff, A. Stability metrics for a maritime inventory routing problem under sailing time uncertainty. EURO J. Transp. Logist. 2024, 13, 100146. [Google Scholar] [CrossRef]
- Dong, Y.; Maravelias, C.T.; Jerome, N.F. Reoptimization framework and policy analysis for maritime inventory routing under uncertainty. Opt. Eng. 2018, 19, 937–976. [Google Scholar] [CrossRef]
- Vianna, I.G.P.; Filho, V.J.M.F. Fleet reduction policies analysis using heuristic and discrete-event simulation. In Proceedings of the LI Simpósio Brasileiro de Pesquisa Operacional, Limeira, Brazil, 2–6 September 2019; Available online: https://proceedings.science/sbpo/sbpo-2019/trabalhos/analise-de-diferentes-politicas-de-reducao-da-frota-com-o-uso-de-heuristica-e-si?lang=pt-br (accessed on 14 February 2025).
- Vianna, I.G.P.; Ribas, P.C.; Filho, V.J.M.F. Analysis of strategies to solve the pick-up and delivery problem with fixed routes and heterogeneous fleet. In Proceedings of the LII—Simpósio Brasileiro de Pesquisa Operacional, João Pessoa, Brazil, 3–5 November 2020; Available online: https://proceedings.science/sbpo/sbpo-2020/trabalhos/analise-de-diferentes-estrategias-para-o-problema-de-coleta-e-entrega-com-rotas?lang=pt-br (accessed on 14 February 2025).
- Chagas, R.D.S.; Filho, V.J.M.F. Relax-and-fix heuristics for the multi-commodity psv planning problem with order selection and time window decisions. Comp. Ind. Eng. 2023, 177, 109040. [Google Scholar] [CrossRef]
- Ribeiro, L.S. An approximated dynamic programming model for the supply vessel fleet sizing problem. Comp. Oper. Res. 2024, 163, 106510. [Google Scholar] [CrossRef]
- Seixas, M.P.; Mendes, A.B.; Barretto, M.R.P.; Cunha, C.B.; Brinati, M.A.; Cruz, R.E.; Wu, Y.; Wilson, P.A. A heuristic approach to stowing general cargo into platform supply vessels. J. Oper. Res. Soc. 2015, 67, 148–158. [Google Scholar] [CrossRef]
- Mardaneh, E.; Lin, Q.; Loxton, R.; Wilson, N. Cargo scheduling decision support for offshore oil and gas production: A case study. Opt. Eng. 2017, 18, 991–1008. [Google Scholar] [CrossRef]
- Eskandari, H.; Mahmoodi, E. A simulation-based multi-objective optimization study of the fleet sizing problem in the offshore industry. Marit. Econ. Logist. 2016, 18, 436–457. [Google Scholar] [CrossRef]
- Yamashita, D.; da Silva, B.J.V.; Morabito, R.; Ribas, P.C. A multi-start heuristic for the ship routing and scheduling of an oil company. Comp. Ind. Eng. 2019, 136, 464–476. [Google Scholar] [CrossRef]
- Norlund, E.K.; Gribkovskaia, I.; Laporte, G. Supply vessel planning under cost, environment and robustness considerations. Omega 2015, 57, 271–281. [Google Scholar] [CrossRef]
- Norlund, E.K.; Gribkovskaia, I. Reducing emissions through speed optimization in supply vessel operations. Trans. Res. Part D Trans. Environ. 2013, 23, 105–113. [Google Scholar] [CrossRef]
- Ulsrud, K.P.; Vandvik, A.H.; Ormevik, A.B.; Fagerholt, K.; Meisel, F. A time-dependent vessel routing problem with speed optimization. Eur. J. Oper. Res. 2022, 303, 891–907. [Google Scholar] [CrossRef]
- Psaraftis, H.N.; Kontovas, C.A. Speed models for energy-efficient maritime transportation: A taxonomy and survey. Trans. Res. Part C Emerg. Technol. 2013, 26, 331–351. [Google Scholar] [CrossRef]
- Pereda, P.C.; Lucchesi, A. Alternative frameworks for cost-effectiveness analysis of environmental policies in maritime transport. Marit. Econ. Logist. 2022, 24, 630–650. [Google Scholar] [CrossRef]
- Castro, P.M. Maritime inventory routing with speed optimization: A MIQCP formulation for a tanker fleet ser-vicing FPSO units. Comp. Chem. Eng. 2025, 192, 108889. [Google Scholar] [CrossRef]
- Hua, R.; Yin, J.; Wang, S.; Han, Y.; Wang, X. Speed optimization for maximizing the ship’s economic benefits considering the Carbon Intensity Indicator (CII). Ocean Eng. 2024, 293, 116712. [Google Scholar] [CrossRef]
- Santos, I.M.; Hamacher, S.; Oliveira, F. A data-driven optimization model for the workover rig scheduling problem: Case study in an oil company. Comp. Chem. Eng. 2023, 170, 108088. [Google Scholar] [CrossRef]
- Kromodihardjo, S.; Kromodihardjo, E.S. Modeling of well service and workover to optimize scheduling of oil well maintenance. Appl. Mech. Mater. 2016, 836, 311–316. [Google Scholar] [CrossRef]
- Halvorsen-Weare, E.E.; Fagerholt, K.; Rönnqvist, M. Vessel routing and scheduling under uncertainty in the liquefied natural gas business. Comp. Ind. Eng. 2013, 64, 290–301. [Google Scholar] [CrossRef]
- Raknes, N.T.; Ødeskaug, K.; Stålhane, M.; Hvattum, L.M. Scheduling of maintenance tasks and routing of a joint vessel fleet for multiple offshore wind farms. J. Mar. Sci. Eng. 2017, 5, 11. [Google Scholar] [CrossRef]
- Cunha, V.; Santos, I.M.; Pessoa, L.; Hamacher, S. An ILS heuristic for the ship scheduling problem: Application in the oil industry. Int. Trans. Oper. Res. 2020, 27, 197–218. [Google Scholar] [CrossRef]
- Vieira, B.S.; Ribeiro, G.M.; Bahiense, L.; Cruz, R.; Mendes, A.B.; Laporte, G. Exact and heuristic algorithms for the fleet composition and periodic routing problem of offshore supply vessels with berth allocation decisions. Eur. J. Oper. Res. 2021, 295, 908–923. [Google Scholar] [CrossRef]
- Cruz, R.; Mendes, A.B.; Bahiense, L.; Wu, Y. Integrating berth allocation decisions in a fleet composition and periodic routing problem of platform supply vessels. Eur. J. Oper. Res. 2019, 275, 334–346. [Google Scholar] [CrossRef]
- Pinto, G.L.; Vitorugo, L.R.; Rosa, R.A.; Arpini, B.P.; Caprini, L.A. Planning the transport of loads to oil platforms considering the arrangement of the loads on the ship’s deck. Comput. Ind. Eng. 2018, 119, 289–300. [Google Scholar] [CrossRef]
- Offshore Rig Ocean Nomad in Cromarty Firth. Available online: https://www.geograph.org.uk/photo/5100335 (accessed on 14 February 2025).
- File:FPSO OSX-1.jpg. Available online: https://commons.wikimedia.org/wiki/File:FPSO_OSX-1.jpg (accessed on 14 February 2025).
- File:OSV Storm.jpg. Available online: https://commons.wikimedia.org/wiki/File:OSV_Storm.jpg (accessed on 14 February 2025).
- File:OSV Fantasy Island.jpg. Available online: https://commons.wikimedia.org/wiki/File:OSV_Fantasy_Island.jpg (accessed on 14 February 2025).
- Zhou, C.; Ma, N.; Cao, X.; Lee, L.H.; Chew, E.P. Classification and literature review on the integration of simulation and optimization in maritime logistics studies. IISE Trans. 2021, 53, 1157–1176. [Google Scholar] [CrossRef]


Disclaimer/Publisher’s Note: The statements, opinions and data contained in all publications are solely those of the individual author(s) and contributor(s) and not of MDPI and/or the editor(s). MDPI and/or the editor(s) disclaim responsibility for any injury to people or property resulting from any ideas, methods, instructions or products referred to in the content. |
© 2025 by the authors. Licensee MDPI, Basel, Switzerland. This article is an open access article distributed under the terms and conditions of the Creative Commons Attribution (CC BY) license (https://creativecommons.org/licenses/by/4.0/).