Abstract
Floating Offshore Wind Turbines (FOWTs) are gaining traction as a solution for harnessing wind energy in deepwater regions where traditional fixed-bottom turbines may not be viable due to water depth. This paper investigates the feasibility and optimization of a floating wind farm in a tropical cyclone (typhoon) region, using the IEA 15 MW turbine and semi-submersible floaters. Because of the extreme environment, the FOWT’s mooring system requires nine catenary chains in a 3 × 3 pattern, which has a large footprint. One challenge in the wind farm design is fitting the FOWTs in a limited area and minimizing wake effects. This research compares a linear layout and an offset grid layout, focusing on the effects of spacing and wake dynamics. The results show that while the linear layout maintains optimal power generation without energy loss, the offset grid layout, although resulting in 2% energy loss, offers greater spatial efficiency for larger-scale projects. The findings highlight the importance of balancing energy efficiency with spatial optimization, particularly for large offshore wind farms. This study explores the use of the Gauss–Curl hybrid model in wake modeling, and the methodology employed provides insights into FOWT placement and mooring system arrangement. The result concludes that a wind farm containing twelve (12) units of 15 MW wind turbines can achieve the 7.0 MW/km2 power generation density required by a regulatory government agency. It proves the technical feasibility of a wind farm congested with large mooring systems in a tropical cyclone region.
1. Introduction
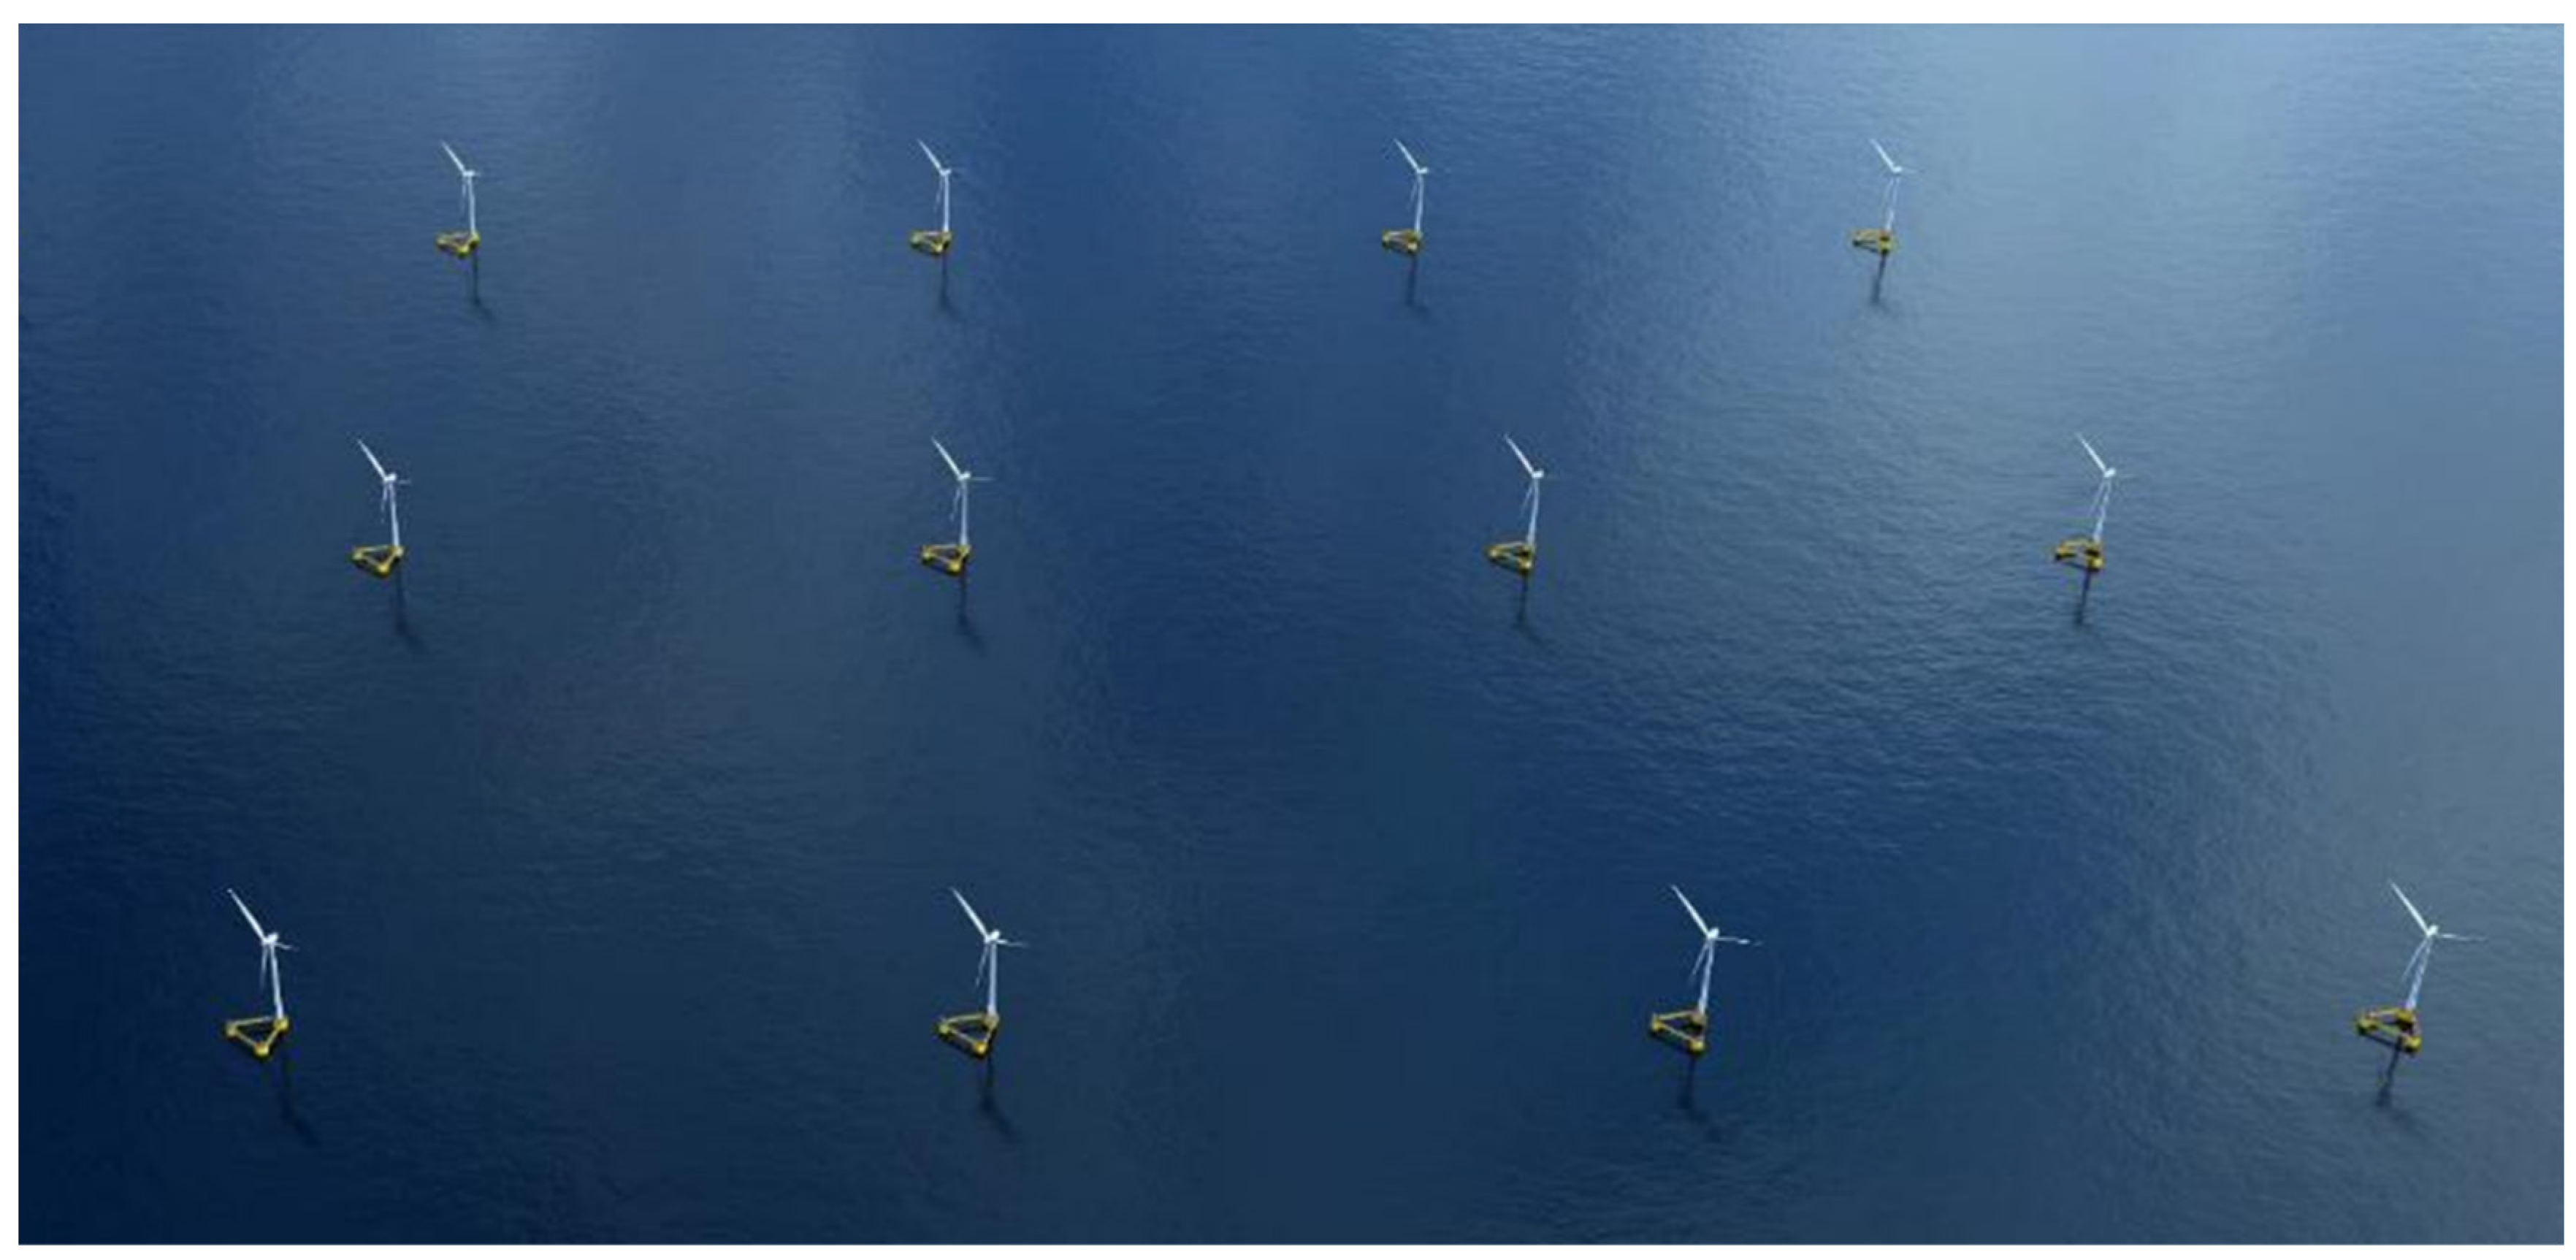
This paper conducts research to analyze wind farm layouts for Floating Offshore Wind Turbines (FOWTs). FOWTs offer advantages over onshore fixed-bottom turbines, including more available areas with minimal visual and acoustic impact, higher wind speeds due to smoother sites, and increased energy production from larger turbines [1]. In deepwater, wind turbines can be hosted by floating foundations with a mooring system. Design parameters for the mooring system such as anchor radius and mooring pattern determine the footprint acreage needed for each FOWT [2]. The mooring system for regions with tropical cyclones is expected to use a 3 × 3 mooring pattern with large-diameter chains due to the extreme wind condition [3]. As the 3 × 3 mooring system can take up a large amount of (footprint) acreage, the goal is to efficiently accommodate as many FOWTs as possible in a limited area, as shown in Figure 1. With an optimal wind farm design, it is to determine if a regulatory requirement of 7.0 MW/km2 power generation density can be achieved.
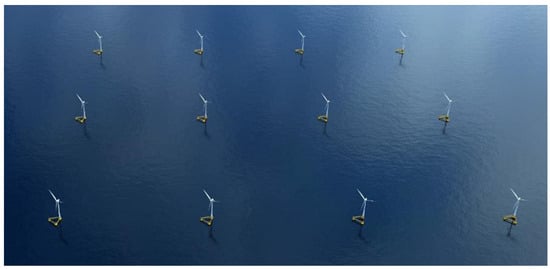
Figure 1.
Computer rendering of a wind farm containing twelve units of 15 MW FOWTs.
FOWTs are essential for harnessing wind energy in deepwater, where fixed-bottom structures are impractical when water depths exceed approximately 65 m. As highlighted by Alkarem et al. [4], one of the primary advantages of FOWTs lies in their ability to operate in deepwater regions with more consistent and stronger wind conditions, resulting in significantly higher capacity factors for floating wind farms compared to fixed-bottom alternatives. Successful projects, such as the Hywind Scotland pilot project [5], have demonstrated this potential.
Despite the recent advancements in the offshore wind industry, achieving widespread adoption of wind energy requires addressing several challenges, including the optimization and control of wind farms regarding wake effects [6,7]. Wind farm flow is characterized by high-dimensional turbulence and complex interactions between the wind farm and the atmosphere. Wakes, i.e., turbulent regions formed behind wind turbines, lead to a velocity deficit and increased turbulence compared to free-stream conditions. While turbulent mixing helps mitigate these effects over distance, closely spaced turbines in wind farms prevent the full recovery of velocity, resulting in power losses and heightened structural loads on downstream turbines [8,9,10]. Arreba et al. categorized wake effects in wind farms as deficit and meandering, with additional mean vertical or horizontal deflections [11]. For bottom-fixed turbines, horizontal wake deflection arises from misaligned wind directions and rotor orientations, while vertical deflection results from shaft tilt and vertical shear. For FOWTs, platform pitch angles add complexity to the effective tilt angle, further influencing vertical wake deflection [12,13,14].
FOWT wakes exhibit unique behaviors due to the compliance of floating platforms and the coupling between aerodynamic loads and platform motions [15]. This coupling makes FOWT wake dynamics challenging to model and understand, as only limited studies have explored the mutual effects of platform motions and wake behavior. Large eddy simulations (LESs) have increasingly been used to study these phenomena, with studies such as Wang et al. [16] and Liu et al. [17] focusing on prescribed platform motions. However, these approaches only partially account for aerodynamic platform coupling. Advanced methods, like those presented by Lee et al. [18], integrate LES with turbine dynamics solvers to model the responses of downstream FOWTs more accurately, albeit at a high computational cost.
To address the computational challenges, mid-fidelity modeling techniques have gained traction. Dynamic wake meandering (DWM) models coupled with aeroelastic simulation tools offer an efficient alternative. There is a trade-off between computational efficiency and accuracy among common software used for wake modeling. This study employs FLORIS v4.3 due to its balance of high efficiency and sufficient fidelity for the research objectives. FLORIS supports multiple wake modeling approaches, including the Jensen (Park) model [19], multi-zone wake model [20], Gaussian wake model [21], and Curl model [22]. The Gaussian model provides an analytical solution to simplified Navier–Stokes equations, whereas the Curl model employs a time-marching approach to capture additional dynamics such as counter-rotating vortices, wake rotation, and secondary steering. FLORIS also offers tools for visualization, optimization, and analysis, making it a versatile choice for this study.
2. Wind Farm Layouts for FOWTs
In wind farm configuration, regular layouts are widely implemented at the industry level, primarily classified into linear layouts, basic grid layouts, and offset grid layouts. Linear layouts are effective in reducing the impact of wake effects, making them suitable for sites with stable wind directions and ample space. Basic grid layouts, due to their orderly arrangement, facilitate installation and maintenance, but may intensify wake effects, leading to energy losses [23]. In contrast, offset grid layouts distribute wake effects more evenly across turbines, mitigating energy losses and increasing overall farm efficiency, particularly for downstream turbines. This layout is advantageous for constrained sites or large-scale wind farms. Given the significant impact of basic grid layouts on wind farm power generation efficiency, this study focuses solely on the analysis and design of linear layouts and offset grid layouts.
This study considers floating wind turbines to be installed in the north–south narrow geography of the Taiwan Strait. A regular layout is required to provide space for each mooring system, with a 3 × 3 mooring pattern and large-diameter anchor chains planned for the project. This study compares two wind farm layouts: linear and offset grid. It has the goal of designing an efficient layout to accommodate twelve (12) FOWTs in a pre-commercial project that is planned by the local government. Most importantly, the design must comply with the regulations published by a government agency, which stipulates a minimum installed capacity of 7.0 MW/km2. While the wind farm space is not an issue for fixed-bottom turbines, the large mooring footprint of a FOWT makes the wind farm design challenging.
3. Wake Model
The wake model for wind turbines quantifies the reduction in wind speed occurring downstream of the turbine during standard wind farm operations. In this study, simulations utilize the Gauss–Curl hybrid model, one of the wake modeling approaches integrated into FLORIS v4.3. The proposed Gauss–Curl hybrid model builds upon the Gaussian wake framework, incorporating asymmetric characteristics and secondary effects related to wake steering. The wake velocity reduction is derived by assuming a Gaussian profile, which relies on the principle of self-similarity—a common approach in analyzing free shear flows. The mathematical formulation for the three-dimensional velocity field, , downstream of the turbine is expressed as follows:
Here, represents the velocity deficit at the wake’s center, denotes the free-stream wind speed, is the lateral displacement of the wake, and specifies the height of the turbine hub. The parameters and describe the wake’s expansion in the lateral () and vertical () directions, respectively. These parameters are calculated individually for each turbine. The subscript “” indicates the initial conditions at the onset of the far wake, which are influenced by the ambient turbulence intensity, , and the thrust coefficient, . The lateral and vertical wake width distributions, and , are given by
where
In this context, refers to the diameter of the rotor, represents the wind speed at the rotor plane, and corresponds to the wind velocity at the beginning of the far wake region. The parameters and describe the rates of wake growth in the transverse and streamwise directions, respectively [24,25,26].
To assess the wind turbine’s energy production, the annual energy production (AEP) is computed as follows:
where 8760 represents the number of hours in one year, is the wind direction, and is the wind speed. is the joint probability of and , derived from the measured buoy data. represents the average power production during one hour under the specified wind speed and direction, accounting for wake losses.
For the case of Maine discussed in this paper, the objective function is set to the AEP to quantify the wake effect’s impact on the energy production [27]. The power curve of the NREL 15 MW wind turbine is applied to convert the incident wind speed into the power generated under the given wind conditions.
4. Design Basis and Regulatory Requirement
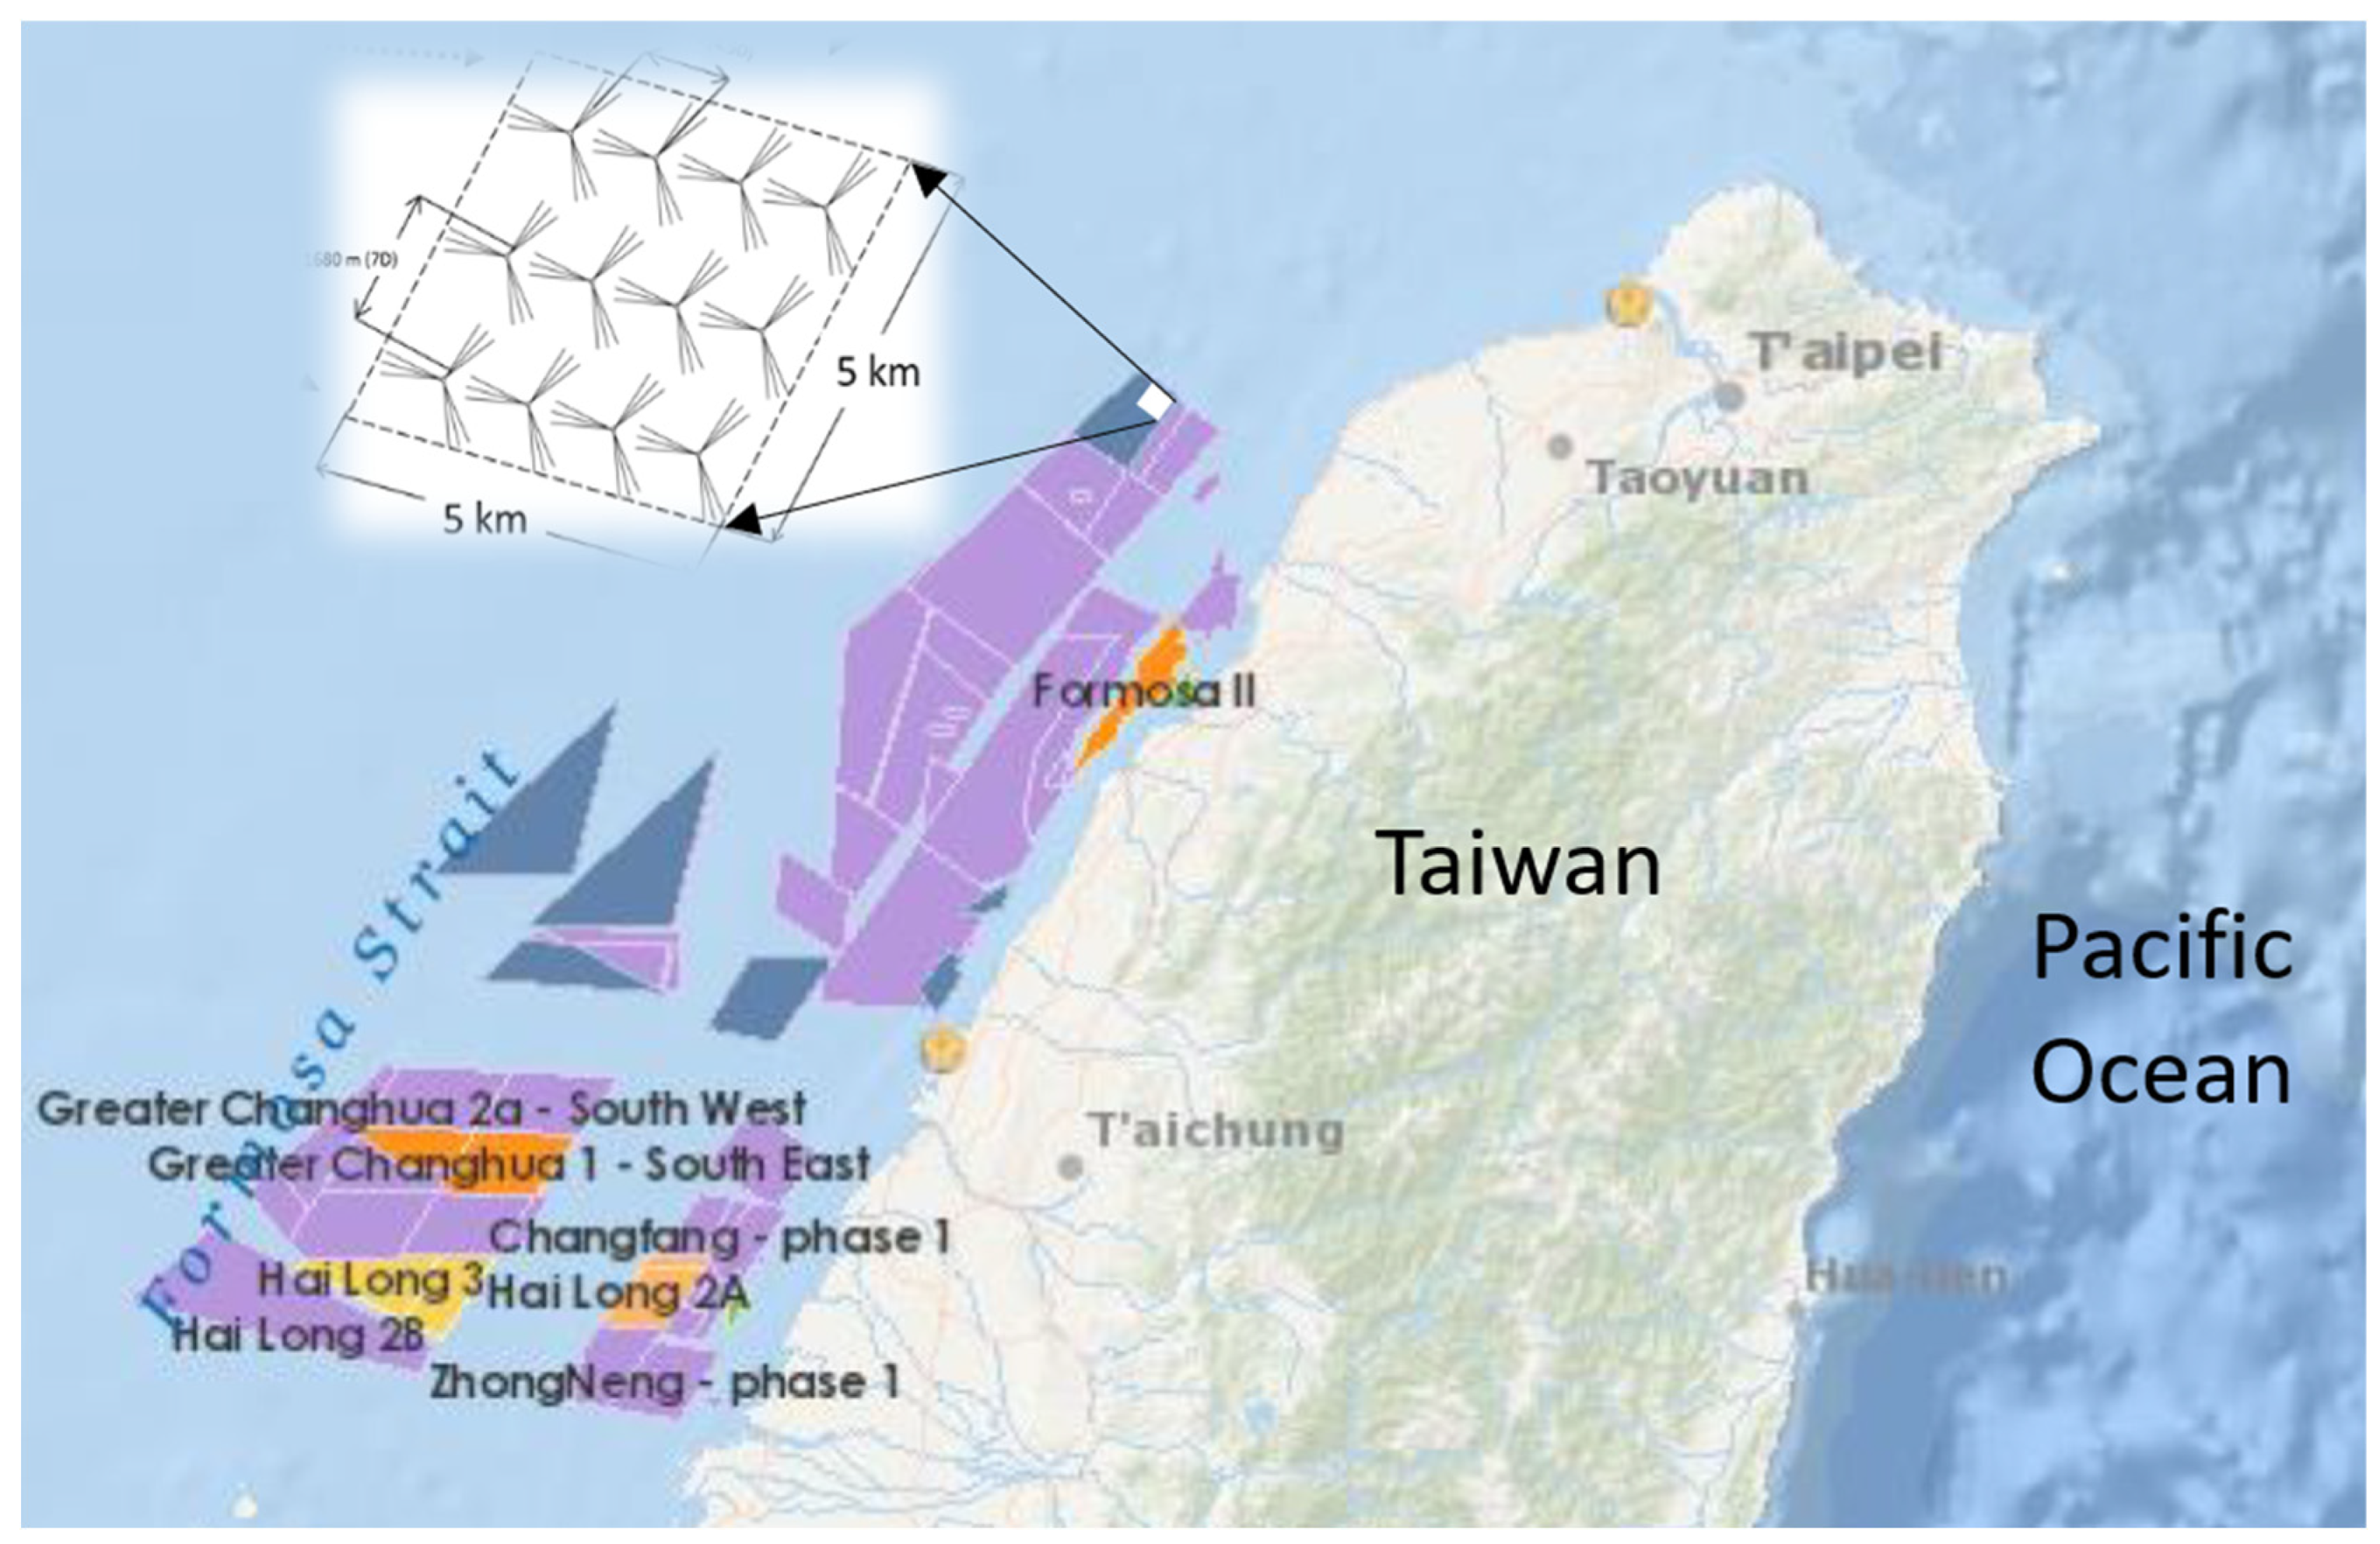
This research aims to investigate the feasibility and design optimization of a floating wind farm in a tropical cyclone region, such as the Taiwan Strait. The IEA 15 MW turbine is assumed to be fitted on a semi-submersible platform. The primary focus is on the placement of the FOWTs and the pattern of their mooring systems, as well as the consideration of wind conditions, installation requirements, and the performance of the floating system. It is assumed that the example wind farm will be located approximately 25 km offshore Hsinchu in a deepwater site in the Taiwan Strait, as illustrated in Figure 2. Note that a related study focusing on floater assembly and turbine integration strategy under a similar project background can be found in other references [28,29,30,31,32].

Figure 2.
Example layout for accommodating 12 FOWTs in a small wind farm block. Taiwan Offshore Wind Map adapted from https://map.4coffshore.com/offshorewind/ (accessed on 17 January 2025).
The wind in the Taiwan Strait is highly influenced by the northeast monsoon, especially in fall, winter, and early spring. For this study, it is assumed the monsoon wind consistently comes from a single direction, which is a typical simplification for offshore wind turbine placement design work. Wind data shown in Figure 3 were obtained from Hsinchu Buoy owned by the Central Weather Administration, ROC (Taiwan) Ministry of Transport, collected from April 2020 to January 2024, almost 4 years of observation. The buoy location is 24.76° N, 120.84° E. The average wind speed is set to , which is representative of the typical wind condition.
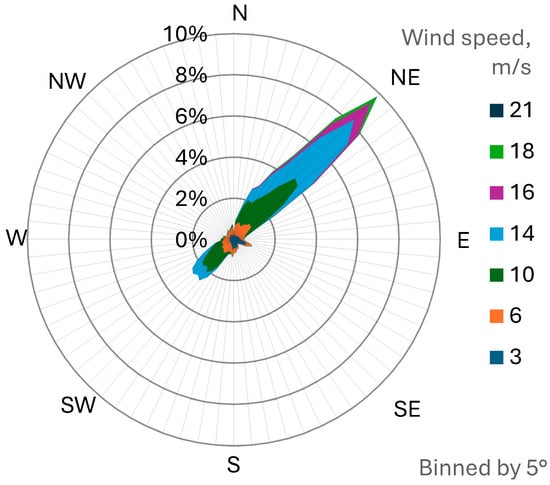
Figure 3.
Wind rose in the Taiwan Strait near Hsinchu. Obtained based on 4 years of buoy measurements courtesy of https://nodass.namr.gov.tw/gis/#/method/Observation/station/cwa (accessed on 17 January 2025).
According to guidelines issued by the Taiwanese government agency (i.e., offshore wind power development site capacity allocation guidelines), the planned installed capacity for a single application project shall not be less than 100 MW, and the installed capacity per square kilometer shall not be less than 7.0 MW. Therefore, to satisfy the required 100 MW capacity, the design basis for this study focuses on utilizing the IEA 15 MW turbines, each with a rotor diameter of m, to design a small wind farm containing FOWTs. Thus, the wind farm will have a total capacity of 180 MW. The turbines will be mounted on off-column semi-submersible floaters, with an anchor radius of m to ensure stability. Installation requirements for spacing are strictly adhered to, ensuring a safe and efficient deployment of the wind farm.
In summary, the design of the wind farm shall consider the following design basis:
- The wind farm is located offshore of Hsinchu in the Taiwan Strait, a typhoon region.
- The water depth of the wind farm is 70 m on average.
- The block should accommodate 6 to 12 FOWTs.
- The floater is assumed to be a semi-submersible type.
- The mooring system is a 3 × 3 all-chain catenary design due to the typhoon environment.
- The installed capacity per square kilometer (power density) shall not be less than 7.0 MW.
5. Turbine, Floater, and Mooring System
The IEA 15 MW offshore wind turbine is assumed for this study [33]. The detailed dimensions are as shown in Table 1. This turbine is designed for floating wind farms and offers a high capacity factor, making it a suitable choice for the project. Each turbine has a rotor diameter of 240 m, which impacts the spacing and arrangement of the turbines to avoid interference. The wind farm will consist of 12 turbines, strategically positioned to optimize power generation while considering spacing and installation requirements. The turbines will be mounted on a semi-submersible floater, with the principal dimensions of the platform shown in Table 2. The floater design features good stability and motion characteristics [31].

Table 1.
Principal dimensions of wind turbine.
Table 2.
Principal dimensions of semi-submersible platform.
A floating platform provides buoyancy to support the weight of the turbine and restrict pitch, roll, and heave motions within acceptable limits. Among different types of floaters, the semi-submersible type is considered suitable for the Taiwan Strait [31]. The platform used in this research is based on a semi-submersible “TaidaFloat” designed by the authors’ lab at National Taiwan University [31]. This platform is designed to support a 15 MW wind turbine [31,34]. TaidaFloat features a three-column configuration with flat panels and pontoons, specifically engineered for deployment in the Taiwan Strait off the coast of Hsinchu, which has received an approval-in-principle (AIP) certificate from the American Bureau of Shipping (ABS). The design consists of a main column with a larger diameter that supports the wind turbine tower, complemented by two symmetrically arranged side columns of smaller diameter, as illustrated in Figure 4. Figure 5 further shows the detailed dimensions of the TaidaFloat semi-submersible floater unit, which supports the IEA 15 MW wind turbine.
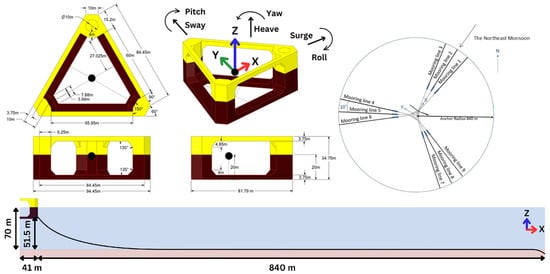
Figure 4.
Semi-submersible floater with a 3 × 3 mooring system designed for typhoon conditions.
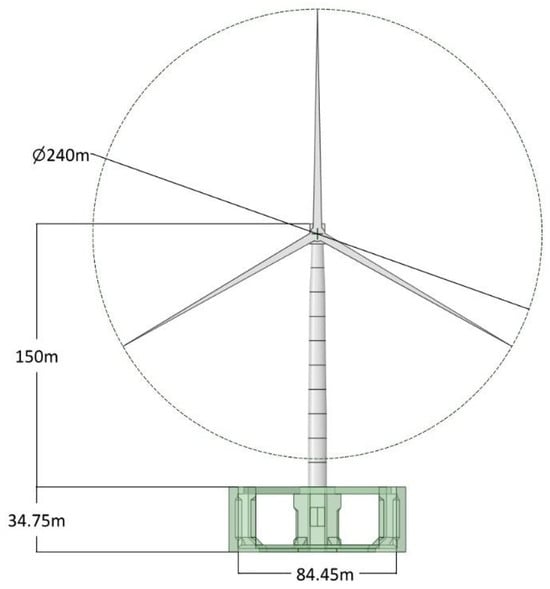
Figure 5.
Detailed dimensions of the TaidaFloat semi-submersible floater unit supporting the IEA 15 MW wind turbine.
The extreme current velocity (surface current speed at 1.57 m/s), extreme wind speed (57 m/s at hub height), and extreme wave significant height have already been taken into account during the design of the mooring system, with the offset being limited to stay under 32% of the water depth, which is 22.4 m [34]. Furthermore, Wu et al. [35] pointed out that during the winter, the northward current weakens even more as the northeasterly monsoon strengthens, so the sea current does not significantly impact the mooring system. Given the extreme environment in a typhoon region, the FOWT’s mooring system requires nine catenary chains in a 3 × 3 pattern. The 3 × 3 system, rather than a 3 × 2 or 3 × 1, is needed to satisfy the strength requirement in mooring codes and standards [2,34], where a safety factor of 1.67 in intact condition is typically specified to be met for a 50-year environmental condition. Details of the mooring design can be found in another paper [34]. The ground chain is 12 times the water depth (12 WD), which may be slightly longer than those in typical shallow-water mooring designs [2]. The long ground chain improves the mooring performance in typhoon conditions [34]. The distance between two turbines is also adjusted to ensure that the mooring lines are adequately spaced to prevent crossing and clashing between two mooring systems.
In order to improve the platform motion in wind and waves, it is essential to consider the prevailing wind direction during its installation. Designing a zero-degree angle between the FOWTs’ heading and the prevailing wind direction is considered the most reasonable approach [28]. In other words, the main column (i.e., turbine column) of the semi-submersible platform faces the prevailing wind direction, towards northeast, as shown in Figure 4.
For installation and operational efficiency, the minimum spacing between turbines and anchor positions is considered. According to the ABS Guide for Position Mooring Systems [36], a minimum drag space of 300 m is required from the final anchor position to ensure sufficient space for the installation of drag anchors. Therefore, this study assumes that the three anchor positions near the adjacent Floating Offshore Wind Turbine (FOWT) must be at least 300 m away from the nearby floater. An anchor radius of 840 m is also an important factor, providing sufficient distance between turbines to allow for smooth installation processes without obstructing other turbines’ positioning.
6. Efficiency of Offset Grid Layout
For a linear layout, as illustrated in Figure 6, the crosswind distance is designed to be 1124 m (equivalent to 5.1 times the rotor diameter), ensuring no energy loss along the prevailing wind direction. This layout prioritizes optimal energy production by eliminating wake effect interference between turbines, resulting in an installed capacity of 7.71 MW/km2, which meets and exceeds the regulatory requirement of at least 7.0 MW/km2. Such a design maximizes efficiency and ensures that each turbine operates at its peak capacity without the influence of neighboring turbines. Using the FLORIS model, the annual energy production (AEP) is calculated to be 360 GWh, demonstrating the layout’s high efficiency in renewable energy generation.
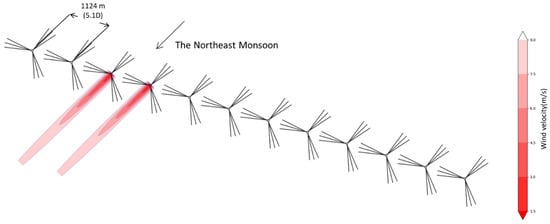
Figure 6.
Linear layout with wake effect visualization.
While this linear layout is theoretically feasible for a 12-turbine wind farm, its practicality diminishes as the scale of the wind farm increases. Most wind farms are in the shape of blocks. Larger-scale wind farms require significantly more space, making them difficult to implement in the narrow and elongated geographic conditions of the Taiwan Strait. For example, accommodating 50 turbines with the same spacing would demand an expansive area, which is often unavailable or economically unviable in the region.
To address these spatial constraints, a more compact offset grid layout is proposed and analyzed. This alternative design seeks to strike a balance between optimizing energy production and utilizing the limited resources of the Taiwan Strait. By carefully considering the trade-offs between turbine spacing, wake effect mitigation, and land utilization, the offset grid layout presents a practical and efficient solution for large-scale offshore wind farm development.
Figure 7 shows the offset grid layout; the crosswind distance is set to 1180 m (4.9D), primarily dictated by the anchor radius to prevent the interference or intersection of mooring lines, ensuring structural integrity and operational stability. Meanwhile, the downwind distance is set to 1680 m (7D), accounting for the wake effect, where reduced wind velocity caused by upstream turbines impacts downstream energy production, resulting in an acceptable energy loss of 2%, which corresponds to an annual energy production (AEP) of 352.9 GWh, as calculated using the FLORIS model.
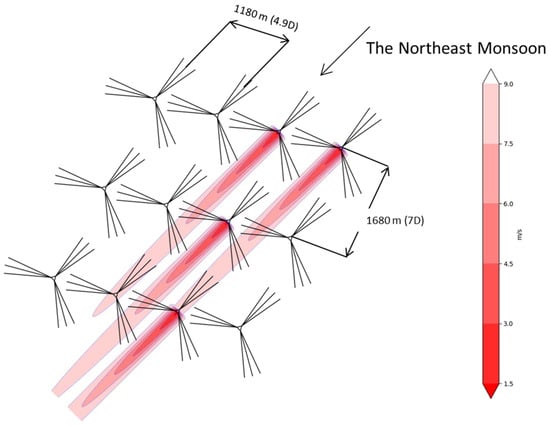
Figure 7.
Offset grid layout with wake effect visualization.
Despite this energy loss, the offset grid layout remains a feasible and efficient option for large-scale wind farms in the Taiwan Strait. Moreover, the installed capacity is estimated to be 7.1 MW/km2, satisfying the regulatory requirement of 7.0 MW/km2. This layout effectively balances energy efficiency and spatial constraints, making it a practical and forward-looking solution for the development of large-scale offshore wind farms in the region. Simultaneously, the prevailing wind direction in the wind farm is favorable for layout optimization. Optimization of the layout becomes more important as the number of wind turbines increases, due to the stronger wake effects. As the wake effect intensifies with more turbines, reducing its impact helps minimize the Levelized Cost of Energy (LCOE) and increase the capacity factor [37].
7. Discussions—Congestion by Moorings
One issue with the proposed wind farm design accommodating 15 MW FOWTs is the congestion caused by the large 3 × 3 mooring patterns. The extreme wind and wave conditions caused by typhoons in the region force the mooring system to adopt a nine-line design in a 3 × 3 pattern [34]. In the oil and gas industry, this is not an issue because the oil production platform is a single floater operating alone in an open sea. For this study, however, a wind farm has to accommodate many floaters in close proximity. The mooring pattern with a large footprint becomes an issue especially during mooring installation. As floating platforms are so close to each other, mooring installation becomes challenging. It will be beneficial to pre-install (prelay) most of the mooring and anchor components in advance before the towing of the floating platforms. Even with such a pre-installation strategy, the mooring hook-up with the floater would still be a difficult task, as the installation vessel would have to perform procedures with installed FOWTs adjacent to it. This installation challenge should be noted, and it may even impact the selection of anchors. In this regard, a driven pile may show an advantage over a drag embedment anchor, because the latter requires proof-loading after installation, which needs extra space for the anchor handling vessel [28].
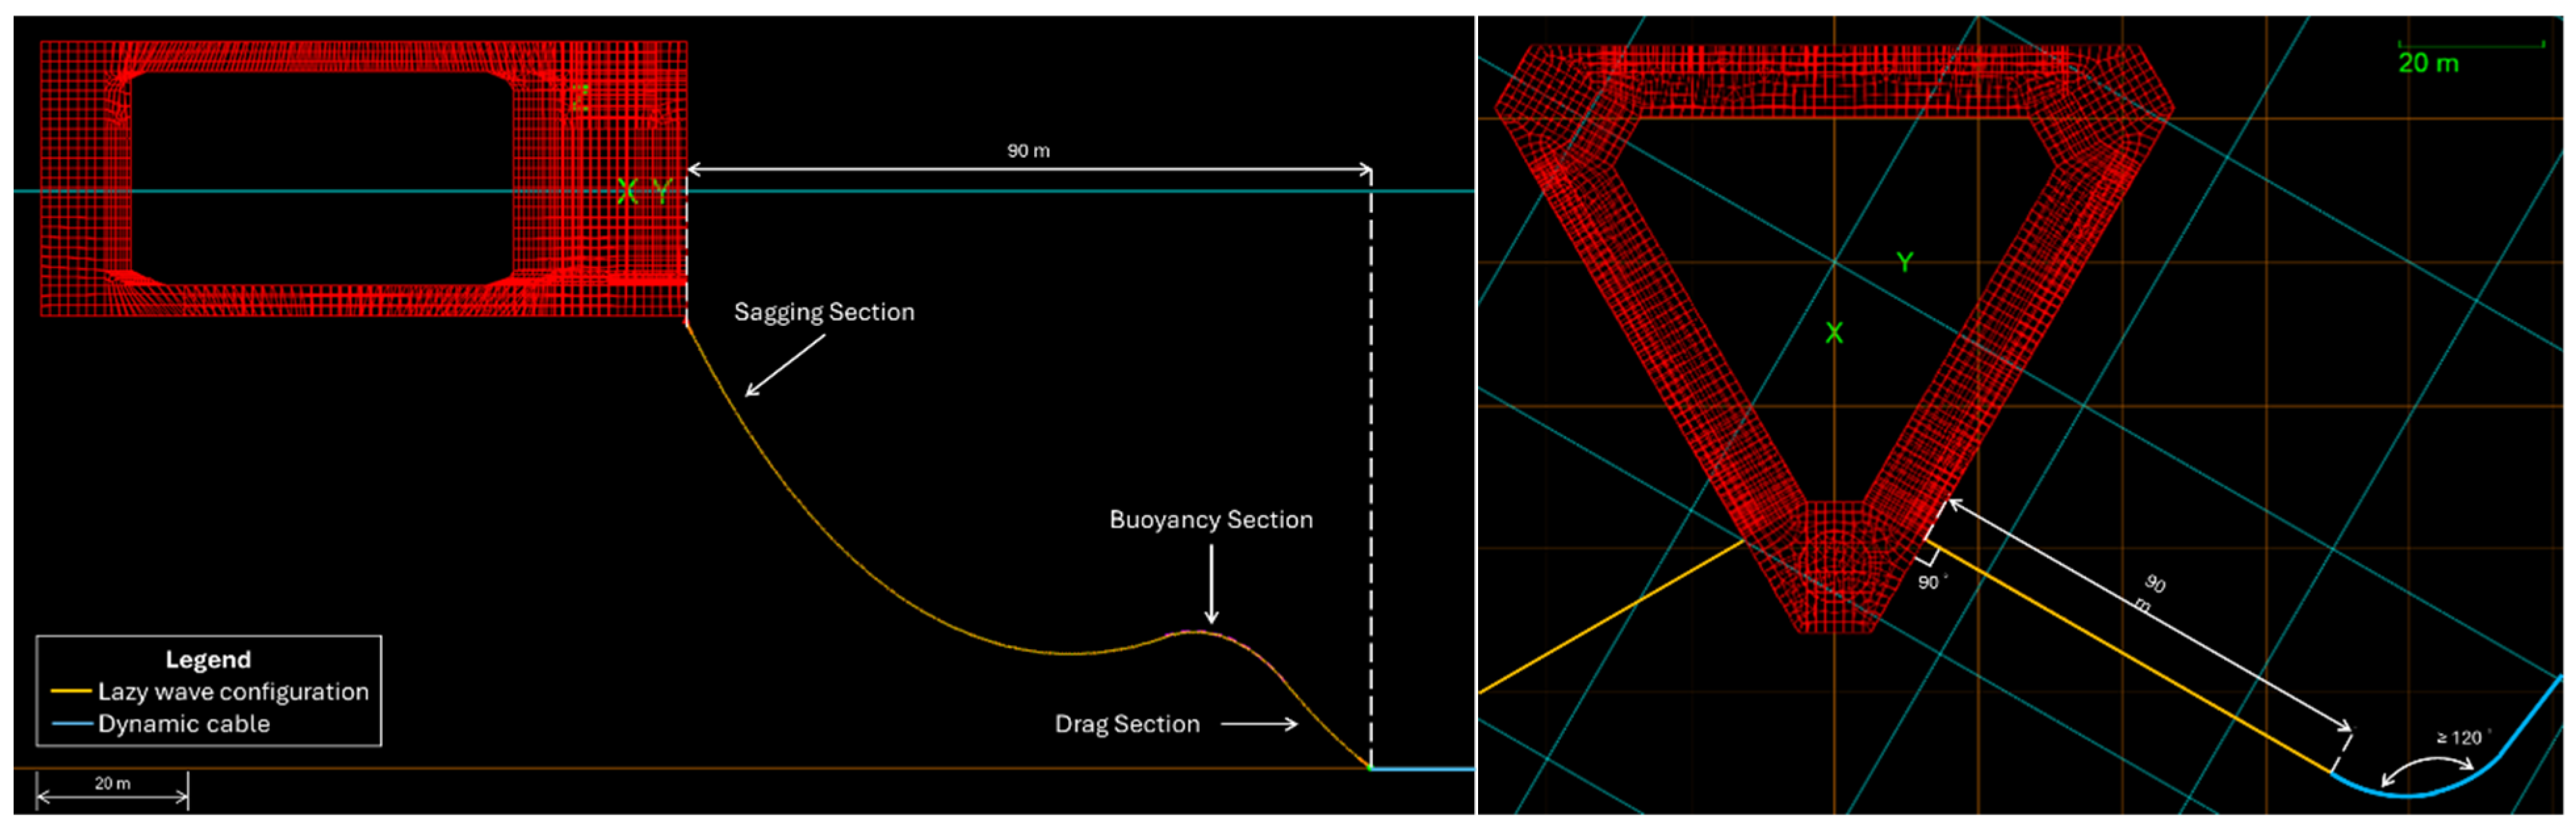
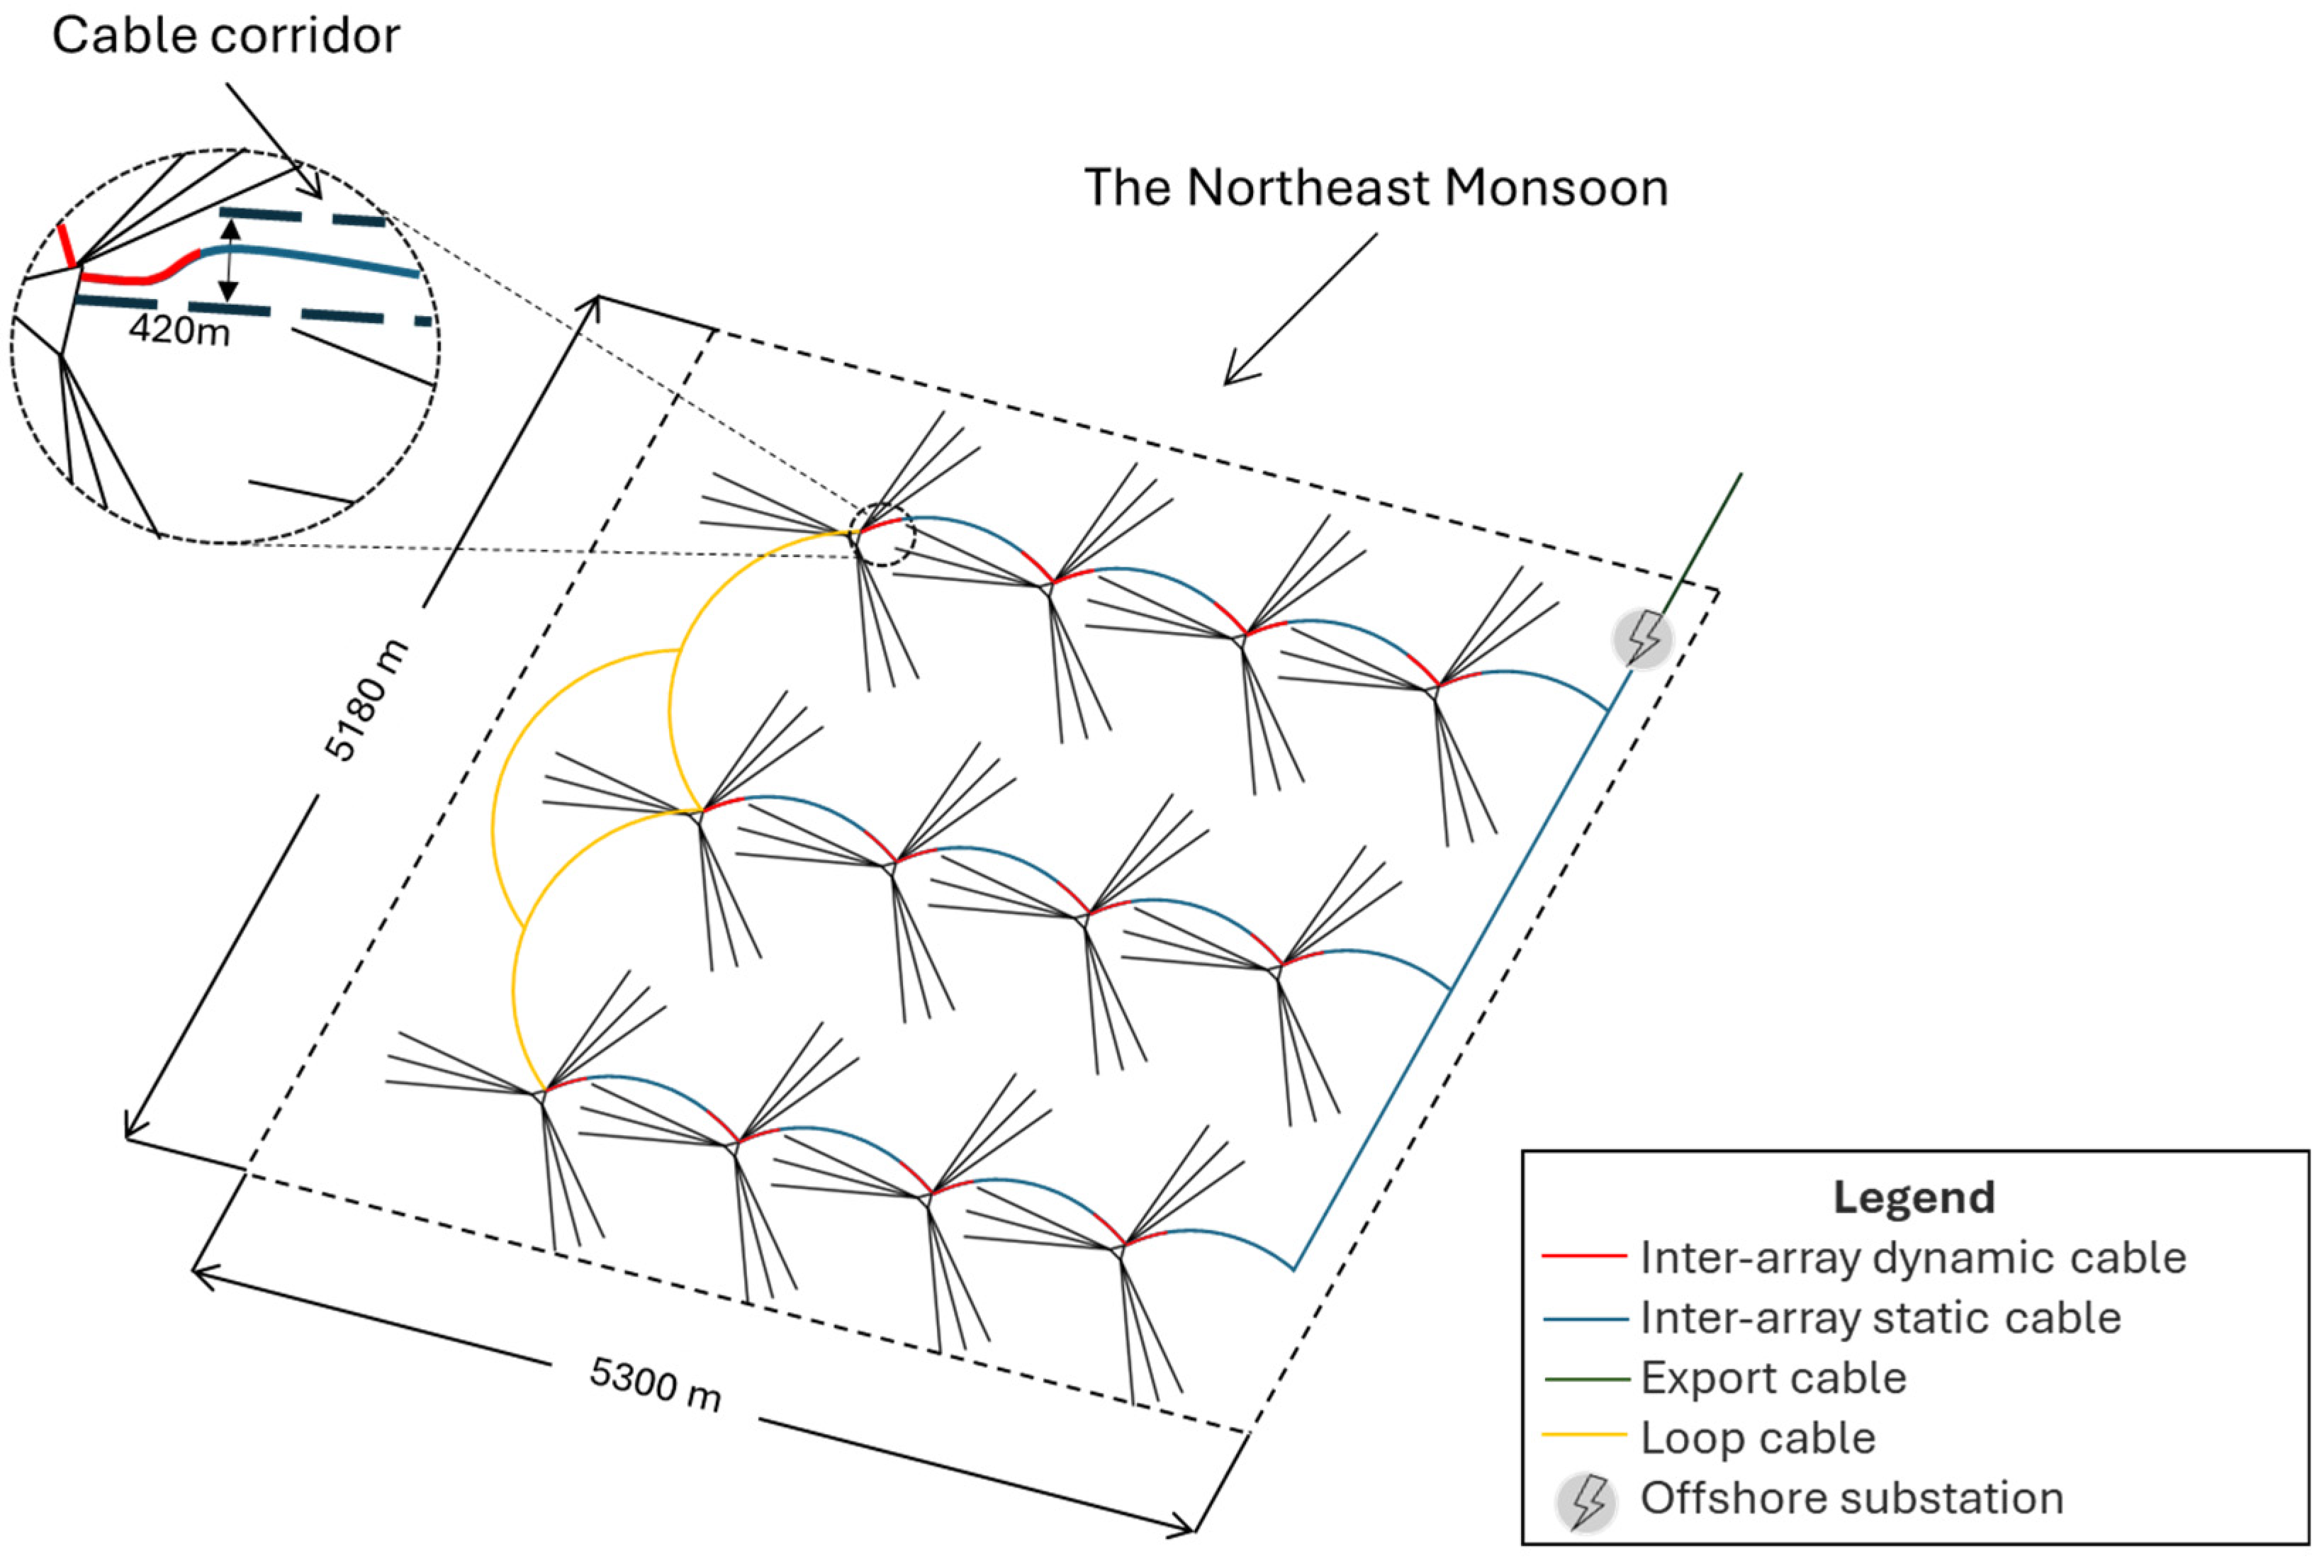
The power cable system is another issue. A power cable system needs to be arranged to fit into the layout, which is crowded by the 3 × 3 mooring patterns. Note that power cables are not allowed to go under the mooring lines. The cable corridor needs to accommodate not just the inter-array cables but also a lazy wave configuration for each FOWT. There are many possible cable configurations [38]; here, a conventional dynamic–static–dynamic approach is used, with the dynamic cable in the lazy-wave configuration [39,40]. Fully suspended inter-array cables have also been investigated in Taiwan, which might be another alternative depending on the cables available [38]. Cable properties from a manufacturer might influence this choice a lot [41], but none are offered in Taiwan at the moment. Figure 8 illustrates the lazy-wave configuration of TaidaFloat. There shall be a buffer zone between the cables and mooring lines. According to the EirGrid 220 kV Submarine Cables Function Specification, the width of the cable corridor must be at least 100 m or six times the water depth, whichever is greater [42]. As the wind farm is composed of three rows of FOWTs, each row could use a backup loop cable if any of the row is damaged. On the east border of the farm, a large export cable can be placed to gather the power generated by the three rows of FOWTs, as demonstrated in Figure 9. Note that all the cables are supposed to be kept within the limited area of the small farm. It can be seen that the cable routing may be possible, but may be challenging to arrange in the crowded area.
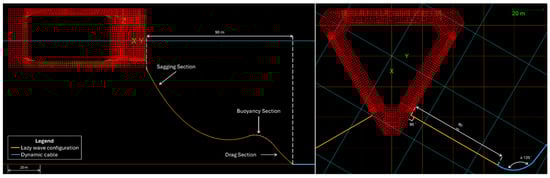
Figure 8.
The lazy wave configuration of TaidaFloat: (left) side view; (right) top view.
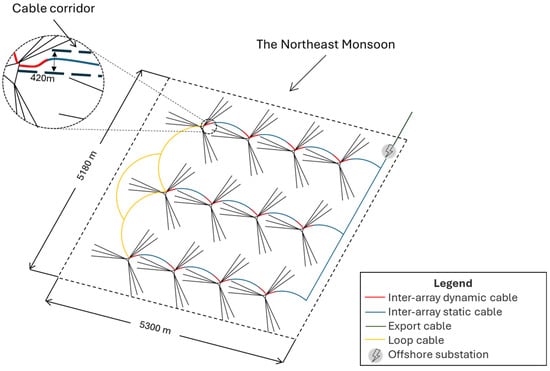
Figure 9.
Power cable routing can be highly constrained by the mooring systems.
8. Conclusions
The comparison of linear and offset grid turbine layouts reveals a subtle trade-off between energy loss and distance configurations. The linear layout, which maintains a crosswind distance (in one row) of 5.1D results in no energy loss due to wake effects. However, commercial wind farms are typically assigned in the shape of square or rectangle blocks. An offset grid layout may be suitable and preferred. It was found that the layout, with a downwind distance of 7.0D and a crosswind distance of 4.9D, had a small energy loss of . This layout is more practical and suitable for optimizing space in commercial projects.
In summary, in a tropical cyclone environment, the FOWTs’ mooring systems requiring a 3 × 3 pattern and a large anchor radius (i.e., mooring scope) may be crowded among each other. As long as the turbine array is properly arranged, the FOWTs can be fitted in a limited area and achieve a high power generation rate that meets the regulatory requirement of 7.0 MW/km2. The anchor radius of m used in this study barely works; it should be shortened to allow an easier and better routing for the power cable.
This research demonstrates the feasibility of a wind farm with 15 MW FOWTs stationed by large mooring systems in a tropical cyclone region. However, due to the space congestion, the mooring installation procedures and the power cable routing may be challenging to design. Overall, the design of the optimal wind farm layout should strike a balance among energy generation efficiency, space constraints, and regulatory requirements. While this research shows that the wind farm design is technically feasible, more detailed engineering may be needed to evaluate if the floating wind farm is economically viable.
In future studies, we will investigate the seabed characteristics of the Taiwan Strait, such as soil condition and terrain elevation, as these elements are crucial for the anchoring system. Specifically, we will examine how these characteristics influence the anchor holding capacity and the overall stability of the mooring system.
Author Contributions
Software, W.-Y.H.; validation, K.-T.M.; writing—original draft, K.-T.M. and W.-Y.H.; writing—review and editing, K.-T.M., K.-Y.W., G.I. and W.-Y.H.; supervision, K.-T.M. All authors have read and agreed to the published version of the manuscript.
Funding
This research was funded by the National Science and Technology Council and Copenhagen Infrastructure Partners (CIP). Granted Number: 113-2218-E-002-024-.
Data Availability Statement
The original contributions presented in this study are included in the article; further inquiries can be directed to the corresponding authors.
Acknowledgments
The authors highly appreciate the funding support from the National Science and Technology Council and Copenhagen Infrastructure Partners (CIP), and the funding administration by the Ship and Ocean Technology Research Center of National Taiwan University. Expert advice provided by Yongyan Wu and Donghui Chen is appreciated. Assistance on technical writing from Amir Noorizadegan is greatly appreciated. The authors would like to thank Mao-Hsiung Chiang for the project supervision provided by him.
Conflicts of Interest
The authors declare no conflicts of interest.
References
- Lauria, A.; Loprieno, P.; Francone, A.; Leone, E.; Tomasicchio, G.R. Recent advances in understanding the dynamic characterization of floating offshore wind turbines. Ocean Eng. 2024, 307, 118189. [Google Scholar] [CrossRef]
- Ma, K.-T.; Luo, Y.; Kwan, C.-T.T.; Wu, Y. Mooring System Engineering for Offshore Structures; Gulf Professional Publishing: Oxford, UK, 2019. [Google Scholar]
- Ivanov, G.; Wu, Y.; Chen, D.; Lai, Z.-Y.; Chen, J.-C.; Gladkov, N.; Ma, K.-T. Optimal Mooring Pattern for a Semi-Submersible FOWT in a Typhoon Environment; American Society of Mechanical Engineers: New York, NY, USA, 2024. [Google Scholar]
- Alkarem, Y.R.; Huguenard, K.; Verma, A.S.; Van Binsbergen, D.; Bachynski-Polić, E.; Nejad, A.R. Passive Mooring-based Turbine Repositioning Technique for Wake Steering in Floating Offshore Wind Farms. J. Phys. Conf. Ser. 2024, 2767, 092056. [Google Scholar] [CrossRef]
- Equinor. Floating Wind: The Power to Progress; Equinor: Stavanger, Norway, 2022. [Google Scholar]
- Abkar, M.; Zehtabiyan-Rezaie, N.; Iosifidis, A. Reinforcement learning for wind-farm flow control: Current state and future actions. Theor. Appl. Mech. Lett. 2023, 13, 100475. [Google Scholar] [CrossRef]
- Veers, P.; Dykes, K.; Lantz, E.; Barth, S.; Bottasso, C.L.; Carlson, O.; Clifton, A.; Green, J.; Green, P.; Holttinen, H.; et al. Grand challenges in the science of wind energy. Science 2019, 366, eaau2027. [Google Scholar] [CrossRef]
- Vermeer, L.J.; Sørensen, J.N.; Crespo, A. Wind turbine wake aerodynamics. Prog. Aerosp. Sci. 2003, 39, 467–510. [Google Scholar] [CrossRef]
- Stevens, R.; Meneveau, C. Flow Structure and Turbulence in Wind Farms. Annu. Rev. Fluid Mech. 2017, 49. [Google Scholar] [CrossRef]
- Porté-Agel, F.; Bastankhah, M.; Shamsoddin, S. Wind-Turbine and Wind-Farm Flows: A Review. Bound. Layer Meteorol 2020, 174, 1–59. [Google Scholar] [CrossRef]
- Rivera-Arreba, I.; Li, Z.; Yang, X.; Bachynski-Polić, E.E. Comparison of the dynamic wake meandering model against large eddy simulation for horizontal and vertical steering of wind turbine wakes. Renew. Energy 2024, 221, 119807. [Google Scholar] [CrossRef]
- Wise, A.S.; Bachynski, E.E. Wake meandering effects on floating wind turbines. Wind Energy 2020, 23, 1266–1285. [Google Scholar] [CrossRef]
- Nanos, E.M.; Bottasso, C.L.; Tamaro, S.; Manolas, D.I.; Riziotis, V.A. Vertical wake deflection for floating wind turbines by differential ballast control. Wind Energy Sci. 2022, 7, 1641–1660. [Google Scholar] [CrossRef]
- Doubrawa, P.; Sirnivas, S.; Godvik, M. Effects of upstream rotor tilt on a downstream floating wind turbine. J. Phys. Conf. Ser. 2021, 1934. [Google Scholar] [CrossRef]
- Carmo, L.; Jonkman, J.; Thedin, R. Investigating the interactions between wakes and floating wind turbines using FAST.Farm. Wind Energy Sci. 2024, 9, 1827–1847. [Google Scholar] [CrossRef]
- Wang, J.; Wang, C.; Castañeda, O.D.; Campagnolo, F.; Bottasso, C.L. Large-eddy simulation of scaled floating wind turbines in a boundary layer wind tunnel. J. Phys. Conf. Ser. 2018, 1037, 072032. [Google Scholar] [CrossRef]
- Liu, Y.; Xiao, Q.; Incecik, A.; Peyrard, C. Aeroelastic analysis of a floating offshore wind turbine in platform-induced surge motion using a fully coupled CFD-MBD method. Wind Energy 2018, 22, 1–20. [Google Scholar] [CrossRef]
- Johlas, H.M.; Martí nez-Tossas, L.A.; Schmidt, D.P.; Lackner, M.A.; Churchfield, M.J. Large eddy simulations of floating offshore wind turbine wakes with coupled platform motion. J. Phys. Conf. Ser. 2019, 1256, 012018. [Google Scholar] [CrossRef]
- Jensen, N.O. A Note on Wind Generator Interaction; Risø National Laboratory: Roskilde, Denmark, 1983. [Google Scholar]
- Gebraad, P.M.O.; Teeuwisse, F.W.; van Wingerden, J.W.; Fleming, P.A.; Ruben, S.D.; Marden, J.R.; Pao, L.Y. Wind plant power optimization through yaw control using a parametric model for wake effects—A CFD simulation study. Wind Energy 2016, 19, 95–114. [Google Scholar] [CrossRef]
- Niayifar, A.; Porté-Agel, F. A new analytical model for wind farm power prediction. J. Phys. Conf. Ser. 2015, 625. [Google Scholar] [CrossRef]
- Martínez-Tossas, L.A.; Annoni, J.; Fleming, P.A.; Churchfield, M.J. The aerodynamics of the curled wake: A simplified model in view of flow control. Wind Energy Sci. 2019, 4, 127–138. [Google Scholar] [CrossRef]
- Rodrigues, R. Aligned and Staggered Layouts: What is the Impact on Wind Farms Land-Use? 2020. Available online: https://www.researchgate.net/publication/343058120_Aligned_and_Staggered_Layouts_What_is_the_Impact_on_Wind_Farms_Land-Use (accessed on 25 March 2025).
- King, J.; Fleming, P.; King, R.; Martínez-Tossas, L.A.; Bay, C.J.; Mudafort, R.; Simley, E. Control-oriented model for secondary effects of wake steering. Wind Energy Sci. 2021, 6, 701–714. [Google Scholar] [CrossRef]
- Annoni, J.; Fleming, P.; Scholbrock, A.; Roadman, J.; Dana, S.; Adcock, C.; Porte-Agel, F.; Raach, S.; Haizmann, F.; Schlipf, D. Analysis of control-oriented wake modeling tools using lidar field results. Wind Energy Sci. 2018, 3, 819–831. [Google Scholar] [CrossRef]
- Kim, M.; Lim, H.; Park, S. Comparative Analysis of Wind Farm Simulators for Wind Farm Control. Energies 2023, 16, 3676. [Google Scholar] [CrossRef]
- Thomas, B.; Costoya, X.; deCastro, M.; Carvalho, D.; Gómez-Gesteira, M. Wake effect impact on the levelized cost of energy in large floating offshore wind farms: A case of study in the northwest of the Iberian Peninsula. Energy 2024, 304, 132159. [Google Scholar] [CrossRef]
- Chen, M.; Jiang, J.; Zhang, W.; Li, C.B.; Zhou, H.; Jiang, Y.; Sun, X. Study on Mooring Design of 15 MW Floating Wind Turbines in South China Sea. J. Mar. Sci. Eng. 2023, 12, 33. [Google Scholar] [CrossRef]
- Chang, H.-C.; Noorizadegan, A.; Liu, Y.-H.; Ma, K.-T. A Study on Offshore Anchor Selection with a Focus on Torpedo Anchor Stability and Performance. J. Mar. Sci. Eng. 2024, 12, 1721. [Google Scholar] [CrossRef]
- Ivanov, G.; Ma, K.-T. Floater Assembly and Turbine Integration Strategy for Floating Offshore Wind Energy: Considerations and Recommendations. Wind 2024, 4, 376–394. [Google Scholar] [CrossRef]
- Hsu, I.-J.; Ivanov, G.; Ma, K.-T.; Huang, Z.-Z.; Wu, H.-T.; Huang, Y.-T.; Chou, M. Optimization of Semi-Submersible Hull Design for Floating Offshore Wind Turbines. In Proceedings of the ASME 2022 41st International Conference on Ocean, Offshore and Arctic Engineering, Hamburg, Germany, 5–10 June 2022. [Google Scholar]
- Ma, K.-T.; Wu, Y.; Stolen, S.; Bello, L.; van der Horst, M.; Luo, Y. Mooring Designs for Floating Offshore Wind Turbines Leveraging Experience From the Oil & Gas Industry; American Society of Mechanical Engineers: New York, NY, USA, 2021. [Google Scholar]
- NREL. Definition of the IEA Wind 15-Megawatt Offshore Reference Wind Turbine; NREL: Golden, CO, USA, 2020. [Google Scholar]
- Chen, C.-A.; Chen, K.-H.; Igarashi, Y.; Chen, D.; Ma, K.-T.; Lai, Z.-Y. Design of Mooring System for a 15 MW Semi-Submersible, TaidaFloat, in Taiwan Strait; American Society of Mechanical Engineers: New York, NY, USA, 2023. [Google Scholar]
- Wu, C.-R.; Chao, S.-Y.; Hsu, C. Transient, seasonal and interannual variability of the Taiwan Strait current. J. Oceanogr. 2007, 63, 821–833. [Google Scholar] [CrossRef]
- American Bureau of Shipping. ABS Guide for Position Mooring Systems; American Bureau of Shipping: Houston, TX, USA, 2018. [Google Scholar]
- Yang, Q.; Li, H.; Li, T.; Zhou, X. Wind farm layout optimization for levelized cost of energy minimization with combined analytical wake model and hybrid optimization strategy. Energy Convers. Manag. 2021, 248, 114778. [Google Scholar] [CrossRef]
- Li, D.-R.; Su, Y.-S.; Yang, R.-Y. Experimental and Numerical Study of Suspended Inter-Array Cable Configurations for Floating Offshore Wind Farm. J. Mar. Sci. Eng. 2024, 12, 853. [Google Scholar] [CrossRef]
- Rentschler, M.U.; Adam, F.; Chainho, P.; Krügel, K.; Vicente, P.C. Review of the State of the Art of Dynamic Cable System Design; Corewind: Shenzhen, China, 2022. [Google Scholar]
- Trapper, P.A. Feasible numerical analysis of steel lazy-wave riser. Ocean Eng. 2020, 195, 106643. [Google Scholar] [CrossRef]
- Janocha, M.J.; Ong, M.C.; Lee, C.F.; Chen, K.; Ye, N. Reference Power Cable Models for Floating Offshore Wind Applications. Sustainability 2024, 16, 2899. [Google Scholar] [CrossRef]
- EirGrid. 220 kV Submarine Cables Function Specification (OFS-CAB-100-R3); EirGrid: Dublin, Ireland, 2022; Available online: https://cms.eirgrid.ie/sites/default/files/publications/OFS-CAB-100-R3-220-kV-Submarine-Cables.pdf (accessed on 25 March 2025).


Disclaimer/Publisher’s Note: The statements, opinions and data contained in all publications are solely those of the individual author(s) and contributor(s) and not of MDPI and/or the editor(s). MDPI and/or the editor(s) disclaim responsibility for any injury to people or property resulting from any ideas, methods, instructions or products referred to in the content. |
© 2025 by the authors. Licensee MDPI, Basel, Switzerland. This article is an open access article distributed under the terms and conditions of the Creative Commons Attribution (CC BY) license (https://creativecommons.org/licenses/by/4.0/).