Article

The Mantle Structure of North China Craton and Its Tectonic Implications: Insights from Teleseismic P-Wave Tomography

1
State Key Laboratory of Earthquake Dynamics and Forecasting, Institute of Geology, China Earthquake Administration (CEA), Beijing 100029, China
2
Jilin Changbaishan Volcano National Observation and Research Station, Institute of Geology, China Earthquake Administration (CEA), Beijing 100029, China
3
School of Natural Sciences, Birkbeck, University of London, London WC1E 7HX, UK
4
College of Geoexploration Science and Technology, Jilin University, Changchun 130026, China
*
Author to whom correspondence should be addressed.
J. Mar. Sci. Eng. 2025, 13(4), 786; https://doi.org/10.3390/jmse13040786
Submission received: 9 February 2025 / Revised: 6 April 2025 / Accepted: 9 April 2025 / Published: 15 April 2025
(This article belongs to the Special Issue Advances in Ocean Plate Motion and Seismic Research)

Abstract

:
To study the mantle structure of the North China Craton (NCC) and its tectonic implications, in particular, the evolution of the rift systems in the Trans-North China Orogen (TNCO), we used teleseismic data recorded by 250 portable seismic stations to invert for the P-wave velocity (Vp) structures of the mantle beneath the NCC. Our results show a large-scale low-Vp anomaly in the shallow mantle and high-Vp anomalies in the deeper upper mantle beneath the eastern NCC, with fine-scale high-Vp anomalies at the lithosphere–asthenosphere boundary, indicating multi-stage lithospheric delamination during the Cenozoic. In the Yan Mountains (YanM), an east–west striking high-Vp anomaly between 60 to 200 km depths and low heat flow suggest the preservation of a thick mantle root. In the TNCO, high-Vp bodies in the upper mantle and the upper part of the mantle transition zone (MTZ) are imaged. The shallower high-Vp anomaly located beneath the Shanxi–Shaanxi Rift (SSR), along with an overlying local-scale low-Vp anomaly, indicates local hot material upwelling due to lithospheric root removal. The India–Eurasia collision’s far-field effects are proposed to cause lithospheric thickening, subsequent root delamination, and the formation and evolution of the SSR.

1. Introduction

The North China Craton (NCC), which completed its cratonization at ~1.85 Ga [1], remained tectonically stable until the Paleozoic. During the early Permian to late Triassic, the collision between the NCC and the South China Block following the closure of the paleo-Tethys ocean led to the formation of the Qinling–Dabie orogenic belt and the initiation of the Tanlu fault zone (Figure 1a) [2,3,4,5]. This fundamentally reconfigured East Asia’s tectonic framework. Structurally, the NCC is composed of three major tectonic units: the Eastern Block (ENCC), the Central Orogenic Belt (Trans-North China Orogen, TNCO), and the Western Block (WNCC) (Figure 1a) [6,7]. Since the Late Mesozoic, the ENCC experienced widespread lithospheric thinning from a thick (>180 km), cold (~40 mW/m2), and refractory lithospheric mantle to a thin (~60–100 km), hot (60–80 mW/m2) and fertile lithospheric mantle [8,9]. In contrast, the Ordos Block in the WNCC retains the attributes of cratonic stability, with a lithospheric thickness of ~200 km [8,10]. The TNCO exhibits significant variations in lithospheric thickness, ranging from ~80 to 200 km [9,10,11], with the thinnest lithosphere located in the Shanxi–Shaanxi Rift (SSR) [8,10,12]. It is generally accepted that the destruction of the ENCC was associated with the subduction of the paleo-Pacific and Pacific Plates [12,13,14,15,16]. However, the formation and evolution of the SSR remains unclear. Some studies suggest that it is associated with the westward subduction and rollback of the Pacific plate [12,17,18], while others propose that both Pacific plate subduction and the far-field effects from the India–Eurasia collision contribute to the intraplate magmatism and local extension of the SSR [11,19,20,21].
Many body-wave tomographic studies have been carried out to investigate the mantle structures beneath the NCC. However, due to the use of different data sets and inversion methods, significant discrepancies exist among different studies. By applying teleseismic tomography, Lei [24] observed a prominent high P-wave velocity (high-Vp) anomaly in the MTZ beneath the ENCC and the TNCO, interrupted by a gap beneath the Datong volcano. This gap may facilitate the upwelling of low-Vp material from the lower mantle, potentially fueling Datong’s intraplate volcanism. In contrast, some P-wave tomographic models suggest that the subducted Pacific Plate stagnates only in the MTZ beneath the ENCC, with the low-Vp anomaly extending no deeper than the 410 km discontinuity beneath Datong [12,16,18,25], implying a shallower origin for the volcanism. By jointly inverting local, regional, and teleseismic data, Tian et al. [16] identified isolated high-V anomalies in the upper mantle beneath the ENCC, which may represent detached fragments of the continental lithosphere. Some isolated high-V anomalies have also been imaged in the upper mantle and the MTZ beneath the TNCO, as evidenced by regional tomographic studies [12,26]. Due to the limited resolution (typically > 100 km), previous tomographic studies could not adequately image fine-scale structures, thereby hindering a comprehensive understanding of the region’s tectonic evolution. In this study, we conduct teleseismic P-wave tomography to investigate the detailed mantle structure beneath the NCC, which provides new insight into the origin of intraplate magmatism and the evolution of rift systems by using a dense temporary seismic array (Figure 1b) deployed in the ENCC and the northern TNCO.

2. Data and Methods

In this study, we used teleseismic data recorded by the dense temporary North China Seismic Array (Figure 1b). This array was deployed by the Institute of Geophysics, China Earthquake Administration, from October 2006 to March 2009. It comprised 250 seismic stations in total, including 190 broadband stations (equipped with Guralp CMG-3ESPC sensor and Refteck130B recorder, frequency bandwidth: 0.02–60 s), 10 very broadband stations (equipped with Guralp CMG-3T sensor and Refteck130B recorder, frequency bandwidth: 0.02–120 s), and 50 short-period stations. The station spacing is 10 km along the two primary linear profiles and around Tangshan City, and 35 km in other regions. We selected 727 earthquakes (Figure 2) with magnitudes greater than 5.5, epicentral distances between 30° and 90°, and recorded by more than 10 seismic stations in the study region. These events provided excellent azimuthal coverage (Figure 2). Relative travel-time residuals were obtained by applying the Multiple Channel Cross Correlation (MCCC) method [27] to high-quality teleseismic waveform data filtered with a 0.4–1.5 Hz bandpass. We used the IASP91 model [28] as the 1-D reference model and set a cross-correlation coefficient threshold of 0.83 to ensure the selection of high-quality relative delay times. Finally, 50,549 delay times were selected to invert the 3-D velocity structure beneath the study area.
Before tomographic inversion, we first analyze the average relative travel–time residuals at each station to infer the velocity structure beneath the study area. Figure S2 shows a clear correlation between the spatial pattern of negative and positive residuals and regional surface geological features. Negative travel–time residuals are observed at stations in the YanM and THM areas, which indicate a higher Vp in the upper mantle beneath these areas compared to the reference model. In contrast, for stations located to the west of THM, positive travel–time residuals are shown, indicating the existence of low-Vp anomalies in the upper mantle, such as those beneath the Datong volcanic field and the SSR area. The spatially alternating positive and negative travel–time residual pattern from southeast to northeast suggests the presence of significant lateral heterogeneities in the upper mantle beneath the NCC.
For the inversion, the model was parameterized using a grid of 180,880 nodes, spanning depths from the surface to 800 km (38 nodes), longitude between 101°E and 128°E (85 nodes), and latitude between 31°N and 50°N (56 nodes). In the inner region of the model (0–700 km in depth, 106°E–125°E in longitude, and 34°N–46°N in latitude), a fine grid is set with node spacings of 0.25° in both longitude and latitude and 20 km in depth, whereas in the outer regions of the model, the node spacings are increased to 1° in the horizontal direction and 50 km in depth. We perform the inversion by using the method of VanDecar (1991) [29].
In teleseismic tomography, seismic rays arrive at stations with nearly vertical incident angles, resulting in a general scarcity of crossing rays at shallow depths. This deficiency of crossing rays limits the constraints on crustal velocity structures. In the NCC, the crustal structure displays significant lateral heterogeneity [16,21,30,31]. To enhance the reliability of the resolved mantle structures, crustal correction is essential [32,33]. In the inversion, the relative travel–time residuals are simultaneously inverted for the slowness perturbations, station static terms, and source static terms. The station static terms absorb near-surface residual anomalies produced by crustal heterogeneities, while the source static terms absorb anomalies resulting from errors in seismic source location and heterogeneous structures situated outside the model domain. The unweighted travel time equation for the i t h ray is formulated as follows [29]:
P i j k 1 Δ s j k + h r k + e q k = Δ t i k 1
P i j k 1 = δ t i δ s j s = s k 1
Δ s j k is slowness perturbation at node j , h r k is time correction for station r at iteration k , e q k is time correction for event q at iteration k , and Δ t i k 1 is travel-time residual for i t h ray relative to the ( k 1 ) t h model.
The weighted system of linear equations at iteration k can be expressed as follows [29]:
W P W H W E λ F 0 0 Δ s k h k e k = W Δ t k 1 λ F i = 0 k 1 Δ s i
where
W i j = 1 σ i r e s 0 i = j i j
For the i t h seismic ray, if it was recorded by station r , then H i r = 1 ; otherwise, H i r = 0 ; if it originated from earthquake q , then E i q = 1 ; otherwise, E i q = 0 . W i j is the weighting matrix, σ i r e s is the standard deviation of the residuals and λ is the selected damping or smoothing parameter value. F is the Laplacian operator that minimizes the roughness of the tomographic model.
We selected optimal smoothing and flattening parameters by examining the trade-off between the root mean square (RMS) reduction of travel-time residuals (the percentage difference between the initial and final RMS misfit to the travel time equations) and RMS model roughness (Figure S3). We chose flattening and smoothing parameters of λ f l a t = 500 and λ s m o o t h = 7000 , respectively. The P-wave model provides an explanation for 90.5% (from 0.382 s to 0.0364 s) of the RMS relative arrival time residuals.

3. Results

3.1. Checkerboard Resolution Tests

To examine the resolution of our P-wave tomographic model, a series of checkerboard tests were performed (Figure 3, Figure 4 and Figures S3–S6). The checkerboard tests were composed of spheres described by Gaussian functions with alternating peak amplitudes of ±4% and diameters of 50 km, 60 km, and 70 km at depths of 100 km, 300 km, and 500 km, respectively. To simulate observation errors, Gaussian noise with a standard deviation of 0.03 s was added to the synthetic travel times. We inverted the synthetic data using the same model parameterization and inversion regularization parameters as used in the real inversion. The results of the checkerboard tests indicate that we can resolve features of ~50 km well (Figure 3 and Figure 4), although the recovered amplitude is better for checkerboard tests with resolution scales of 60 and 70 km (Figures S3–S6). Our results also show that the resolution of our model is best in the upper mantle directly beneath the network, and significant smearing occurs at depths of the MTZ, due to the limited network aperture and crossing rays.

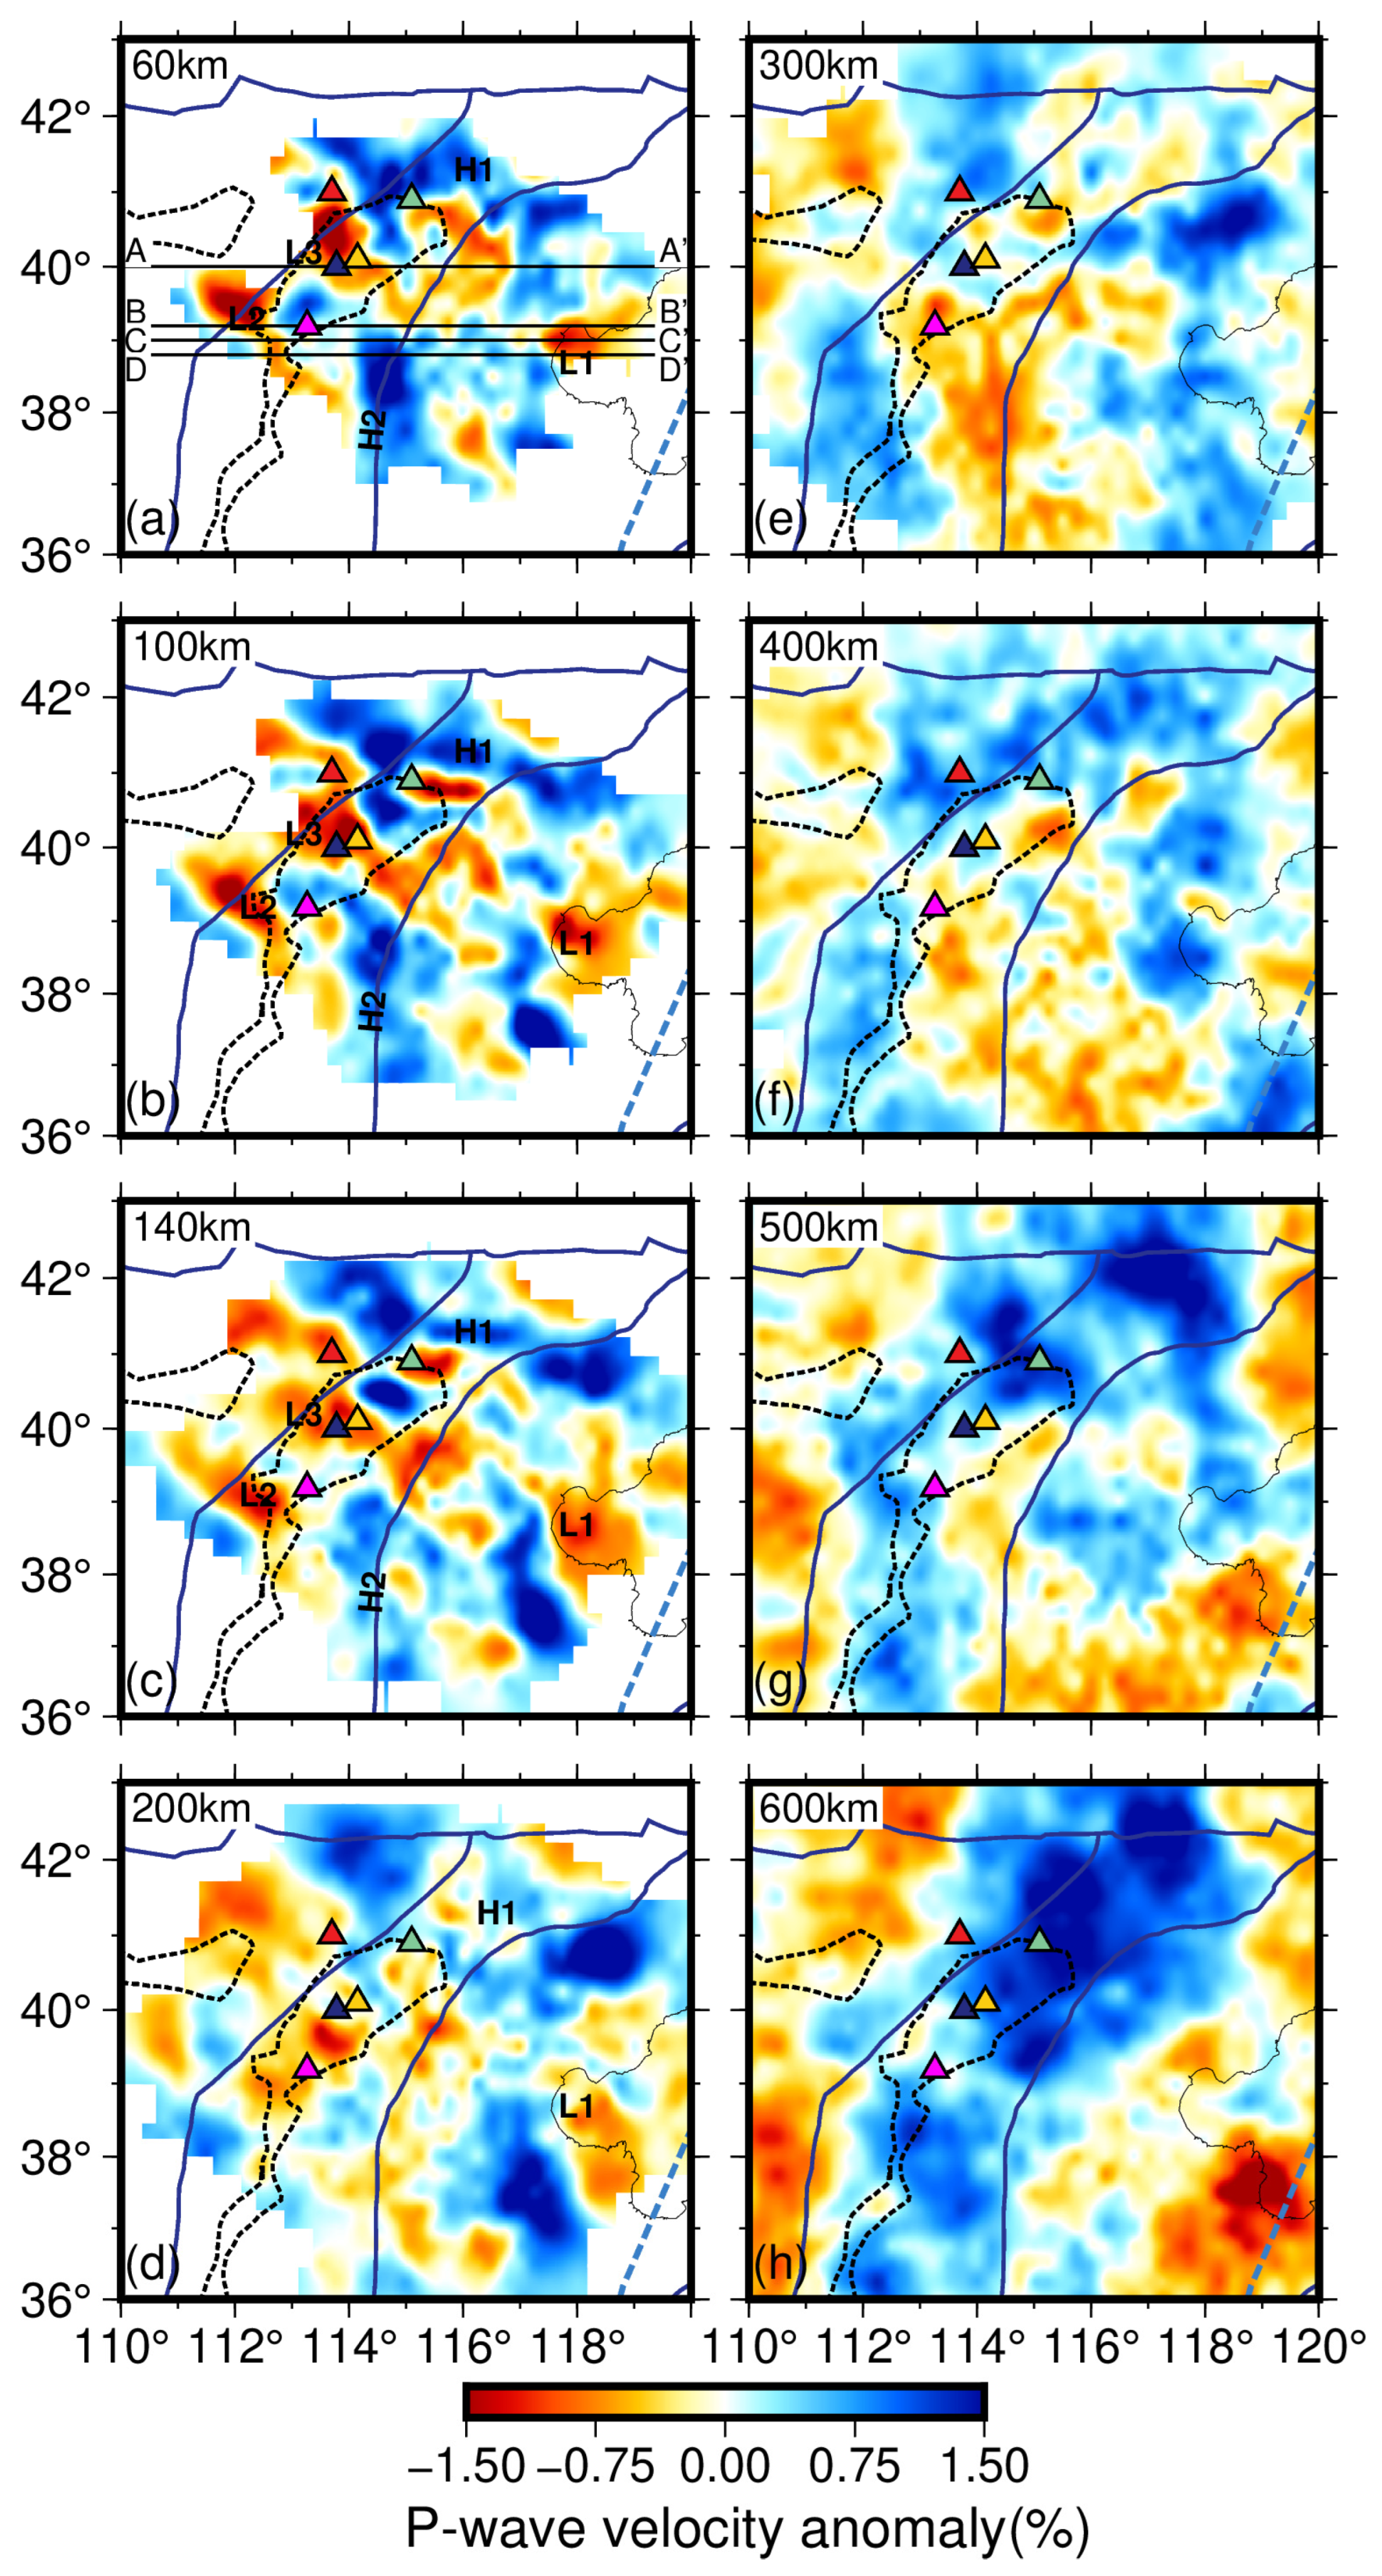
3.2. P-Wave Tomographic Model

Figure 5 and Figure 6 show map views and vertical cross sections of the obtained Vp tomographic model, respectively. Compared to previous tomographic studies [12,18,24,25,26,34,35], our model reveals some new structural features in the upper mantle beneath the NCC (Figure 5 and Figure 6), owing to the improved model resolution due to the use of data from a dense seismic array. Our results clearly show that high-Vp structures of varying spatial scales (H3–H7; Figure 6) are present at multiple depths beneath the NCC.
In the ENCC, a significant low-Vp anomaly (L1) is observed beneath the Bohai Bay (BHB) at depths of 60 to ~150 km (Figure 5 and Figure 6), which is underlain by high-Vp structures (H3–H5; Figure 6). In the north TNCO, a prominent NW-SE striking low-Vp anomaly (L3) is observed beneath the Datong volcanic field at depths from 60 to ~150 km (Figure 5a–d and Figure 6a). Another significant low-Vp anomaly (L2) is located southwest of the Datong volcanic field, extending from shallow depths to ~200 km (Figure 5 and Figure 6). A high-Vp anomaly is observed beneath the YanM (H1) at depths of 60 to 200 km. Similarly, the THM (H2) exhibits a pronounced high-Vp feature, trending from south to north at depths of 60–140 km. At greater depths, our P-wave tomographic model shows obvious high-Vp anomalies (H6 and H7; Figure 6). Due to the limited aperture of the network, our model lacks resolution in most parts of the WNCC.

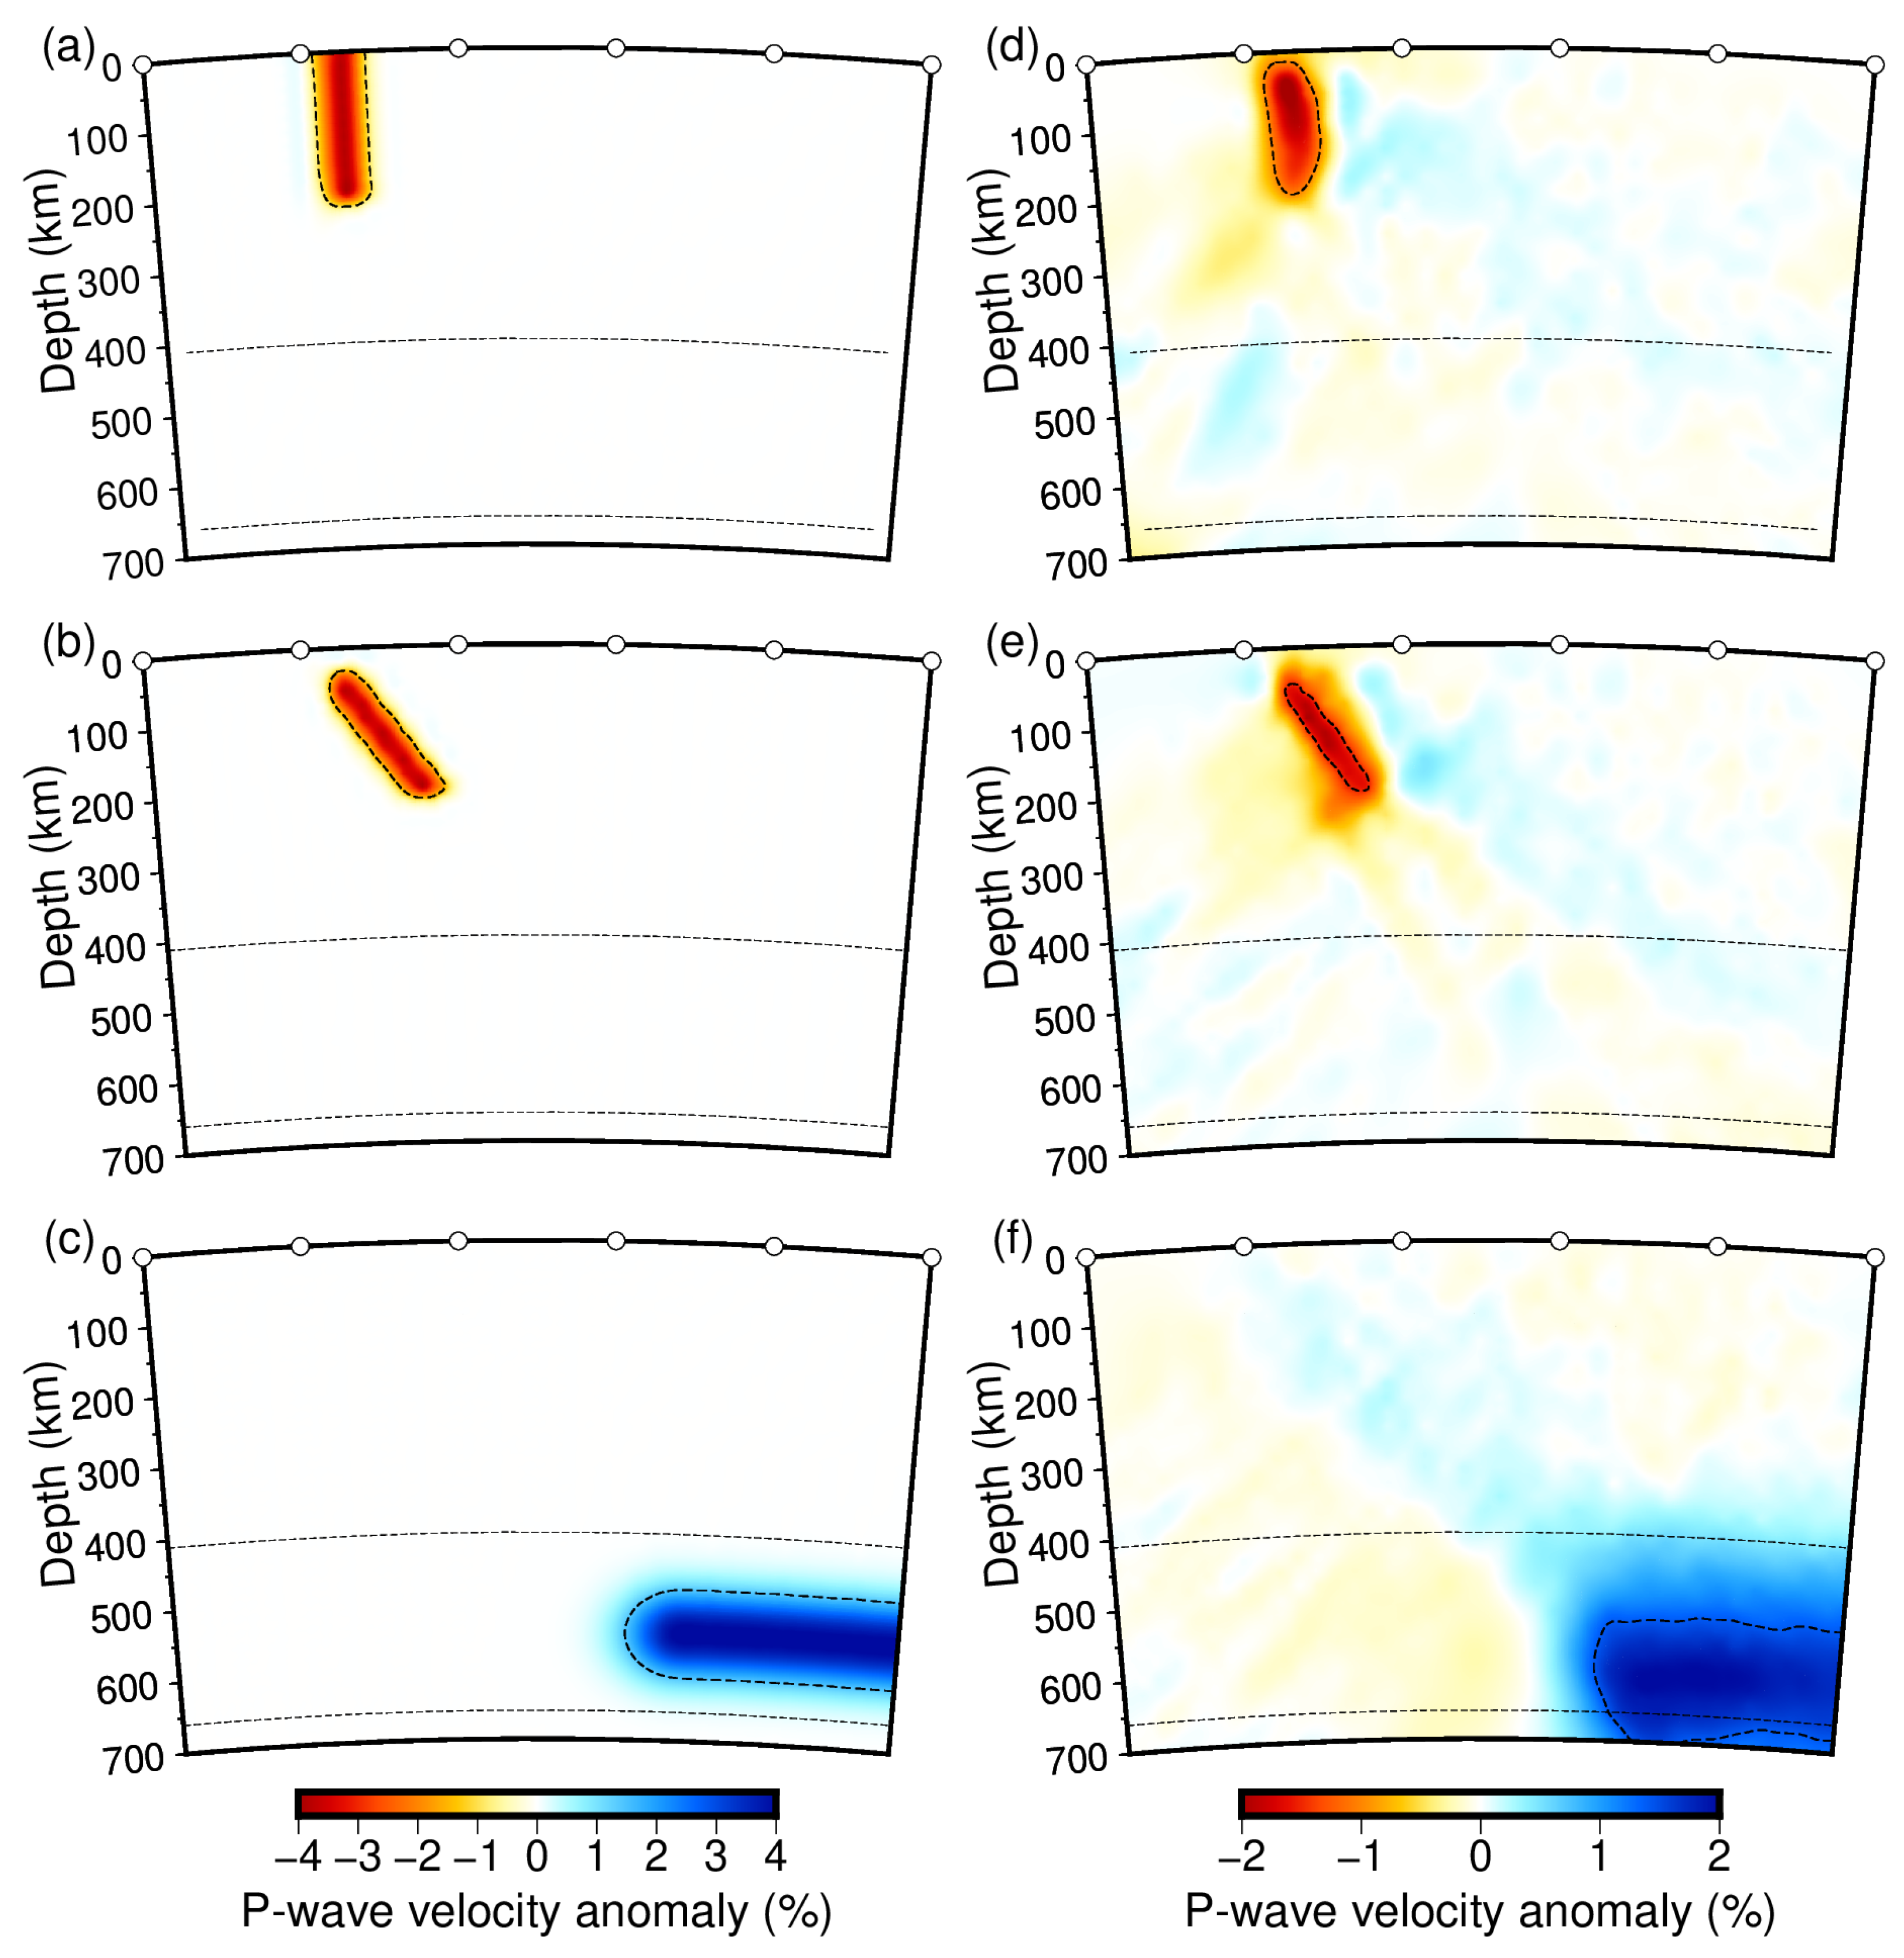
3.3. Synthetic Resolution Tests

To investigate the reliability of our Vp model, we conduct synthetic resolution tests to evaluate the robustness of the primary imaging features identified in this study. We generate a series of synthetic velocity models based on the structures shown in Figure 6, including an inclined low-Vp anomaly, a vertical low-Vp anomaly in the upper mantle, and a large high-Vp slab structure in the MTZ. We calculate synthetic travel times for the synthetic models and perform tomographic inversions using the same methodology as in the checkerboard tests. The test results indicate that the position and shape of the anomalies are well resolved (Figure 7), though some horizontal and vertical smearing occurs, along with incomplete amplitude recovery. The low-Vp anomalies in the upper mantle are well resolved, showing limited vertical smearing and lateral offset from their original location. The high-Vp anomaly in the MTZ is smeared by ~100–150 km, but its lateral position is well recovered (Figure 7d).

4. Discussion

Significant lateral variations in lithospheric thickness beneath the NCC have been revealed by S-wave receiver function and surface wave inversion studies [8,10,11,21,31,36,37]. The lithospheric thickness of the ENCC is about 60–100 km, significantly thinner than that of typical cratons worldwide. Petrological evidence shows that the lithospheric thickness was greater than 180 km in some areas of the ENCC in the Paleozoic [38,39], meaning that significant lithospheric modification and thinning occurred in the Mesozoic and Cenozoic. We find a large-scale low-Vp anomaly (L1) in the shallow mantle beneath the BHB, possibly reflecting a relatively warm lithosphere there compared to other regions of the NCC, which is consistent with the results of thermal modeling [40] and high surface heat flow observations. In the deeper part of the upper mantle, prominent high-Vp anomalies (H3 and H4) are observed below the ENCC. They are located under zones of a thinned lithosphere, which may represent remnants of delaminated lithospheric materials. The presence of high-Vp anomalies at these depths has also been suggested by previous tomographic studies [12,16,34,41]. In addition, our model shows there are some fine-scale high-Vp anomalies directly beneath the lithosphere–asthenosphere boundary, such as the one labeled H5. We ascribe it to lithospheric material recently removed from shallow depths, providing evidence for multi-stage lithospheric delamination occurring on a relatively localized scale beneath the ENCC during the Cenozoic.
The YanM exhibits a significant east–west striking high-Vp anomaly (H1) at depths ranging from 60 to 200 km (Figure 5a–d). This feature has also been resolved by previous surface wave tomography [21,30,31]. Given the low heat flow (~30–50 mW/m2) in this region [42,43], a thick lithospheric root may still be preserved beneath the YanM, indicating that this region has not undergone significant lithospheric thinning or destruction during the evolution of the NCC. This may explain the relative scarcity of strong earthquakes in this region.
In the TNCO, a significant feature unveiled by our new model is the presence of high-Vp bodies (H6 and H7) in the upper mantle and the upper part of the MTZ. Results of absolute travel time tomography suggest that the western edge of the stagnant Pacific slab is located at ~116–120° E in the MTZ beneath the NCC [16,18,25], which has not yet subducted beneath the TNCO. This is supported by receiver function studies showing that there is a normal MTZ thickness of approximately 250 km beneath the TNCO [10,44,45] rather than a thickened MTZ as would be expected if a cold slab were present. Therefore, we ascribe H7 to the recycled continental lithosphere, which has descended into the MTZ. Notably, H6 is located directly beneath the SSR (Figure 6b–d), where both the crust and lithosphere are thinner than its surrounding regions, with the thinnest lithosphere found in the north part of the SSR as revealed by receiver function studies [9,10]. Our tomographic images clearly show that a local-scale low-Vp anomaly (L2) exists right beneath the SSR and extends to a depth of at least 200 km (Figure 6c,d). Synthetic resolution tests indicate that it is a reliable feature that can be resolved by our data sets and tomographic method (Figure 7). We suggest it represents the local upwelling of hot materials in response to the removal of the lithospheric root. Two high-Vp anomalies (H6 and H7) are imaged at different depths, possibly corresponding to delamination events that occurred during different periods. These processes would have induced sustained upwelling of asthenospheric materials along the lithospheric topographic boundary, thereby promoting local extension and facilitating the formation of the SSR. Geological studies indicate that the onset of sedimentation in the SSR began almost synchronously with crustal thickening, rapid uplift, and east–west directed extension in the NE Tibetan Plateau (TP) during the Cenozoic [46,47]. We suggest that the far-field effects of the India–Eurasia collision led to the lithospheric thickening, forming an orogenic root beneath the TNCO. Subsequent partial delamination of the root triggers local extension, leading to the formation and evolution of the SSR. To the north of SSR, a large-scale low-Vp anomaly (L3) is present beneath the Datong volcano and extends to ~200 km depth. The low-Vp anomaly beneath the Datong volcano is likely associated with the local upwelling of hot materials, consistent with the uplift of the lithosphere–asthenosphere boundary, as suggested in studies by Li et al. [48] and Zheng et al. [10].

5. Conclusions

In this study, we inverted the teleseismic data recorded by 250 seismic stations to obtain a high-resolution Vp model to better understand the Cenozoic tectonic evolution of the NCC. Our results reveal significant lateral heterogeneities in the lithospheric structure beneath the NCC, showing strong spatial correlations with major tectonic units. We find a prominent low-Vp anomaly in the shallow mantle beneath the ENCC, which overlies small-scale high-Vp structures at depths. These results imply that a hot lithosphere exists beneath the ENCC, which may have undergone progressive delamination during the Cenozoic. In the TNCO, a fine-scale low-Vp anomaly is observed directly beneath the SSR, underlain by two small-scale high-Vp structures in the deeper upper mantle and the MTZ. Such configuration may reflect complex lithospheric processes involving both continental lithosphere recycling and localized asthenospheric upwelling. The far-field effects of the India–Eurasia collision have played a crucial role in driving lithospheric thickening, partial delamination, and the subsequent formation and evolution of the SSR. These findings provide new insights into the tectonic evolution and lithospheric dynamics of the NCC.

Supplementary Materials

The following supporting information can be downloaded at: https://www.mdpi.com/article/10.3390/jmse13040786/s1. Figure S1. A teleseismic event used for cross-correlation analysis. Figure S2. Distribution of mean relative travel-time residuals at each station. Figure S3. Trade-off curve between model roughness and residual reduction with varying damping and smoothing parameters. Figure S4. Checkerboard resolution tests for P-wave model with a sphere radius of 60 km and ±4% peak velocity anomaly. Figure S5. Cross sections of the checkerboard model with a sphere radius of 60 km and ±4% peak velocity anomaly. Figure S6. Checkerboard resolution tests for P-wave model with a sphere radius of 70 km and ±4% peak velocity anomaly. Figure S7. Cross sections of the checkerboard model with a sphere radius of 70 km and ±4% peak velocity anomaly.

Author Contributions

Conceptualization, W.W.; software, J.O.S.H. and W.Y.; formal analysis, W.W. and J.O.S.H.; data curation, W.Y. and W.W.; writing—original draft preparation, W.Y.; writing—review and editing, W.W., J.O.S.H., C.H., H.T. and H.H.; visualization, W.Y.; funding acquisition, W.W. and W.Y. All authors have read and agreed to the published version of the manuscript.

Funding

This research was funded by the Special Fund of the State Public Institute for Basic Research (IGCEA1711), the National Natural Science Foundation of China (41874110, 42274136, 42072330), and the China Scholarship Council (202204190003).

Data Availability Statement

The raw data used in this study were requested from the International Earthquake Science Data Center (www.esdc.ac.cn (accessed on 9 April 2025), Network name: T0).

Acknowledgments

Figures were plotted using the Generic Mapping Tools [49].

Conflicts of Interest

The authors declare no conflicts of interest.

References

  1. Zhao, G.; Wilde, S.A.; Cawood, P.A.; Sun, M. Archean Blocks and Their Boundaries in the North China Craton: Lithological, Geochemical, Structural and P–T Path Constraints and Tectonic Evolution. Precambrian Res. 2001, 107, 45–73. [Google Scholar] [CrossRef]
  2. Zhang, K.; Cai, J.; Zhu, J. North China and South China Collision: Insights from Analogue Modeling. J. Geodyn. 2006, 42, 38–51. [Google Scholar] [CrossRef]
  3. Oh, C.W. A New Concept on Tectonic Correlation between Korea, China and Japan: Histories from the Late Proterozoic to Cretaceous. Gondwana Res. 2006, 9, 47–61. [Google Scholar] [CrossRef]
  4. Rogers, J.J.W.; Santosh, M. Continents and Supercontinents; Oxford University Press, Inc.: Oxford, UK, 2004; ISBN 0-19-516589-6. [Google Scholar]
  5. Zhang, Y.; Dong, S. Mesozoic Tectonic Evolution History of the Tan-Lu Fault Zone: Advances and New Understanding. Geol. Bull. China 2008, 27, 1371–1390. [Google Scholar]
  6. Replumaz, A.; Tapponnier, P. Reconstruction of the Deformed Collision Zone between India and Asia by Backward Motion of Lithospheric Blocks. J. Geophys. Res. Solid Earth 2003, 108, 2285. [Google Scholar] [CrossRef]
  7. Li, S.; Li, X.; Wang, G.; Liu, Y.; Wang, Z.; Wang, T.; Cao, X.; Guo, X.; Somerville, I.; Li, Y.; et al. Global Meso-Neoproterozoic Plate Reconstruction and Formation Mechanism for Precambrian Basins: Constraints from Three Cratons in China. Earth Sci. Rev. 2019, 198, 102946. [Google Scholar] [CrossRef]
  8. Chen, L.; Tao, W.; Zhao, L.; Zheng, T. Distinct Lateral Variation of Lithospheric Thickness in the Northeastern North China Craton. Earth Planet. Sci. Lett. 2008, 267, 56–68. [Google Scholar] [CrossRef]
  9. Chen, L. Lithospheric Structure Variations between the Eastern and Central North China Craton from S- and P-Receiver Function Migration. Phys. Earth Planet. Inter. 2009, 173, 216–227. [Google Scholar] [CrossRef]
  10. Zheng, T.; Duan, Y.; Xu, W.; Ai, Y.; Chen, L.; Zhao, L.; Zhang, Y.; Xu, X. A Crust-Upper Mantle Seismic Wave Velocity Structure Model for North China, Version 2.0. 2017. Available online: http://www.craton.cn/data (accessed on 1 June 2021).
  11. Jiang, M. Local Modification of the Lithosphere beneath the Central and Western North China Craton: 3-D Constraints from Rayleigh Wave Tomography. Gondwana Res. 2013, 24, 849–864. [Google Scholar] [CrossRef]
  12. Xu, X.; Zhao, L.; Wang, K.; Yang, J. Indication from Finite-Frequency Tomography beneath the North China Craton: The Heterogeneity of Craton Destruction. Sci. China Earth Sci. 2018, 61, 1238–1260. [Google Scholar] [CrossRef]
  13. Zhu, R.; Chen, L.; Wu, F.; Liu, J. Timing, scale and mechanism of the destruction of the North China Craton. Sci. China Earth Sci. 2011, 41, 583–592. [Google Scholar] [CrossRef]
  14. Zhu, R.; Yang, J.; Wu, F. Timing of Destruction of the North China Craton. Lithos 2012, 149, 51–60. [Google Scholar] [CrossRef]
  15. Wu, F.; Xu, Y.; Zhu, R.; Zhang, G. Thinning and destruction of the cratonic lithosphere: A global perspective. Sci. China Earth Sci. 2014, 44, 2358–2372. [Google Scholar] [CrossRef]
  16. Tian, Y.; Zhao, D.; Sun, R.; Teng, J. Seismic Imaging of the Crust and Upper Mantle beneath the North China Craton. Phys. Earth Planet. Inter. 2009, 172, 169–182. [Google Scholar] [CrossRef]
  17. Northrup, C.J.; Royden, L.H.; Burchfiel, B.C. Motion of the Pacific Plate Relative to Eurasia and Its Potential Relation to Cenozoic Extension along the Eastern Margin of Eurasia. Geology 1995, 23, 719. [Google Scholar] [CrossRef]
  18. Huang, J.; Zhao, D. High-resolution Mantle Tomography of China and Surrounding Regions. J. Geophys. Res. Solid Earth 2006, 111, 2005JB004066. [Google Scholar] [CrossRef]
  19. Xu, X.; Ma, X. Geodynamics of the Shanxi Rift System, China. Tectonophysics 1992, 208, 325–340. [Google Scholar] [CrossRef]
  20. Liu, M.; Cui, X.; Liu, F. Cenozoic Rifting and Volcanism in Eastern China: A Mantle Dynamic Link to the Indo–Asian Collision? Tectonophysics 2004, 393, 29–42. [Google Scholar] [CrossRef]
  21. Feng, J.K.; Yao, H.J.; Chen, L.; Li, C.L. Ongoing Lithospheric Alteration of the North China Craton Revealed by Surface-Wave Tomography and Geodetic Observations. Geophys. Res. Lett. 2022, 49, e2022GL099403. [Google Scholar] [CrossRef]
  22. Zhang, Y.; Ma, Y.; Yang, N.; Shi, W.; Dong, S. Cenozoic Extensional Stress Evolution in North China. J. Geodyn. 2003, 36, 591–613. [Google Scholar] [CrossRef]
  23. Liu, R.; Chen, W.; Sun, J.; Li, D. The K–Ar Age and Tectonic Environment of Cenozoic Volcanic Rock in China; The Age and Geochemistry of Cenozoic Volcanic Rocks in China; Seismological Press: Beijing, China, 1992; ISBN 7-5028-0624-5. [Google Scholar]
  24. Lei, J. Upper-mantle Tomography and Dynamics beneath the North China Craton. J. Geophys. Res. Solid Earth 2012, 117, 2012JB009212. [Google Scholar] [CrossRef]
  25. Ma, J.; Tian, Y.; Zhao, D.; Liu, C.; Liu, T. Mantle Dynamics of Western Pacific and East Asia: New Insights from P Wave Anisotropic Tomography. Geochem. Geophys. Geosyst. 2019, 20, 3628–3658. [Google Scholar] [CrossRef]
  26. Zhao, L.; Allen, R.M.; Zheng, T.; Zhu, R. High-resolution Body Wave Tomography Models of the Upper Mantle beneath Eastern China and the Adjacent Areas. Geochem. Geophys. Geosyst. 2012, 13, 2012GC004119. [Google Scholar] [CrossRef]
  27. VanDecar, J.C.; Crosson, R.S. Determination of Teleseismic Relative Phase Arrival Times Using Multi-Channel Cross-Correlation and Least Squares. Bull. Seismol. Soc. Am. 1990, 80, 150–169. [Google Scholar]
  28. Kennett, B.L.N.; Engdahl, E.R. Traveltimes for Global Earthquake Location and Phase Identification. Geophys. J. Int. 1991, 105, 429–465. [Google Scholar] [CrossRef]
  29. VanDecar, J.C. Upper-Mantle Structure of the Cascadia Subduction Zone from Non-Linear Teleseismic Travel Time Inversion. Ph.D. Thesis, Univeristy of Washington, Seattle, WA, USA, 1991. [Google Scholar]
  30. Wang, W.; Wu, J.; Fang, L. High Resolution Rayleigh Wave Phase Velocity Tomography in Northern North China. Geophys. J. Int. 2012, 189, 647–658. [Google Scholar] [CrossRef]
  31. Xu, X.; Li, G.; Ding, Z.; Huang, X. S-Wave Velocity Structure of the Crust and Upper Mantle beneath the North China Craton Determined by Joint Inversion of Rayleigh-Wave Phase Velocity and Z/H Ratio. Seismol. Res. Lett. 2022, 93, 2176–2188. [Google Scholar] [CrossRef]
  32. Ekström, G.; Dziewonski, A.M. The Unique Anisotropy of the Pacific Upper Mantle. Nature 1998, 394, 168–172. [Google Scholar] [CrossRef]
  33. Li, C.; Van Der Hilst, R.D.; Toksöz, M.N. Constraining P-Wave Velocity Variations in the Upper Mantle beneath Southeast Asia. Phys. Earth Planet. Inter. 2006, 154, 180–195. [Google Scholar] [CrossRef]
  34. Xu, P.; Zhao, D. Upper-Mantle Velocity Structure beneath the North China Craton: Implications for Lithospheric Thinning. Geophys. J. Int. 2009, 177, 1279–1283. [Google Scholar] [CrossRef]
  35. Hu, G.; Teng, J.; He, Z.; Ding, Z. A Traveltime Tomography Study by Teleseismic S Wave Data in the Northeastern Part of North China Craton. Chin. J. Geophys. 2017, 60, 1703–1712. [Google Scholar] [CrossRef]
  36. Chen, L.; Jiang, M.; Yang, J.; Wei, Z.; Liu, C.; Ling, Y. Presence of an Intralithospheric Discontinuity in the Central and Western North China Craton: Implications for Destruction of the Craton. Geology 2014, 42, 223–226. [Google Scholar] [CrossRef]
  37. Cai, Y.; Wu, J.; Rietbrock, A.; Wang, W.; Fang, L.; Yi, S.; Liu, J. S Wave Velocity Structure of the Crust and Upper Mantle Beneath Shanxi Rift, Central North China Craton and Its Tectonic Implications. Tectonics 2021, 40, e2020TC006239. [Google Scholar] [CrossRef]
  38. Griffin, B.; Andi, Z.; O’Reilly, S.; Ryan, C. Phanerozoic Evolution of the Lithosphere beneath the Sino-Korean Craton. In Mantle Dynamics and Plate Interactions in East Asia; Amer Geophysical Union: Washington, DC, USA, 1998; pp. 107–126. ISBN 0-87590-529-3. [Google Scholar]
  39. Menzies, M.A.; Fan, W.; Zhang, M. Palaeozoic and Cenozoic Lithoprobe and the Loss of >120 km of Archean Lithosphere, Sino-Korean Craton, China. In Magmatic Processes and Plate Tectonics; Geological Society, London, Special Publications: London, UK, 1993; Volume 76, pp. 71–81. [Google Scholar]
  40. Liu, Q.; He, J. Tectono-Thermal Modeling of the Bohai Bay Basin since the Cenozoic. Chin. J. Geophys. 2019, 62, 219–235. [Google Scholar] [CrossRef]
  41. Zhang, F.; Li, Y.; Wu, Q.; Ding, Z. The P Wave Velocity Structure of Upper Mantle beneath the North China and Surrounding Regions from FMTT. Chin. J. Geophys. 2011, 54, 1233–1242. [Google Scholar] [CrossRef]
  42. Jiang, G.; Hu, S.; Shi, Y.; Zhang, C.; Wang, Z.; Hu, D. Terrestrial Heat Flow of Continental China: Updated Dataset and Tectonic Implications. Tectonophysics 2019, 753, 36–48. [Google Scholar] [CrossRef]
  43. Hu, S.; He, L.; Wang, J. Heat Flow in the Continental Area of China: A New Data Set. Earth Planet. Sci. Lett. 2000, 179, 407–419. [Google Scholar] [CrossRef]
  44. Sun, M.; Gao, S.S.; Liu, K.H.; Fu, X. Upper Mantle and Mantle Transition Zone Thermal and Water Content Anomalies beneath NE Asia: Constraints from Receiver Function Imaging of the 410 and 660 Km Discontinuities. Earth Planet. Sci. Lett. 2020, 532, 116040. [Google Scholar] [CrossRef]
  45. Xu, X. New Constraints on Structures of the Mantle Transition Zone beneath the Trans-North China Orogen and Western North China Craton Revealed by Receiver Functions. J. Asian Earth Sci. 2023, 245, 105554. [Google Scholar] [CrossRef]
  46. Su, P.; He, H.; Tan, X.; Liu, Y.; Shi, F.; Kirby, E. Initiation and Evolution of the Shanxi Rift System in North China: Evidence From Low-Temperature Thermochronology in a Plate Reconstruction Framework. Tectonics 2021, 40, e2020TC006298. [Google Scholar] [CrossRef]
  47. Yin, A.; Kapp, P.A.; Murphy, M.A.; Manning, C.E.; Mark Harrison, T.; Grove, M.; Lin, D.; Xi-Guang, D.; Cun-Ming, W. Significant Late Neogene East-West Extension in Northern Tibet. Geology 1999, 27, 787. [Google Scholar] [CrossRef]
  48. Li, S.; Guo, Z.; Chen, Y.J.; Yang, Y.; Huang, Q. Lithospheric Structure of the Northern Ordos From Ambient Noise and Teleseismic Surface Wave Tomography. J. Geophys. Res. Solid Earth 2018, 123, 6940–6957. [Google Scholar] [CrossRef]
  49. Wessel, P.; Luis, J.F.; Uieda, L.; Scharroo, R.; Wobbe, F.; Smith, W.H.F.; Tian, D. The Generic Mapping Tools Version 6. Geochem. Geophys. Geosyst. 2019, 20, 5556–5564. [Google Scholar] [CrossRef]
Figure 1. (a) Topographic map of the North China Craton (NCC) and adjacent areas. The red rectangle shows the present study region. Triangles show the distribution of Cenozoic basalts (red: Jining, Miocene; green: Hannuoba, Miocene; blue: Datong, Quaternary; yellow: Yangyuan, Oligocene; purple: Fanshi, Oligocene) [22,23]. Blue solid lines show the NCC boundaries. Blue and black dashed lines mark the Tanlu fault and rifts, respectively. Black solid line indicates the coastline. Abbreviations of rifts: SSR: Shanxi–Shaanxi Rift; YHR: Yinchuan–Hetao Rift. Abbreviations of mountains: THM: Taihang Mountains; YanM: Yan Mountains; YinM: Yin Mountains. BHB: Bohai Bay; ENCC: eastern NCC; TNCO: Trans-North China Orogen; WNCC: western NCC. In the inset map, blue rectangle shows the region of (a), and the red solid lines (with triangles) denote the major plate boundaries. IP: India Plate; PSP: Philippine Sea Plate; PP: Pacific Plate; TP: Tibetan Plateau (b) Distribution of seismic stations (lilac-colored rhombuses) used in this study.
Jmse 13 00786 g001
Figure 2. Earthquakes used in this study. The red star denotes the study region, and the three concentric circles denote epicentral distances of 30°, 60°, and 90°.
Jmse 13 00786 g002
Figure 3. Checkerboard resolution tests for P-wave model. (ac) Depth slices of the input checkerboard model at 100, 300, and 500 km depth, respectively. Gaussian spheres with a 50 km radius and ±4% peak velocity anomaly are distributed in layers of 100, 300 and 500 km depth. (df) The retrieved checkerboard model at 100, 300, and 500 km depth, respectively. Blue solid lines show the NCC boundaries. Blue and black dashed lines mark the Tanlu fault and rifts, respectively. Colored triangles show the distribution of Cenozoic basalts (Figure 1).
Jmse 13 00786 g003
Figure 4. (a,b) Cross sections of the input checkerboard model along profiles A–A’ and B–B’. (c,d) Cross sections of the retrieved checkerboard model along profiles A–A’ and B–B’. Black dashed lines mark the locations of 410 km and 660 km discontinuities.
Jmse 13 00786 g004
Figure 5. Map views of P-wave tomography at depths of (a) 60 km, (b) 100 km, (c) 140 km, (d) 200 km, (e) 300 km, (f) 400 km, (g) 500 km and (h) 600 km. The color bar is shown at the bottom. Blue solid lines show the NCC boundaries. Blue and black dashed lines mark the Tanlu fault and rifts, respectively. H1–H2: high-Vp anomalies; L1–L3: low-Vp anomalies. Colored triangles show the distribution of Cenozoic basalts (Figure 1). Black solid lines (AA’–DD’) indicate the locations of the cross sections shown in Figure 6.
Jmse 13 00786 g005
Figure 6. (ad) Vertical cross sections of P-wave tomography, with their locations shown in Figure 5a. The surface topography is plotted on the top of each cross section. Colored triangles show the major magmatic centers in the area. Green dashed lines show the lithosphere–asthenosphere boundary (LAB, Zheng et al. [10]). Red dashed lines show the 410 km and 660 km discontinuities measured by Zheng et al. [10], and black dashed lines mark the locations of 410 km and 660 km discontinuities. The color bar is shown at the bottom. H2–H7: high-Vp anomalies; L1–L3: low-Vp anomalies.
Jmse 13 00786 g006
Figure 7. Synthetic resolution tests for P-wave model. (ac) Cross sections of the input synthetic models. (df) Cross sections of the retrieved synthetic models. The color bar is labeled at the bottom. Black dashed lines mark the locations of 410 km and 660 km discontinuities.
Jmse 13 00786 g007
Disclaimer/Publisher’s Note: The statements, opinions and data contained in all publications are solely those of the individual author(s) and contributor(s) and not of MDPI and/or the editor(s). MDPI and/or the editor(s) disclaim responsibility for any injury to people or property resulting from any ideas, methods, instructions or products referred to in the content.

