Article

Experimental Study on the Hole-Forming Process at the Borehole Bottom During Hot Water Drilling in Ice and Its Influence Mechanisms

1
Institute for Polar Science and Engineering, Jilin University, Changchun 130012, China
2
School of Engineering and Technology, China University of Geosciences, Beijing 100083, China
3
College of Geoexploration Science and Technology, Jilin University, Changchun 130026, China
*
Authors to whom correspondence should be addressed.
J. Mar. Sci. Eng. 2025, 13(4), 817; https://doi.org/10.3390/jmse13040817
Submission received: 23 March 2025 / Revised: 14 April 2025 / Accepted: 17 April 2025 / Published: 20 April 2025
(This article belongs to the Section Ocean Engineering)

Abstract

:
Hot water drilling is a drilling method that employs high-temperature and high-pressure hot water jetting to achieve ice melting drilling. Characterized by rapid drilling speed and large hole diameter, it is widely used for drilling observation holes in polar ice sheets and ice shelves. Understanding the hole-enlargement process at the bottom of hot water-drilled holes is crucial for rationally designing the structure of hot water drills. However, due to the complexity of heat transfer processes, no suitable theoretical model currently exists to accurately predict this process. To address this, this paper establishes an experimental platform for hot water drilling and conducts 24 sets of experiments under different drilling parameters using visualization techniques. The study reveals the influence mechanisms of drilling speed, hot water flow rate, hot water temperature, downhole drill shape, and nozzle structure on the hole-forming process at the borehole bottom. Experimental results indicate that the primary hole enlargement occurs near the nozzle, achieving 69–81% of the theoretical maximum borehole diameter. The thermal melting efficiency at the borehole bottom is approximately 80%, with about 20% of the input hot water energy heating the surrounding ice. Under identical hot water parameters, jet shapes and drill shapes exhibit minimal impact on borehole geometry. But the improvement of the jet speed and hot water temperature can accelerate the hole-forming process.

1. Introduction

Ice drilling serves as a core technical method for establishing direct access through ice sheets and obtaining ice core and subglacial samples. The commonly used ice drilling methods include mechanical drilling, electric thermal drilling, and hot water drilling. Mechanical drilling is often used to obtain ice core samples, and electric thermal drilling is often used in shallow drilling. Hot water drilling, acknowledged as the fastest ice penetration technique [1], has been widely utilized for borehole camera observations [2,3,4], installation of borehole sensors [5,6], and collection of sub-ice shelf samples [7,8,9]. This method transports high-temperature, high-pressure hot water through hoses to a downhole drill for jetting and ice melting, while cooled water returns to the surface through the borehole for recycling.
Since its development in the 1950s, over 30 types of hot water drills have been engineered globally for diverse polar and glacial applications. The Laboratory of Glaciology and Geophysics Environment of France conducted systematic hot water drilling in Alpine glaciers from 1972 to 1986, creating hundreds of 40–250 m deep boreholes for ice thickness and temperature measurements [10,11]. Between 1987 and 1988, Greenland Geological Survey operations achieved cumulative drilling depths exceeding 5657 m, with individual boreholes reaching 390 m and a drilling speed of 125–200 m/h, representing the highest documented hot water drilling speed [12]. Between 2004 and 2011, the U.S. IceCube Project implemented a deep hot water drilling system at the South Pole [13], completing 86 boreholes at approximately 2500 m depth to deploy neutrino detectors, establishing the deepest hot water drilling records [14]. Recent Antarctic subglacial exploration initiatives have driven innovations in clean hot water drilling technologies [15,16], enabling successful access to Subglacial Lakes Whillans and Mercer for subglacial water sampling [17]. China is currently developing a hot water drilling system with a 3600-m-class depth capability, with planned scientific drilling operations targeting the Subglacial Lake Qilin in Princess Elizabeth Land [18].
Hot water drilling technology has become indispensable in polar expeditions, glacier studies, and subglacial lake exploration due to its operational efficiency and environmental compatibility. Nevertheless, theoretical understanding of this technology lags significantly behind its practical applications. Early theoretical work by Taylor et al. established energy conservation-based relationships between drilling parameters (hot water temperature, flow rate, drilling speed) and borehole diameter under the idealized assumption of 100% thermal efficiency in ice melting [19]. Thorsteinsson subsequently expanded this framework by modeling hot water jet temperatures at the borehole bottom, incorporating hose heat losses, and analyzing depth-dependent variations in water temperature and borehole diameter under varying surface input conditions [20]. Liu Gang et al. further developed theoretical models for shallow ice melting, calculating critical operational thresholds including minimum flow rates, required pumping pressures, and initial water temperatures for different borehole diameters, while quantifying system energy consumption [21]. Although these theories can account for the variation of the average or maximum borehole diameter with respect to drilling parameters, they are unable to predict the evolution process of the borehole. L. Greenler et al. advanced modeling efforts by incorporating meltwater-ice heat exchange, predicting transient diameter changes during drilling, enlargement, and cooling phases [22]. Compared with the results of field experiments, it was found that the predicted results of the model within the first tens of meters from the bottom of the borehole were significantly smaller. Most recently, Zhao et al. investigated multi-nozzle jetting hot-water drilling with near-bottom circulation [23], though their findings are not fully applicable to conventional hot water drilling.
The hot water drilling process involves complex multi-physics coupling, particularly near the borehole bottom, where flow and temperature fields are influenced by drill shape, high-velocity hot water jets, and ice temperature gradients. While existing models provide theoretical guidance for selecting overall drilling parameters (e.g., flow rate, pressure, temperature), none can accurately predict the dynamic diameter expansion process at the borehole bottom. A comprehensive understanding of this process is critical for rationally designing hot water downhole drill structures.
To investigate the hole-forming process at hot water borehole bottoms, this study establishes an experimental platform for hot water drilling. Visualization techniques are employed to document the complete evolution of borehole geometry, specifically analyzing the influence of hot water temperature, flow rate, drilling speed, and jet parameters on the dynamic melting process. The research results will provide theoretical guidance for rationally designing hot water drills.

2. Experimental Methods

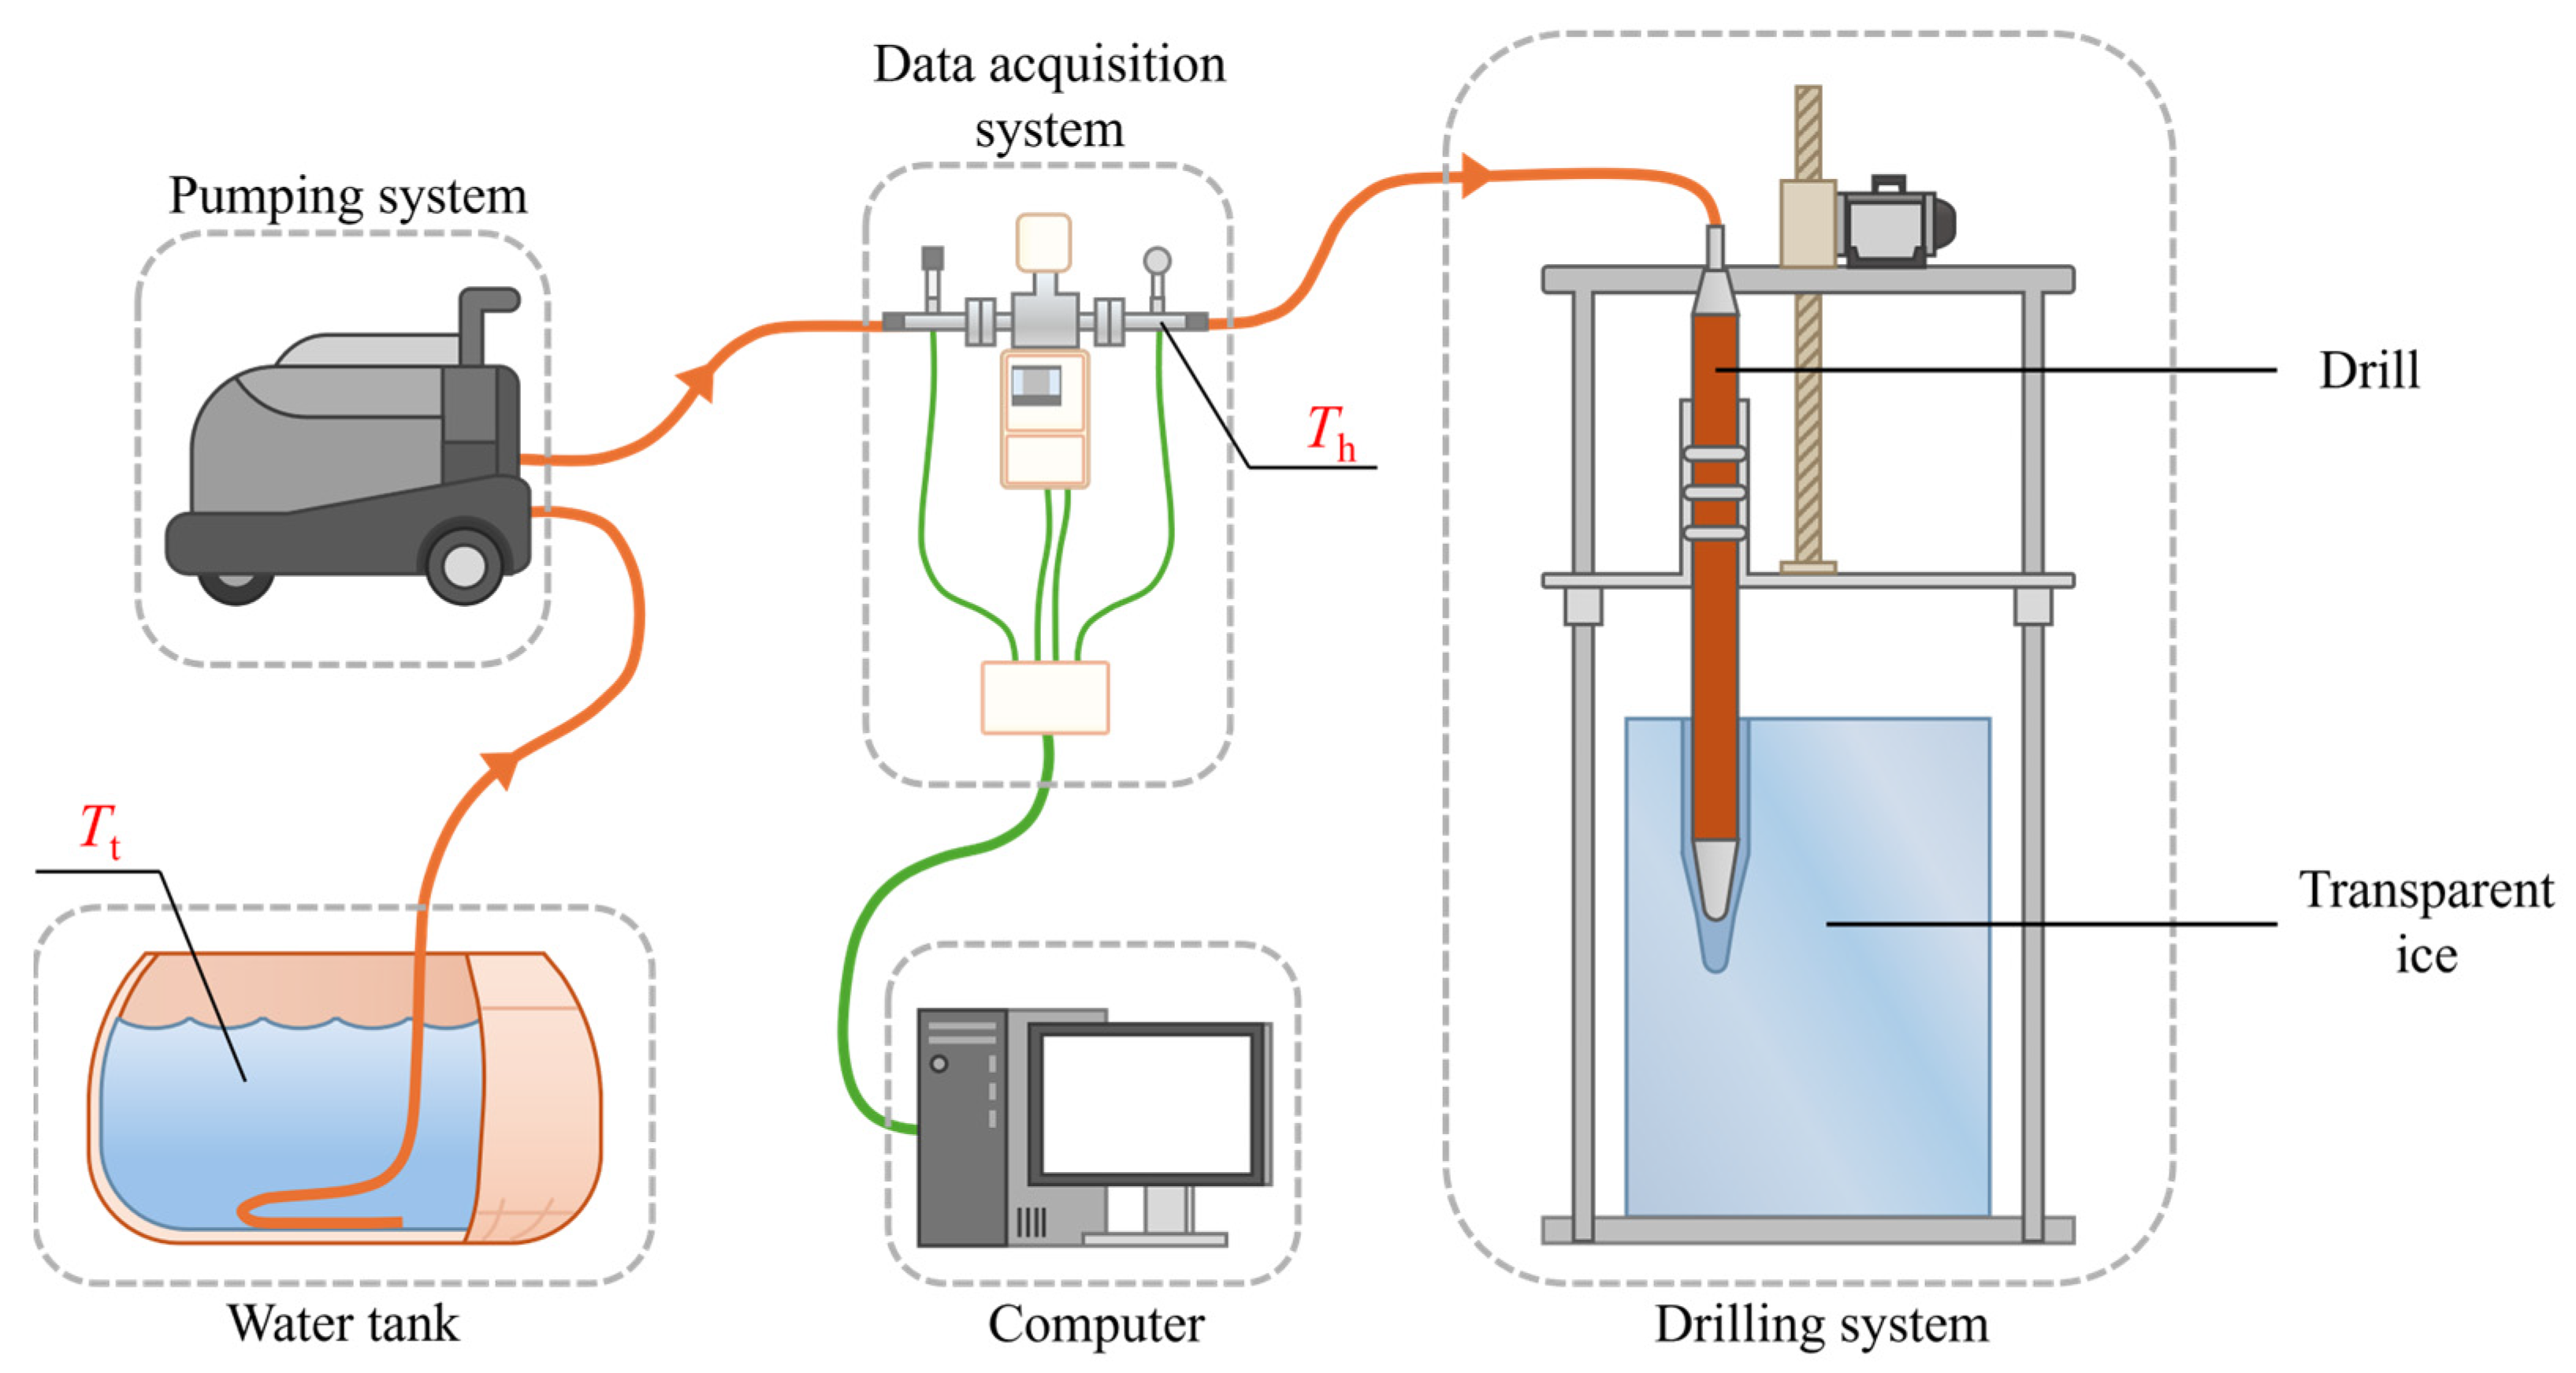
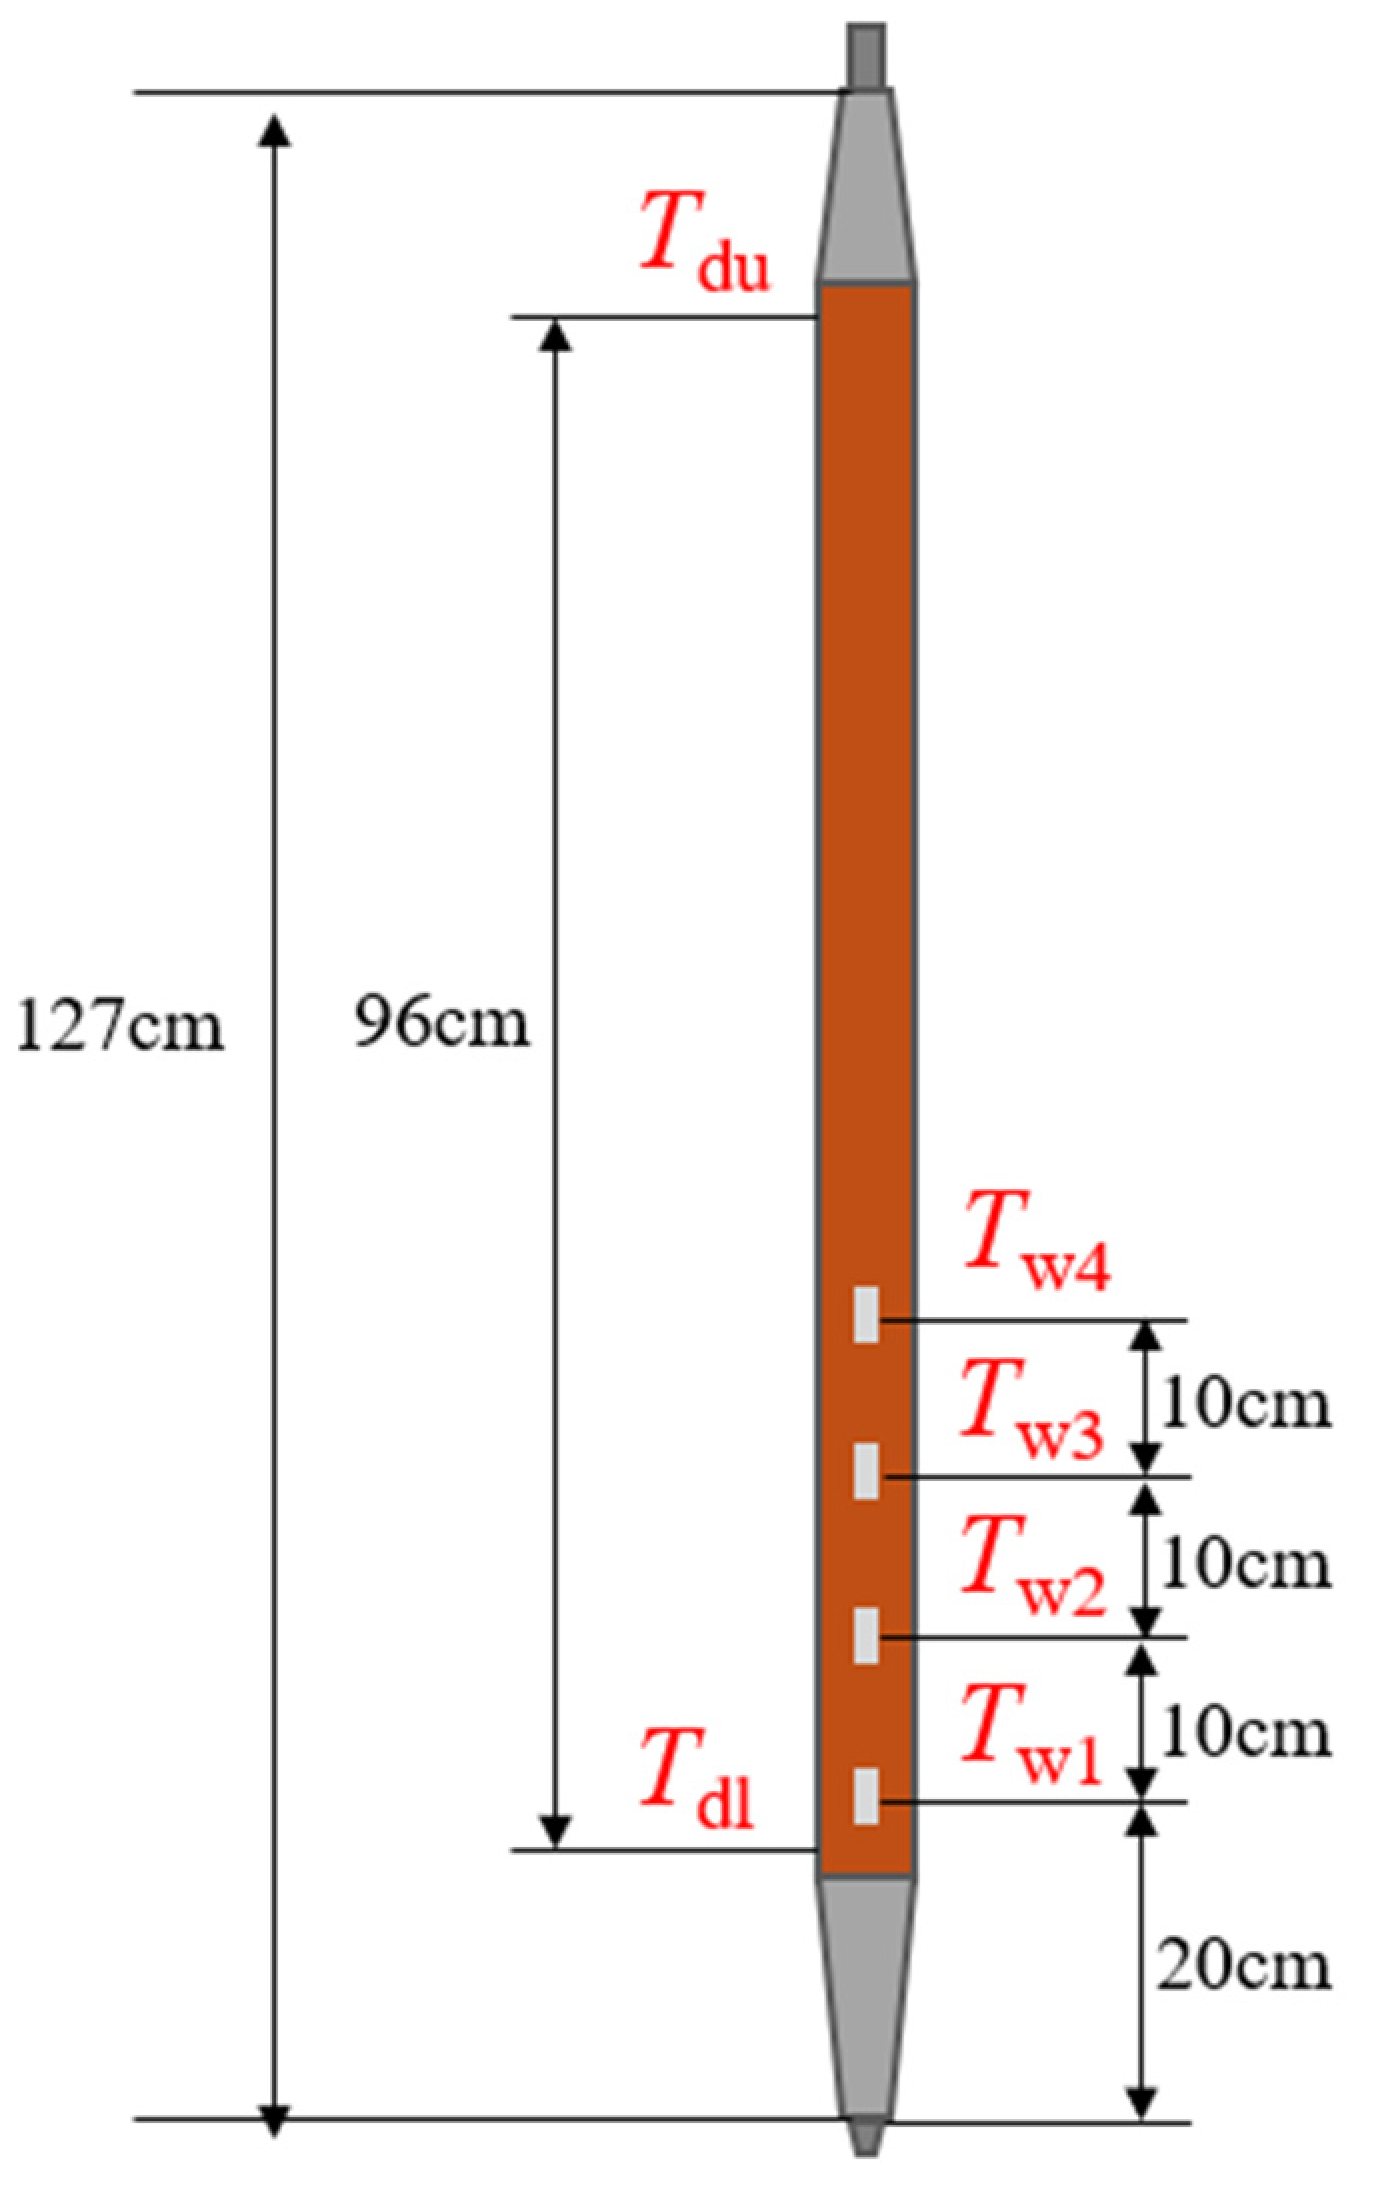
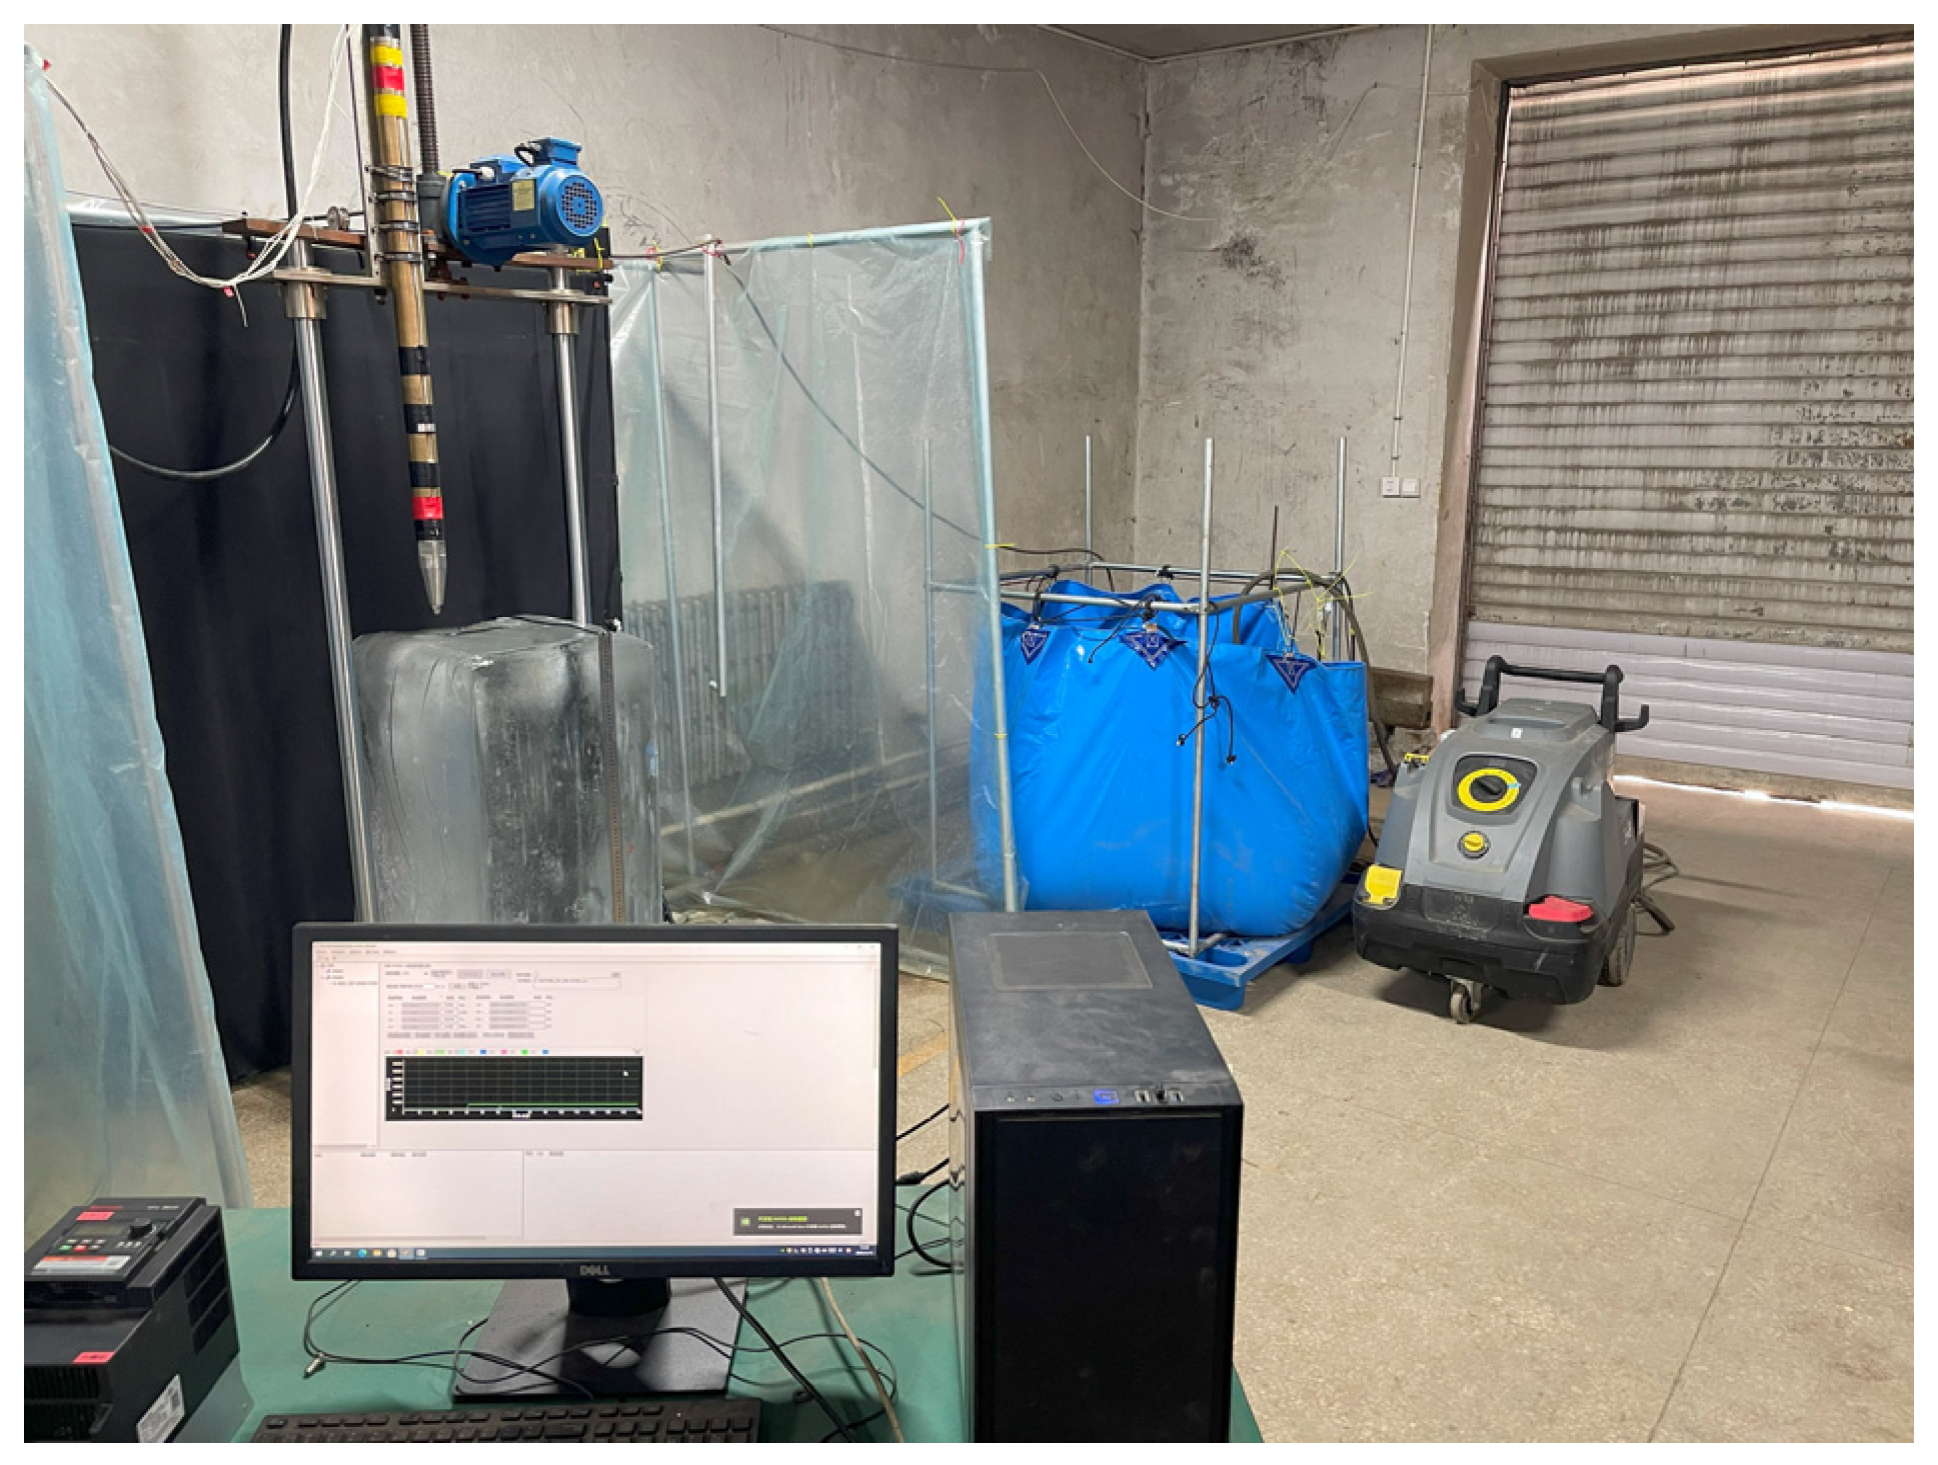
2.1. Experimental Platform

The hot water drilling experimental platform consists of seven primary components: a water tank, pumping system, data acquisition system, computer, drilling system, drill, and transparent ice, as shown in Figure 1. Heated water is stored in the water tank and delivered through the pumping system to the drill, which conducts drilling experiments on transparent ice blocks placed on the test bench. The system supports interchangeable nozzles of varying apertures and types, with adjustable hot water temperature, flow rate, and drilling speed, enabling experimental configurations with single or combined variables. Real-time operational data from all components are monitored and recorded by the data acquisition system.
The pumping system utilizes a Karcher HDS 7/16 C high-pressure hot water cleaner (Alfred Kärcher GmbH&Co., Winnenden, Germany), providing a maximum flow rate of 12 L/min and a maximum working pressure of 16 MPa. A three-way valve is installed between the cleaner and the drill to regulate the drilling flow rate. The drilling system employs a frame structure with a variable-frequency speed-controlled worm gear lift mounted at the top, driving the vertical movement of the drill. This mechanism offers a maximum stroke of 1 m, a drilling speed range of 0–50 m/h, and a control accuracy of 0.05 m/h. The drill mounting plate moves vertically through linear bearings aligned with cylindrical guide rails on both sides. A sliding platform at the base holds transparent ice blocks measuring 0.5 m × 0.5 m × 1 m. The brass drill, constructed with a 20-mm inner diameter and 60-mm outer diameter cross-section, incorporates precision-machined rectangular slots within its lateral surfaces to accommodate temperature sensor cable. The hose and nozzle are connected to both terminal ends of the brass drill body via stainless steel hydraulic fittings.
The data acquisition system comprises electromagnetic flowmeters, pressure transmitters, temperature transmitters, and displacement sensors to collect real-time data on hot water flow rate, pressure, temperature, drilling speed, and drilling depth. Detailed specifications of these sensors are provided in Table 1. Eight temperature sensors are installed as follows: two monitor the water tank temperature (Tt) and pipeline water temperature (Th) (Figure 1); two screw-type temperature sensors measure internal water temperatures at the upper (Tdu) and lower (Tdl) ends of the drill; and four additional sensors (Tw1, Tw2, Tw3, Tw4) are mounted externally on the drill to track return water temperature changes in the borehole. The sensor installation positions on the drill are shown in Figure 2. All sensor data are displayed in real time and stored in the host computer by DAM-3000 (Version 6.38.154) software through RS485 communication.

2.2. Experimental Plan

Twenty-four experiments were designed using a single-variable approach to investigate the influence mechanism of parameters such as drilling speed, hot water flow rate, temperature, drill shape, nozzle aperture, and jet shape on the hole-forming process of the borehole. The experimental design incorporated two parts with multiple groups in each, respectively, to systematically evaluate effects from both structural design and drilling parameters upon drilling performance, which includes nozzle types of solid cone and straight, nozzle diameters of 1.5 mm, 2.0 mm, 2.5 mm, and 3.0 mm; and extension rods with length of 10 cm, 15 cm, 20 cm, 30 cm to be installed between the drill and nozzle to investigate flow field modifications and assess bottom geometry effects on hole formation dynamics. Additional groups tested drilling speeds of 6 m/h, 8 m/h, 10 m/h, and 12 m/h; hot water flow rates from 4 L/min to 10 L/min to minimize flow fluctuations under high-flow, high-pressure conditions; and temperature variations between 20 °C and 60 °C. All parameter selections are based on the parameters used for existing glaciers and polar hot water drills.

2.3. Experimental Procedure and Data Processing Methods

Before each experiment, the water circulation system was activated to preheat the pipeline and drill. A 20 cm deep pilot hole was drilled on the ice block surface using a carpenter’s drill to facilitate drill insertion for submerged jet operations. Drainage channels were created on the ice surface to remove return water during drilling and prevent overflow-induced erosion. Throughout the process, the data acquisition system recorded operational parameters while a high-definition camera continuously captured video footage. To enhance the visibility of the ice-water interface, the dye was added to the drilling water, and a calibrated ruler was fixed near the observation surface for dimensional reference. The experimental system is shown in Figure 3.
After completing the experiments, by performing screengrab processing on the drilling videos captured after drilling parameters stabilized, borehole shape images at different drilling times and depths were obtained. These images were processed using Adobe Photoshop® 2024 (Version 25.0.0) software to derive borehole boundary profiles. The processed data were then imported into MATLAB® R2023a (Version 9.14.0) for coordinate transformation, generating digitized borehole geometries as illustrated in Figure 4.

3. Results and Discussion

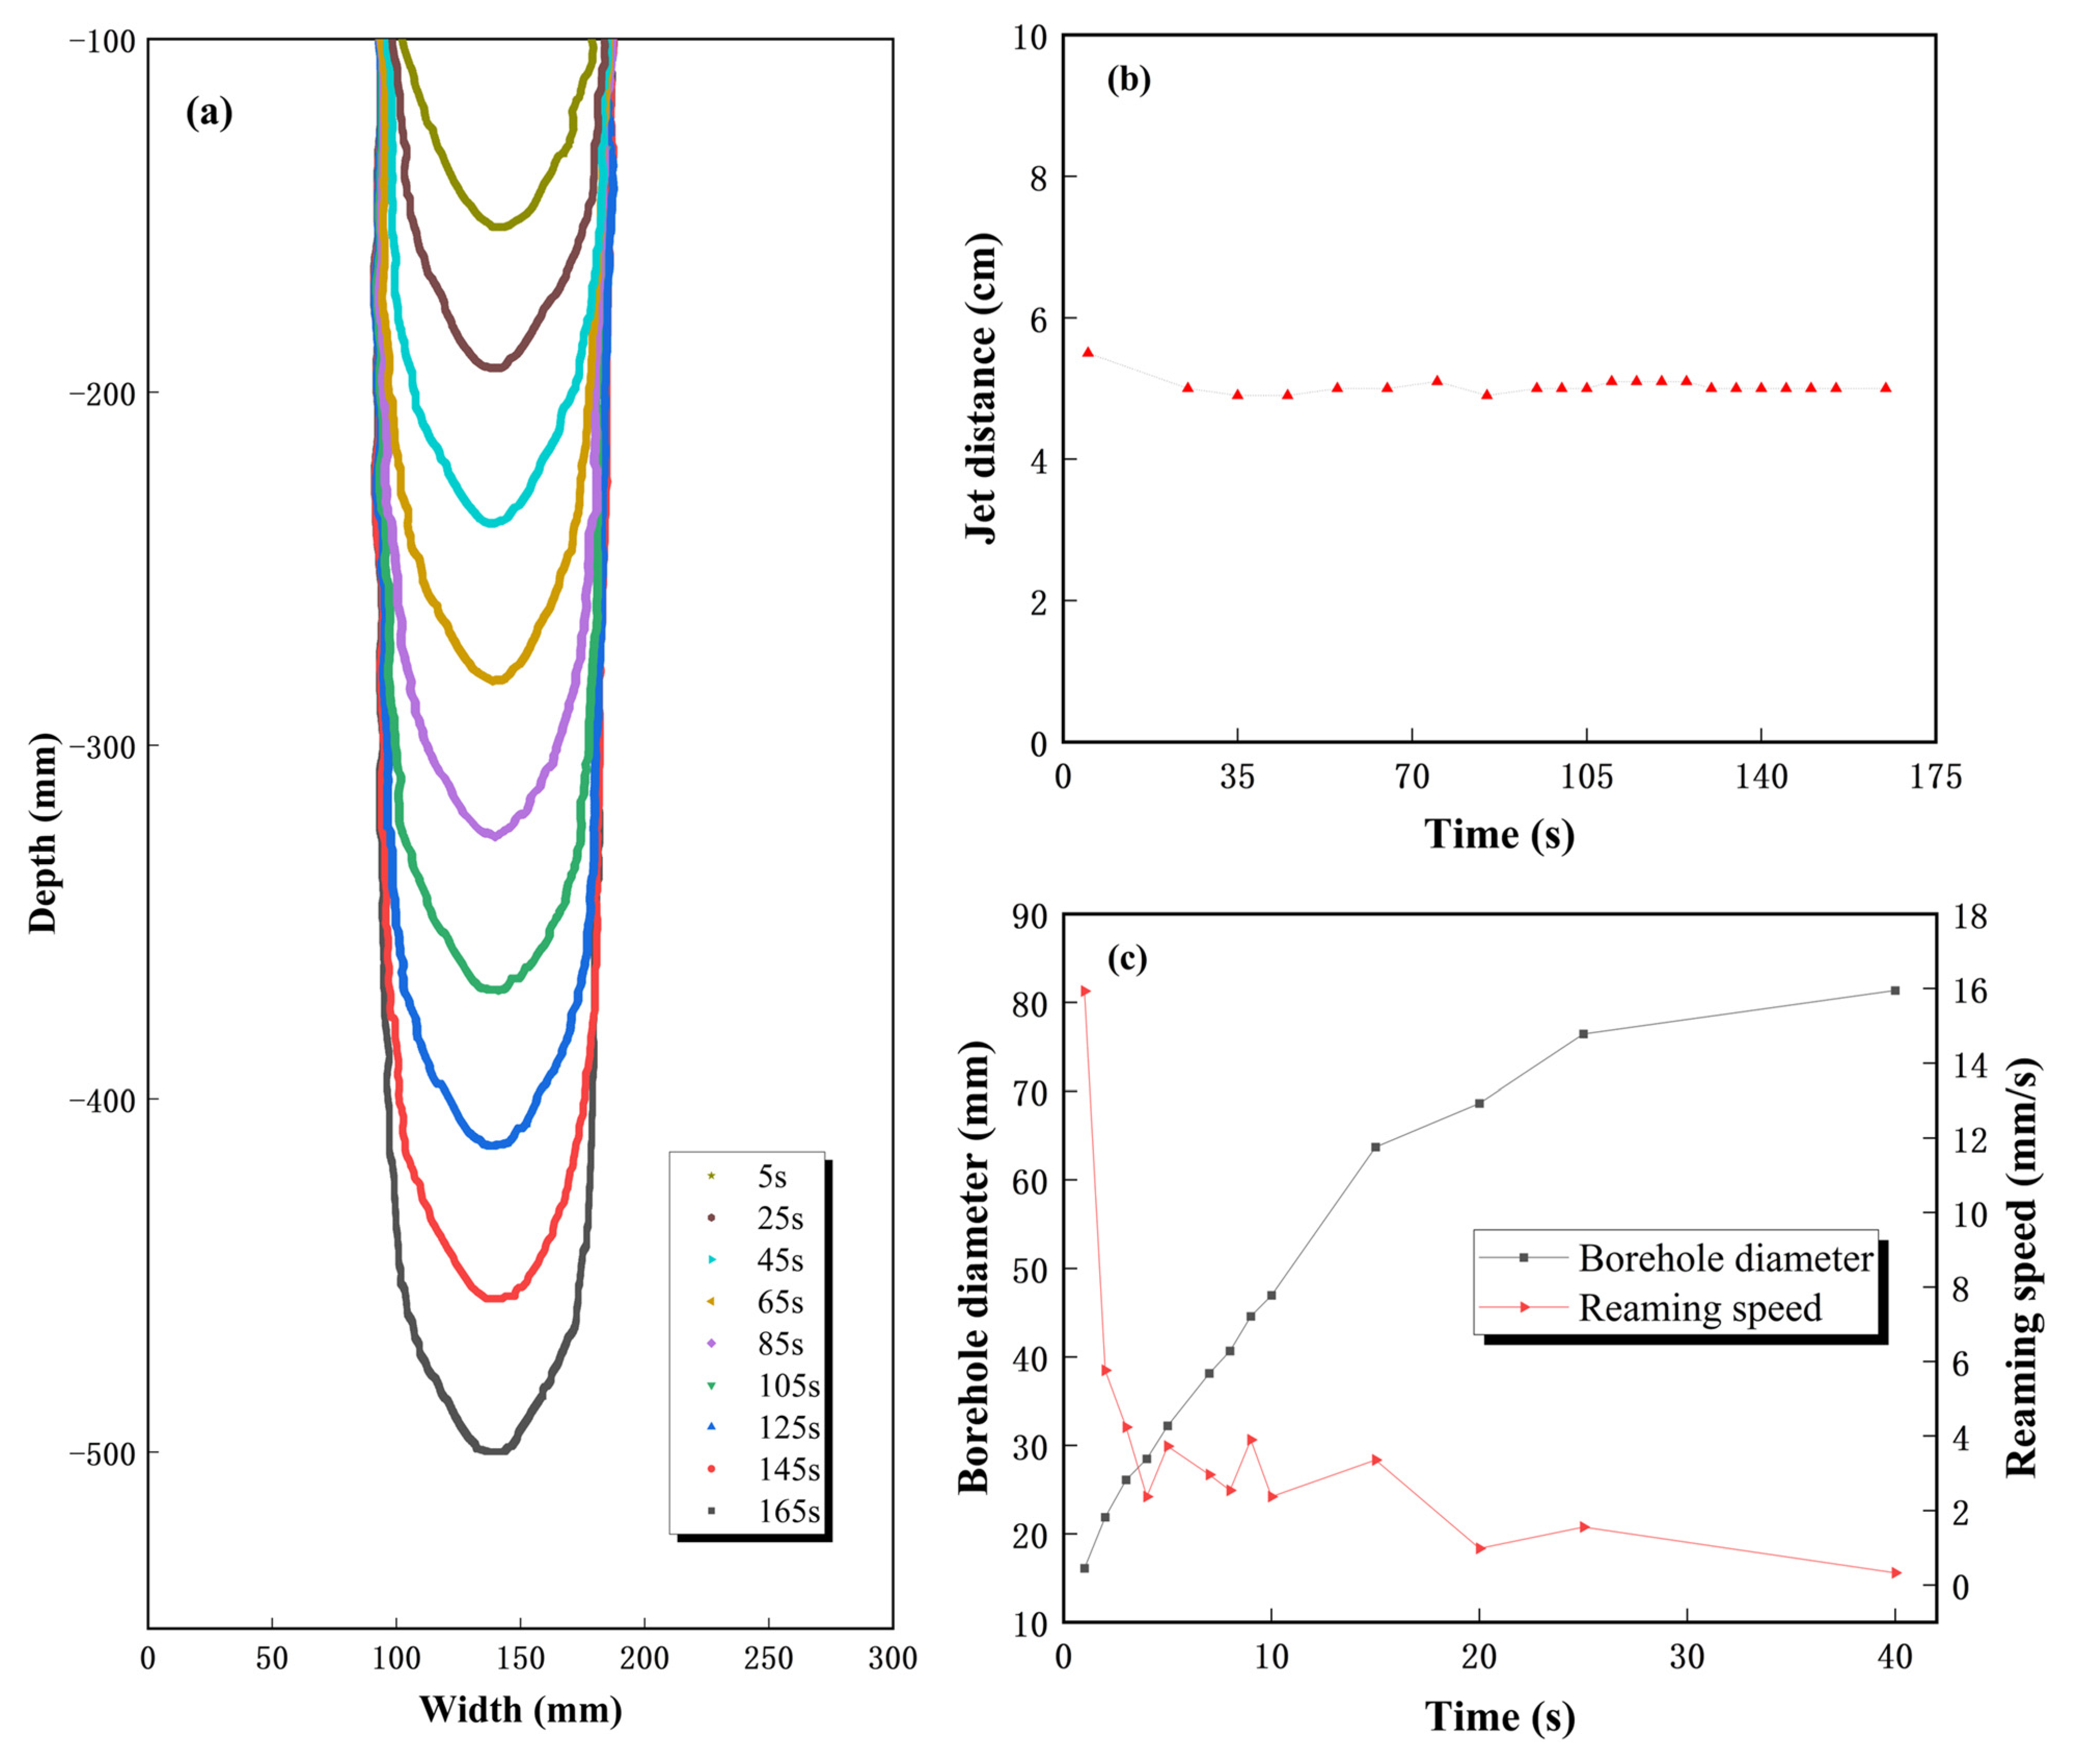
3.1. Analysis of Ice Melting Process at Borehole Bottom

Twenty-four hot water drilling experiments under varied operational parameters were systematically conducted using the method above, successfully documenting the temporal evolution of borehole morphology through visual recordings.
To analyze the hole-forming process during hot water drilling, experiment #17 was selected as an example, and the drilling parameter data were analyzed. The time-varying curves of water temperature at each node, hot water pressure, and flow rate during drilling are shown in Figure 5. It can be seen from the figure that the water flow rate, jet pressure, and temperature of the tank exhibited stable values throughout the drilling operations. However, substantial temperature gradients developed along the pipeline during the initial phase, primarily attributed to thermal dissipation through the pipeline and copper drill assembly. Post 16 s of initial drilling, the temperature rise rate decelerated to 0.7 °C/min, culminating in a maximum cumulative temperature differential of 1.7 °C by process completion. Externally mounted temperature sensors on the drill initially registered elevated values that progressively decreased to meltwater-equilibrium levels as the drill penetrated into the borehole water. Due to the influence of sensor detection accuracy, installation method, and heat transfer of drilling tools, although the data from various temperature sensors do not well present the cooling process of hot water in the hole from bottom to top, it is impossible to obtain the true temperature distribution of hot water in the hole. However, these sensor data can still basically reflect the temperature of molten water in the hole.
To visually track borehole geometry evolution, hot water drilling images were systematically captured at equal time intervals (Figure 6). The jet distance (Dj)—defined as the distance between the nozzle and borehole bottom—serves as a key indicator of drilling stability. Stabilization of this parameter confirms equilibrium attainment in both hydrodynamic and thermal conditions at the phase-change interface, marking the establishment of steady-state drilling. Image analysis revealed distinct diameter evolution patterns between borehole segments during the drilling process. The upper section maintained a comparatively smaller diameter from initial penetration through process completion, influenced by pilot hole effects, borehole mouth pumping operations, and transient parameter variations. Conversely, the lower borehole demonstrated consistent radial expansion following parameter stabilization. Upon reaching steady operational conditions, the stabilized borehole bottom geometry moved downward synchronously with drill advancement. Following stabilization, borehole morphology images were acquired at 20-s intervals. Digitization processing generated time-dependent plots of borehole geometry and jet distance evolution, as shown in Figure 7a,b. The jet distance stabilized at ~50 mm throughout observations. Final measurements documented three critical dimensions: 96.0 mm diameter at nozzle elevation, 98.6 mm at 300 mm above borehole bottom, and a maximum diameter of 99.3 mm. This indicates that the borehole diameter at the nozzle location accounted for 96.7% of the maximum observed diameter within the measurement range.
To quantitatively evaluate the temporal variations of borehole diameter at specific depths, the reaming speed is defined as the increment in borehole diameter per unit time. The borehole diameter data at different times for a drilling depth of 400 mm were processed, and curves depicting borehole diameter and reaming speed versus drilling time at 400 mm depth were plotted, as shown in Figure 7c. Results demonstrate that upon hot water jet arrival at this depth, rapid ice melting occurred beneath the nozzle due to direct scouring by high-temperature jets. The reaming speed exceeded 15.9 mm/s within the initial 2 s period. Subsequently, this speed decreased rapidly as the jet became entrained with meltwater and ascended through the borehole, declining to 2.37 mm/s at 10 s and further diminishing below 1 mm/s after 20 s.
To quantitatively evaluate the heat loss during the process of ice melting at the bottom of the borehole, the energy input to the bottom of the borehole and the actual energy consumed by ice melting at the bottom of the borehole were calculated based on the drilling parameters during testing and the measured shape of the borehole. The energy balance equations [21] are formulated as follows:
Q = q ρ w C w T b T f ,
Q m e l t = π D a v g 2 v 4 ρ i ( l i + C w T f + ϵ T i C i )
where Q is the total heat input from hot water, J; Qmelt is the heat consumed for ice melting at the borehole bottom; J, q is the volumetric flow rate of hot water, m3/h; ρw is the density of hot water, 1000 kg/m3; Cw is the specific heat capacity of water, 4200 J/(kg·K); Tb is the hot water jet temperature, °C; Tf is the meltwater temperature at the borehole bottom, °C; ρi is the ice density, 917 kg/m3; v is the drilling speed, m/h; li is the latent heat of ice melting, 334,000 J/kg; and Ti is the ice temperature, °C.
To ensure calculation accuracy, parameters were extracted from stable drilling segments near the borehole bottom. Davg is the average diameter measured within 300 mm above the borehole bottom. The meltwater temperature at the height of 300 mm from borehole bottom, Tf is averaged from two bottom sensors (Tw1 and Tw2). For experiment #17, q = 4.187 L/min, v = 8 m/h, Davg = 85.4 mm, Ti = −9 °C, Tf = 17.6 °C. Substituting these parameters into Equations (1) and (2), and defining the borehole bottom thermal efficiency as η = Qmelt/Q, the calculation yields η ≈ 80%. This demonstrates that approximately 20% of the input hot water energy was used to heat the surrounding ice.
Assuming a uniform thermal loss rate of 20% throughout the borehole during hot water drilling, the theoretical maximum borehole diameter, Dt, is achieved when the meltwater temperature reaches 0 °C, the calculation yields Dt = 131.4 mm. The borehole diameter at the nozzle, Dn = 96.04 mm, and the borehole diameter at the height of 300 mm from the borehole bottom, D300 = 98.61 mm. Define the borehole bottom enlargement coefficient, ηn = Dn/Dt, η300 = D300/Dt, results showed ηn ≈ 73% and η300 ≈ 75%. This reveals that 75% of diameter expansion occurs during bottom ice melting, with only 25% from upward-cooling meltwater. Such findings critically inform drill design: while the U.S. IceCube project used 24 m extension rods to prevent jamming [14], tools with diameters below 70% of Dt (e.g., 92.0 mm for Dt = 131.4 mm) can operate smoothly without extensions.
All 24 experimental datasets were processed using this methodology, with parameters and results comprehensively summarized in Table 2. In the table, P is the jet pressure, and V is the jet velocity.

3.2. Influence of Structural Parameters on Hot Water Borehole Geometry

3.2.1. Jet Shape

Current hot water drilling practices primarily employ two nozzle jet shapes: solid cone jets and linear jets. For instance, 30° solid cone jets were used in Antarctica’s Mercer Lake drilling [17], and 15° solid cone jets in U.K. operations [16], while straight nozzles dominated other projects. To compare the effects of jet shape on drilling performance, contrast experiments were conducted under identical parameters using linear jets and 30° solid cone jets, both with 2.0 mm nozzle apertures. Their jet morphologies are illustrated in Figure 8.
Figure 9 shows the variation curves of borehole diameter with depth and jet shape based on the experimental results. The results indicate that despite variations in drilling parameters across three experimental groups, jet shape exhibited minimal influence on borehole geometry within 50 mm of the borehole bottom lower part. Beyond 50 mm, the solid cone jet produced slightly larger diameters than the linear jet, though differences remained below 20 mm within the measurement range. This demonstrates that jet shape is not a primary factor governing borehole shape evolution.
From the perspective of thermal melting efficiency, solid cone nozzles outperformed straight nozzles in all three experimental groups (Figure 10). While cone jets did not increase bottom hole diameter, they reduced heat dissipation toward the borehole bottom, thereby enhancing thermal melting efficiency.

3.2.2. Jet Velocity

Comparing experiments #3, #7–#9, the relationship between hot water jet velocity and its effects on jet distance, Dj, and borehole diameter at 300 mm above the borehole bottom, D300, is plotted in Figure 11. The results demonstrate that increasing jet velocity, V, enhances borehole bottom enlargement rates when velocities remain below 30 m/s. Jet distance exhibits a positive correlation with jet velocity, where higher jet velocities correspond to greater jet distances at the borehole bottom. As jet velocity increased from 19 m/s to 75 m/s, jet distance expanded from 7.2 mm to 10.8 mm, representing a 50% increase.
Based on these findings, higher jet velocities are preferable under identical hot water parameters. However, excessively high velocities inevitably elevate pipeline circulation pressure (Figure 12), increasing costs for surface high-pressure pumps and piping systems. Therefore, practical designs should select parameters based on the chosen surface pumping system and hose pressure ratings.

3.2.3. Extension Rods

Comparing experiments #9–#13, the relationship between extension rod length and borehole bottom morphology is plotted in Figure 13. It is observed that under identical hot water parameters, variations in extension rod length exhibit negligible impact on borehole morphology within 50 mm of the borehole bottom. Beyond 50 mm, morphological differences in borehole geometry are present but show no discernible pattern correlating with extension rod length. This discrepancy may be attributed to imprecise parameter control during drilling. In conclusion, increasing extension rod length exerts minimal influence on borehole bottom morphology.

3.3. Influence of Drilling Parameters on Hot-Water Borehole Geometry

To investigate how drilling parameters (drilling speed, hot water flow rate, and temperature) influence jet distance and borehole diameter at 300 mm above the borehole bottom, single-variable experiments were conducted under different drilling speed (experiments #3, #14–#16), flow rate (experiments #3, #17–#19), and temperature (experiments #3, #20–#24) conditions. The relationships between these parameters and jet distance/diameter at 300 mm from the borehole bottom are plotted in Figure 14a,c,e. Results indicate that jet distance and borehole diameter (at 300 mm from borehole bottom, hereafter) increase with higher flow rates and temperatures but decrease with increased drilling speed. For instance, at a jet velocity of 40 m/s and drilling speed of 8 m/h, jet distance grows at 2.1 mm/°C, suggesting a projected jet distance of 188 mm for 90 °C hot water at 8 L/min. A temperature rises from 21 °C to 56 °C enlarges the borehole diameter by 70%, averaging 2.2 mm/°C. Increasing the flow rate from 4 L/min to 10 L/min expands the diameter from 98.6 mm to 162.5 mm, with jet distance increasing by 61 mm. Conversely, raising the drilling speed from 6 m/h to 12 m/h reduces the diameter from 188.1 mm to 118.6 mm and decreases the jet distance by 39 mm.
The relationships between hole-forming efficiency metrics (η, ηn, and η300) and drilling parameters are shown in Figure 14b,d,f. The figures indicate that different drilling parameters—including drilling speed, hot water flow rate, and temperature—exhibit minimal influence on hole-forming efficiency at the borehole bottom. To assess overall efficiency, data from all 24 experiments are compiled in Figure 15. The figures reveal that the diameter expansion ratio at the nozzle, ηn predominantly ranges from 0.69 to 0.81 (mean 0.74), while the expansion ratio at 300 mm above the borehole bottom, η300 spans 0.67–0.86 (mean 0.77). The thermal melting efficiency at the borehole bottom, η varies between 0.69 and 0.96, with an average value of 0.80. The standard deviations of η, ηn, and η300 are 0.072, 0.047, and 0.059, respectively.

4. Conclusions

Understanding the hole-enlargement process at the borehole bottom is crucial for rationally designing hot water drills. However, due to the complexity of heat transfer processes, no suitable theoretical model currently exists to accurately predict this process. To address this, this study established a hot water drilling experimental platform and conducted experiments under various drilling parameters using visualization techniques. The research revealed the influence mechanisms of parameters—including drilling speed, hot water flow rate, temperature, drill shape, nozzle aperture, and nozzle selection—on the hole-forming process at the borehole bottom, providing theoretical foundations for optimizing drill design and drilling parameters.
Experimental results demonstrate that under identical ice temperatures, borehole bottom morphology stabilizes rapidly with fixed drilling parameters, expanding downward at a constant jet distance. Within the tested parameter ranges, the borehole diameter increases with higher hot water temperatures and flow rates but decreases with increased drilling speed. The borehole diameter at the nozzle location reaches 74% of the theoretical maximum diameter, while the diameter at 300 mm above the borehole bottom attains 77% of this maximum. This indicates that the primary hole-enlargement process occurs near the nozzle, with upward-returning meltwater contributing only ~23% to diameter expansion. The hole-forming speed at the borehole bottom shows a rapid downward trend: exceeding 15.9 mm/s within the first 2 s of hot water contact, then dropping below 1 mm/s after 20 s. Calculated thermal melting efficiency ranges from 0.69 to 0.96 (mean 0.80), indicating that ~20% of the input hot water energy is used to heat the surrounding ice.
Under identical drilling parameters, jet shapes minimally affect the hole-forming process, but solid cone nozzles achieve higher thermal melting efficiency than linear jets by reducing heat dissipation toward the borehole bottom. Increasing jet velocity moderately enhances borehole diameter but elevates pipeline circulation pressure, raising equipment costs. Experiments modifying the borehole bottom flow field with extension rods show negligible impacts of nozzle-adjacent drill shape on hole formation.
Notably, because the refractive index of water, ice, and air is different, the borehole shape picture will have a visual error, but after comparison with the actual measured value, the error does not exceed 2% of the borehole diameter. In addition, because the accuracy of the pt100 sensor will be affected by the length of the sensor wire, the temperature measurement data will also have a certain error. Furthermore, ice temperature is a critical factor influencing borehole bottom processes [21]. However, due to experimental constraints, ice temperature control was not implemented, and thus its effects remain unexplored in this study.
In future research, the hot water drilling theory based on the current research should be gradually extended to the whole hole. Further, it is also necessary to consider the heat loss of hoses and drilling tools at different depths, and improve the hot water drilling theory by dividing the borehole into several smaller parts for research. In addition, higher-precision sensors should also be applied to the test, so that the pore-forming process of the hot water drill can be more accurately restored.

Author Contributions

Conceptualization: Y.S. and P.T.; Methodology: Z.D., Y.S., X.F., P.T., B.L. and N.Z.; Validation: X.L., N.Z. and X.W.; Formal analysis: Y.Y. and X.L.; Investigation: Z.D., D.G. and W.W.; Data curation, Y.Y. and T.W.; Writing—original draft: Z.D. and X.F.; Writing—review and editing: D.G., B.L. and X.W., Visualization: Y.Y.; Project administration: T.W. All authors have read and agreed to the published version of the manuscript.

Funding

This work was supported by the National Key Research and Development Project of the Ministry of Science and Technology of China (Grant No. 2021YFC2801401 and 2023YFC2812602).

Data Availability Statement

The original contributions presented in this study are included in the article. Further inquiries can be directed to the corresponding author.

Conflicts of Interest

The authors declare no conflict of interest.

References

  1. Talalay, P.G. Thermal Ice Drilling Technology; Springer: Berlin/Heidelberg, Germany, 2020. [Google Scholar]
  2. Ashmore, D.W.; Hubbard, B.; Luckman, A.; Kulessa, B.; Bevan, S.; Booth, A.; Munneke, P.K.; O’leary, M.; Sevestre, H.; Holland, P.R. Ice and firn heterogeneity within Larsen C Ice Shelf from borehole optical televiewing. J. Geophys. Res. Earth Surf. 2017, 122, 1139–1153. [Google Scholar] [CrossRef]
  3. Hubbard, B.; Luckman, A.; Ashmore, D.W.; Bevan, S.; Kulessa, B.; Kuipers Munneke, P.; Philippe, M.; Jansen, D.; Booth, A.; Sevestre, H.; et al. Massive subsurface ice formed by refreezing of ice-shelf melt ponds. Nat. Commun. 2016, 7, 11897. [Google Scholar] [CrossRef] [PubMed]
  4. Roberson, S.; Hubbard, B. Application of borehole optical televiewing to investigating the 3-D structure of glaciers: Implications for the formation of longitudinal debris ridges, midre Lovénbreen, Svalbard. J. Glaciol. 2010, 56, 143–156. [Google Scholar] [CrossRef]
  5. Andrews, L.C.; Catania, G.A.; Hoffman, M.J.; Gulley, J.D.; Lüthi, M.P.; Ryser, C.; Hawley, R.L.; Neumann, T.A. Direct observations of evolving subglacial drainage beneath the Greenland Ice Sheet. Nature 2014, 514, 80–83. [Google Scholar] [CrossRef] [PubMed]
  6. Patterson, M.O.; Levy, R.H.; Kulhanek, D.K.; van de Flierdt, T.; Horgan, H.; Dunbar, G.B.; Naish, T.R.; Ash, J.; Pyne, A.; Mandeno, D.; et al. Sensitivity of the West Antarctic Ice Sheet to +2 °C (SWAIS 2C). Sci. Drill. 2022, 30, 101–112. [Google Scholar] [CrossRef]
  7. Church, G.; Bauder, A.; Grab, M.; Rabenstein, L.; Singh, S.; Maurer, H. Detecting and characterising an englacial conduit network within a temperate Swiss glacier using active seismic, ground penetrating radar and borehole analysis. Ann. Glaciol. 2019, 60, 193–205. [Google Scholar] [CrossRef]
  8. McKay, R.; Barrett, P.; Levy, R. Antarctic Cenozoic climate history from sedimentary records: ANDRILL and beyond. Philos. Trans. R. Soc. A Math. Phys. Eng. Sci. 2015, 374, 20140301. [Google Scholar] [CrossRef] [PubMed]
  9. Falconer, T.; Pyne, A.; Wilson, D.; Levy, R.; Nielsen, S.; Petrushak, S.; ANDRILL-SMS Science Team. Operations overview for the ANDRILL Southern McMurdo Sound Project, Antarctica. Terra Antart. 2009, 15, 41–48. [Google Scholar]
  10. Hantz, D.; Lliboutry, L. Water ways, ice permeability at depth, and water pressures at Glacier D’Argentiere, French Alps. J. Glaciol. 1983, 29, 227–239. [Google Scholar] [CrossRef]
  11. Rado, C.; Girard, C.; Perrin, J. Electrochaude: A self-flushing hot-water drilling apparatus for glaciars with debris. J. Glaciol. 1987, 33, 236–238. [Google Scholar] [CrossRef]
  12. Olesen, O.B. A Danish contribution to the family of hot-water glacier drills. In Ice Core Drilling. Proceedings of the Third International Workshop on Ice Drilling Technology, Grenoble, France, 10–14 October 1988; Rado, C., Beaudoing, D., Eds.; Laboratoire de Glaciologie et Geophysique de l’Environnement: Grenoble, France, 1989; pp. 140–148. [Google Scholar]
  13. Benson, T.; Cherwinka, J.; Duvernois, M.; Elcheikh, A.; Feyzi, F.; Greenler, L.; Haugen, J.; Karle, A.; Mulligan, M.; Paulos, R. IceCube enhanced hot water drill functional description. Ann. Glaciol. 2014, 55, 105–114. [Google Scholar] [CrossRef]
  14. Gaisser, T. IceCube. Annu. Rev. Nucl. Part. Sci. 2014, 64, 101–123. [Google Scholar] [CrossRef]
  15. Rack, F.R. Enabling clean access into Subglacial Lake Whillans: Development and use of the WISSARD hot water drill system. Phil. Trans. R Soc. A 2016, 374, 20140305. [Google Scholar] [CrossRef] [PubMed]
  16. Siegert, M.J.; Clarke, R.J.; Mowlem, M.; Ross, N.; Hill, C.S.; Tait, A.; Hodgson, D.; Parnell, J.; Tranter, M.; Pearce, D.; et al. Clean access, measurement, and sampling of Ellsworth Subglacial Lake: A method for exploring deep Antarctic subglacial lake environments. Rev. Geophys. 2012, 50, RG1003. [Google Scholar] [CrossRef]
  17. Priscu, J.C.; Kalin, J.; Winans, J.; Campbell, T.; Siegfried, M.R.; Skidmore, M.; Dore, J.E.; Leventer, A.; Harwood, D.M.; Duling, D.; et al. Scientific access into Mercer Subglacial Lake: Scientific objectives, drilling operations and initial observations. Ann. Glaciol. 2021, 62, 340–352. [Google Scholar] [CrossRef]
  18. Sun, Y.; Li, B.; Fan, X.; Li, Y.; Li, G.; Yu, H.; Li, H.; Wang, D.; Zhang, N.; Gong, D.; et al. Brief communication: New sonde to unravel the mystery of polar subglacial lakes. Cryosphere 2023, 17, 1089–1095. [Google Scholar] [CrossRef]
  19. Taylor, P.L. A hot water drill for temperate ice. In Proceedings of the Second International Workshop/Symposium on Ice Drilling Technology, Calgary, AB, Canada, 30–31 August 1982; Holdsworth, G., Kuivinen, K.C., Rand, J.H., Eds.; CRREL Special Report. US Army Cold Regions Research and Engineering Laboratory: Hanover, NH, USA, 1984; pp. 105–117. [Google Scholar]
  20. Thorsteinsson, T.; Elefsen, S.Ó.; Gaidos, E.; Lanoil, B.; Jóhannesson, T.; Kjartansson, V.; Marteinsson, V.T.; Stefánsson, A.; Thorsteinsson, T. A hot water drill with built-in sterilization: Design, testing and performance. Jökull 2007, 57, 71–82. [Google Scholar] [CrossRef]
  21. Liu, G.; Talalay, P.; Wang, R.; Yang, Y.; Hong, J.; Gong, D.; Liu, A.; Fan, D. Design Parameters of Hot-Water Drilling Systems. Water 2019, 11, 289. [Google Scholar] [CrossRef]
  22. Greenler, L.; Benson, T.; Cherwinka, J.; Elcheikh, A.; Feyzi, F.; Karle, A.; Paulos, R. Modeling hole size, lifetime and fuel consumption in hot-water ice drilling. Ann. Glaciol. 2014, 55, 115–123. [Google Scholar] [CrossRef]
  23. Zhao, G.; Talalay, P.G.; Fan, X.; Zhang, N.; Liu, Y.; Wang, T.; Chen, Y. Optimization of Hot-Water Drilling in Ice with Near-Bottom Circulation. Water 2022, 14, 127. [Google Scholar] [CrossRef]
Figure 1. Schematic diagram of the hot water drilling experimental system. Tt and Th are used to measure the water temperature in water tank and pipeline.
Jmse 13 00817 g001
Figure 2. Schematic diagram of temperature sensor layout positions on the drill. Tdu and Tdl are used to measure the water temperature in the internal channel of the upper and lower ends of the drill. Tw1, Tw2, Tw3, and Tw4 are used to measure the return water temperature in the borehole.
Jmse 13 00817 g002
Figure 3. Experimental system.
Jmse 13 00817 g003
Figure 4. Image processing: (a) video frame capture; (b) binary image of borehole boundary profile obtained using Photoshop; (c) digitized borehole geometries obtained using MATLAB program.
Jmse 13 00817 g004
Figure 5. Time-dependent curves of parameters for experiment #17: (a) temperature; (b) flow rate and pressure.
Jmse 13 00817 g005
Figure 6. Borehole images at different time nodes.
Jmse 13 00817 g006
Figure 7. (a) Borehole shapes at different time points; (b) jet distance variation over drilling time; (c) borehole diameter and reaming speed variation over drilling time at 400 mm depth.
Jmse 13 00817 g007
Figure 8. Jet shapes: (a) solid cone jets; (b) linear jets.
Jmse 13 00817 g008
Figure 9. Borehole bottom diameter variation curves for three experimental groups.
Jmse 13 00817 g009
Figure 10. Thermal efficiency η of three experimental groups.
Jmse 13 00817 g010
Figure 11. Effect of jet velocity on jet distance and borehole diameter at 300 mm above the borehole bottom.
Jmse 13 00817 g011
Figure 12. Relationship between jet pressure and jet velocity.
Jmse 13 00817 g012
Figure 13. Effect of extension rod length on borehole bottom morphology.
Jmse 13 00817 g013
Figure 14. Effects of different drilling parameters on jet distance and borehole diameter at 300 mm above the borehole bottom: (a) drilling speed; (c) flow rate; (e) temperature; effects of different drilling parameters on borehole bottom hole-forming efficiency: (b) drilling speed; (d) flow rate; (f) temperature.
Jmse 13 00817 g014aJmse 13 00817 g014b
Figure 15. η, ηn, and η300 of the 24 experiments.
Jmse 13 00817 g015
Table 1. Sensor parameters.
TypeSpecificationRangeAccuracyManufacturer
Electromagnetic FlowmetersGHRLD-10SF1F200P6112–12 L/min±0.5% FSHongbowell Technology Co., Ltd., Beijing, China
Pressure TransmitterGHR601G9C1CNC0–30 MPa±0.5% FS
Temperature TransmitterGHR/RWBP(0-100)A1BN0–100 °C±0.5% FS
Screw-Type Temperature SensorWZP-291−50–450 °C±0.5% FSGuizhong Technology Co., Ltd., Hangzhou, China
Pt100 Temperature SensorWZP-GZPT-A−50–200 °C±0.5% FS
Displacement SensorMT80-20000–2000 mm±0.05% FSHotwell Technology Co., Ltd., Shenzhen, China
Table 2. Drilling parameters and resultant parameters of the 24 experiments.
Drilling ParametersResult Parameters
TiTbqPvdnDdVDjTfDtD300Dnηηnη300
°C°CL/minMPam/hmmMmm/smm°Cmmmmmm
#1−821.300 11.5753.809 82.072061.53899.81157.22125.55113.80.810.720.80
#2−821.000 11.6713.707 8C2.0 (2.0)72062.04818.72157.87121.82123.80.850.780.77
#3−939.863 8.0732.000 82.066042.919316.32179.76136.14128.50.800.720.76
#4−939.005 8.0211.757 8C2.0 (2.0)68042.648616.47178.70151.52144.280.960.820.86
#5−655.300 4.1060.437 82.069021.856024.55151.37112.28110.420.870.730.74
#6−653.000 4.1930.458 8C2.0 (2.0)66022.276224.88152.11120.98114.530.960.750.80
#7−639.700 7.982 5.91081.5 68075.4310813.93181.58139.56140.890.800.780.77
#8−640.200 8.251 0.73582.5 66028.077317.37186.49151.36129.940.720.700.72
#9−640.000 8.298 0.35683.0 65019.607219.54185.85130.84120.930.700.650.70
#10−340.800 7.878 0.310 83.077018.616019.63183.26129.16129.160.770.700.70
#11−339.700 8.038 0.331 83.084018.996618.63184.08125.45126.30.740.690.68
#12−340.300 8.241 0.341 83.086019.476419.316187.31125.91120.180.710.640.67
#13−339.600 8.068 0.325 83.090019.066318.1182.08126121.360.690.670.69
#14−640.000 8.372 2.16062.0 69044.5011313.53215.33188.05171.180.820.790.87
#15−639.300 8.277 2.115102.0 68044.008315.22165.89127.69119.230.790.720.77
#16−640.300 8.167 2.080122.0 62043.417416.63150.77118.64116.70.820.770.79
#17−939.200 4.187 0.47482.065022.265117.60131.4198.6196.040.800.730.75
#18−939.200 6.167 1.13482.065032.786516.20160.65124.55120.180.860.750.78
#19−838.300 10.281 3.29982.068054.6511213.54206.24162.52151.470.740.730.79
#20−3.521.200 7.666 1.785 82.065040.75479.49134.79109.1199.680.820.740.81
#21−2.524.800 8.445 2.102 82.073044.895.811.40150.63112.48111.250.800.740.75
#22−3.532.800 8.470 2.217 82.069045.027513.19172.86148.36138.850.800.800.86
#23−2.549.800 8.549 2.239 82.073045.4410916.05212.36182.65172.670.780.810.86
#24−855.700 8.603 2.28982.072045.7311917.24221.65185165.190.700.750.83
Disclaimer/Publisher’s Note: The statements, opinions and data contained in all publications are solely those of the individual author(s) and contributor(s) and not of MDPI and/or the editor(s). MDPI and/or the editor(s) disclaim responsibility for any injury to people or property resulting from any ideas, methods, instructions or products referred to in the content.

