Abstract
The maritime industry is rapidly advancing toward the initial stages of the digitised era of shipping, characterised by considerable advances in maritime autonomous technology in recent times. This study examines the effectiveness of training packages and the impact of rank during the failure of a sophisticated autopilot control system. For this study, the fault recognition and diagnostic skills of 60 navigational seafarers conducting a navigational watch in a full mission bridge watchkeeping simulator were analysed. Participants had either significant experience as qualified navigational officers of the watch or were navigational officers of the watch cadets with 12 months’ watchkeeping experience. These groups were subdivided into those who were given a training package focused on behavioural aspects of managing automation, such as maintaining situational awareness, and those given a technical training package. The findings were analysed using an Event Tree Analysis method to assess the participants’ performance in diagnosing a navigation fault. Additionally, the fault recognition skills were assessed between groups of training and rank. The study found that participants who received the behavioural training were more successful in both recognising and diagnosing the fault during the exercise. Behavioural training groups outperformed technical training groups, even when technical training participants were experienced seafarers. This difference in performance occurred without any apparent differences in workload or secondary task performance. Understanding the data gathered from the study could lead to the development of future training regimes for navigational officers of the watch and help to optimise the evolution of the seafaring role.
1. Introduction
As the maritime industry transitions towards Industry 5.0, numerous changes are expected to impact the world of shipping. Developments in new technologies such as alternative fuels, autonomous operations, digital twinning, and energy storage systems will inevitably necessitate a new approach to training for maritime personnel. Such technologies have the potential to evolve the required crew skill set, rendering current skills and tasks obsolete and introducing new skills to be considered for the crew [1].
The relationship between human operators and technology has rapidly evolved into a significant part of daily life across various industries, including the maritime sector [2]. Despite the rich history of maritime transportation, which dates back to ancient times and presently accounts for approximately 90% of global trade [3], the industry now faces one of its most impactful technological advancements—autonomous navigation. In the maritime industry, particularly in the context of Maritime Autonomous Surface Ships (MASS), there is ongoing debate among experts regarding the precise definition of the term “Autonomous”. Various pieces of literature introduce terminologies such as “Automated”, “Full Vessel Automation”, “Autonomy”, “Fully Autonomous”, “Autonomization”, and “Unmanned”, each intended to convey similar meanings, leading to significant confusion within the industry [4]. Therefore, it is critical for the maritime industry to take a forward-looking approach to alleviate confusion among its professionals by clearly defining what constitutes a MASS vessel and categorising the various subcategories of MASS vessels.
Work conducted by the International Maritime Organization (IMO) has highlighted the concerns of the industry, including the uncertainties behind machine learning and smart shipping [5]. As such, the IMO has directed its future goals to address these concerns through further research prior to allowing MASS to operate within global waters and to develop a two-stage legislation system, with the primary legislation regulating vessels adhering to MASS and the secondary legislation being a code of practice for remotely operated unmanned vessels [6]. Furthermore, the outlook of a fully autonomous maritime industry has garnered interest among the regulatory bodies that develop the guidance and rules for the industry. Members of the International Association of Classification Societies (IACS) have begun development on various aspects of MASS, in particular the cyber-resilience of MASS [7,8]. IACS have identified the lack of standards that are currently instated for MASS, and they are looking to participate in the development of MASS [9]. Furthermore, the individual members of IACS have begun to establish the foundations that will allow them to develop their own rule sets for MASS to adhere to [10,11,12]. Moreover, classification societies are also working together with various industrial bodies to conduct research into vessels and systems in a way that will aid the development of rules [13].
This progression has led to the development of automation and autonomous technology to assist human operators in performing a wide array of tasks of varying complexities [14]. In recent years, the level of autonomy has significantly increased globally, particularly in industries requiring high safety standards. The advantages of advancing towards full automation and remote autonomous operation are considerable, offering safety and cost benefits that surpass those provided by human operators when implemented appropriately [15]. However, like all systems, autonomous technologies can malfunction, behave in unanticipated ways, or act in a way that is opaque to operational staff, posing dangers to both operators and the environment. Past research has highlighted several concerns related to sophisticated automated systems, including over-reliance, complacency, and bias [16]. Within the maritime industry, the increase in technology has accentuated the critical issue of over-reliance on onboard automation, leading to human-caused failures that can result in hazardous scenarios for vessels [17].
For successful integration, it is crucial to enhance the human–automation relationship through system interface modifications, updated operational procedures, and, as discussed in this paper, training. Research indicates that with proper training, humans can effectively identify and correct faults in automated systems [18]. With the introduction of autonomous shipping, the industry faces the challenge of determining the appropriate topics for seafaring students’ future syllabi. Historical systems like electronic chart display and information systems (ECDIS), developed since the 1990s, have shown that maritime incidents often result from a lack of understanding and familiarity with the system due to varied designs [19,20]. Addressing these issues, along with managing expectations of autonomy and enhancing current officers’ of the watch (OOW) technological understanding, can facilitate a smoother transition to MASS [21,22].
Bridge watchkeeping simulators, primarily used for complex ship handling and International Convention on Standards of Training, Certification, and Watchkeeping for Seafarers (STCW) approved courses, have their training limited to two months by current STCW guidance [23]. As the maritime industry progresses towards MASS, research suggests that enhanced simulation-based training can provide practical education beyond vessel navigation, preparing officers for the demands of autonomous operations [24,25]. Furthermore, while technical education is essential, behavioural skills such as fault recognition, fault diagnosis, and situational awareness (SA) will equip officers with essential problem-solving abilities [26]. Additionally, the industry is currently experiencing difficulties in quantifying the parameters of the Convention on the International Regulations for Preventing Collisions at Sea, 1972 (COLREGs). Specifically, when analysing the COLREGs, there are various rules that can be adopted into autonomous technology, i.e., Rule 5—Lookout, which can be circumvented by camera technology; Rule 7—Risk of Collision; and Rule 8—Action to Avoid Collision, which can be met through the supervision of autonomous navigational technology. However, complexities begin to arise through the use of language in which the COLREGs were written. For example, “Any action to avoid collision shall be taken in accordance with the Rules of this Part and shall, if the circumstances of the case admit, be positive, made in ample time and with due regard to the observance of good seamanship” [27]. Research conducted has suggested that such language behind the rules leaves an element of ambiguity in their interpretation [28]. Nevertheless, irrespective of the complexities of COLREGs and their implementation to collision avoidance and detection aids (CADA), it is critical for the OOW to display apt watchkeeping skills, understand human factors that may impact their watch, and demonstrate fault recognition and fault diagnosis to complement sophisticated systems.
The transition towards autonomous ships, or “smart ships”, presents clear economic and safety benefits by eliminating the need for onboard seafarers and reducing the risk of human-related accidents [29]. As the industry embarks on the early stages of autonomous system development, addressing the research gap in human–automation interaction is vital to mitigate the challenges associated with this technological shift. The introduction of autonomous shipping brings numerous questions across the industry, as the development of systems and learning from unexpected events present unprecedented challenges. To facilitate the integration of these sophisticated systems, this study looks to understand seafarers’ actions in response to failures of advanced onboard systems. This leads to the central research question: “Can alternative training methods enhance seafarers’ fault recognition and diagnostic skills?” Consequently, the aim of this study is to assess whether different training approaches can positively influence the fault recognition and diagnosis capabilities of seafarers.
In addition to the major research question and primary aim of this study, the role of experience among seafarers warrants attention. Previous research has suggested that experienced operators may outperform novices in recognising and diagnosing faults due to their familiarity with maritime systems and procedures [30]. This raises the question of whether there is a differential effect between experienced seafarers and inexperienced seafarers in their ability to respond to system failures. Furthermore, the potential for behavioural training to introduce an additional cognitive overhead is also explored as a supplementary aim of this study. These considerations add depth to the research by addressing the interplay of experience and training in shaping the human–automation relationship within the context of autonomous maritime operations.
2. Methodology
2.1. Materials
2.1.1. Simulator
The exercise was carried out using Kongsberg secondary bridge suites. Each suite implemented the Kongsberg Polaris simulator software, which allowed participants to control the simulator, and Seaview R5 visual software, which gave the participants a visual feedback representation of their actions when controlling the simulated vessel. The simulator’s configuration and setup are identical to those used in a prior study [31].
2.1.2. Training
The advent of MASS and autonomous navigational systems holds the potential to transform the maritime industry, including the maritime education and training (MET) sector. Consequently, the critical aim of this study was to investigate whether altering the training provided to seafarers before starting the exercise could enhance both fault recognition and diagnostic skills. To achieve this, two different types of training videos, each lasting 5 min, were created and delivered with the following information:
- Behavioural Training (B)—This training package includes information on the behavioural skills needed for autonomous navigation. Key topics covered include:
- ○
- Situational Awareness: Understanding situational awareness, its impact on autonomy, and ways to improve it.
- ○
- Automation Bias: Defining automation bias and strategies to counteract it.
- ○
- Complacency: Recognising the dangers of complacency and methods to avoid it.
- Technical Training (T)—A training package that includes information regarding the modern-day automated systems that may be used as the foundation for autonomous navigation. The main topics delivered within this training package include:
- ○
- Autopilot—How the autopilot may be adapted for autonomous navigation.
- ○
- ECDIS—How ECDIS can benefit future navigational autonomous systems.
- ○
- Radar—The development of radar over time and how it can be adapted as a tool for autonomous shipping.
2.1.3. Post Exercise Survey
To capture a richer data pool, a post-exercise survey (PES) was conducted on participants immediately following the conclusion of the simulator exercise. The goal of the PES was to assess their understanding of the fault and the exercise requirements. Primarily, the aim of the PES was to analyse the participants’ deeper level of understanding of autonomy. This was achieved by questioning them on three critical research areas:
- Situational Awareness
- Cognitive Workload
- Trust
Situational Awareness
The SA section in the PES assessed participants’ understanding of their mission, acknowledging the potential for accidentally correcting a gyro drift fault without full awareness. Participants answered questions about their vessel’s speed and heading, encountered traffic vessels, alarms, and identified faults. The responses were scored, with a maximum possible score of 9, to evaluate their SA, as shown in Table 1.

Table 1.
SA Question Set and Score.
Workload
Using a NASA Task Load Index (NASA-TLX) method [32], the “Workload” section of the PES assessed participants’ workload demands using six questions on a 10-point scale (1 = very low workload, 10 = very high workload). The scale increased in increments of 0.5. The questions covered:
- Mental Demand: How mentally demanding was the task? Easy or complex?
- Physical Demand: How physically demanding was the task?
- Temporal Demand: How hurried or relaxed was the task?
- Performance: How successful were you in accomplishing the task?
- Effort: How hard did you work to achieve your performance?
- Frustration Level: How insecure, discouraged, stressed, or annoyed were you?
The NASA TLX was administered immediately after the exercise, and scores were averaged across each participant group to define their final workload score.
Trust
The “Trust” section included a 6-item questionnaire evaluating participants’ self-perceived conscious trust in current on-board automated systems; the question set is taken directly from previous works [30]. It also examined the impact of external factors like fatigue or deep-sea travel and the effectiveness of alarms on SA. A 7-point Likert scale was utilised to follow the same process outlined in previous works to allow participants a wide response range [30]. Table 2 shows the question set issued to participants.
Table 2.
Trust Question Set.
2.2. Procedure
Exercise Design
Upon entering the simulator suite, each participant was provided with a workbook, pilot card, and a list of ship particulars. These documents were placed on the workbench to enable the participant to complete the necessary paperwork throughout the duration of the exercise. The aim of giving each participant a workbook was to emulate the ever-demanding need for paperwork to be conducted during an officer’s watch. The exercise commenced with the vessel under autopilot control, allowing participants to adjust the vessel’s position according to their watchkeeping preferences. Alarms were scheduled to sound at five-minute intervals to simulate the auditory environment of a ship’s bridge, thus increasing the immersion of the exercise.
At 12 min and 30 s into the exercise, the vessel was programmed to experience a gyro drift failure. This malfunction caused the vessel to deviate from its course, drifting to port at a rate of 1° per minute. If left uncorrected, the vessel would achieve a 20° course deviation. To simulate realistic operational conditions, an alarm was set to activate at the 25 min mark, alerting the participant that the cross-track limit had been exceeded. This alarm was designed to act as the final prompt for the participant to investigate and diagnose the fault.
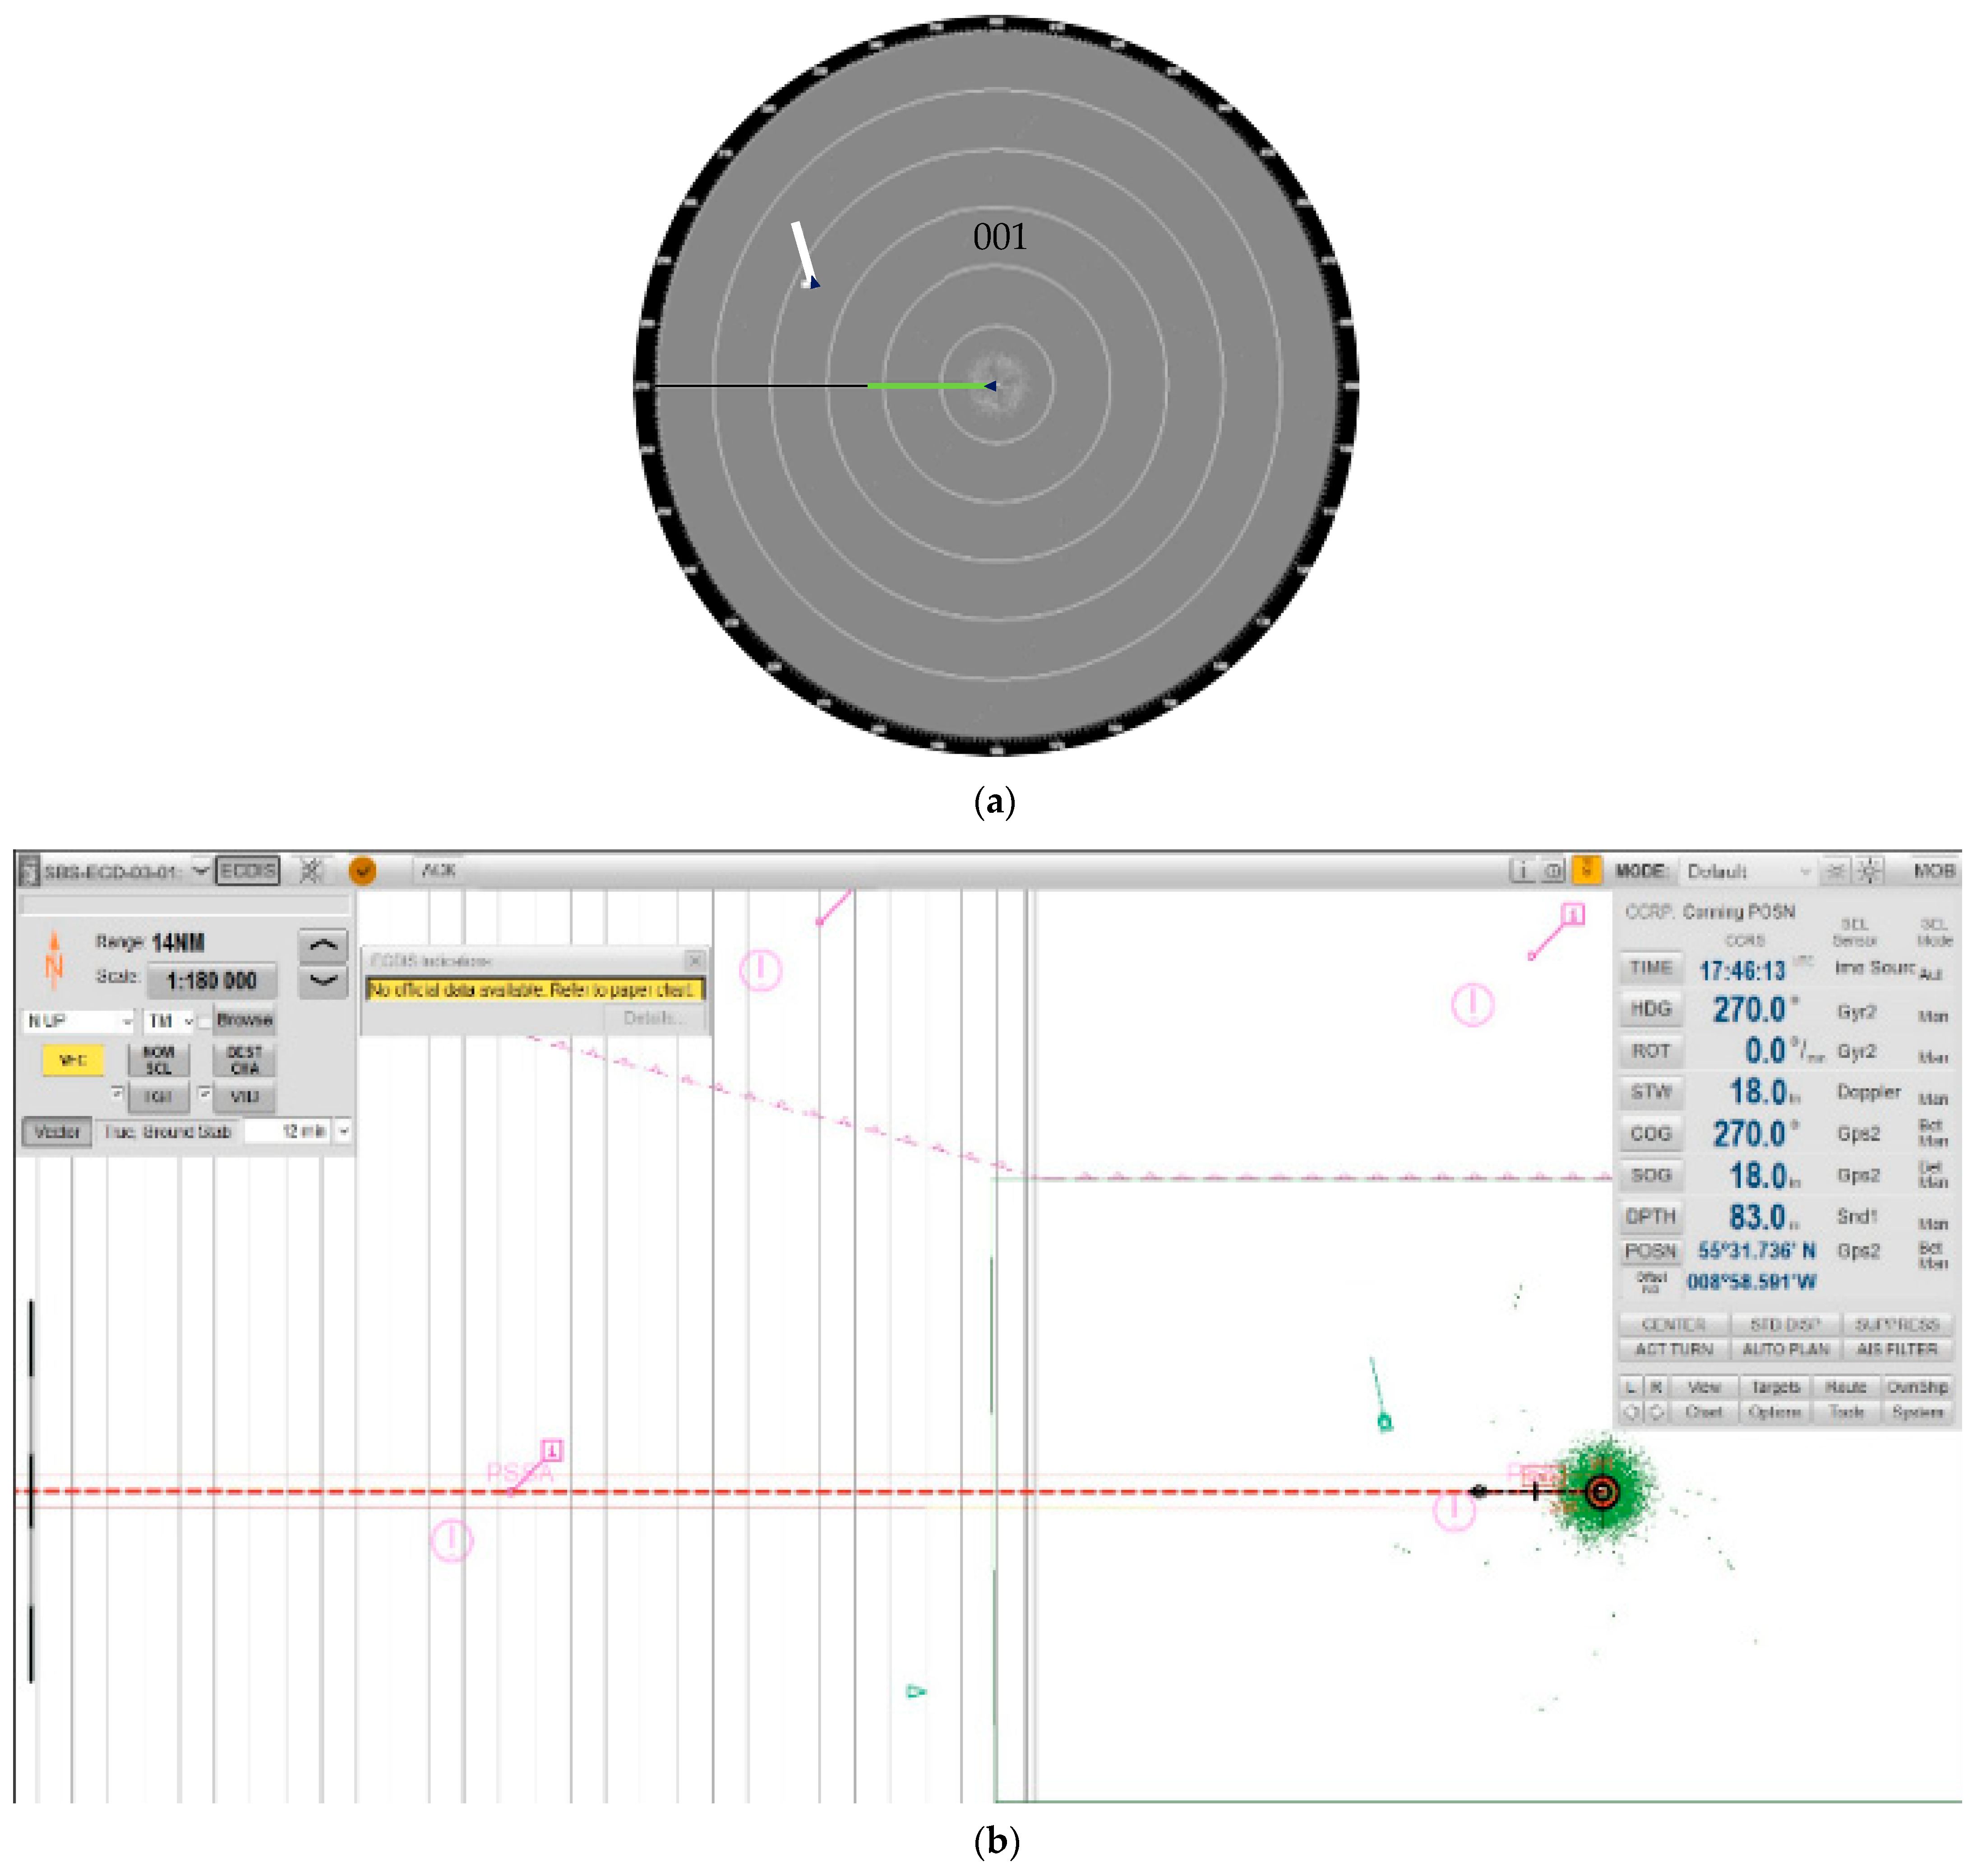
Figure 1a presents the radar plot at the onset of the exercises, showing a range of 12 nautical miles as indicated by the gyro compass. The plot illustrates the vessel’s trajectory set on a 270° course with one traffic vessel nearby. This is further corroborated by the ECDIS view in Figure 1b, which covers a range of 14 nautical miles. The ECDIS view provides detailed information on the vessel’s speed, heading as per the gyro compass, and Global Positioning System (GPS) readings.
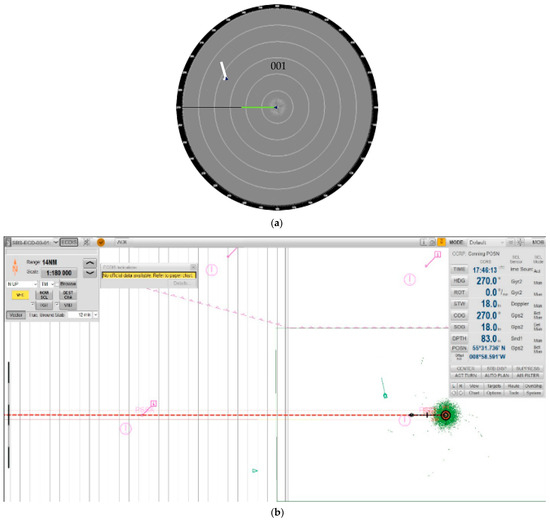
Figure 1.
Vessel Parameters from Radar and ECDIS View—Start.
Figure 2 illustrates the displays at the conclusion of the exercises if the vessel’s navigation is left unattended. Gyro 1, shown in Figure 2a, indicates a malfunction, whereas Gyro 2, depicted in Figure 2b, is functioning correctly. If the participant fails to correct the gyro drift fault, Gyro 2 reveals that the vessel will have altered its course to a new heading of approximately 253°. Meanwhile, Gyro 1 displays the radar view the participant would see if they did not switch to Gyro 2, suggesting the vessel maintains a 270° heading. The ECDIS plot in Figure 2c corresponds to Gyro 2 and shows that the vessel has deviated to a new heading of 252.7°. No other parameters would be affected if left unattended by the participant.
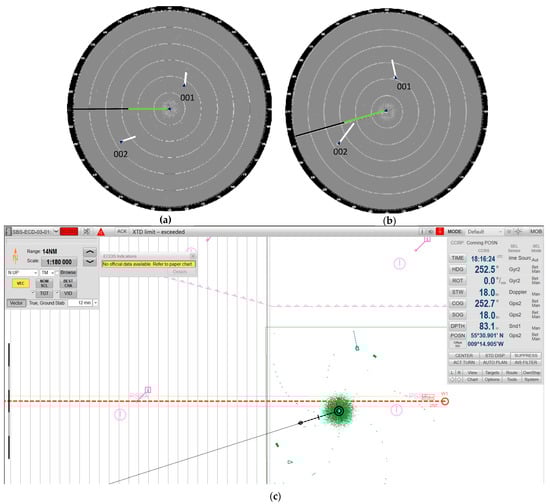
Figure 2.
Vessel Parameters from Radar and ECDIS View—End.
The primary metric for assessing the participants’ performance was the time taken to identify and correct the fault. This time was recorded in seconds, starting from the initial occurrence of the fault. Should a participant fail to identify the fault within the allotted time, they were assigned a time score of 1050 s, representing the duration from fault initiation to the end of the exercise. Following the conclusion of the exercise, each participant was taken to a room where they would complete the PES in isolation to gain a deeper insight into the participants’ experiences.
2.3. Participants
One of the critical factors of this study was to ensure that every participant had accrued a minimum of 12 months of seagoing experience to ensure that the participant had the minimum skill set and knowledge to navigate the vessel. Sixty individuals participated in the study. Of these, 30 were fully qualified officers, comprising 20 junior officers and 10 senior officers.
The remaining 30 participants were unqualified officers, each with a minimum of 12 months’ sailing time as navigational cadets. Most of these participants were due for promotion in the months following the study. Consequently, the final-phase navigational cadet participants would become qualified junior officers, and the junior officers would be promoted to chief mates. From the preceding studies [33], it was identified that the critical demographic variable for participants was their rank.
All participants were male and had at least 12 months of navigational sea time. Participants were divided into two groups of 30, with the same balance of experience, receiving either behavioural or technical training videos. Within these groups, participants were further categorised by rank. This grouping method resulted in four participant categories for statistical analysis:
- Behavioural Trained, Qualified OOW (BQ)—n = 15
- Technical Trained, Qualified OOW (TQ)—n = 15
- Behavioural Trained, Unqualified OOW (BU)—n = 15
- Technical Trained, Unqualified OOW (TU)—n = 15
2.4. Event Tree Analysis
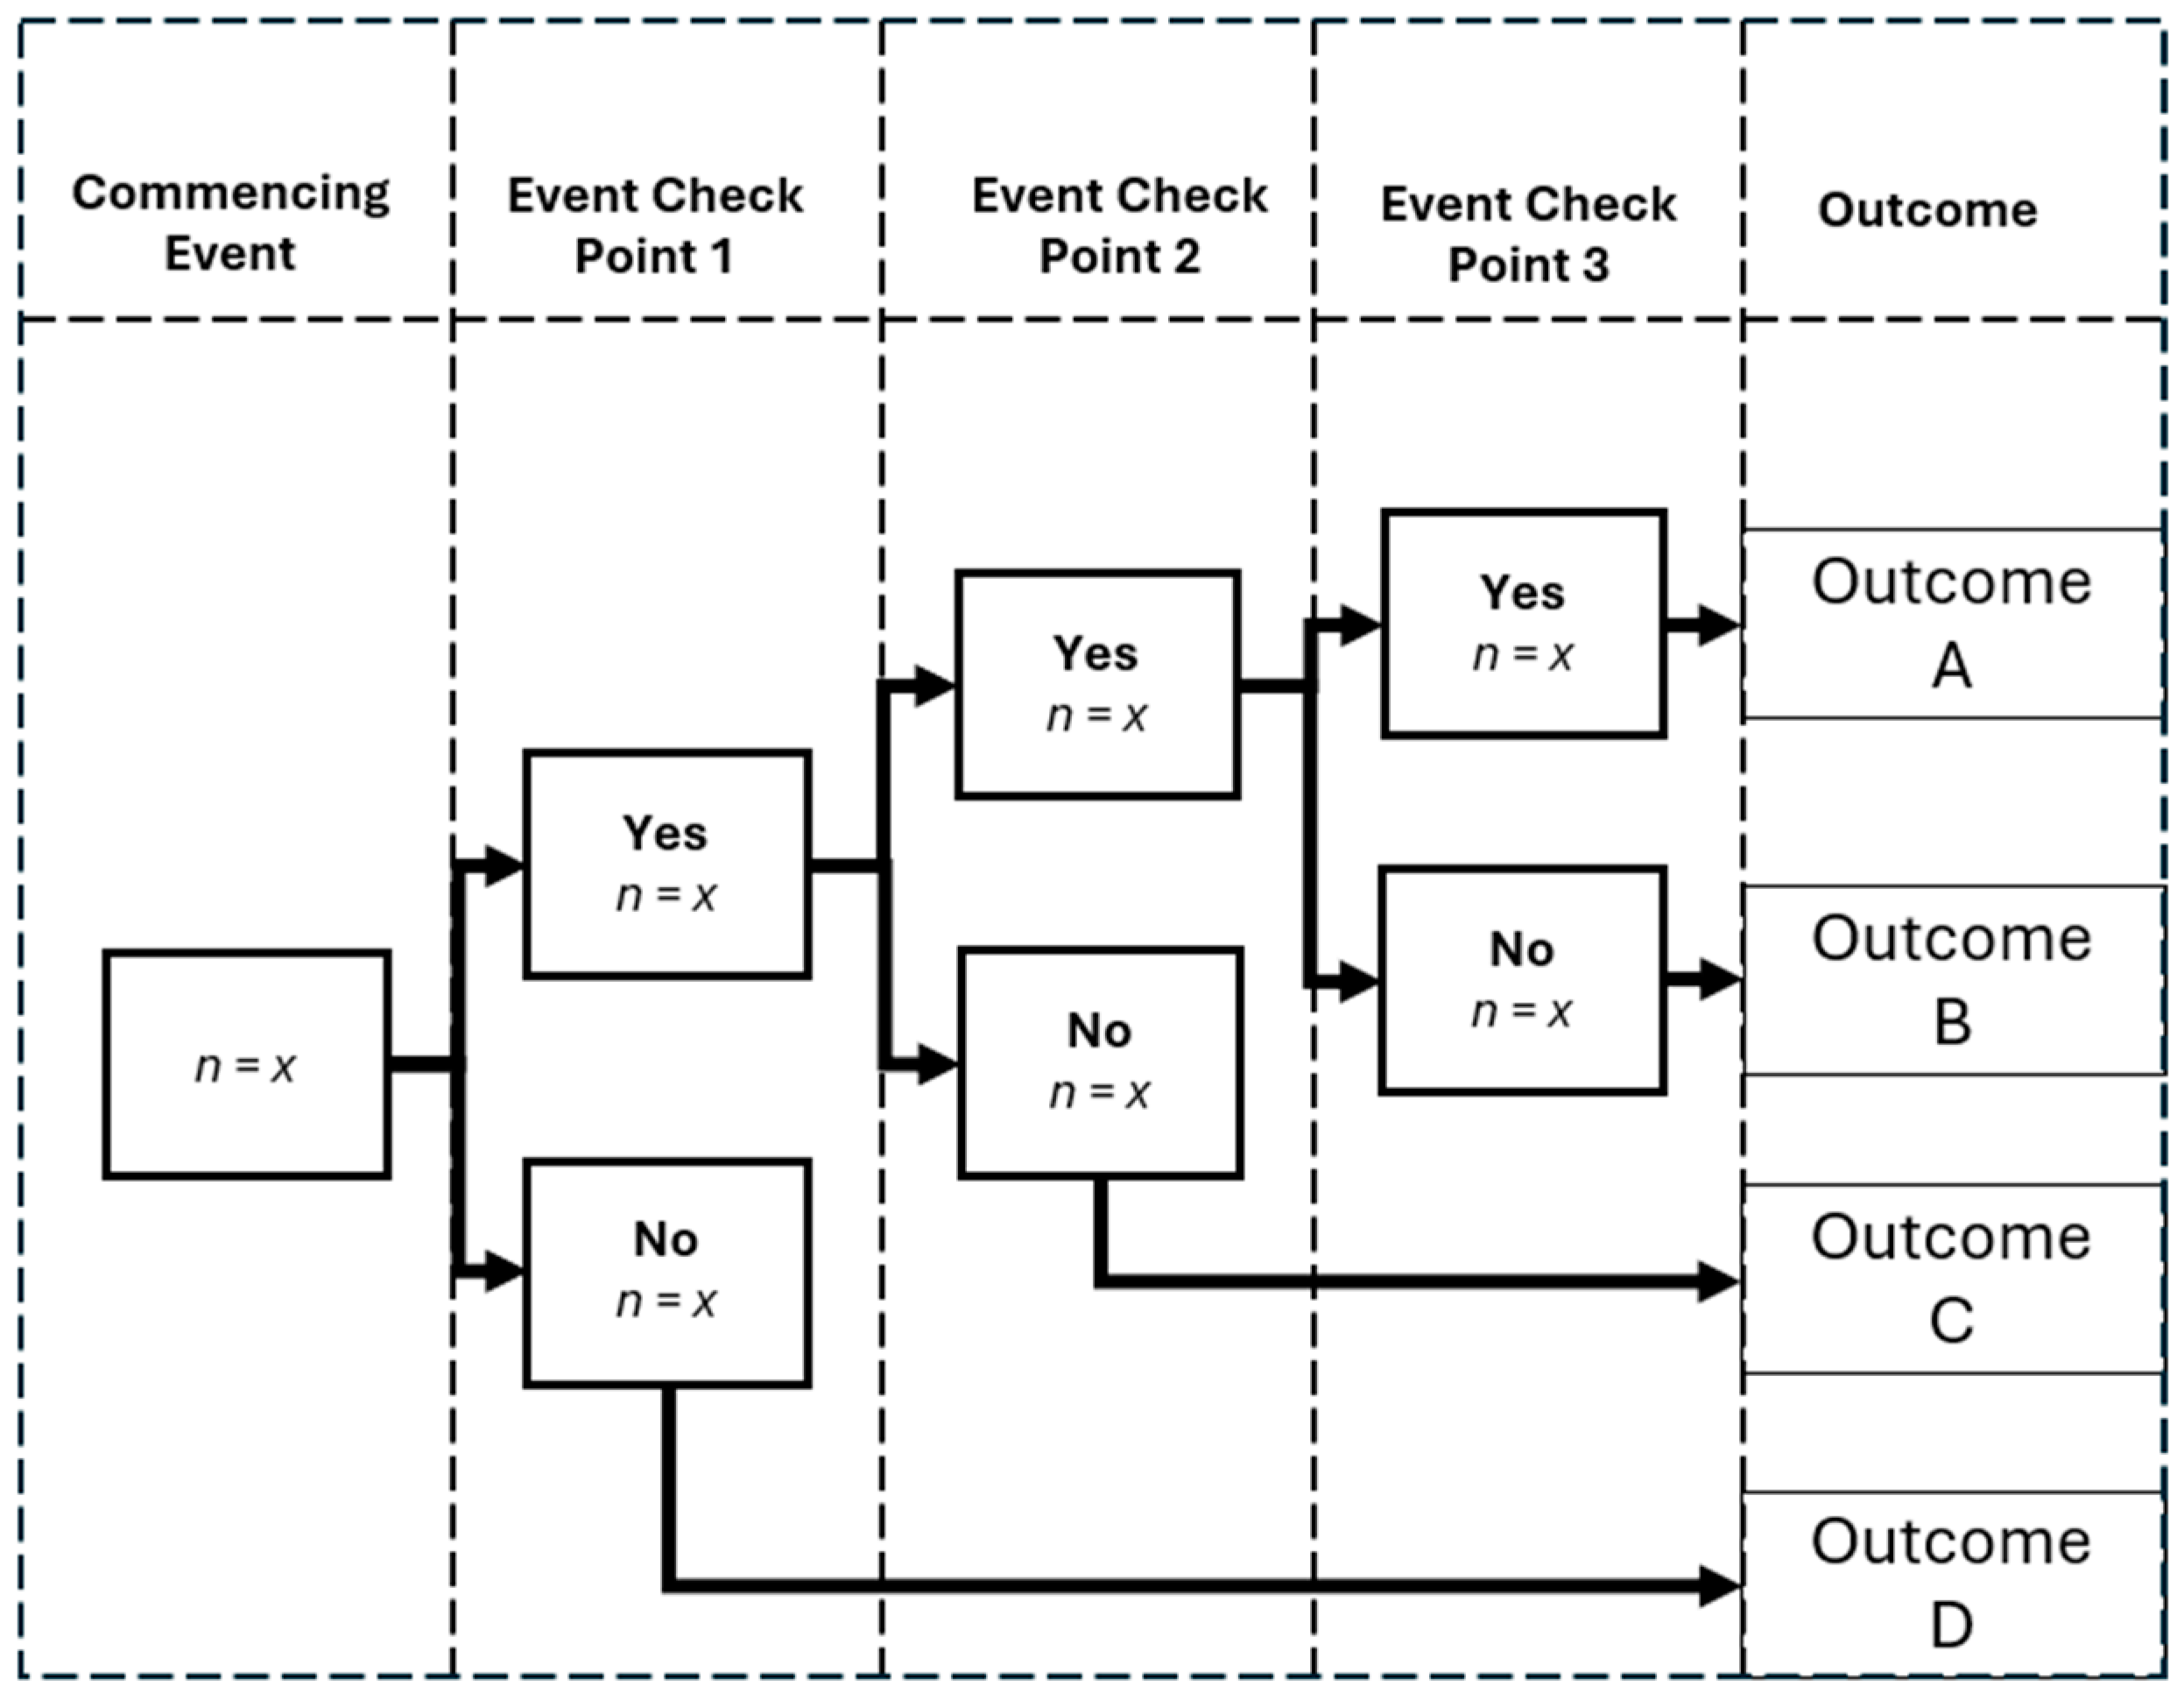
The employment of human test subjects facilitated the generation of numerous event pathways instrumental in identifying diverse faults. Consequently, an Event Tree Analysis (ETA) was performed for each task, allowing for the evaluation of every potential outcome alongside its associated probability. The implementation of an ETA enables the creation of a logical diagram used to assess the sequence of events stemming from the initial fault, which has been utilised in previous research [31]. Each diagram emphasises the occurrence frequency of every individual event [34]. An example depiction of an event tree is displayed in Figure 3.
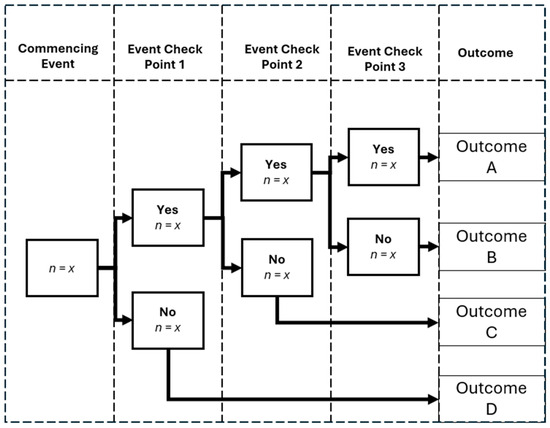
Figure 3.
Example Event Tree Logic Pathway.
Every event in the ETA represents an accidental occurrence, defined as a notable deviation from the anticipated scenario, resulting in an undesirable outcome. This deviation presents participants with several potential resolutions influenced by their decision-making processes. Each task includes various safety mechanisms designed to support the participants, akin to those they would encounter during the execution of a navigational watch. The aggregated results of the ETA offer valuable insights into the multitude of failure modes identified within each exercise. To ensure the precise construction of the ETA for every specific exercise, the following methodology was adhered to, emphasising the safety mechanisms and outcomes:
- Specify the initiating event likely to lead to an unfavorable consequence.
- Identify the safety mechanisms implemented to prevent undesired results.
- Construct the event tree, aligning safety mechanisms and outcomes sequentially.
- Record the number of participants who adopted each identified course of action in addressing the fault.
3. Results
3.1. Fault Recognition
The fault recognition time for participants started at 0 s when the fault initiated and then stopped when the participant recognised the fault. In the event of the participant not recognising the fault, they would be issued with a time score of 1050 s. The graph in Figure 4 shows the time scores and volume of workbook completed for all participants in the simulator exercise.
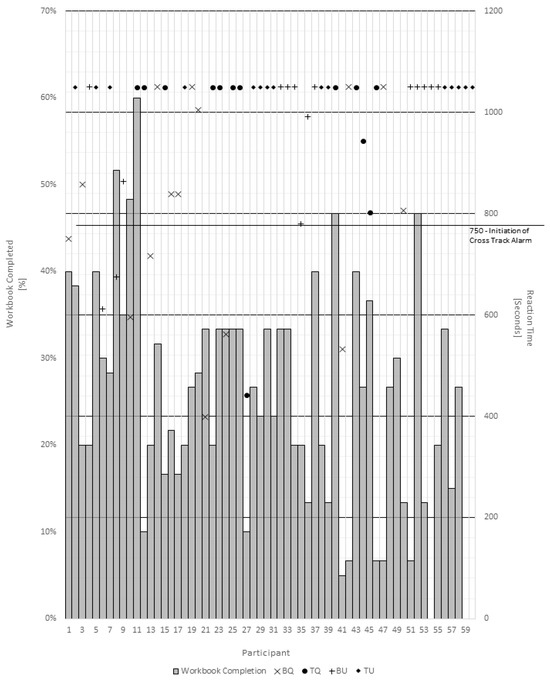
Figure 4.
Fault Recognition by Participant.
As a final prompt for all participants in the simulator, a cross-track alarm would sound 750 s after the fault had started; this has been denoted on the graph. As shown in Figure 4, half of the participants who recognised the fault did not need the aid of the cross-track alarm. When analysing the participants as a homogenous group, it can be seen that 30% of all participants were successful in recognising the fault.
The analysis of the individual groupings of participants shows that the BQ group was more attentive, with 60% of the successful BQ participants reacting to the fault without the aid of the cross-track alarm. In contrast, for the TQ and BU groups, 40% and 33.3% of participants reacted to the fault prior to the sounding of the alarm. Furthermore, it can be seen that the fastest and slowest reaction times to the fault both belonged to the BQ group, with time scores of 399 s and 1005 s, respectively.
Table 3 shows the basic data collected from the study. Initial data analysis examined whether different training videos impacted participants’ fault recognition skills, considering their rank. A Fisher Exact test with a Freeman Halton extension was conducted to identify any statistical significance between groups. The test analysed whether training and rank influenced participants’ successful fault reaction. Results are presented in a 4 × 2 contingency table metric (shown in Table 4) showing the number of participants who recognised and reacted to the course deviation fault.
Table 3.
Fault Recognition Chi-Square Test.
Table 4.
Fault Recognition Fisher Exact Test Group Comparison.
Furthermore, when comparing the groups’ success in fault recognition against each other, it was found that many groups displayed signs of statistical significance. Further analysis of the success rates, as displayed in Table 4, shows that the relationship of the BQ group was statistically significant from both the TQ and TU groups, and the BU group displayed statistical significance from the TU group. The data, therefore, suggest that there were differences between participants receiving behavioural training versus technical training. Moreover, participants who had received the behavioural training were more successful at recognising the fault than the participants who received technical training, irrespective of the individual’s rank.
3.2. Fault Diagnosis
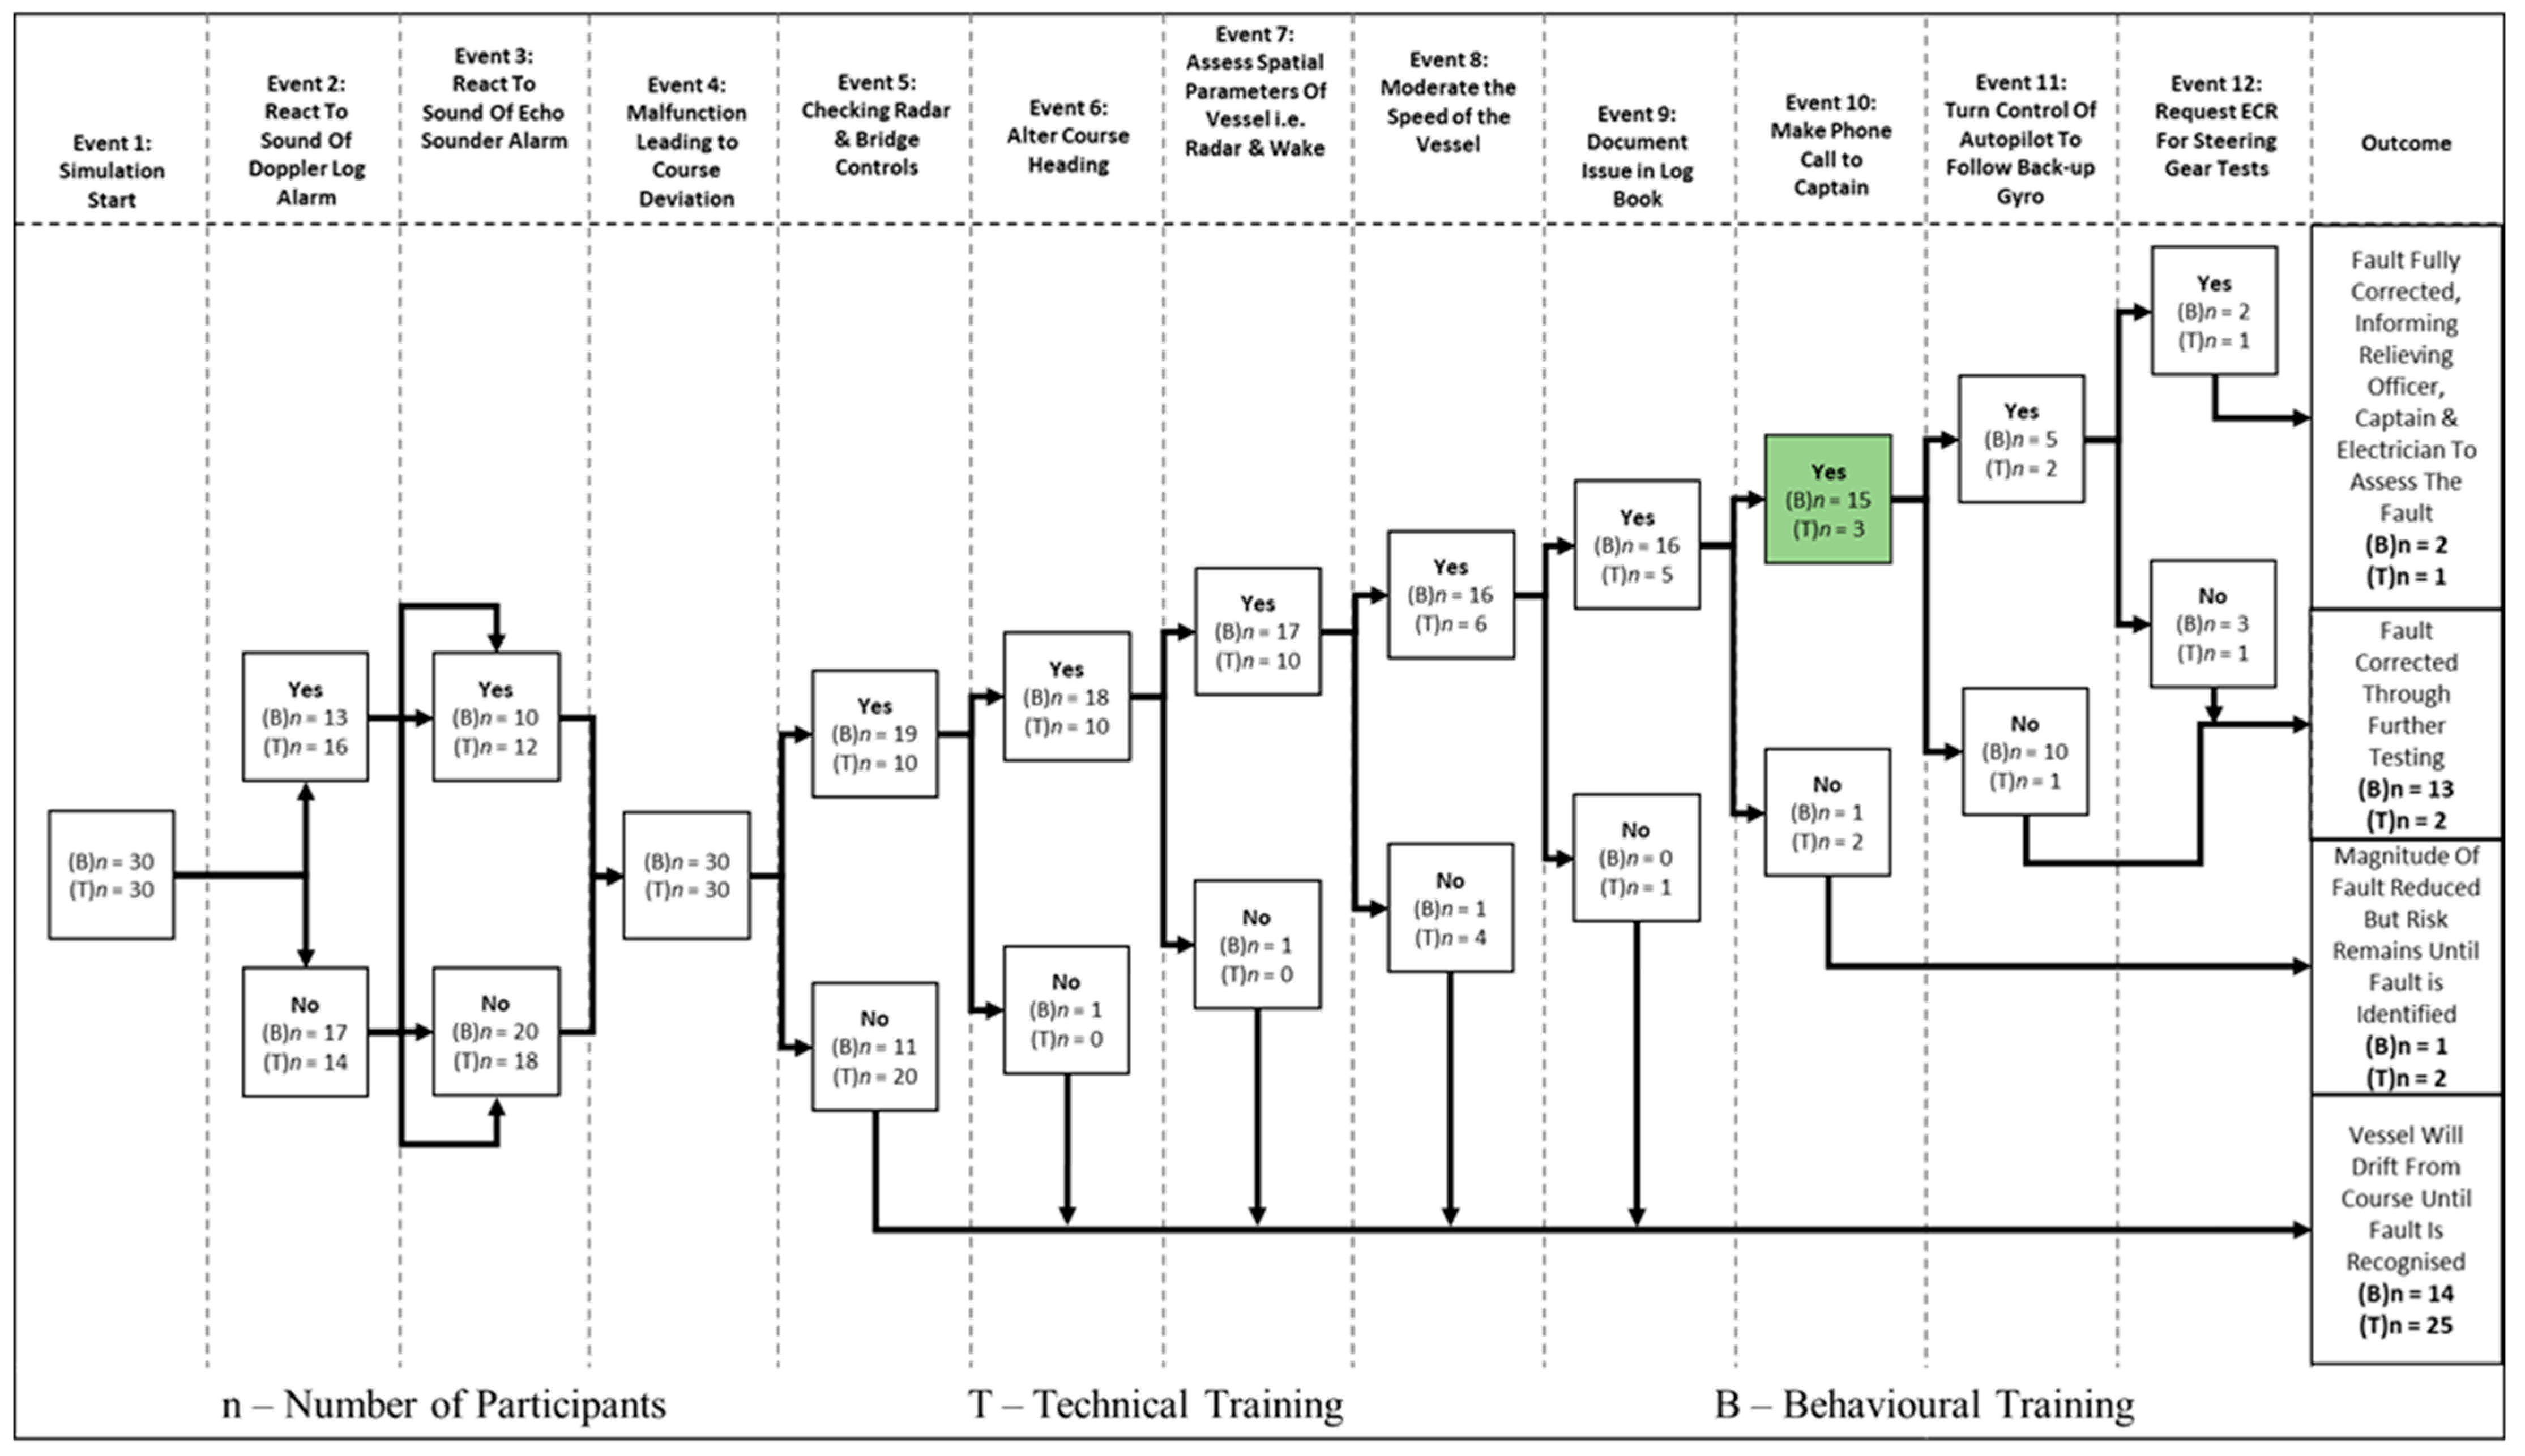
Multiple event pathways were defined as the participants completed the exercise. These were analysed using an event tree analysis (ETA) method to determine participants’ success in responding to encountered events. Conducting an ETA allows for the mapping of various points during the exercise, enabling a detailed analysis of the specific moments at which participants recognised the issue. This approach also highlights the differences in participants’ responses based on the type of training they received, providing insights into how training impacts fault identification and reaction times. Figure 5 illustrates the event tree for the exercise, with the following summarising the events occurring in the graphical representation:
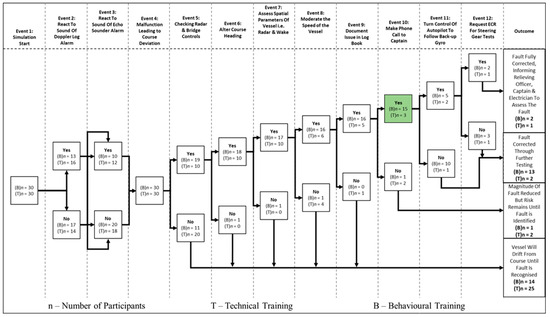
Figure 5.
Fault Diagnosis Event Tree Analysis (ETA).
- Event 1.
- Exercise begins.
- Event 2.
- Initial alarms for Doppler Log sound to increase the fidelity of the exercise but were not actively part of the fault diagnosis and analysis.
- Event 3.
- Initial alarms for Echo Sounder sound to increase the fidelity of the exercise but were not actively part of the fault diagnosis and analysis.
- Event 4.
- Initiation of the fault.
- Event 5.
- Radar and bridge controls were examined. By event 5, nearly two-thirds of the B group had proactively addressed the course deviation, compared to only one-third of the T group.
- Event 6.
- Altering of course heading.
- Event 7.
- Assessment of spatial parameters.
- Event 8.
- Alter speed of vessel.
- Event 9.
- Record a fault in logbook. As the exercise progressed to event 9, 21 participants formally acknowledged the malfunction and documented their findings.
- Event 10.
- Contact the captain. At event 10, 15 behaviourally trained participants and 3 technically trained participants successfully negotiated the alarm handling situation, to this point and called the captain to alert them of the ongoing situation. All participants who successfully addressed event 10 identified the fault.
- Event 11.
- Change control of the vessels autopilot to follow redundant gyro. Allows participants to further investigate and correct the fault, 5 behaviourally trained participants and 3 technically trained participants successfully switched autopilot control from gyro compass 1 to gyro compass 2.
- Event 12.
- Request engine crew to conduct steering gear tests. Allows participants to further investigate and correct the fault, 2 behaviourally trained and 1 technically trained participant successfully followed the correct procedures at event 12, resulting in a total of 3 participants correctly diagnosing the fault.
3.3. Post Exercise Survey
For the PES, the key aspects that were analysed were the SA section, NASA TLX, and Trust in Automation section. Each section was analysed against both the “Training Package vs. Rank” and whether or not the participants successfully recognised the fault. The statistical analysis was conducted using one-way ANOVA testing with a Tukey HSD post hoc test to analyse the data between groups for the Training package vs. Rank participant group. All testing was conducted using a statistical significance value of p < 0.05.
3.3.1. Situational Awareness
In the SA section, participants could score 1 point for each correct response, with 2 points allocated to questions regarding traffic vessels, resulting in a maximum score of 9 for the SA section. Seven one-way ANOVA tests conducted for the Fault Recognition groupings in the SA section revealed that participants who did not recognise the fault (FUr) scored slightly better than those who successfully recognised the fault (FR), with no statistically significant relationships among the questions (Table 5). Subsequently, seven 1x4 ANOVA tests were conducted for the “Training Package vs. Rank” participant group in the SA section. The results indicated that all groups scored over 5 points on average, suggesting participants were aware of their surroundings. However, participants struggled with questions about traffic vessel parameters, and no statistically significant relationships emerged from the ANOVA tests.
Table 5.
Statistical Tests of the SA Section of PES.
3.3.2. Workload
Table 6 displays the results of the seven 1 × 4 ANOVA tests conducted on NASA-TLX parameters in terms of Training package vs. Rank participant groups. Participants indicated a middling effort level, while post hoc analysis identified statistically significant relationships between the BU group and both the TQ and BQ groups for temporal and physical questions, suggesting that the BU group found the task more physically demanding and hurried. A further seven one-way ANOVA tests performed on the NASA TLX questions for the Fault recognition grouping showed that all participants responded similarly across all aspects, with no statistically significant results identified.
Table 6.
Statistical Tests of the Workload Section of PES.
3.3.3. Trust
This section employed a 7-point Likert scale for each question, with 1 being in favour of manual control and 7 in favour of autonomous control, resulting in a maximum score of 42. Table 7 displays the results of the seven 1 × 4 ANOVA tests conducted on the Training package vs. Rank participant groups for the Trust in Autonomy section, showing that most participants favoured autonomy in most aspects. Post Hoc testing identified a statistically significant relationship between the TU and TQ groups for the question “Alarms on the ship increase my situational awareness”, with TU groups responding more favourably.
Table 7.
Statistical Tests of the Trust Section of PES.
Additionally, seven one-way ANOVA tests were conducted for the Trust section against the Fault recognition groups. The analysis revealed that participants who successfully recognised the fault were less favourable towards autonomy than those who failed to react, as indicated by responses to “I trust in the automated systems which I have had training with.” Moreover, a statistically significant relationship was found for the question “If I were tired or fatigued, I would be more susceptible to trust the vessel’s automated system”, showing that participants who recognised the fault were more favourable towards autonomy.
4. Discussion
4.1. Effectiveness of Training Package on Fault Finding
With the approach of Industry 5.0, it is imperative for the maritime industry to assimilate knowledge and advancements from ongoing autonomous maritime research, as well as the implementation of autonomous technologies in other transportation sectors. The imminent integration of autonomous systems within the maritime industry underscores the importance of training OOWs to ensure successful adoption and acceptance. Consequently, this study aims to furnish the maritime industry with insights into how to adapt future navigational officer training to facilitate the evolution of the navigational seafaring role. Research has already identified that the current curriculum contains outdated training aspects, such as celestial navigation and paper chartwork, and that cadets believe that the educational sector of the industry is not suitably arming them with the knowledge to succeed in the future of shipping [35]. The work conducted within this study has identified that, with the transition towards autonomy, behavioural training has the potential to be the most beneficial method for trainees. When comparing the fault recognition skills of participants within their respective training groups, it was found that 50% of participants from the behaviourally trained group successfully recognised the fault, whereas only 10% of technically trained participants did so. The results of this study indicate that while the training of officers must be adapted for autonomy to succeed, future training topics should focus less on system knowledge and more on employing a reflective method of education.
While the behaviourally trained group was not infallible, the results of this study identify that incorporating aspects such as SA, automation bias (AB), and complacency into the maritime education curriculum can improve fault recognition skills. Moreover, the results of the Fisher Exact test identified statistically significant relationships between the various participant groups, and while rank provided a strong relationship, the training package that participants received delivered a stronger relationship.
When analysing the groups individually, the greatest difference was found between the BQ and TU groups. Conversely, the BU and TQ groups showed no statistically significant difference, indicating that both groups behaved in a similar manner. This lack of statistical significance suggests that the training package, rather than rank, is a more influential factor in the participants’ success in fault recognition. This finding underscores the importance of tailored training programmes in enhancing fault recognition skills among maritime individuals. Moreover, it highlights the need for the maritime industry to focus on developing and implementing effective training packages that can significantly improve the fault recognition abilities of the participants, ultimately contributing to the success of autonomous systems in maritime operations.
Initial theories from previous work highlighted a potential over-reliance and unwavering trust in sophisticated systems [31]. The results of this study further support this theory, with 70% of seafaring participants failing to react to a gyro drift, despite being given more time to identify the fault. Interestingly, this study suggests that the concentration an individual applies to the workbook is not indicative of their success in recognising the fault, as participants who completed the most and least paperwork both failed to recognise the gyro drift. These findings underscore the complexity of fault recognition and the importance of effective training in enhancing situational awareness and diagnostic skills. Furthermore, the findings show that future technologies and navigational systems must introduce aspects to the system that can build on the system design of the bridge navigational watchkeeping alarm system (BNWAS), which supports the theory stated in past research [36].
Regardless of rank, all participants were subjected to the same conditions and environment, which included visual and auditory stimuli such as alarms, the vessel’s wake, and the changing of the rudder angle indicator. However, the inclusion of routine tasks, such as paperwork, caused participants to divide their focus between completing these tasks and conducting a safe navigational watch. Distractions, such as the sounding of false alarms, can impact a participant’s attention and potentially lead to alarm fatigue, resulting in the participant failing to react to future alarms. This phenomenon was observed in the lack of interest in alarms in the ETA. Alarm fatigue has long been documented as an issue within human factors, and research into mitigating alarm fatigue has gained prominence with the advent of autonomous shipping [37,38].
The aim of autopilot and autonomous systems, like all technology, is to aid the operator and reduce the human workload. However, reducing the workload should not eliminate the need for individual vigilance [39]. The results of the ETA indicated that, out of 60 participants, less than half took the initiative to inspect an abnormal occurrence. Furthermore, with only 30% of participants correctly identifying a fault, the presence of bias towards the autopilot operating correctly and complacency towards the navigational systems is evident among the cohort tested. Research suggests that maritime trainees primarily focus on passing exams, and it can be assumed that individuals may have subconsciously perceived this exercise as being similar to an examination [40]. Given the simulated environment, it is expected that the number of individuals successfully recognising the fault would be higher compared to a real-life situation due to the heightened sense of awareness when entering the simulator. However, only 15% of participants recognised the fault without the aid of an alarm, which could indicate that even fewer individuals would recognise this fault in a real-life situation. Nevertheless, with 35% of participants documenting the fault, this could allow the OOW to report it at the watch handover, potentially leading to the fault being identified later during the voyage in a real-life setting.
The findings of the study indicate that educating individuals on technical subjects alone does not significantly enhance the fault recognition skills of an OOW. In contrast, educating an OOW on behavioural subjects, such as situational awareness, attention management, and human factors, can substantially improve their ability to identify system malfunctions. This highlights the importance of incorporating behavioural training into MET programs. Therefore, future MET curricula should not solely focus on teaching students how to operate systems. Instead, they should also aim to educate future officers on how to manage human factors and enhance their watchkeeping skills. Addressing behavioural aspects such as decision-making, stress management, and teamwork can better prepare officers for the complexities of maritime operations. One effective approach to achieving this is through the utilisation of a blended learning method. This method allows students to learn theoretical topics in the classroom and then consolidate their understanding through practical application in the bridge watchkeeping simulator. This hands-on experience enables students to apply behavioural principles in a controlled environment, reinforcing their learning and improving their practical skills. Additionally, this approach supports the theory determined from past research, which suggests that a combination of classroom learning and simulation training can lead to better retention and application of knowledge.
By integrating behavioural training into MET programs and employing a blended learning approach, the industry can better prepare future maritime officers to recognise and address system malfunctions, ultimately enhancing safety and efficiency in maritime operations [41].
Future systems should include decision support tools to help seafarers better understand situations. However, studies have shown that seafarers may overly trust reliable automated systems, leading to AB [42]. Therefore, future systems should have simple user interfaces that prompt human operators to make judgements based on their knowledge, promoting human autonomy teaming (HAT) [43]. While HAT offers numerous benefits to improve safety, the industry must be aware of the potential pitfalls associated with introducing such sophisticated systems. Currently, bridge systems consist of highly automated functions, including autopilot and auto tracking. However, as the industry progresses and new systems are implemented, there is a risk that increased automation may lead to greater complacency in daily operations. Therefore, it is crucial to strike a balance that optimises operator engagement within the HAT hierarchy. Achieving this balance will ensure that operators remain vigilant and effectively utilise automated systems to enhance safety and operational efficiency.
4.2. Situation Awareness, Workload and Trust
The study utilised the PES to gain deeper insights into participants’ understanding of the exercise and autonomous shipping. Analysis of the SA section revealed that while participants demonstrated general awareness of their own vessel’s parameters, uncertainty about the parameters of other vessels was consistent across all groups. Behaviourally trained participants performed better than their technically trained counterparts; yet, the ANOVA results did not show statistically significant differences in participant responses between the training types. This highlights the importance of further exploring factors such as alarm fatigue, alarm management, and distractions, which may critically impact performance in autonomous maritime operations.
Trust-related findings from the PES presented a complex picture, with contradictory responses. Participants who recognised faults exhibited vigilance but provided inconsistent answers to trust-related questions, suggesting potential confusion arising from the phrasing of these questions. NASA TLX results revealed that all participants perceived the exercise as involving high workloads, regardless of their ability to identify faults, suggesting that workload experiences were largely uniform across groups. These findings highlight the intricate demands of training for autonomous operations and the challenges in assessing situational awareness, trust, and workload in this context. They also emphasise the need for focused research to optimise training methods, improve alarm systems, and mitigate distractions, ultimately ensuring the safe and effective implementation of autonomous technologies in maritime environments.
4.3. Limitations
One limitation of this study was the duration of the exercise. Although the length was extended from 20 to 30 min, with respect to previous studies, it remains substantially shorter than a standard navigational watch of at least four hours. However, research indicates that participants typically respond to scenarios within the initial ten minutes of such exercises, suggesting that extending the simulator time further may not significantly alter outcomes unless the failure is identified early [44]. Another key limitation lies in the timing of the training provided. Participants received their training immediately before entering the simulator, ensuring the material was fresh in their minds. While this approach facilitated immediate application, it does not accurately reflect the real-world scenario of an officer commencing a watch after a longer gap since undertaking the training. Future studies should explore the effects of expanded training sessions, including additional sub-themes, and evaluate outcomes after varied intervals (e.g., an hour, a day, or a week) to assess the retention and long-term impact of the training.
Finally, the study relied on closed-circuit television (CCTV) and microphones to monitor participant behaviour during the exercise. While effective for capturing actions and verbal communication, the absence of advanced hardware such as eye-tracking devices limited the ability to measure participants’ focus and attention precisely. Incorporating eye-tracking technology in future research could provide richer insights into participants’ cognitive processes during system failures, enhancing the understanding of their decision-making and situational awareness.
5. Conclusions
The shift to autonomous unmanned vessels will not occur overnight. As a result, human operators will continue to be needed at sea for the foreseeable future. The current initiative by the IMO is to gradually introduce complex autonomous systems and, over time, transition to fully autonomous vessel operations [45]. This has promoted research concepts such as HAT and human-in-the-loop (HITL) to have a lasting impact within the industry [46,47]. As such, many future onboard systems may utilise an advanced form of decision-making aids and technology; however, research has detailed the potential degradation of navigational skills with advanced technology [48]. Many maritime incidents have suggested that seafarers currently exhibit a lack of SA when using modern automated systems. Therefore, it is critical for seafarers to undertake further training now so that, as technology advances to the next phase of autonomy and automation, the OOW is equipped with the skills to correct potential malfunctions. This research has shown the positive impact that a 5 min training package on OOW behavioural traits can have on the fault recognition skills of participants. Therefore, the OOW may be particularly responsive to such training packages.
With the current OOW training regime focusing on aspects such as celestial navigation and paper chart work, it can be assumed that there will be a plan to evolve the current syllabus of navigational officers to incorporate more simulation and system understanding training [49]. With the development of short courses such as the navigational aids, equipment and simulator training (NAEST) Operational and Management courses, the use of simulators has become a method to enable students to develop core skills in a safe working environment [23,50]. This study suggests that short courses on SA can be developed by testing students with a variety of system failures. While short training packages may be beneficial prior to the OOW undertaking a navigational watch, a critical recommendation for future research is to increase the duration of the training package. Additionally, future research should focus on improving the quality of the training package to include cognitive response exercises before undertaking a simulated exercise. This would help determine whether refining the training package can significantly improve both the fault recognition and fault diagnosis skills of the OOW. Despite the evident benefits demonstrated by the participants in this study, it would be advantageous to assess the impacts of a combined training package compared to no training received. Doing so may yield further findings that could identify the optimum training topics to enhance fault recognition and diagnostic skills.
Author Contributions
Conceptualization, J.P.C., D.G., R.N. and K.P.; methodology, J.P.C.; software, J.P.C.; validation, J.P.C.; formal analysis, J.P.C.; investigation, J.P.C.; resources, J.P.C.; data curation, J.P.C.; writing—original draft preparation, J.P.C.; writing—review and editing, J.P.C., D.G., R.N. and K.P.; visualization, J.P.C.; supervision, D.G., R.N. and K.P.; project administration, J.P.C., D.G., R.N. and K.P.; funding acquisition, J.P.C., D.G., R.N. and K.P. All authors have read and agreed to the published version of the manuscript.
Funding
This research was funded by EPSRC Doctoral Training Programme, grant number EP/R15309X/1.
Data Availability Statement
The original contributions presented in this study are included in the article. Further inquiries can be directed to the corresponding author.
Acknowledgments
The authors would like to extend their gratitude to the participants of the study and the maritime faculty at South Tyneside College.
Conflicts of Interest
The authors declare no conflicts of interest.
Abbreviations
The following abbreviations are used in this manuscript:
| MASS | Maritime Autonomous Surface Ships |
| IMO | International Maritime Organization |
| IACS | International Association of Classification Societies |
| ECDIS | Electronic Chart and Display Information System |
| OOW | Officer of the Watch |
| STCW | Standards of Training Certification and Watchkeeping |
| SA | Situational Awareness |
| MET | Maritime Education and Training |
| PES | Post Exercise Survey |
| NASA TLX | NASA Task Load Index |
| GPS | Global Positioning System |
| BQ | Behaviorally Trained and Qualified Officers |
| TQ | Technically Trained and Qualified Officers |
| BU | Behaviorally Trained and Unqualified Officers |
| TU | Technically Trained and Unqualified Officers |
| ETA | Event Tree Analysis |
| FR | Fault Recognised |
| FUr | Fault Unrecognised |
| HDG | Heading |
| BNWAS | Bridge Navigational Watchkeeping Alarm System |
| AB | Automation Bias |
| HAT | Human Autonomy Teaming |
| HITL | Human in the Loop |
| NAEST | Navigational Aids Equipment and Simulator Training |
| CCTV | Closed-Circuit Television |
| COLREGs | Convention on the International Regulations for Preventing Collisions at Sea |
| CADA | Collision Avoidance and Detection Aids |
References
- Autsadee, Y.; Jeevan, J.; Othman, M.R.B.; Salleh, N.H.B.M. Maritime Society 5.0: A global transition on human economy and civilisation for maritime sustainability. Aust. J. Marit. Ocean Aff. 2025, 17, 1–26. [Google Scholar] [CrossRef]
- Ghazizadeh, M.; Lee, J.D.; Boyle, L.N. Extending the Technology Acceptance Model to assess automation. Cogn. Technol. Work. 2012, 14, 39–49. [Google Scholar] [CrossRef]
- OECD. Ocean Shipping and Shipbuilding. 2018. Available online: https://www.oecd.org/ocean/topics/ocean-shipping/#:~:text=The%20main%20transport%20mode%20for,transport%20arteries%20for%20global%20trade (accessed on 24 June 2023).
- Vagale, A.; Oucheikh, R.; Bye, R.T.; Osen, O.L.; Fossen, T.I. Path planning and collision avoidance for autonomous surface vehicles I: A review. J. Mar. Sci. Technol. 2021, 26, 1292–1306. [Google Scholar] [CrossRef]
- Kim, M.; Joung, T.-H.; Jeong, B.; Park, H.-S. Autonomous shipping and its impact on regulations, technologies, and industries. J. Int. Marit. Saf. Environ. Aff. Shipp. 2020, 4, 17–25. [Google Scholar] [CrossRef]
- IMO—Maritime Safety Committee. Development of a Goal-Based Instrument for Maritime Autonomous Surface Ships (MASS); IMO: London, UK, 2022. [Google Scholar]
- IACS. Cyber Resilience of On-Board Systems and Equipment (E27); IACS: London, UK, 2022. [Google Scholar]
- IACS. Cyber Resilience of Ships (E26); IACS: London, UK, 2022. [Google Scholar]
- IACS. International Association of Classification Societies: Position Paper—MASS. March 2019. Available online: https://iacs.s3.af-south-1.amazonaws.com/wp-content/uploads/2023/09/29165530/IACS-MASS-Position-paper-Rev3.pdf (accessed on 18 May 2023).
- American Bureau of Shipping. Autonomous Vessels; American Bureau of Shipping: Houston, TX, USA, 2022. [Google Scholar]
- Det Norske Veritas—Germanischer Lloyd. Remote-Controlled and Autonomous Ships in the Maritime Industry; DNV: Oslo, Norway, 2018. [Google Scholar]
- Bureau Veritas. Guidelines for Autonomous Shipping. October 2019. Available online: https://erules.veristar.com/dy/data/bv/pdf/641-NI_2019-10.pdf (accessed on 16 June 2023).
- Schiaretti, M.; Chen, L.; Negenborn, R.R. Survey on Autonomous Surface Vessels: Part I—A New Detailed Definition of Autonomy Levels. In Computational Logistics; Springer: Cham, Switzerland, 2017; pp. 219–233. [Google Scholar]
- Skibniewski, M.; Hendrickson, C. Automation and Robotics for Road Construction and Maintenance. J. Transp. Eng. 1990, 116, 261–271. [Google Scholar] [CrossRef]
- Staruch, B. The Automation by Expertise by Training Interaction: Why Automation-Related Accidents Continue to Occur in Sociotechnical Systems. Hum. Factors 2017, 59, 204–228. [Google Scholar] [CrossRef]
- Parasuraman, R.; Manzey, D.H. Complacency and Bias in Human Use of Automation: An Attentional Integration. Hum. Factors 2010, 52, 381–410. [Google Scholar] [CrossRef]
- Demirel, E. Possible Dangers of Automation Failures on Board and Measures to Avoid the Negative Effects of These Failures. Sci. Bull. Nav. Acad. 2019, 22, 22–35. [Google Scholar]
- Pazouki, K.; Forbes, N.; Norman, R.A.; Woodward, M.D. Investigation on the impact of human-automation interaction in maritime operations. Ocean Eng. 2018, 153, 297–304. [Google Scholar] [CrossRef]
- Marine Accident Investigation Branch—MAIB. Report on the Investigation of the Grounding of Ovit in the Dover Strait on 18 September 2013; MAIB: London, UK, 2013. [Google Scholar]
- Marine Safety Investigation Unit. Safety Investigation Report MV UNIVERSAL DURBAN Grounding in Position 02° 14.65′ N 109° 05.17′ E 13 May 2017; Transport Malta: Valetta, Malta, 2018. [Google Scholar]
- MAIB DMAIB. Application and Usability of ECDIS; MAIB & DMAIB: Korsoer, Denmark, 2021. [Google Scholar]
- Žuškin, S.; Brčić, D.; Uroda, M.; Strabić, M. Evolving ECDIS: Concept Development Through Different Manufacturer Models Comparison. TransNav Int. J. Mar. Navig. Saf. Sea Transp. 2023, 17, 227–234. [Google Scholar] [CrossRef]
- Maritime and Coastguard Agency. MSN 1856 (M+F)—Amendment 1—UK Requirements for Master and Deck Officers. 19 December 2022. Available online: https://www.gov.uk/government/publications/msn-1856-mf-amendment-1-uk-requirements-for-master-and-deck-officers (accessed on 16 May 2023).
- Tusher, H.M.; Nazir, S.; Ghosh, S.; Rusli, R. Seeking the Best Practices of Assessment in Maritime Simulator Training. TransNav Int. J. Mar. Navig. Saf. Sea Transp. 2023, 17, 105–114. [Google Scholar] [CrossRef]
- Vidan, P.; Bukljaš, M.; Pavić, I.; Vukša, S. Autonomous Systems & Ships—Training and Education on Maritime Faculties; Faculty of Maritime Studies, University of Split: Kotor, Montenegro, 2019. [Google Scholar]
- Sharma, A.; Kim, T.-E. Exploring technical and non-technical competencies of navigators for autonomous shipping. Marit. Policy Manag. 2022, 49, 831–849. [Google Scholar] [CrossRef]
- International Maritime Organization. Convention on the International Regulations for Preventing Collisions at Sea (COLREGs); IMO: London, UK, 1972. [Google Scholar]
- Zhou, X.-Y.; Huang, J.-J.; Wang, F.-W.; Wu, Z.-L.; Liu, Z.-J. A Study of the Application Barriers to the Use of Autonomous Ships Posed by the Good Seamanship Requirement of COLREGs. J. Navig. 2020, 73, 710–725. [Google Scholar] [CrossRef]
- Kim, T.-E.; Sharma, A.; Gausdal, A.H.; Chae, C.-J. Impact of automation technology on gender parity in maritime industry. WMU J. Marit. Aff. 2019, 18, 579–593. [Google Scholar] [CrossRef]
- Chan, J.; Golightly, D.; Norman, R.; Pazouki, K. Perception of Autonomy and the Role of Experience within the Maritime Industry. J. Mar. Sci. Eng. 2023, 11, 258. [Google Scholar] [CrossRef]
- Chan, J.P.; Pazouki, K.; Norman, R.A. An experimental study into the fault recognition of onboard systems by navigational officers. J. Mar. Eng. Technol. 2023, 22, 101–110. [Google Scholar] [CrossRef]
- Hart, S.G.; Staveland, L.E. Development of NASA-TLX (Task Load Index): Results of empirical and theoretical research. Hum. Ment. Workload 1988, 52, 139–183. [Google Scholar]
- Chan, J.P.; Pazouki, K.; Norman, R.A. An Analytical Assessment of the Situational Awareness of Seafarers & Their Trust in Automated Systems. In Proceedings of the INEC Conference: 15th International Naval Engineering Conference & Exhibition, Delft, The Netherlands, 6–8 October 2020. [Google Scholar]
- Punnoose, B. Risk Assessment and Management: ISM Code Perspective. 2018. Available online: https://intlreg.org/wp-content/uploads/2018/03/Risk-Assessment.pdf (accessed on 17 April 2025).
- Bogusławski, K.; Gil, M.; Nasur, J.; Wróbel, K. Implications of autonomous shipping for maritime education and training: The cadet’s perspective. Marit. Econ. Logist. 2022, 24, 327–343. [Google Scholar] [CrossRef]
- Rylander, R.; Man, Y. Autonomous Safety on Vessels an International Overview and Trends Within the Transport Sector; Lighthouse—Swedish Maritime Competence Centre: Gothenburg, Sweden, 2016. [Google Scholar]
- Li, F.; Lee, C.H.; Xu, G.; Chen, C.H.; Khoo, L.P. A QFD-Enabled Conceptualization for Reducing Alarm Fatigue in Vessel Traffic Service Centre. In Advances in Transdisciplinary Engineering, Vol. Transdisciplinary Engineering: A Paradigm Shift; IOS Press: Amsterdam, The Netherlands, 2017; pp. 821–828. [Google Scholar]
- Tam, K.; Hopcraft, R.; Crichton, T.; Jones, K. The potential mental health effects of remote control in an autonomous maritime world. J. Int. Marit. Saf. Environ. Aff. Shipp. 2021, 5, 40–55. [Google Scholar] [CrossRef]
- Masalonis, A.J.; Duley, J.A.; Parasuraman, R. Effects of Manual and Autopilot Control on Mental Workload and Vigilance During Simulated General Aviation Flight. Transp. Hum. Factors 1999, 1, 187–200. [Google Scholar] [CrossRef]
- Gholamreza, E.; Wolff, M.R. Contradictions in the practices of training for and assessment of competency: A case study from the maritime domain. Educ. + Train. 2008, 50, 260–272. [Google Scholar]
- Nakashima, T.; Moser, B.; Hiekata, K. Accelerated adoption of maritime autonomous vessels by simulating the interplay of stakeholder decisions and learning. Technol. Forecast. Soc. Change 2023, 194, 122710. [Google Scholar] [CrossRef]
- Lynch, K.M.; Banks, V.A.; Roberts, A.P.J.; Radcliffe, S.; Plant, K.L. What factors may influence decision-making in the operation of Maritime autonomous surface ships? A systematic review. Theor. Issues Ergon. Sci. 2024, 25, 98–142. [Google Scholar] [CrossRef]
- Brill, J.C.; Cummings, M.L.; Evan, A.W., III; Hancock, P.A.; Lyons, J.B.; Oden, K. Navigating the advent of human-machine teaming. Proc. Hum. Factors Ergon. Soc. Annu. Meet. 2018, 62, 455–459. [Google Scholar] [CrossRef]
- Molloy, R.; Parasuraman, R. Monitoring an Automated System for a Single Failure: Vigilance and Task Complexity Effects. Hum. Factors J. Hum. Factors Ergon. Soc. 1996, 38, 311–322. [Google Scholar] [CrossRef]
- MSC–IMO. 100th Session, Agenda Item 5: Regulatory Scoping Exercise for the Use of Maritime Autonomous Surface Ships (MASS); International Maritime Organisation: London, UK, 2018. [Google Scholar]
- Zhang, M.; Zhang, D.; Yao, H.; Zhang, K. A Probabilistic Model of Human Error Assessment for Autonomous Cargo Ships Focusing on Human–Autonomy Collaboration. Saf. Sci. 2020, 130, 104838. [Google Scholar] [CrossRef]
- Grønsund, T.; Aanestad, M. Augmenting the algorithm: Emerging human-in-the-loop work configurations. J. Strateg. Inf. Syst. 2020, 29, 101614. [Google Scholar] [CrossRef]
- Lou, Y.; Sun, Q. Over-reliance on database: A case study of web of science. Hum. Behav. Emerg. Technol. 2021, 3, 454–459. [Google Scholar] [CrossRef]
- Aylward, K.; Weber, R.; Lundh, M.; MacKinnon, S.N.; Dahlman, J. Navigators’ views of a collision avoidance decision support system for maritime navigation. J. Navig. 2022, 75, 1035–1048. [Google Scholar] [CrossRef]
- Røds, J.; Gudmestad, O. Use of Simulator Training to Mitigate Risks in Arctic Shipping Operations. TransNav—Int. J. Mar. Navig. Saf. Sea Transp. 2019, 13, 375–379. [Google Scholar] [CrossRef]


Disclaimer/Publisher’s Note: The statements, opinions and data contained in all publications are solely those of the individual author(s) and contributor(s) and not of MDPI and/or the editor(s). MDPI and/or the editor(s) disclaim responsibility for any injury to people or property resulting from any ideas, methods, instructions or products referred to in the content. |
© 2025 by the authors. Licensee MDPI, Basel, Switzerland. This article is an open access article distributed under the terms and conditions of the Creative Commons Attribution (CC BY) license (https://creativecommons.org/licenses/by/4.0/).