Abstract
Quaternary climate has been characterized by pronounced glacial–interglacial cycles, with eustatic sea-level fluctuations directly controlling coastal sedimentary environments. The Yellow River Delta, situated on the southwestern coast of Bohai Bay, bears a distinct stratigraphic imprint of marine–terrestrial environmental transitions. However, critical knowledge gaps persist in reconstructing an integrated continental–marine stratigraphic framework. This study focuses on the nearshore core CB2302, integrating sediment lithology, grain size, foraminiferal assemblages, and geochemical proxies to establish a regional stratigraphic chronology since MIS5. Three depositional units (DU1–DU3) and 12 sedimentary subunits (C1–C12) were identified based on grain-size distributions, geochemical signatures, hydrodynamic, and microfossil assemblages. Integration of AMS 14C dating and sequence stratigraphic analysis establishes a post-MIS 5 stratigraphic framework for the northern Yellow River Delta, revealing sedimentary responses to three transgressive–regressive cycles (MIS 5e, 5c, and 5a) and confirming widespread terrestrial deposition during MIS 4–2, with no detectable marine influence in MIS 3 strata. Furthermore, correlation with representative cores across the Yellow–Bohai Sea coastal system elucidates a unified model of shoreline migration patterns driven by post-MIS5 sea-level oscillations. These findings advance the understanding of Quaternary sediment–landscape interactions in deltaic systems and provide critical stratigraphic benchmarks for petroleum exploration and coastal engineering in active depositional basins.
1. Introduction
The Yellow River Delta, a quintessential river-dominated delta, has evolved under the interplay of fluvial sediment flux, channel avulsion, and sea-level oscillations. Since the Late Pleistocene, the Yellow River has delivered vast sediment loads to the northern Chinese coast, constructing multistage deltaic deposits that dominate the sedimentary architecture of the North China Plain, coastal zones, and continental shelf [1,2]. Along the western Bohai margin, this system has formed an expansive deltaic complex [3,4,5], profoundly influencing coastal engineering, ecosystems, and environmental stability [6,7]. Recent rapid socioeconomic growth and population expansion in the region—particularly intensified anthropogenic activities in the Dongying Port area and Chengdao Oilfield offshore zone have underscored the urgency of resolving stratigraphic correlations to guide sustainable development [8]. Stratigraphic research provides a critical geological foundation for sustainable decision-making by deciphering paleoenvironmental evolution and resource distribution patterns, as exemplified by sedimentation-sea-level coupling models derived from late Quaternary stratigraphic records in Bohai Bay, which enable precise assessment of coastal groundwater sustainability and salinization risks to optimize land-use planning [9].
The Bohai Sea, a shallow epicontinental sea on China’s eastern continental shelf, preserves a record of Quaternary sea-level changes shaped by the combined effects of glacial–interglacial cycles and regional tectonic activity. Since Marine Isotope Stage 5 (MIS5; about 130–70 ka BP), the Bohai region has undergone multiple large-scale transgression–regression events. These sea-level oscillations, reconstructed through borehole stratigraphy, microfossil assemblages, and isotopic geochronology, provide critical evidence for understanding East Asian monsoon evolution and sedimentary responses across continental shelf systems.
The Bohai Sea, as a semi-enclosed basin dominated by terrigenous inputs from the Yellow River, exhibits higher sedimentation rates and finer-grained deposits compared to the broader Bohai–Yellow Sea sedimentary system, which integrates both fluvial–deltaic (Bohai) and marine-reworked (Yellow Sea) components. These subsystems collectively archive distinct responses to Marine Isotope Stages (MIS) 1, 3, and 5, with MIS 2 (glacial) accentuating Bohai’s rapid progradation versus Yellow Sea’s condensed strata, ultimately reflecting eustasy–tectonic interplay through differential sediment partitioning and provenance shifts. During MIS5e (125 ka BP), a highstand (about 6–9 m above present) flooded the Bohai Sea, depositing widespread shallow marine with robust microfossil evidence [10]. Subsequent MIS5c/a oscillations are variably preserved, often truncated by erosional unconformities [11]. Controversy surrounds MIS3: while early studies proposed a mid-MIS3 transgression (e.g., the Huanghua Transgression), recent AMS 14C chronologies reattribute purported MIS3 marine layers in western Bohai cores (e.g., TJC-1) to MIS5, with no definitive MIS3 strata identified. In contrast, MIS1 (~11.7 ka BP–present) records rapid postglacial transgression, forming well-preserved tidal-flat to prodelta sequences across the shelf [12]. Current debates focus on reconciling chronological discrepancies, stratigraphic incompleteness, and tectonic overprints in MIS5/3 records, while MIS1 dynamics are increasingly resolved via high-resolution multiproxy approaches.
To address these controversies, this study utilizes samples from core CB2302, located in the shallow marine zone of Bohai Bay within the northern Yellow River Delta, and integrates sedimentological, hydrodynamic, and micropaleontological analyses to investigate sedimentary dynamics and environmental evolution across glacial–interglacial cycles. We employ grain-size statistics, frequency and cumulative probability curves, hydrodynamic partitioning via C-M diagrams, and benthic foraminiferal assemblages to reconstruct stratigraphic evolution. By correlating depositional sequences across representative cores in the Yellow–Bohai Sea system, we establish a spatiotemporal framework for sediment distribution in the northern Yellow River Delta. This multi-proxy approach resolves ambiguities in transgressive–regressive cyclicity and provides a robust basis for reconciling regional stratigraphic discordance.
2. Material and Methods
2.1. Sediment Sample Collection
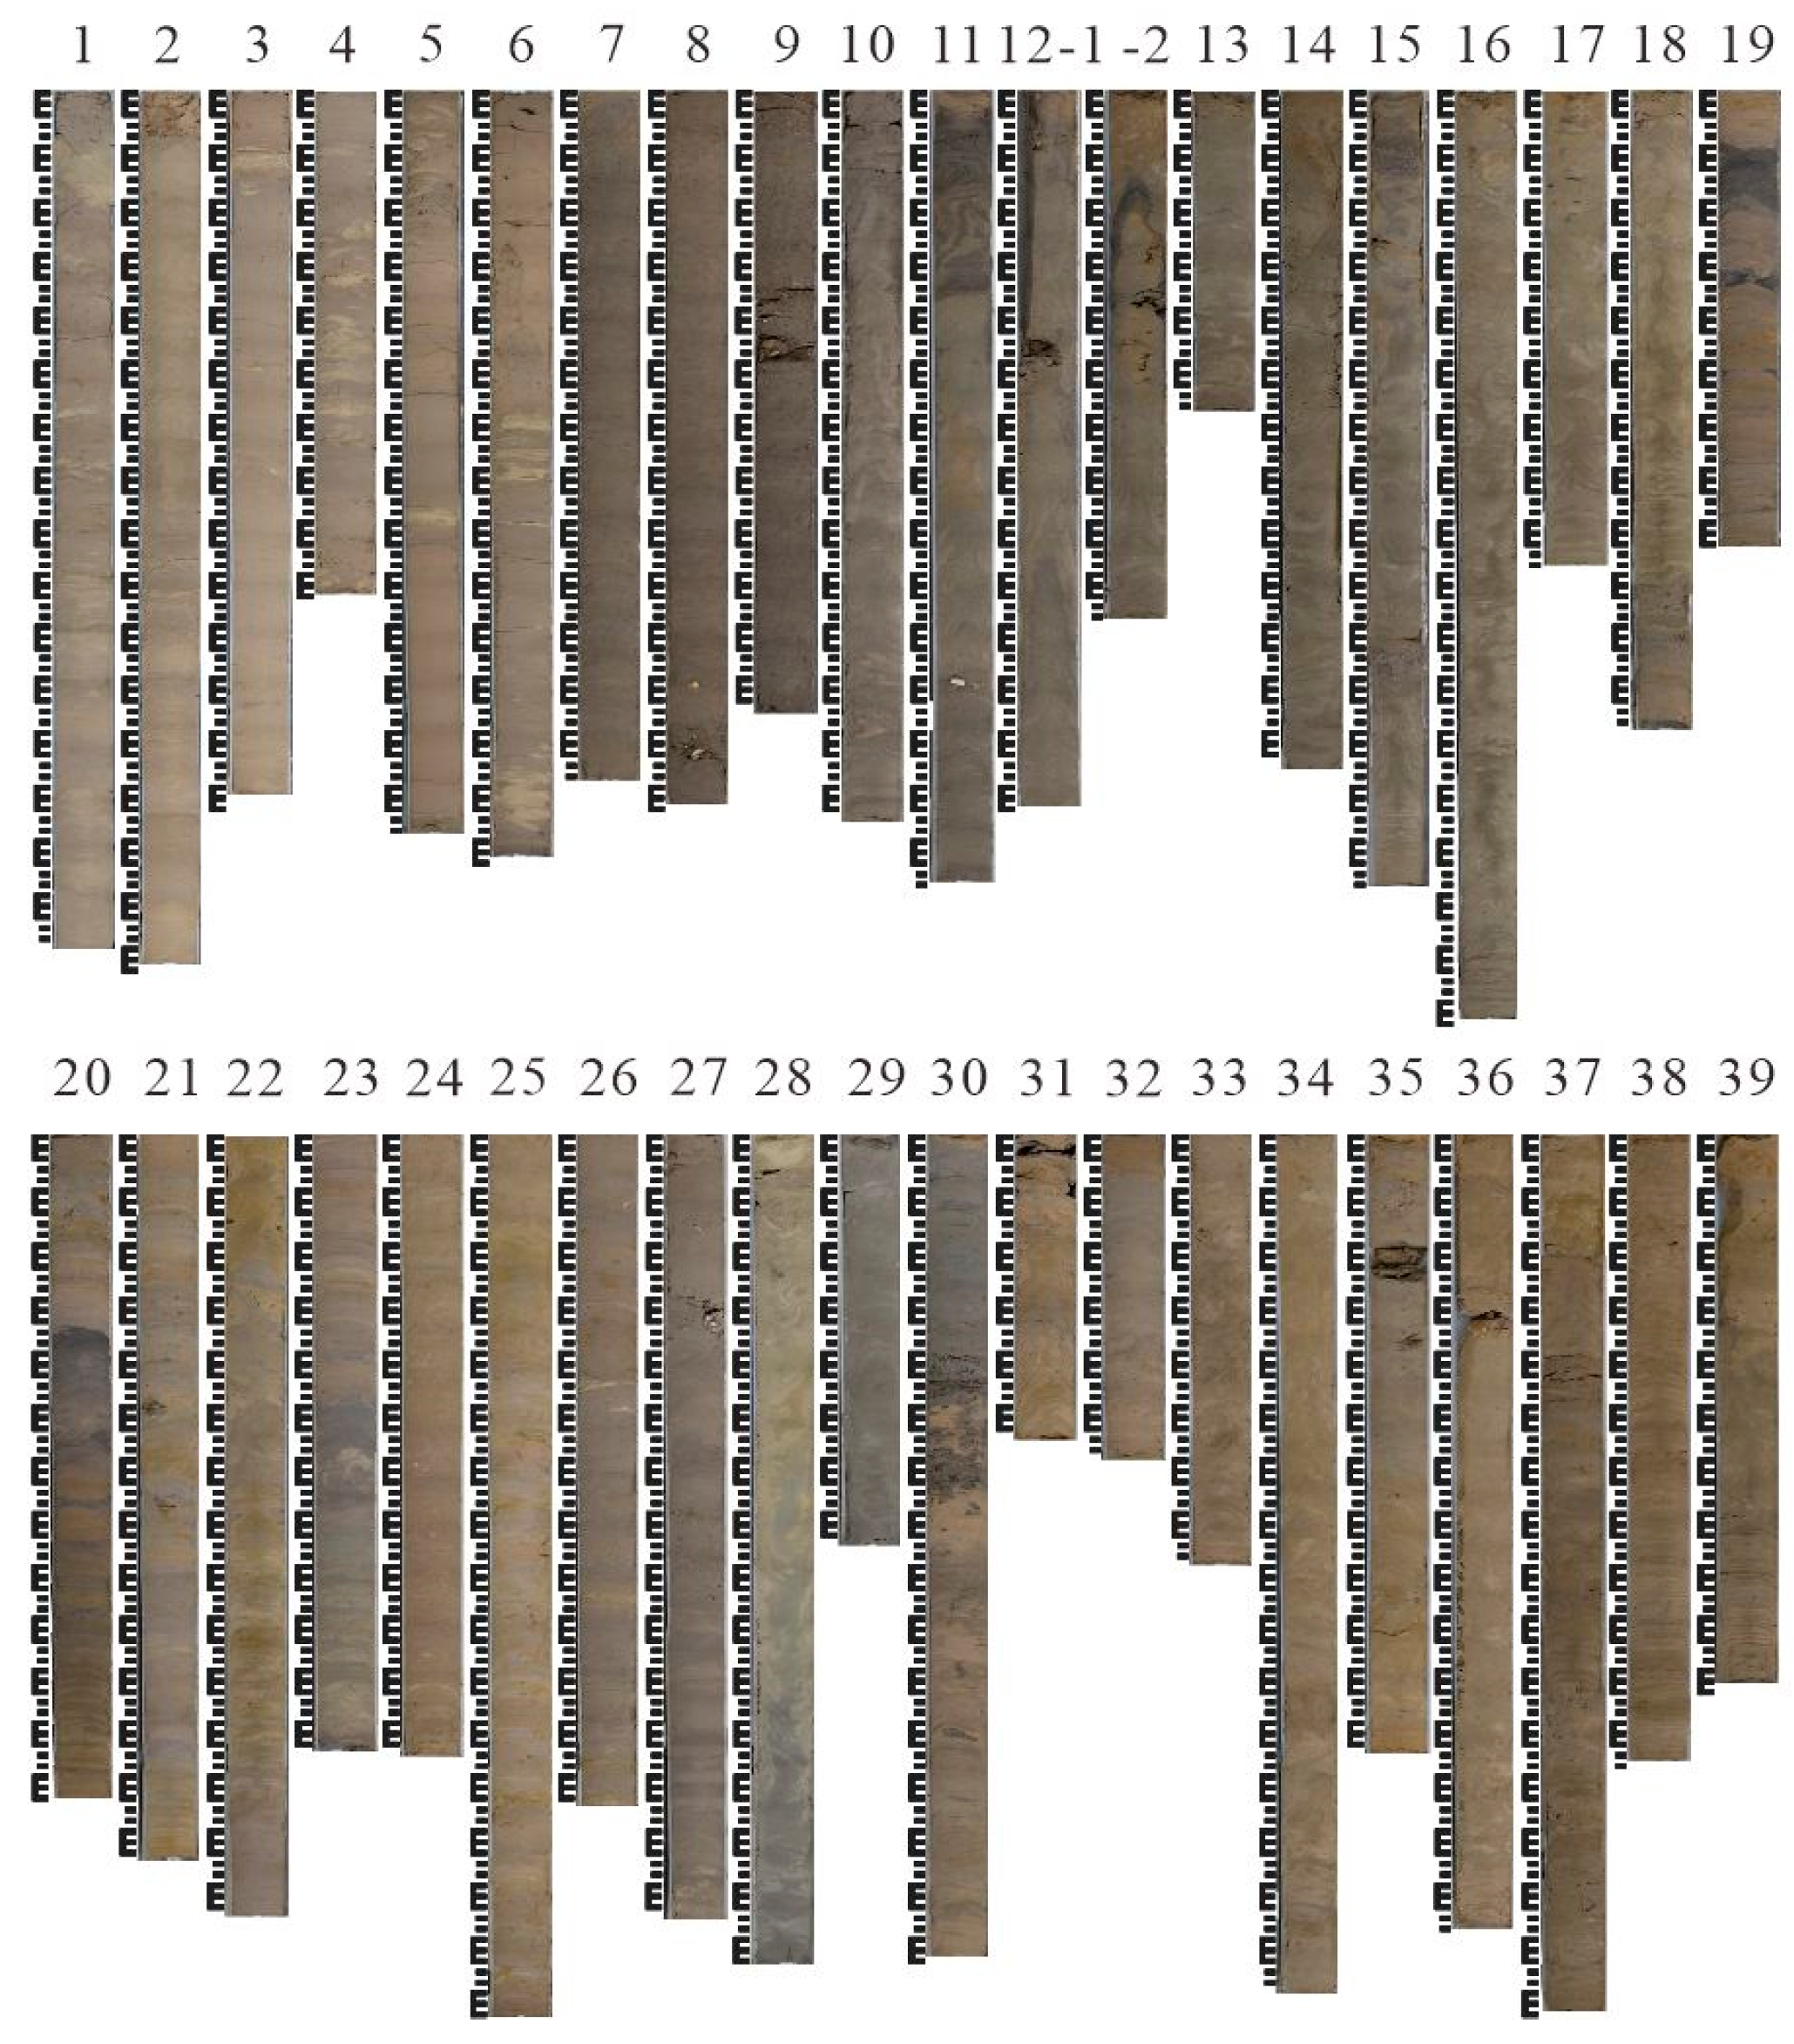
Core CB2302 (38°09′10.6″ N,118°51′16.7″ E, 60.46 m long, 6.5 m water depth; Figure 1) was retrieved from the north side of the Yellow River Delta in 2023. From this sediment core, 2541 samples were extracted, at intervals of approximately 2 cm (Figure 2). These segmented samples were then wrapped in pre-baked aluminum foil and sealed for freezing storage at −20 °C until pretreatment.
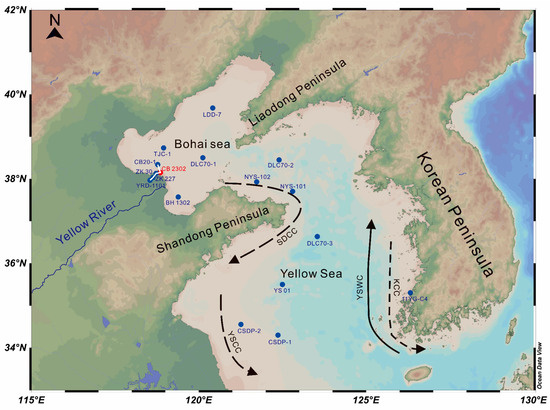
Figure 1.
Study sites. CB2302 (Yellow River Delta, this study), ZK30 (Yellow River Delta) [13], ZK227 (Yellow River Delta) [14], YRD-1101 (Yellow River Delta) [15], CB20-1 (Yellow River Delta), TJC-1 (Bohai Bay) [12], BH1302 (Laizhou Bay) [10], LDD-7 (Liaodong Bay) [16], DLC70-1 (Central Bohai Sea) [17], DLC70-2 (Central North Yellow Sea) [18], NYS-101 (Southern North Yellow Sea) [19], NYS-102 (Southwestern North Yellow Sea) [19], DLC70-3 (Northern South Yellow Sea) [20], YS01 (Central South Yellow Sea) [21], CSDP-2 (Western South Yellow Sea) [22], CSDP-1 (Southern South Yellow Sea) [21], 11YG-C4 (Eastern South Yellow Sea) [23]; The white line indicates the northern correlated profile of the Yellow River Delta in Section 4.2.; YSCC: Yellow Sea Coastal Current; YSWC: Yellow Sea Warm Current; KCC: Korean Coastal Current; SDCC: Shandong Coastal Current.
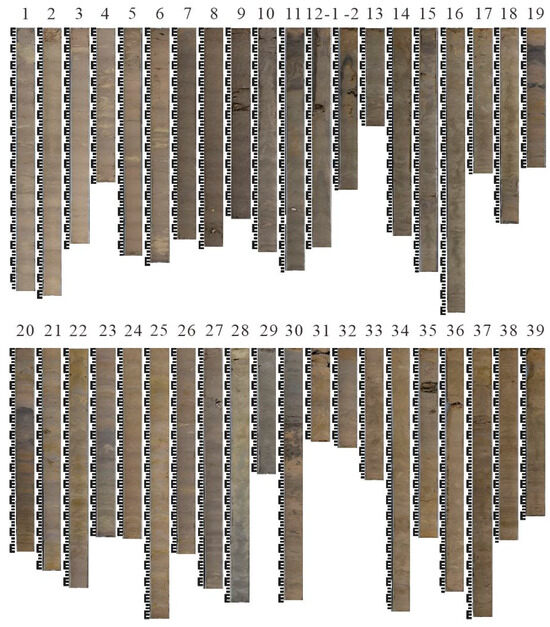
Figure 2.
Core photographs from Borehole CB2302 (Runs 1–39).
This study integrates sedimentary characteristics and chronological data from 16 cores (19–71.2 m depth) across the Bohai–Yellow Sea region to establish a unified stratigraphic framework, enabling systematic analysis of sediment dispersal patterns and paleoenvironmental evolution over glacial–interglacial cycles (Figure 1).
2.2. AMS 14C Dating
Based on sediment lithology and grain-size analysis, ten lithologically homogeneous, fine-grained layers from core CB2302 were selected for AMS 14C dating of foraminiferal tests. Sediments were transferred to beakers and treated with 200 mL of 30% hydrogen peroxide (H2O2) to remove organic matter. After 24–48 h of reaction (until gas emission ceased), organic material was fully oxidized, and mineral particles were separated from foraminiferal tests. The samples were then wet-sieved through a 0.063 mm mesh to eliminate fine-grained components. Dried residues were examined under a microscope to manually extract intact, clean foraminiferal tests. To ensure dating accuracy, only pristine tests of comparable size were selected, minimizing potential biases from reworking, allochthonous transport, or contamination. Ultimately, five samples met the required weight (6–10 mg) for AMS 14C analysis. The purified foraminiferal tests were submitted to Beta Analytic Inc. (Miami, FL, USA) for AMS 14C dating.
2.3. Grain Size Analysis
Grain size analysis was performed using a Malvern–Mastersizer2000 laser diffraction particle size analyzer at the College of Marine Geoscience, OUC, Qingdao, China. Approximately 0.5 g of each sample was placed in a centrifuge tube, where it was treated with a 10% hydrogen peroxide (H2O2) solution for 24 h to remove organic matter. Diluted hydrochloric acid (HCl) was then added to dissolve biological shells completely. After the machine measurements, the average particle size was calculated using the Fokker–Ward formula. The measurement range was 0.017 to 2000 µm with a resolution of 0.1 Φ.
2.4. C-M Diagram Analysis
The C-M diagram, introduced by Passega (1957) through the analysis of over 10,000 sediment samples, is a grain-size-based graphical tool for inferring sedimentary processes [24]. Passega proposed that the distinct combinations of three sediment populations—differentiated by transport mechanisms (traction, saltation, and suspension)—exhibit systematic relationships with hydrodynamic conditions, offering robust environmental interpretations. Among grain-size parameters, two are critically diagnostic: (1) the C-value, defined as the grain size at the 1st percentile on the cumulative curve, representing the maximum transportable particle size under peak energy conditions; and (2) the M-value, the median grain size at the 50th percentile, reflecting sustained transport energy.
In C-M diagrams, the C=M baseline is constructed by connecting points where C equals M. Gravity flow deposits (e.g., turbidites) are characterized by patterns parallel to this baseline, whereas traction current deposits (e.g., fluvial or tidal sands) display segments either partially parallel (N-O-P-Q-R-S divisions) or entirely divergent from the baseline.
2.5. Foraminifera Identification
Based on lithostratigraphic division and core description, 59 samples from core CB2302 were collected for foraminiferal identification and analysis. Sample pretreatment and taxonomic procedures strictly adhered to the Marine Survey Specification—Marine Geology and Geophysics Survey (GB/T12763.8-2007) [25].
The processing protocol comprised the following steps: Dried samples were incubated at a constant temperature of 50 °C and treated with approximately 200 mL of 10% H2O2 to oxidize organic matter and disperse sediment particles. The mixture was left undisturbed for 24–48 h, with supplemental H2O2 added as needed to sustain reactivity. After the reaction ceased, samples were rinsed through a 0.063 mm (250 mesh) standard copper sieve to isolate the coarse fraction, which was then oven-dried at 50 °C for microscopic examination.
Taxonomic identification was conducted using an OLYMPUS SZX61 stereo microscope (Olympus Co., Ltd., Tokyo, Japan), with all foraminiferal tests identified to genus or species level. For samples with abundant tests, subsampling (e.g., 1/2, 1/4, 1/8) was performed prior to identification to ensure analytical efficiency. A minimum of 1–300+ tests were analyzed per sample, followed by a systematic statistical evaluation of the taxonomic data.
3. Results
3.1. AMS 14C Dating Results
In the core of the CB2302 hole at 60.46 m, three AMS 14C dating data above 15 m showed a normal age sequence, while two samples below 30 m exceeded the upper limit of dating and are for reference only (Table 1).

Table 1.
Summary of core CB2302 age control points.
3.2. Grainsize Characteristics
Based on the sedimentary characteristics (lithology, sedimentary structures, grain size) and microfossil analysis of borehole CB2302, the stratigraphic sequence is divided into 12 sedimentary units (C1–C12) from top to bottom. Units C1–C3 belong to the first marine layer (DU1), C4 to the first terrestrial layer (DU2), and C5–C12 to the second marine layer (DU3).
- (1)
- C1: Modern Yellow River Delta (0–4.14 m)
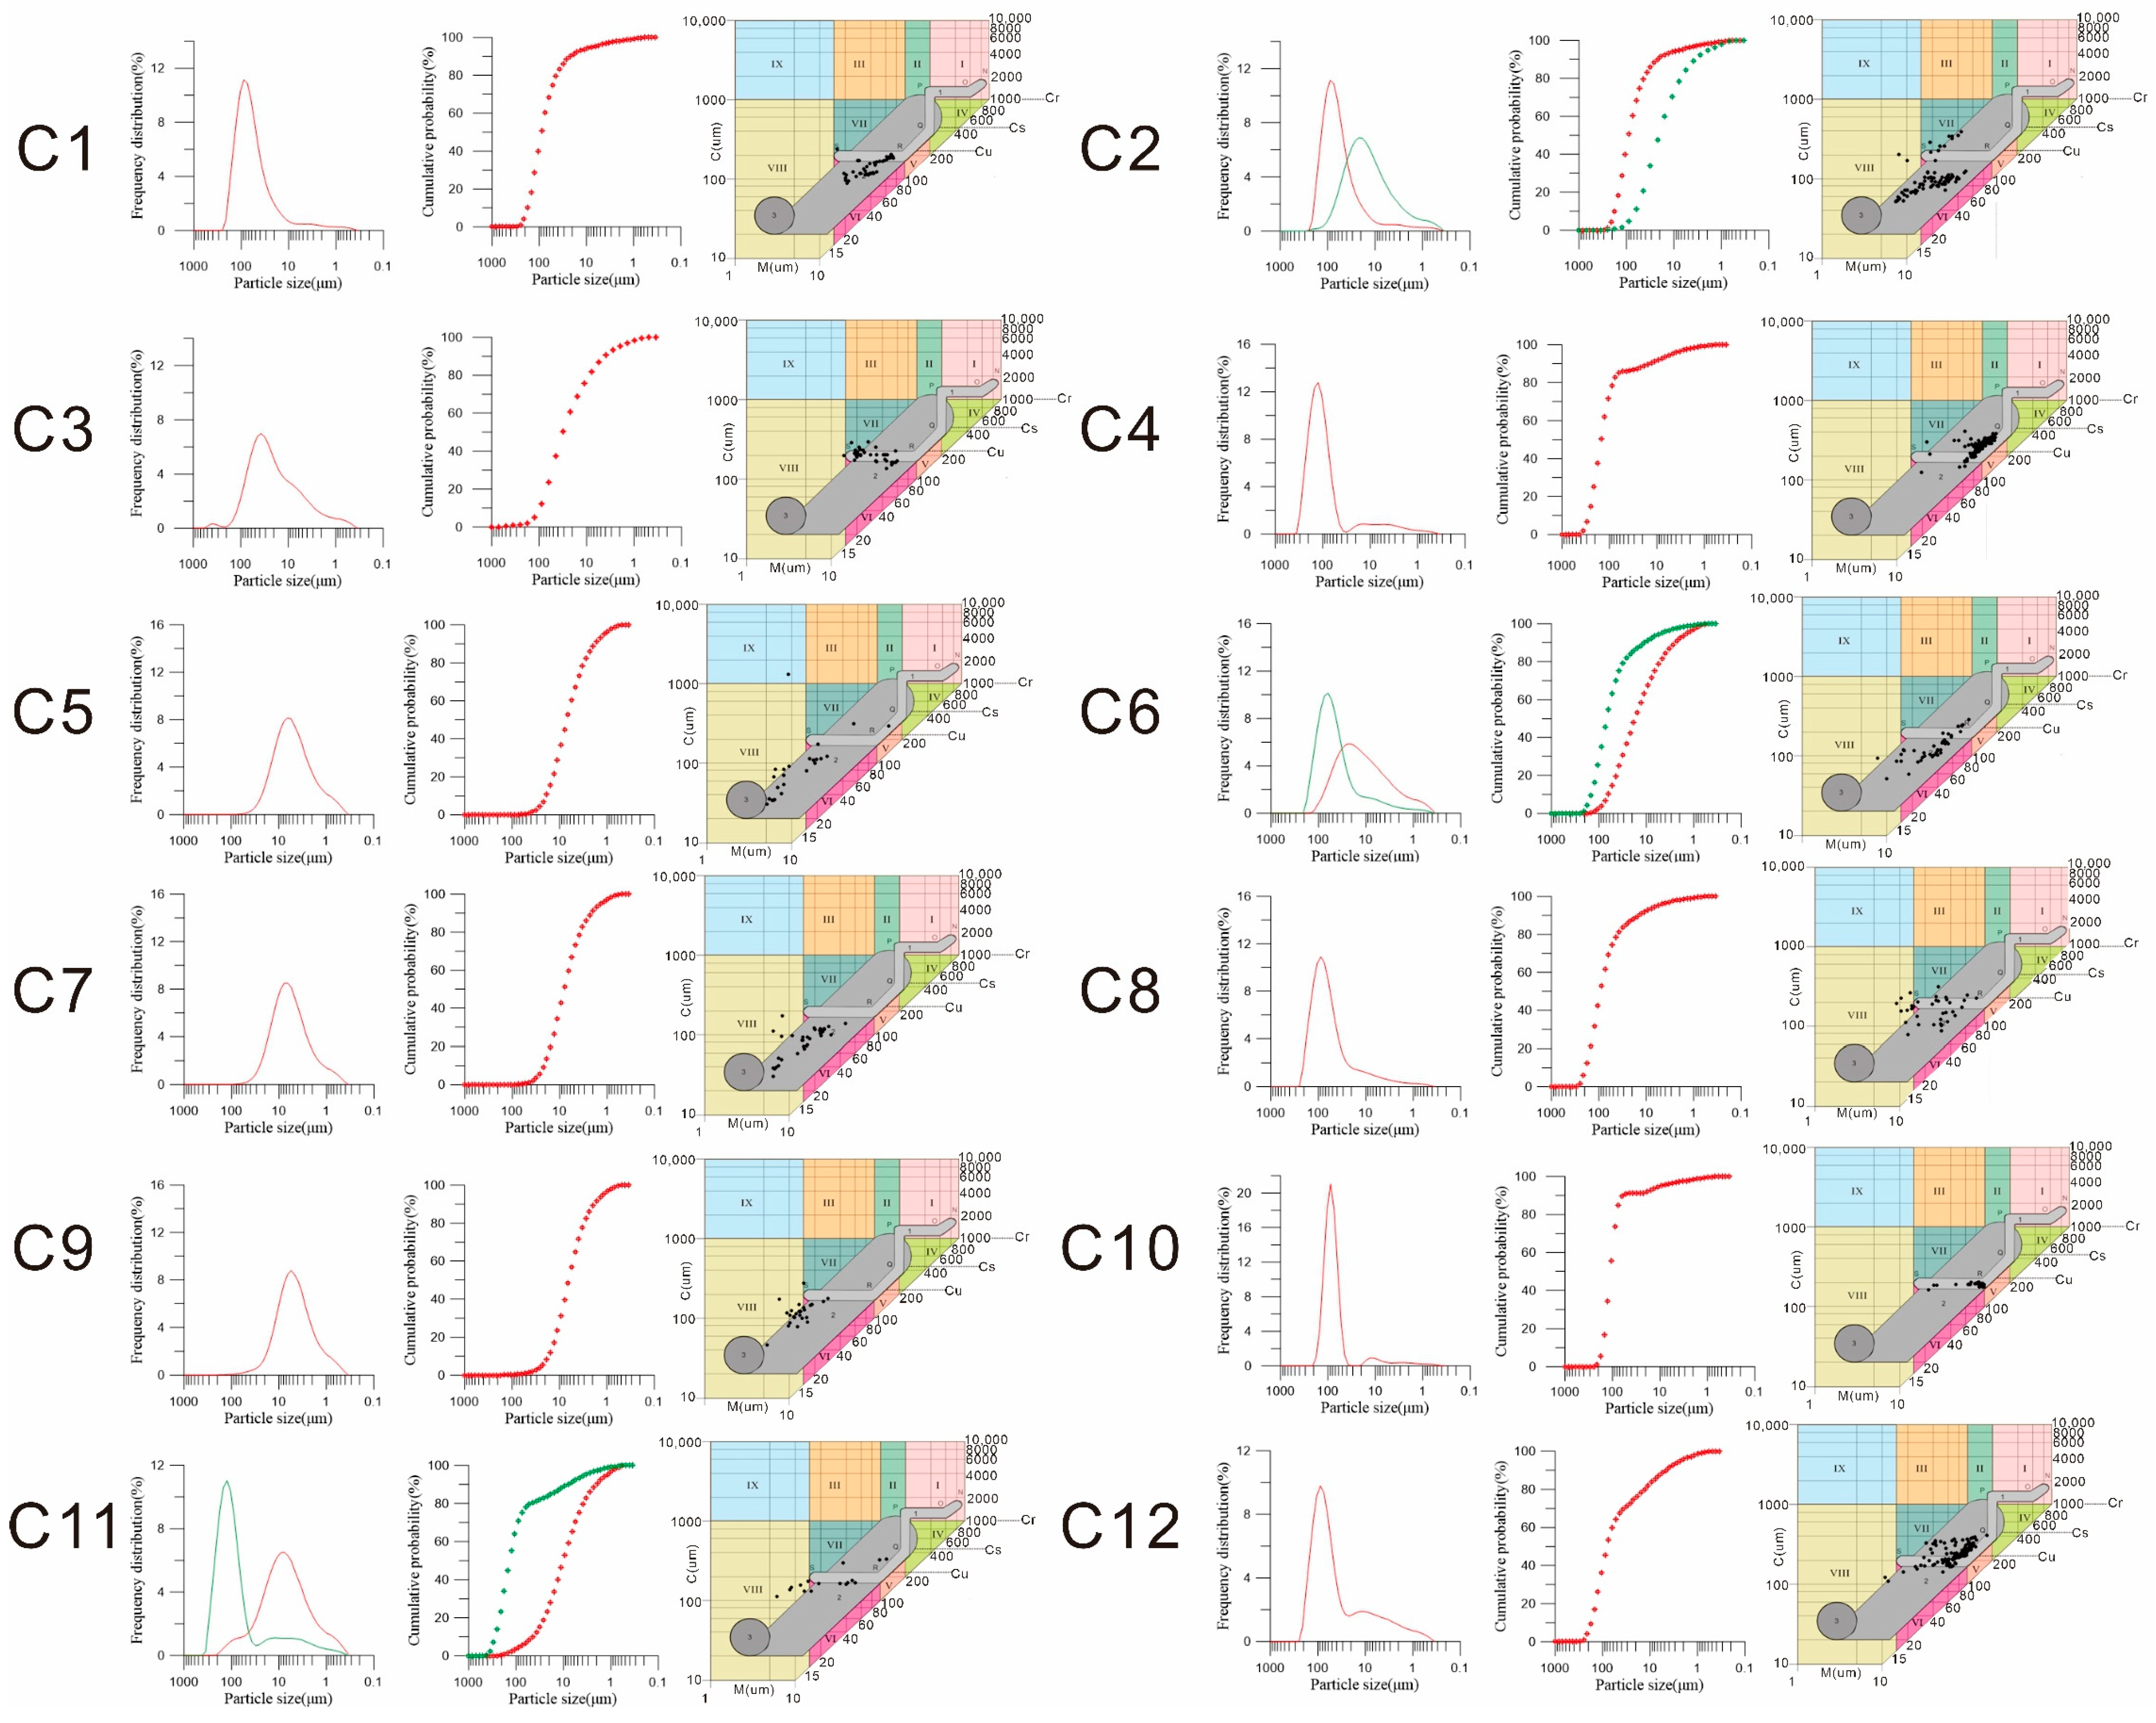
This interval, identified as modern deltaic deposits through historical bathymetric data, consists of light brown silty clay interbedded with yellow silt, exhibiting horizontal and flaser bedding (Figure 3j). Average sand, silt, and clay contents are 36.20% (5.78–71.51%), 55.81% (25.40–83.38%), and 7.98% (1.54–16.53%), respectively (Figure 3b). Grain-size parameters indicate low sorting (mean: 1.91), positive skewness (mean: 1.66), and sharp kurtosis (mean: 2.54) (Figure 3d–f). Frequency distribution curves show a unimodal peak near 100 µm, suggesting strong but stable hydrodynamic conditions with concentrated grain sizes. Probability cumulative curves are dominated by traction and saltation components (>90%), with suspended fractions <10% (Figure 4). C-M diagrams classify these sediments within Zone VI (traction-dominated graded suspension; RS segment) (Figure 4). No benthic foraminifera are present, consistent with rapid deposition during the 1855 Yellow River avulsion.
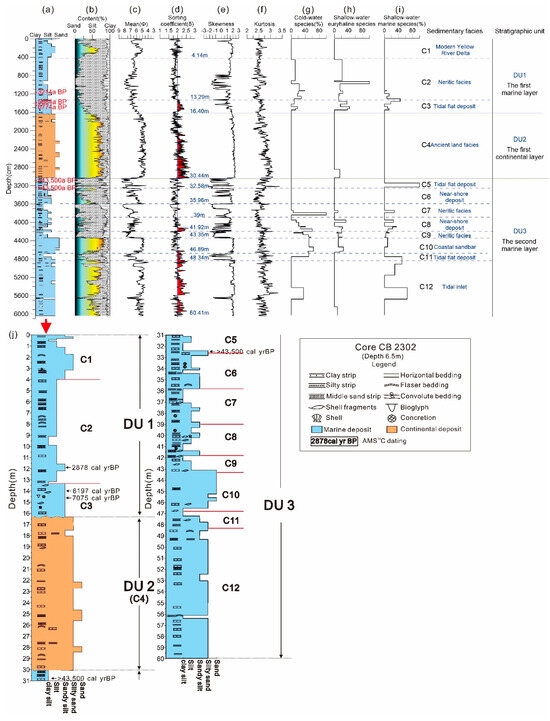
Figure 3.
Stratigraphic sequence division of core CB2302. (a) Composite lithology column; (b) Sand-silt–clay percentages; (c) Mean grain size; (d) Sorting coefficient; (e) Skewness; (f) Kurtosis; (g) Cold-water benthic foraminifera abundance; (h) Euryhaline shallow-water benthic foraminifera abundance; (i) Shallow-water benthic foraminifera abundance; (j) Enlarged lithology column of CB2302.
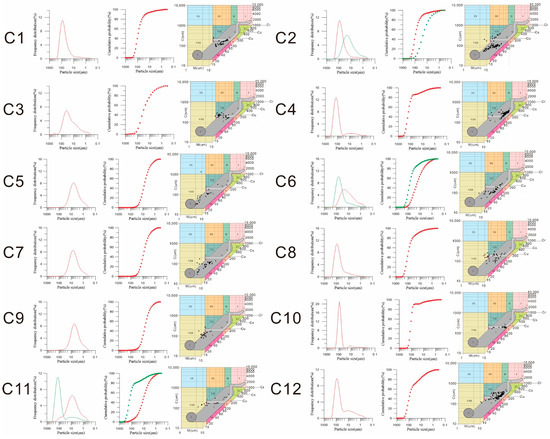
Figure 4.
Grain-size frequency distribution curves (left), probability cumulative curves (middle), and C-M diagrams (right) of sediments from the 12 depositional units.
- (2)
- C2: Neritic facies (4.14–13.29 m)
This unit comprises brown silt with clayey silt interlayers and occasional yellow sandy silt, displaying horizontal and flaser bedding (Figure 3j). Average sand, silt, and clay contents are 9.27% (0.32–31.71%), 77.73% (60.38–91.01%), and 12.99% (2.67–27.40%), respectively (Figure 3b). Grain-size parameters show low sorting (mean: 1.85), positive skewness (mean: 0.61), and sharp kurtosis (mean: 2.53) (Figure 3d–f). Bimodal frequency peaks at 60 µm and 8 µm reflect alternating hydrodynamic regimes: saltation-dominated (>80%, slope >70°) and suspension-dominated transport (Figure 4). C-M diagrams indicate weak initial and mean hydrodynamic energy (Figure 4). Abundant benthic foraminifera (Figure 3g–i) suggest deposition under coastal current influence.
- (3)
- C3: Tidal Flat (13.29–16.40 m)
Dominantly brown silty clay and clayey silt with thin silt layers, this unit contains shell fragments (14.95–15.47 m) and bioturbation structures (Figure 3j). Average sand, silt, and clay contents are 45.13% (10.02–45.89%), 49.52% (45.19–75.20%), and 5.34% (3.92–17.63%), respectively, with upward fining (Figure 3b). Grain-size parameters include low sorting (mean: 1.86), positive skewness (mean: 1.81), and sharp kurtosis (mean: 2.48) (Figure 3d–f). Unimodal peaks near 40 µm and saltation–suspension probability curves (Figure 4) indicate stable, weak hydrodynamics. C-M diagrams suggest graded suspension with moderate energy (Figure 4). Rare benthic foraminifera imply tidal flat deposition under fluctuating marine-terrestrial conditions.
- (4)
- C4: Paleo-Terrestrial (16.40–30.44 m)
Light brown sandy silt dominates, with yellow silt and dark brown clayey silt interbeds and flaser bedding. A lacustrine shell layer occurs at 18.95–19.01 m (Figure 3j). Average sand, silt, and clay contents are 66.43% (10.48–87.13%), 26.99% (9.08–74.81%), and 6.57% (1.57–18.32%), respectively (Figure 3b). High sorting (mean: 2.11), extreme positive skewness (mean: 2.07), and sharp kurtosis (mean: 2.75) characterize this unit (Figure 3d–f). Unimodal peaks at 110 µm and 8 µm, saltation-dominated (>85%) probability curves, and C-M Zone VIII (QR-RS transition) (Figure 4) indicate strong, stable traction currents. Rare euryhaline foraminifera suggest reworking into this paleo-terrestrial deposit.
- (5)
- C5: Tidal Flat (30.44–32.58 m)
Brown to black clayey silt interbedded with yellow silt and sandy silt exhibits horizontal bedding (Figure 3j). Average sand, silt, and clay contents are 9.89% (0.03–44.37%), 67.39% (45.38–84.36%), and 22.70% (9.64–38.98%), respectively (Figure 3b). Variable parameters include low sorting (mean: 1.85), negative skewness (mean: −0.45), and moderate kurtosis (mean: 2.74) (Figure 3d–f). Unimodal peaks near 10 µm and >95% suspension components (Figure 4) reflect weak hydrodynamics. C-M diagrams show unstable energy conditions (Figure 4). Low-diversity shallow-water foraminifera support tidal flat interpretation.
- (6)
- C6: Near-shore deposit (32.58–35.96 m)
Yellow-brown silt, sandy silt, and silty sand with calcareous nodules display horizontal bedding (Figure 3j). Average sand, silt, and clay contents are 25.92% (0.29–68.24%), 65.19% (28.50–90.07%), and 8.88% (3.26–26.28%), respectively (Figure 3b). Variable parameters include low sorting (mean: 1.87), positive skewness (mean: 1.28), and moderate kurtosis (mean: 2.50) (Figure 3d–f). Bimodal distributions (100 µm and 20 µm peaks) with alternating saltation (80%) and suspension (>90%) components (Figure 4) and erratic C-M patterns (Figure 4) suggest dynamic near-shore deposit. Absent foraminifera correlate with environmental fluctuations.
- (7)
- C7: Neritic facies (35.96–39.00 m)
Brown clayey silt and silt with shell debris and calcareous nodules show horizontal bedding (Figure 3j). Average sand, silt, and clay contents are 7.06% (0.00–31.31%), 76.40% (62.91–86.44%), and 10.52% (5.78–29.08%), respectively (Figure 3b). Stable parameters include low sorting (mean: 1.82), positive skewness (mean: 0.16), and moderate kurtosis (mean: 2.51) (Figure 3d–f). Unimodal peaks near 8 µm and suspension-dominated transport (Figure 4) with uniform C-M patterns (Figure 4) indicate low-energy marine conditions. Dominant cold-water and shallow-water foraminifera confirm neritic facies.
- (8)
- C8: Near-shore deposit (39.00–41.92 m)
Brown clayey silt and sandy silt with calcareous nodules and shell debris exhibit parallel bedding (Figure 3j). Average sand, silt, and clay contents are 21.47% (0.54–61.86%), 66.09% (34.18–83.20%), and 12.43% (3.95–25.26%), respectively (Figure 3b). High sorting (mean: 2.02), positive skewness (mean: 0.68), and moderate kurtosis (mean: 2.56) (Figure 3d–f) accompany unimodal peaks near 100 µm. Saltation-dominated (>80%) transport with steep slopes (Figure 4) and graded C-M patterns (Figure 4) suggest an energetic near-shore deposit transitioning to marine. Abundant euryhaline and shallow-water foraminifera support this interpretation.
- (9)
- C9: Neritic facies (41.92–43.35 m)
Interbedded brown silt and clayey silt with basal shell debris (Figure 3j) show average sand, silt, and clay contents of 7.91% (1.77–29.90%), 73.14% (57.62–80.16%), and 18.93% (12.46–21.59%), respectively (Figure 3b). Stable parameters include low sorting (mean: 1.93), negative skewness (mean: −0.71), and moderate kurtosis (mean: 2.67) (Figure 3d–f). Unimodal peaks near 6 µm and uniform suspension (Figure 4) with stable C-M patterns (Figure 4) indicate cold-water neritic facies.
- (10)
- C10: Coastal Bar (43.35–46.89 m)
Gray sandy deposits with shell debris (Figure 3j) average 70.60% sand (24.07–87.97%), 23.44% silt (8.66–67.01%), and 5.95% clay (2.96–15.47%) (Figure 3b). Parameters include low sorting (mean: 1.91), extreme positive skewness (mean: 1.96), and moderate kurtosis (mean: 2.62) (Figure 3d–f). Unimodal peaks near 100 µm, saltation-dominated (>90%) transport (Figure 4), and C-M Zone RS (Figure 4) suggest stable high-energy bar deposition. Cold-water and euryhaline foraminifera imply reworked origins.
- (11)
- C11: Tidal Flat (46.89–48.34 m)
Gray clayey silt and sandy silt with shell debris (Figure 3j) average 27.13% sand (4.49–75.37%), 56.63% silt (18.05–74.65%), and 16.23% clay (6.58–34.60%) (Figure 3b). High sorting (mean: 2.14), positive skewness (mean: 0.41), and sharp kurtosis (mean: 2.74) (Figure 3d–f) accompany bimodal distributions (150 µm and 3 µm peaks; Figure 4). Variable C-M patterns (Figure 4) and rare cold-water foraminifera suggest tidal flat deposition.
- (12)
- C12: Tidal Channel (48.34–50.00 m)
Yellow-brown sandy silt with shell debris (Figure 3j) averages 57.65% sand (4.70–89.39%), 34.65% silt (8.35–74.51%), and 7.69% clay (1.77–20.95%) (Figure 3b). High sorting (mean: 2.13), extreme positive skewness (mean: 1.94), and moderate kurtosis (mean: 2.74) (Figure 3d–f) accompany unimodal peaks near 100 µm. Saltation-dominated (65–93%) transport (Figure 4) and dynamic C-M patterns (Figure 4) indicate high-energy tidal channel deposition with rare shallow-water foraminifera.
4. Discussion
4.1. Determination of Core CB2302 Sedimentary Age
Grain-size analysis of the first marine layer (DU1) in core CB2302 reveals sediments with low sorting coefficients and positive skewness, indicative of weak hydrodynamic conditions. Well-developed foraminiferal assemblages further confirm a marine depositional environment. Based on these results, DU1 is subdivided into three subunits from bottom to top: tidal flat deposits, neritic facies, and modern Yellow River deltaic sediments. AMS 14C dating of samples from 11.70–11.80 m, 13.85–13.97 m, and 14.59–14.69 m (Table 1) constrains the formation of DU1 to Marine Isotope Stage 1 (MIS1), corresponding to post-glacial sea-level rise.
Over the past four decades, numerous studies have investigated marine transgressions and shoreline evolution in the Bohai Sea. Zhao et al. (1978) [26] identified three transgressive layers (Huanghua (T1), Xianxian (T2), and Cangzhou (T3)) through AMS 14C dating of 71 samples, attributing T2 to MIS3. Subsequent studies by Liu et al. [27] and Yan et al. [28] supported this interpretation, positing marine deposition during MIS3 in Bohai Bay. However, such claims conflict with global sea-level reconstructions, which indicate lower MIS3 sea levels compared to MIS5. Challenging this paradigm, Chen et al. (2008) [29] applied OSL dating to core BZ1 near Tianjin, demonstrating that T2 formed during MIS5 with no evidence of MIS3 deposition. Recently, Long et al. (2022) [12] re-evaluated the chronology of the T2 layer in core TJC-1 using OSL and AMS 14C dating. Their OSL ages (>80 ka) from four T2 samples unequivocally assign this transgression to MIS5 or earlier.
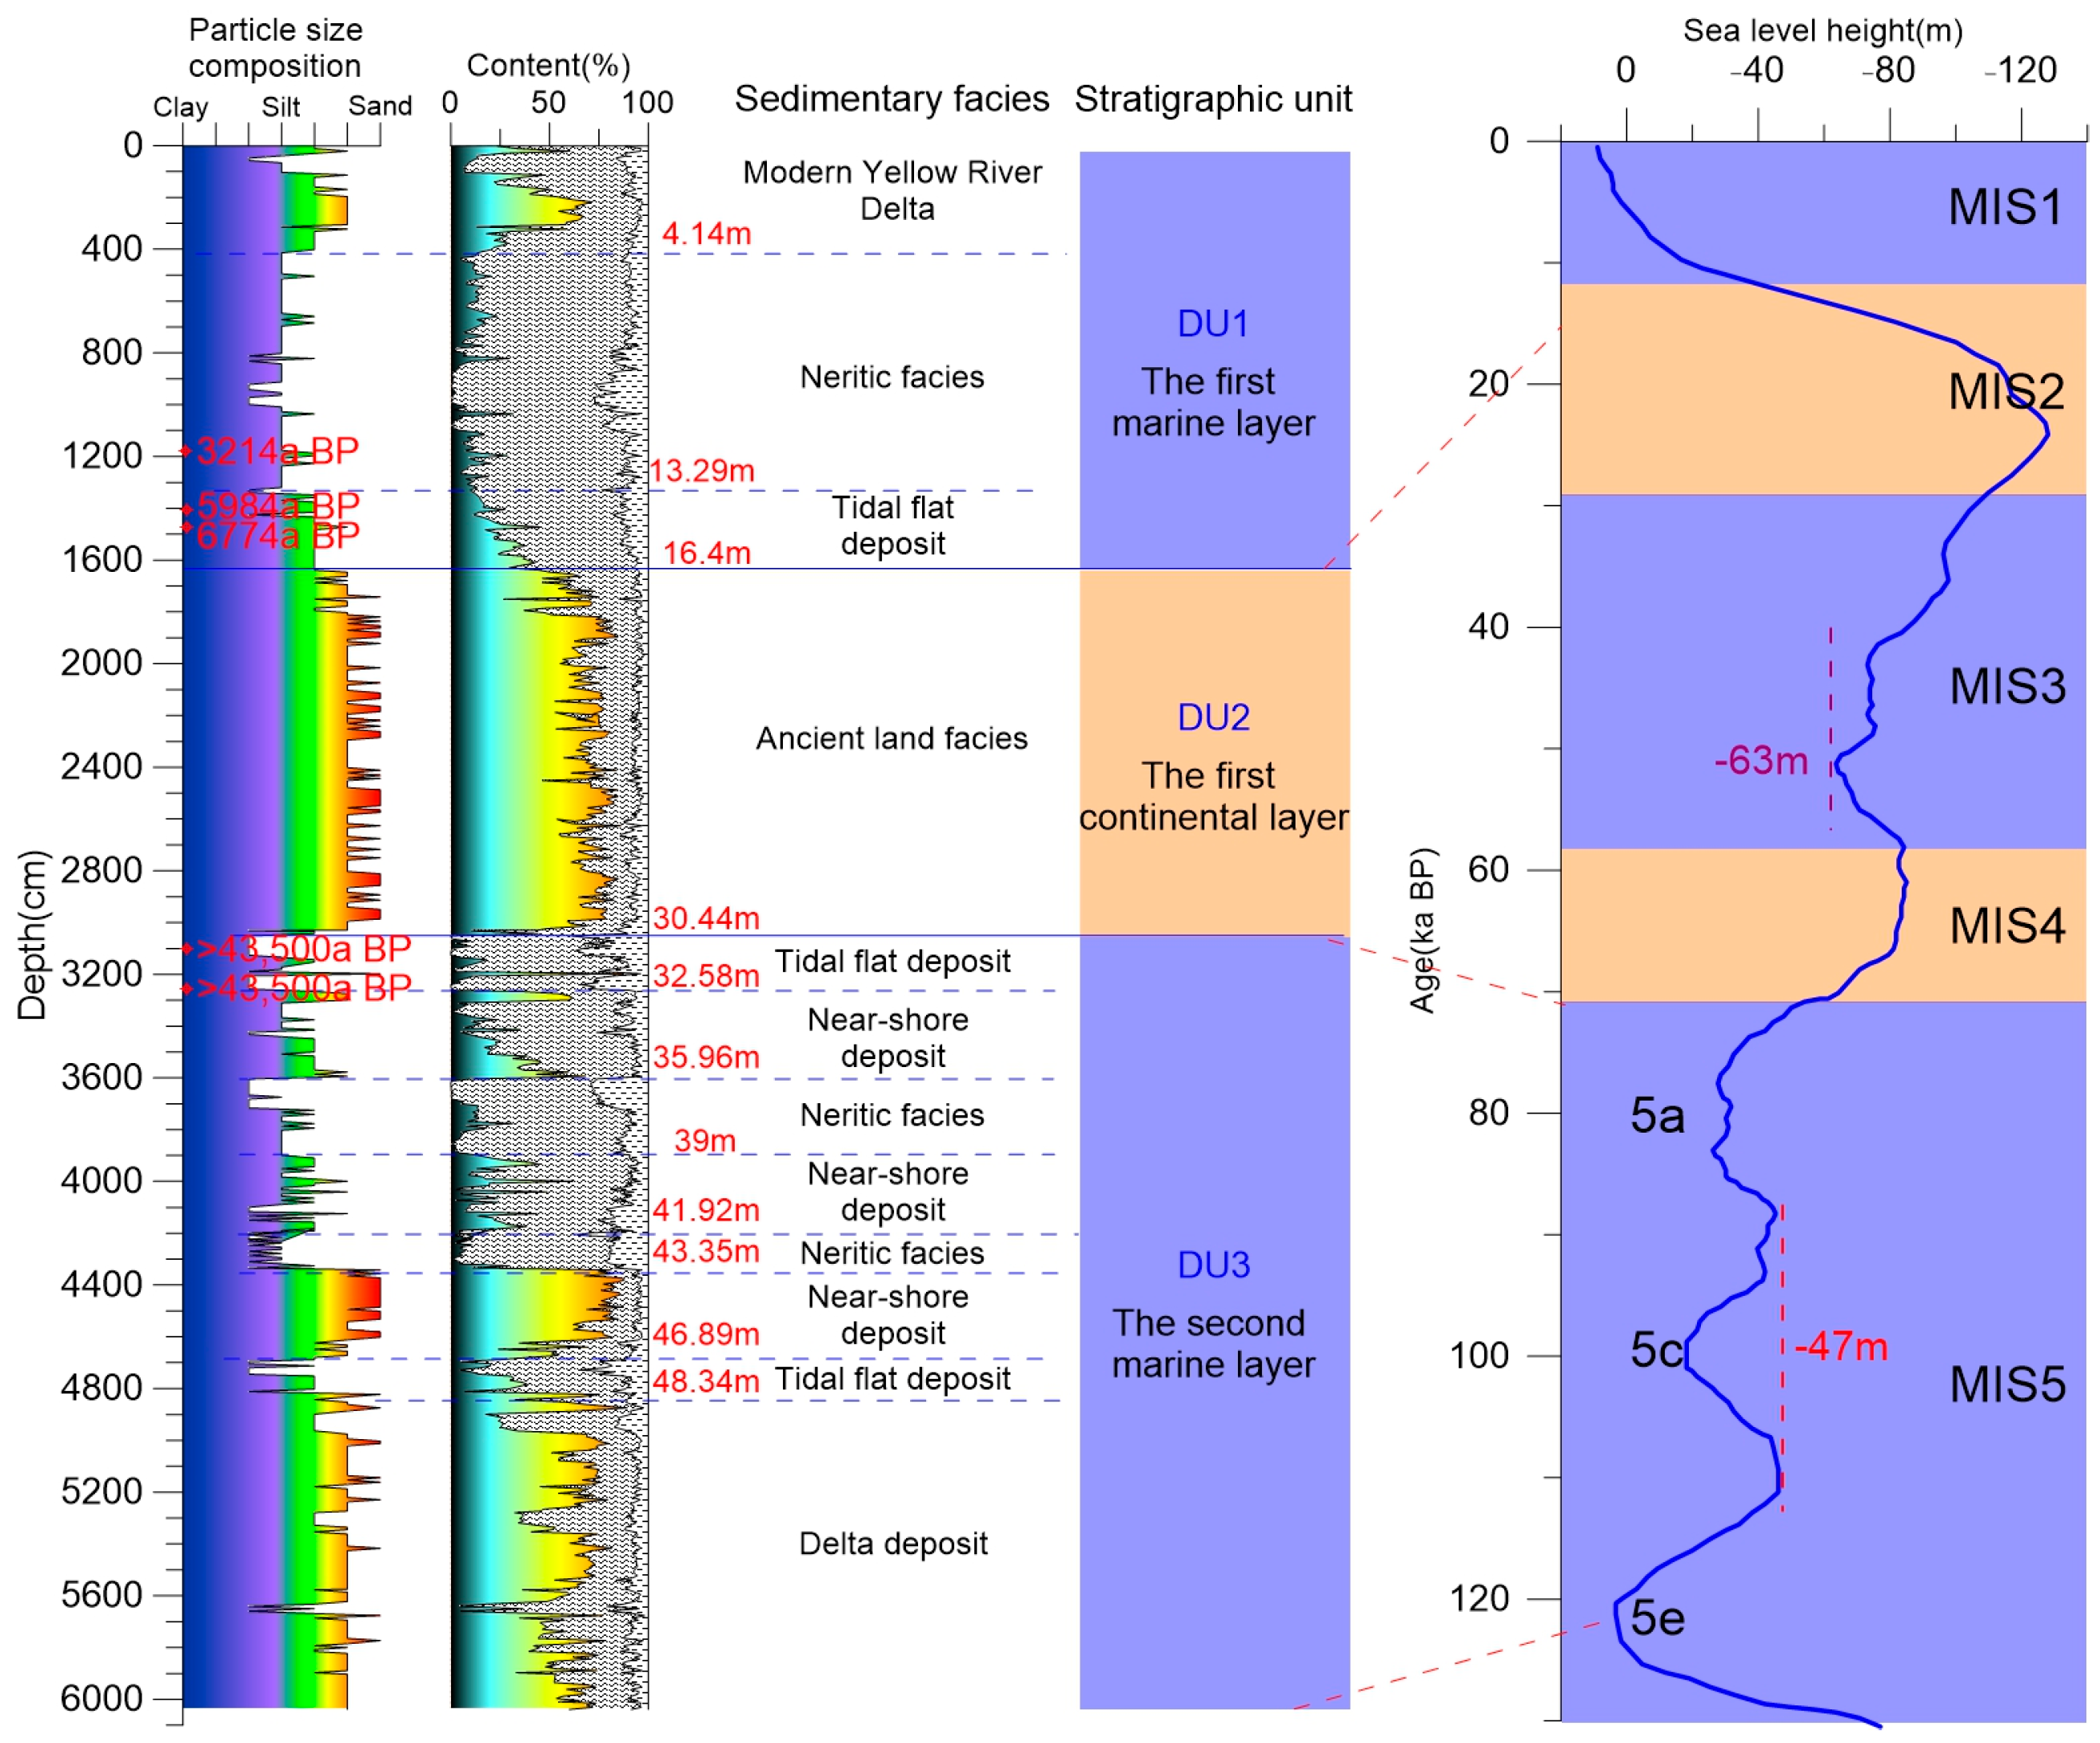
To resolve this controversy, we conducted a detailed chronostratigraphic analysis of the second marine layer (DU3) in core CB2302, focusing on MIS-stage boundaries inferred from sedimentological shifts (e.g., fluvial-to-marine facies transitions), AMS 14C-constrained age models, and alignment with regional sea-level curves. AMS 14C dating of the DU3 top (>43.5 ka BP) predates mid-MIS3. Global sea-level reconstructions (Figure 5) indicate that the maximum MIS3 sea level reached −63 m. If DU3 belonged to MIS3, its top should lie below −56.5 m, yet its actual depth in CB2302 is −30.44 m–26 m shallower—demonstrating that the study area remained subaerially exposed during MIS3. Furthermore, DU3 records three distinct sea-level fluctuations in its depositional sequence: tidal channel—tidal flat—coastal bar—neritic facies—near-shore deposit—neritic facies—near-shore deposit—tidal flat, reflecting repeated transgressive–regressive cycles. During MIS5, solar insolation-driven climatic oscillations generated three sea-level highstands (MIS5e, MIS5c, MIS5a), consistent with the tripartite marine–terrestrial alternations observed in DU3. Supporting evidence comes from core BH1302 in Laizhou Bay [10], where MIS5 sediments alternate between marine and terrestrial facies, corroborating three MIS5 highstands. Additionally, the DU3 top age is significantly younger than MIS7 (190–240 ka BP), which typically preserves 1–2 transgressions—insufficient to explain the three high-frequency cycles in CB2302. Integrating eustatic sea-level constraints, depositional cyclicity, and regional paleogeographic reconstructions, we conclude that DU3 formed during MIS5.
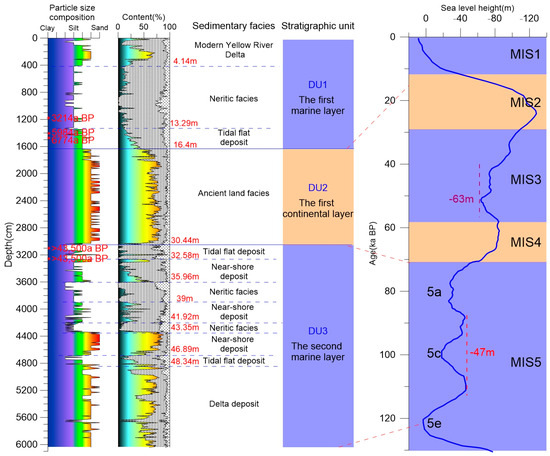
Figure 5.
Corresponding chronology of core CB2302 stratigraphic sequence (the relative sea-level curve is adapted from Long et al., 2022 [12]).
Integrated analysis indicates that the First Terrestrial Unit, spanning MIS 4 to MIS 2, developed under exclusively non-marine conditions. During MIS 4 (glacial inception), initial sea-level fall exposed the continental shelf, initiating a coarsening-upward sediment trend. The climatically unstable MIS 3 phase exhibited warmer substages (e.g., MIS 3a) with ephemeral sea-level rebounds and colder substages, though without triggering marine incursions into the study area. MIS 2 is the Last Glacial Maximum when the sea level was at its lowest, the continental shelf was fully exposed, and the deepening of the Yellow River incised valleys resulted in relatively coarser sediment grain sizes (18.19–19.15 m). Sedimentologically, this unit displays an overall coarsening-upward trend, punctuated only by basal and topmost transgressive–regressive cyclicity.
4.2. Spatiotemporal Distribution of Strata in the Northern Part of the Yellow River Delta
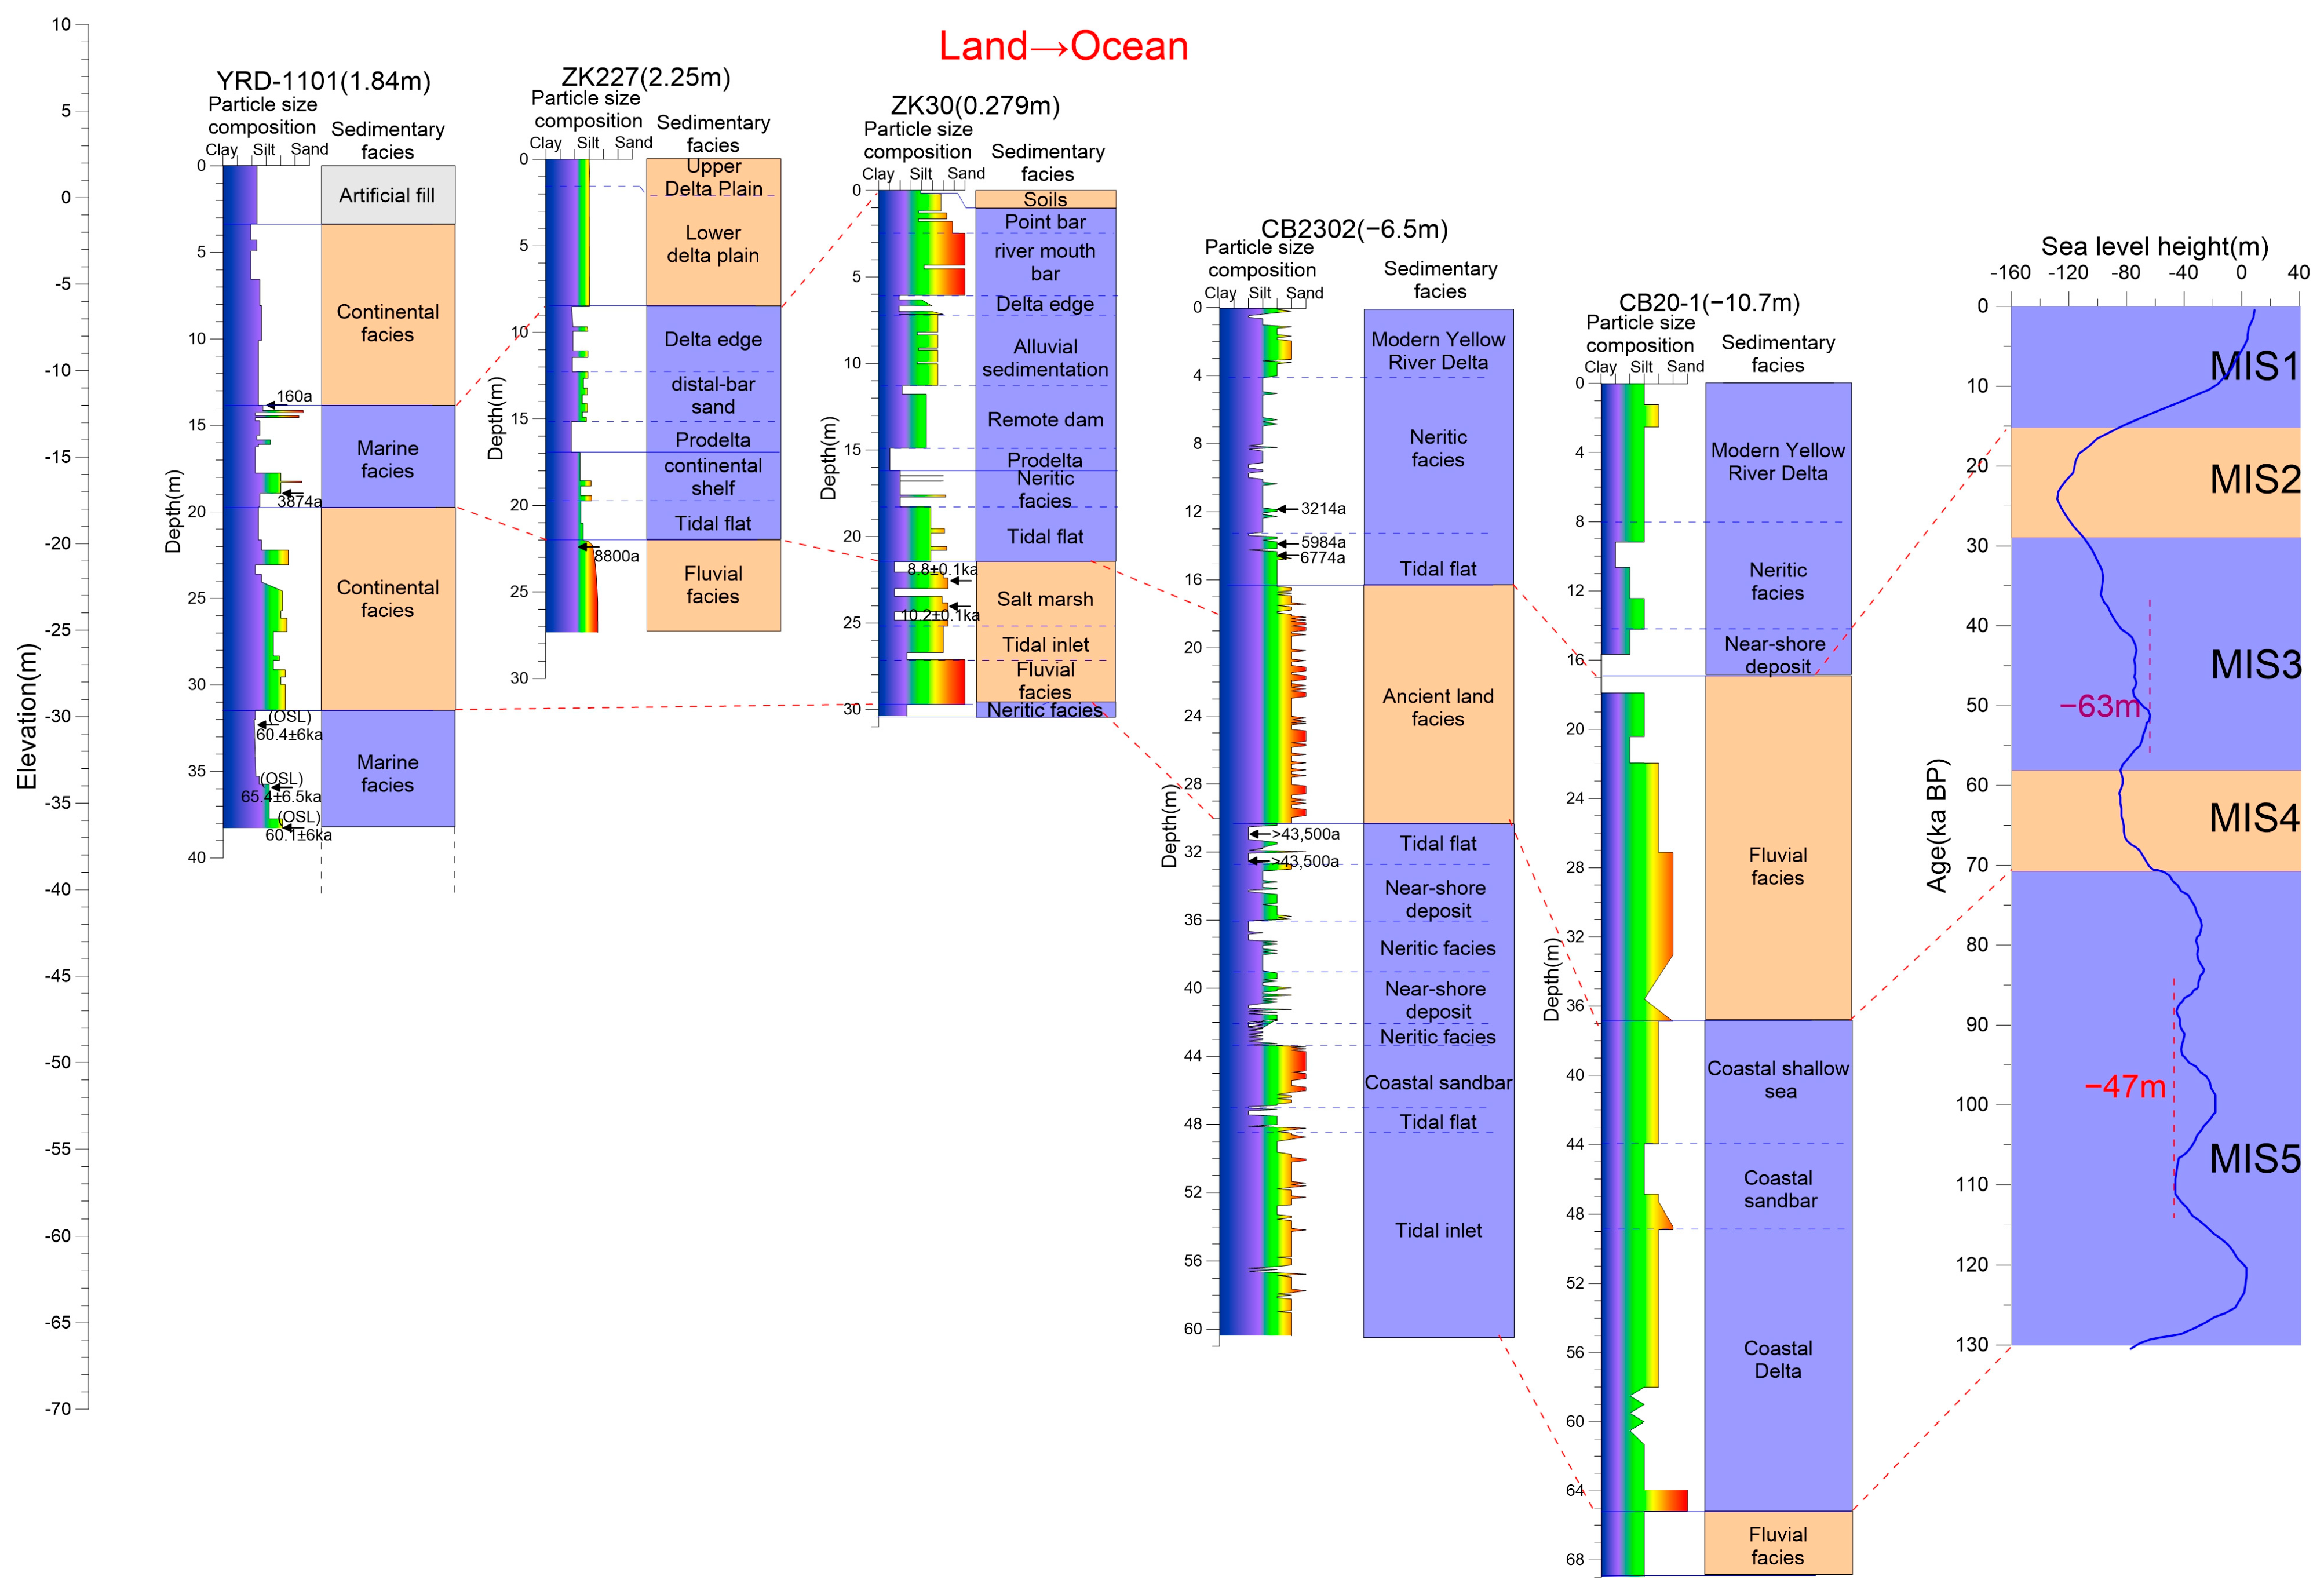
Based on the stratigraphic division of borehole CB2302 and regional sea-level variations, a preliminary chronostratigraphic framework was established. By correlating boreholes along a sea-to-land transect (ZK30 [13], ZK227 [14], YRD-1101 [15], CB2302, CB20-1; white line in Figure 1), we reconstructed the stratigraphic profile of the northern Yellow River Delta since MIS5 (Figure 6).
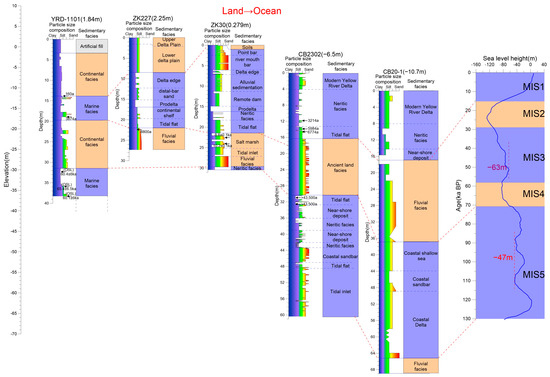
Figure 6.
Stratigraphic sequence profile of delta and global sea-level change.
The relationship between the stratigraphic sequences in the northern Yellow River Delta and global sea-level fluctuations is illustrated in Figure 5. During MIS5, sea-level oscillations exhibited multiple phases, with the highest level during MIS5e (approximately 6–9 m above present-day levels [30]), followed by significant declines in MIS5d and MIS5b, and secondary rebounds in MIS5c and MIS5a (Figure 6). These fluctuations were primarily driven by solar insolation, ice-sheet dynamics, and climatic feedbacks [10,31]. Borehole CB2302 recorded seven depositional units during this interval (tidal inlet, tidal flat, coastal sandbar, neritic, near-shore, neritic, near-shore, and tidal flat facies), reflecting three sea-level oscillations. The basal boundary of these deposits aligns with MIS5e, correlating with the second marine layers in YRD-1101 [32] and CB20-1, indicating widespread MIS5 high stand influence across the northern delta. Global warming and glacial melting during this period triggered a major Quaternary transgression [33]. Borehole CB20-1 documented a transition from estuarine to deltaic and near-shore deposits during early MIS5, consistent with sea-level oscillations. This phase was marked by marine transgression, driving a sedimentary facies transition from terrestrial to marine environments, as evidenced by lithological shifts and microfossil assemblages in regional stratigraphic records. In CB2302, the facies transition from basal tidal channel deposits to distal tidal flat-coastal bar and neritic facies (MIS5e–MIS5c) records progressive deepening and sea-level rise. During mid-to-late MIS5, cooling climates drove oscillatory sea-level decline [34], evidenced in CB2302 by a shift to near-shore deposits and in CB20-1 by coastal bar facies dominated by terrestrial coarse-grained inputs. The subsequent sea-level rise is marked by CB2302 neritic facies and CB20-1 near-shore deposit-neritic facies transitions. Late MIS5 saw a renewed sea-level fall, as reflected in CB2302 coastal-tidal flat deposits. Sediment thickness in the second marine layers of CB2302 and CB20-1 (Figure 6) suggests proximity to paleo-river mouths with high depositional rates.
During MIS4–2, all boreholes recorded terrestrial deposits, with CB2302 showing minimal grain-size variation and no foraminifera. However, CB2302 and CB20-1 exhibited coarser grains and greater thickness compared to inland boreholes ZK227 and ZK30, which were dominated by fluvial influences. Despite enhanced summer monsoon and minor sea-level rise during MIS3, marine incursions failed to reach the modern Yellow River Delta, as evidenced by the absence of marine strata in all boreholes and by prior studies of western Bohai cores [8,26].
In MIS1, rapid global sea-level rise submerged the transect from CB20-1 to YRD-1101, establishing marine depositional environments. The first marine layers across all boreholes transitioned upward from coastal-tidal flat-neritic facies, documenting progressive transgression. Following the 1855 Yellow River avulsion into Shandong, massive sediment influx and shallow coastal waters promoted rapid progradation, forming deltaic plains, mouth bars, distal bars, delta margins, and prodelta facies.
4.3. Evolution of Regional Paleogeographic Environment Since MIS5
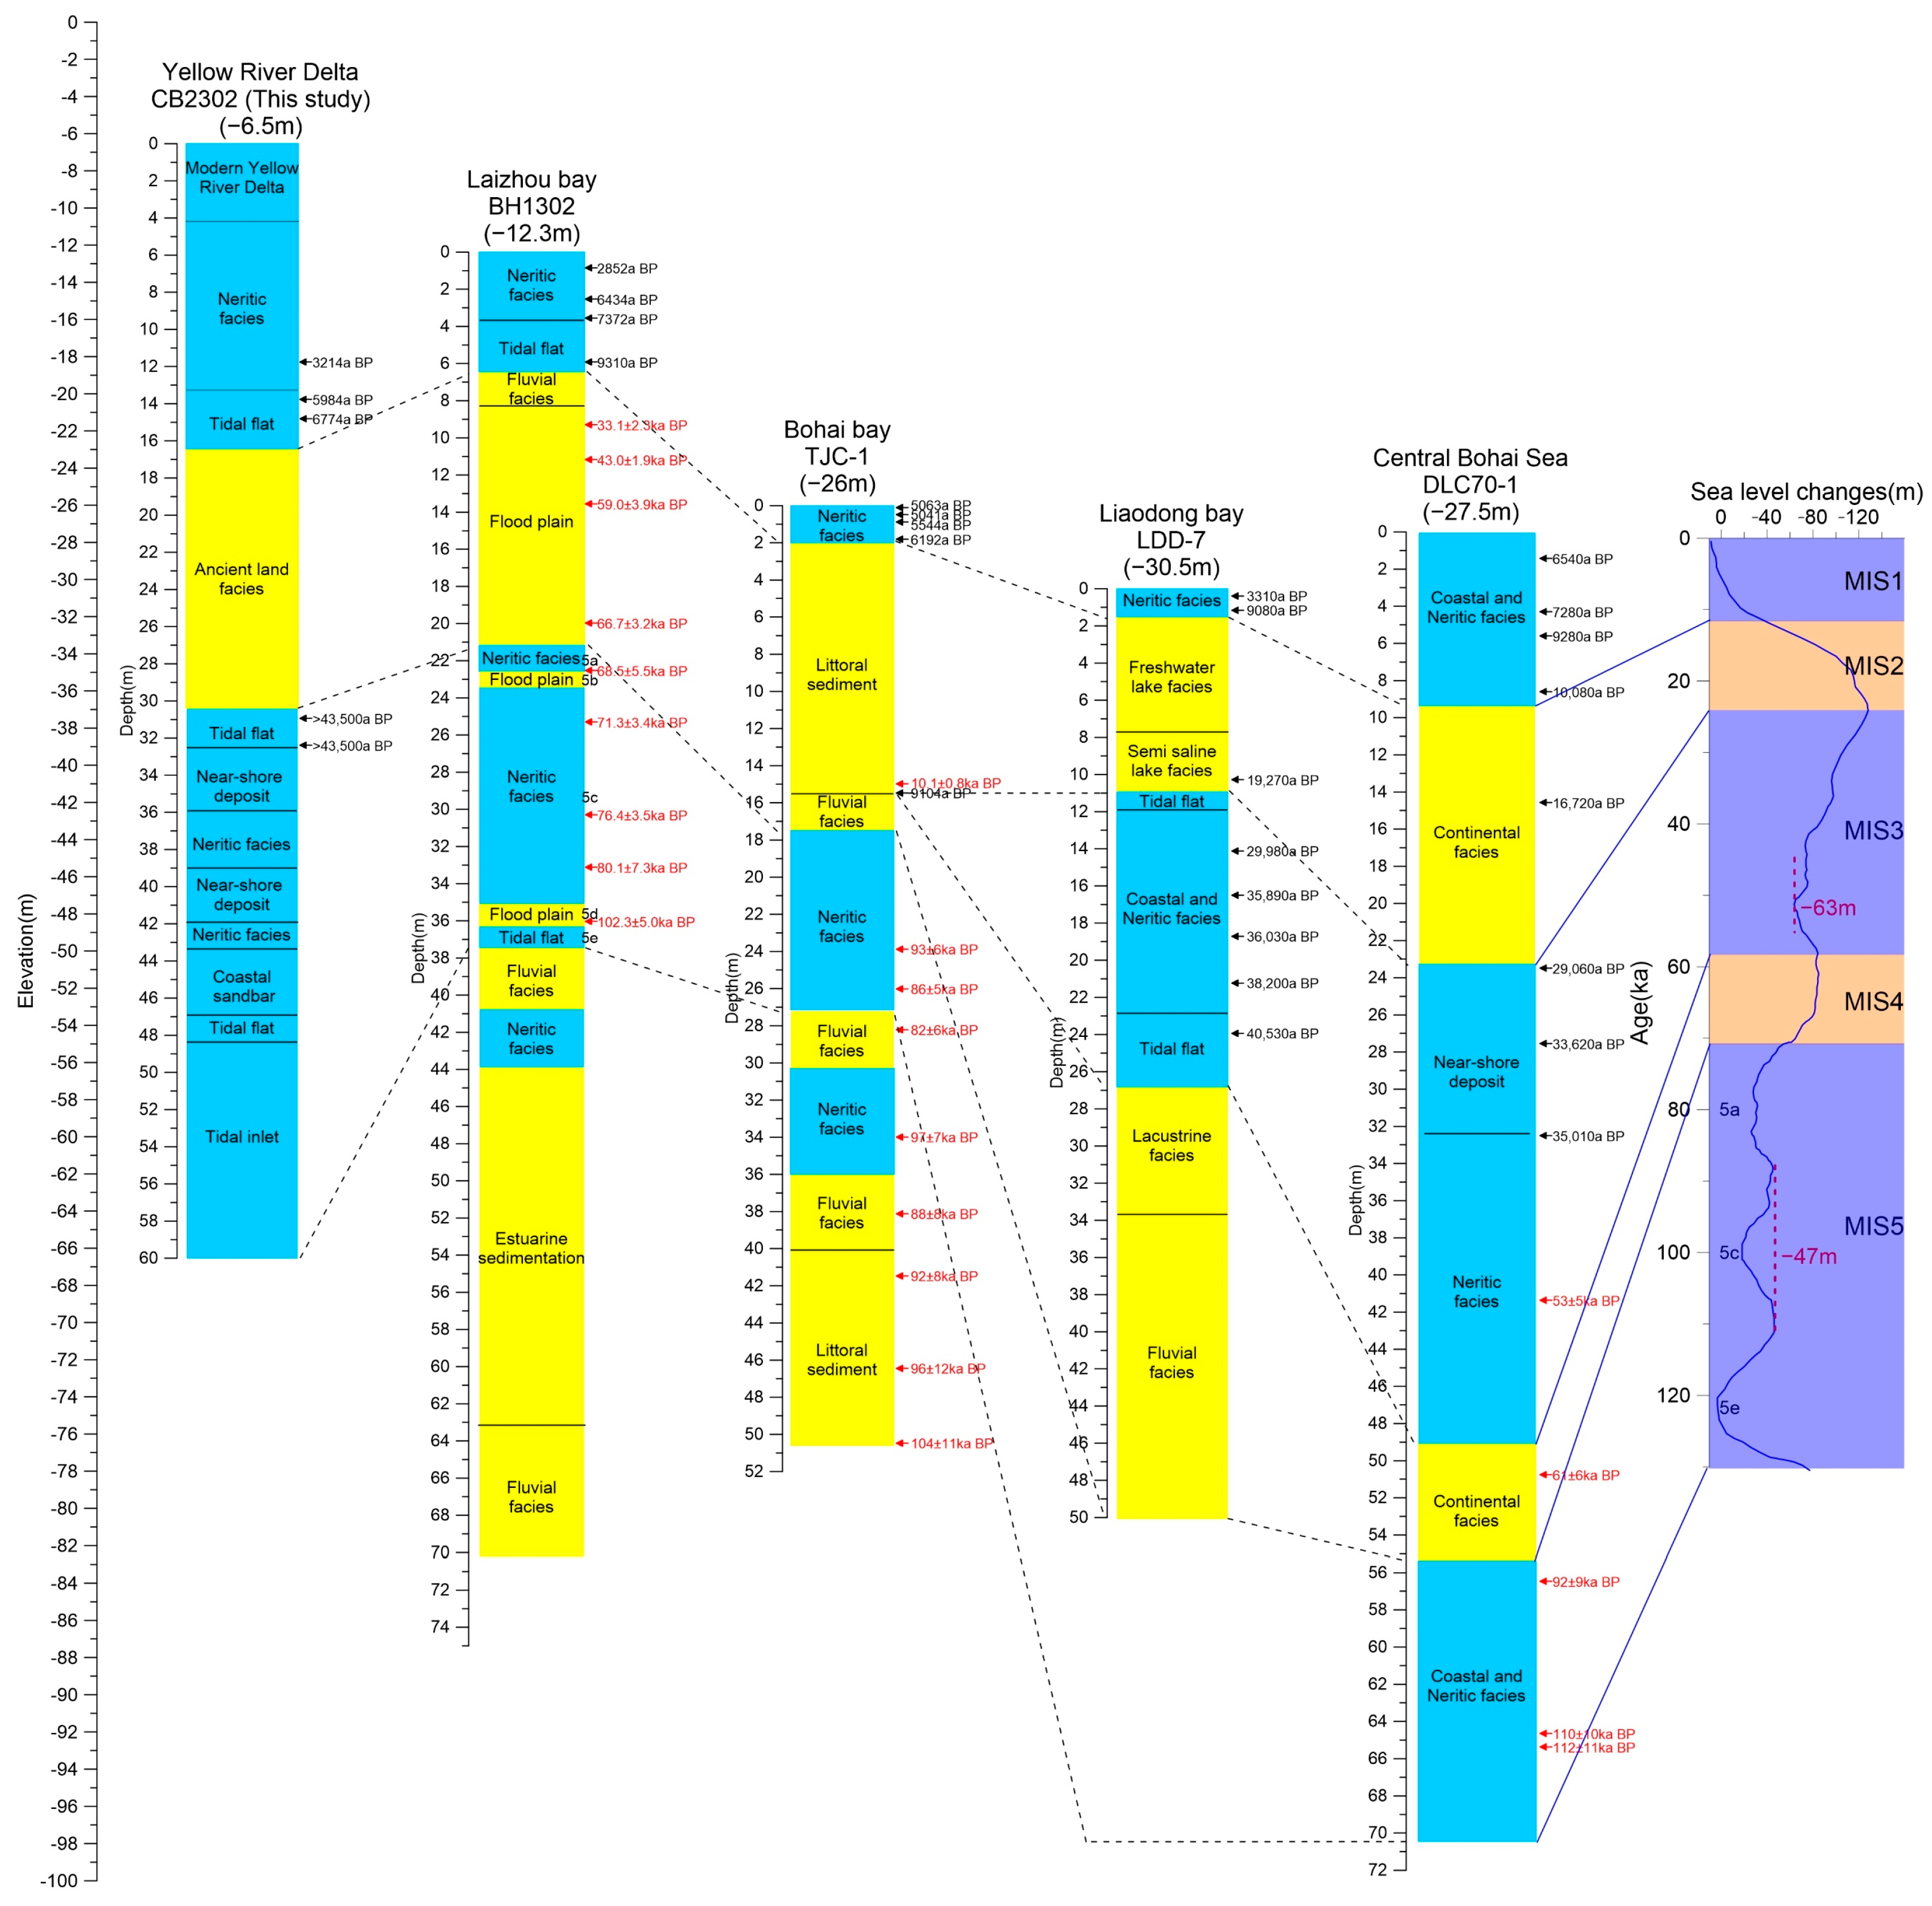
Previous studies indicate that the Bohai and Yellow Seas have remained interconnected since MIS5, with their depositional histories closely tied to global sea-level fluctuations [35]. Building on sedimentological analysis and stratigraphic division of borehole CB2302, we integrate data from representative boreholes (Figure 1) and cross-sections (Figure 6, Figure 7 and Figure 8) across the Bohai, North Yellow Sea, and South Yellow Sea to reconstruct the paleogeographic evolution of the Yellow–Bohai Sea system since MIS5. This synthesis establishes a transgression–regression model for the region.
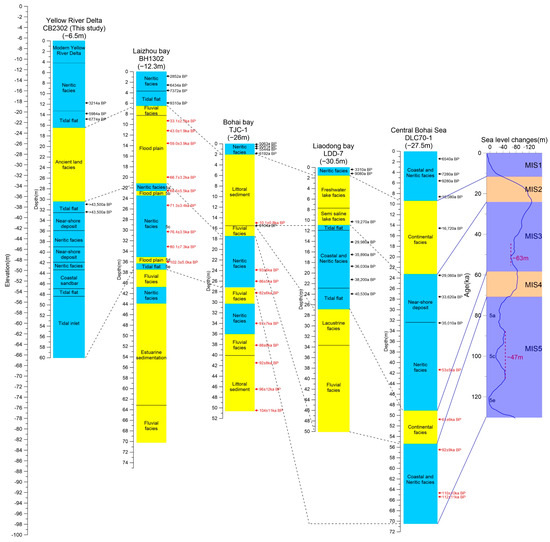
Figure 7.
Sedimentary facies and stratigraphic age distribution of representative boreholes in Bohai Sea (dashed lines represent stratigraphic correlations between equivalent units, while solid lines denote chronostratigraphic ties linking units to their temporal assignments).

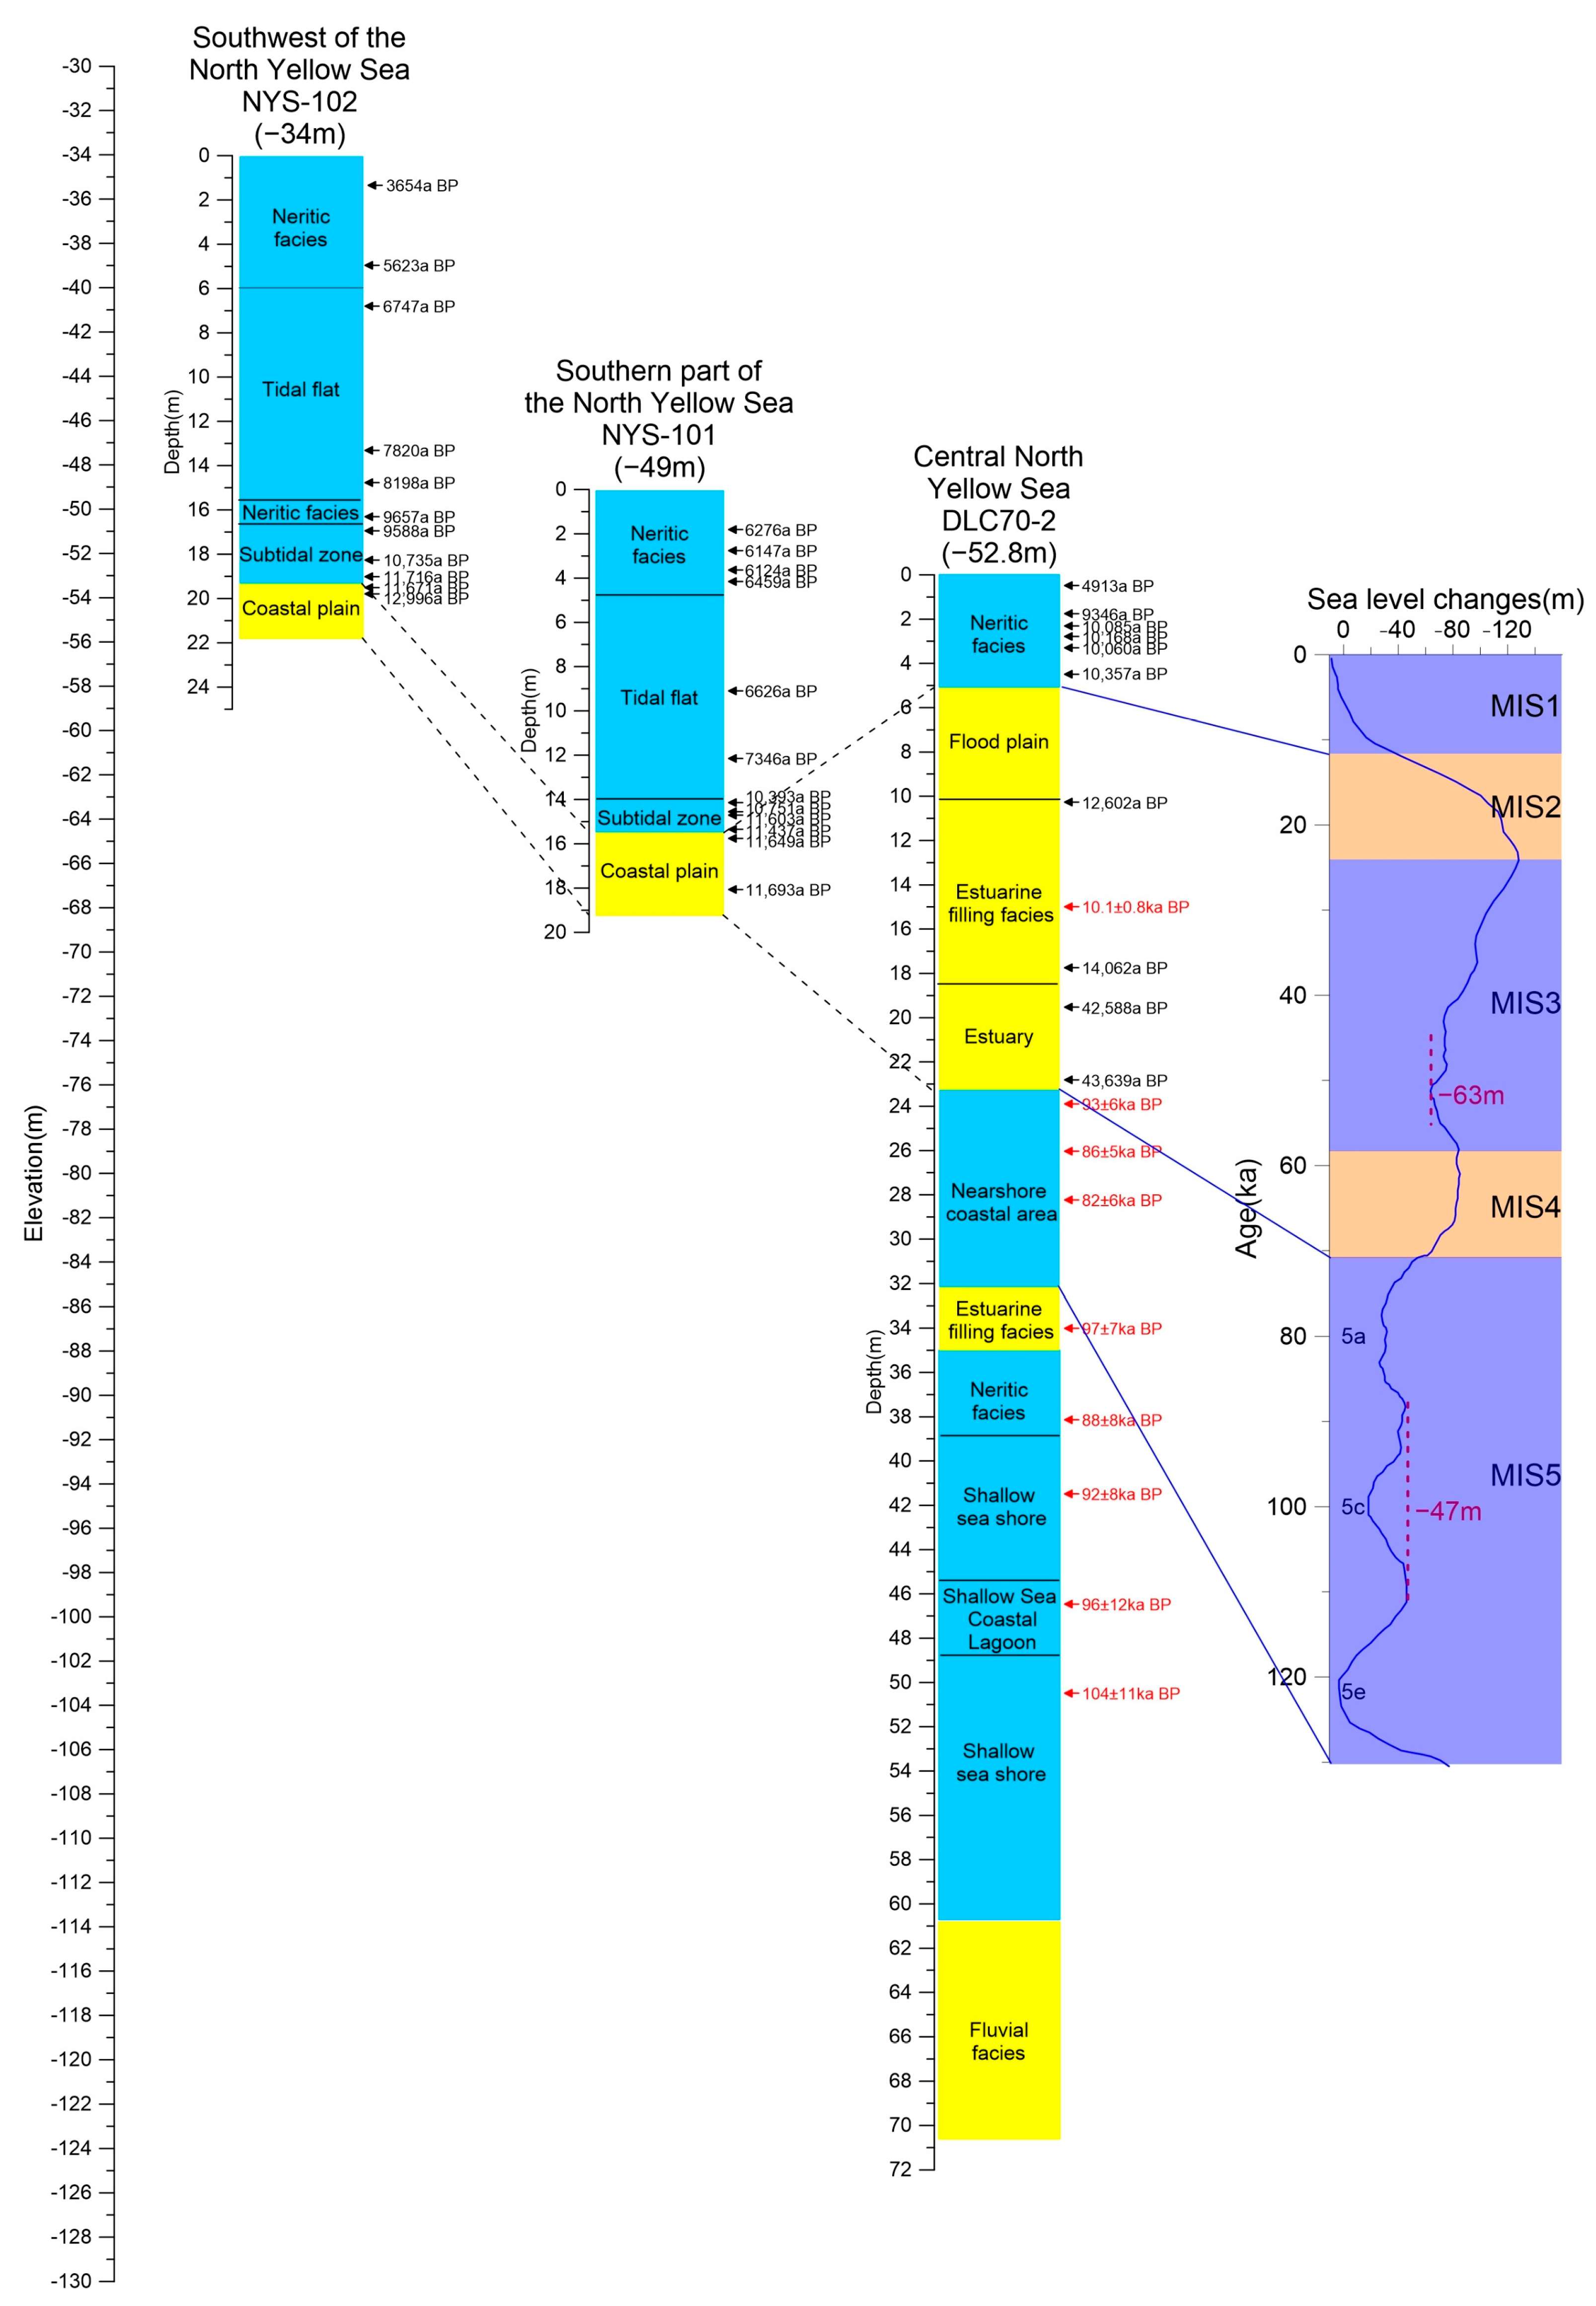
Figure 8.
Sedimentary facies and stratigraphic age distribution of representative boreholes in the North Yellow Sea (dashed lines represent stratigraphic correlations between equivalent units, while solid lines denote chronostratigraphic ties linking units to their temporal assignments).
- (1)
- MIS5
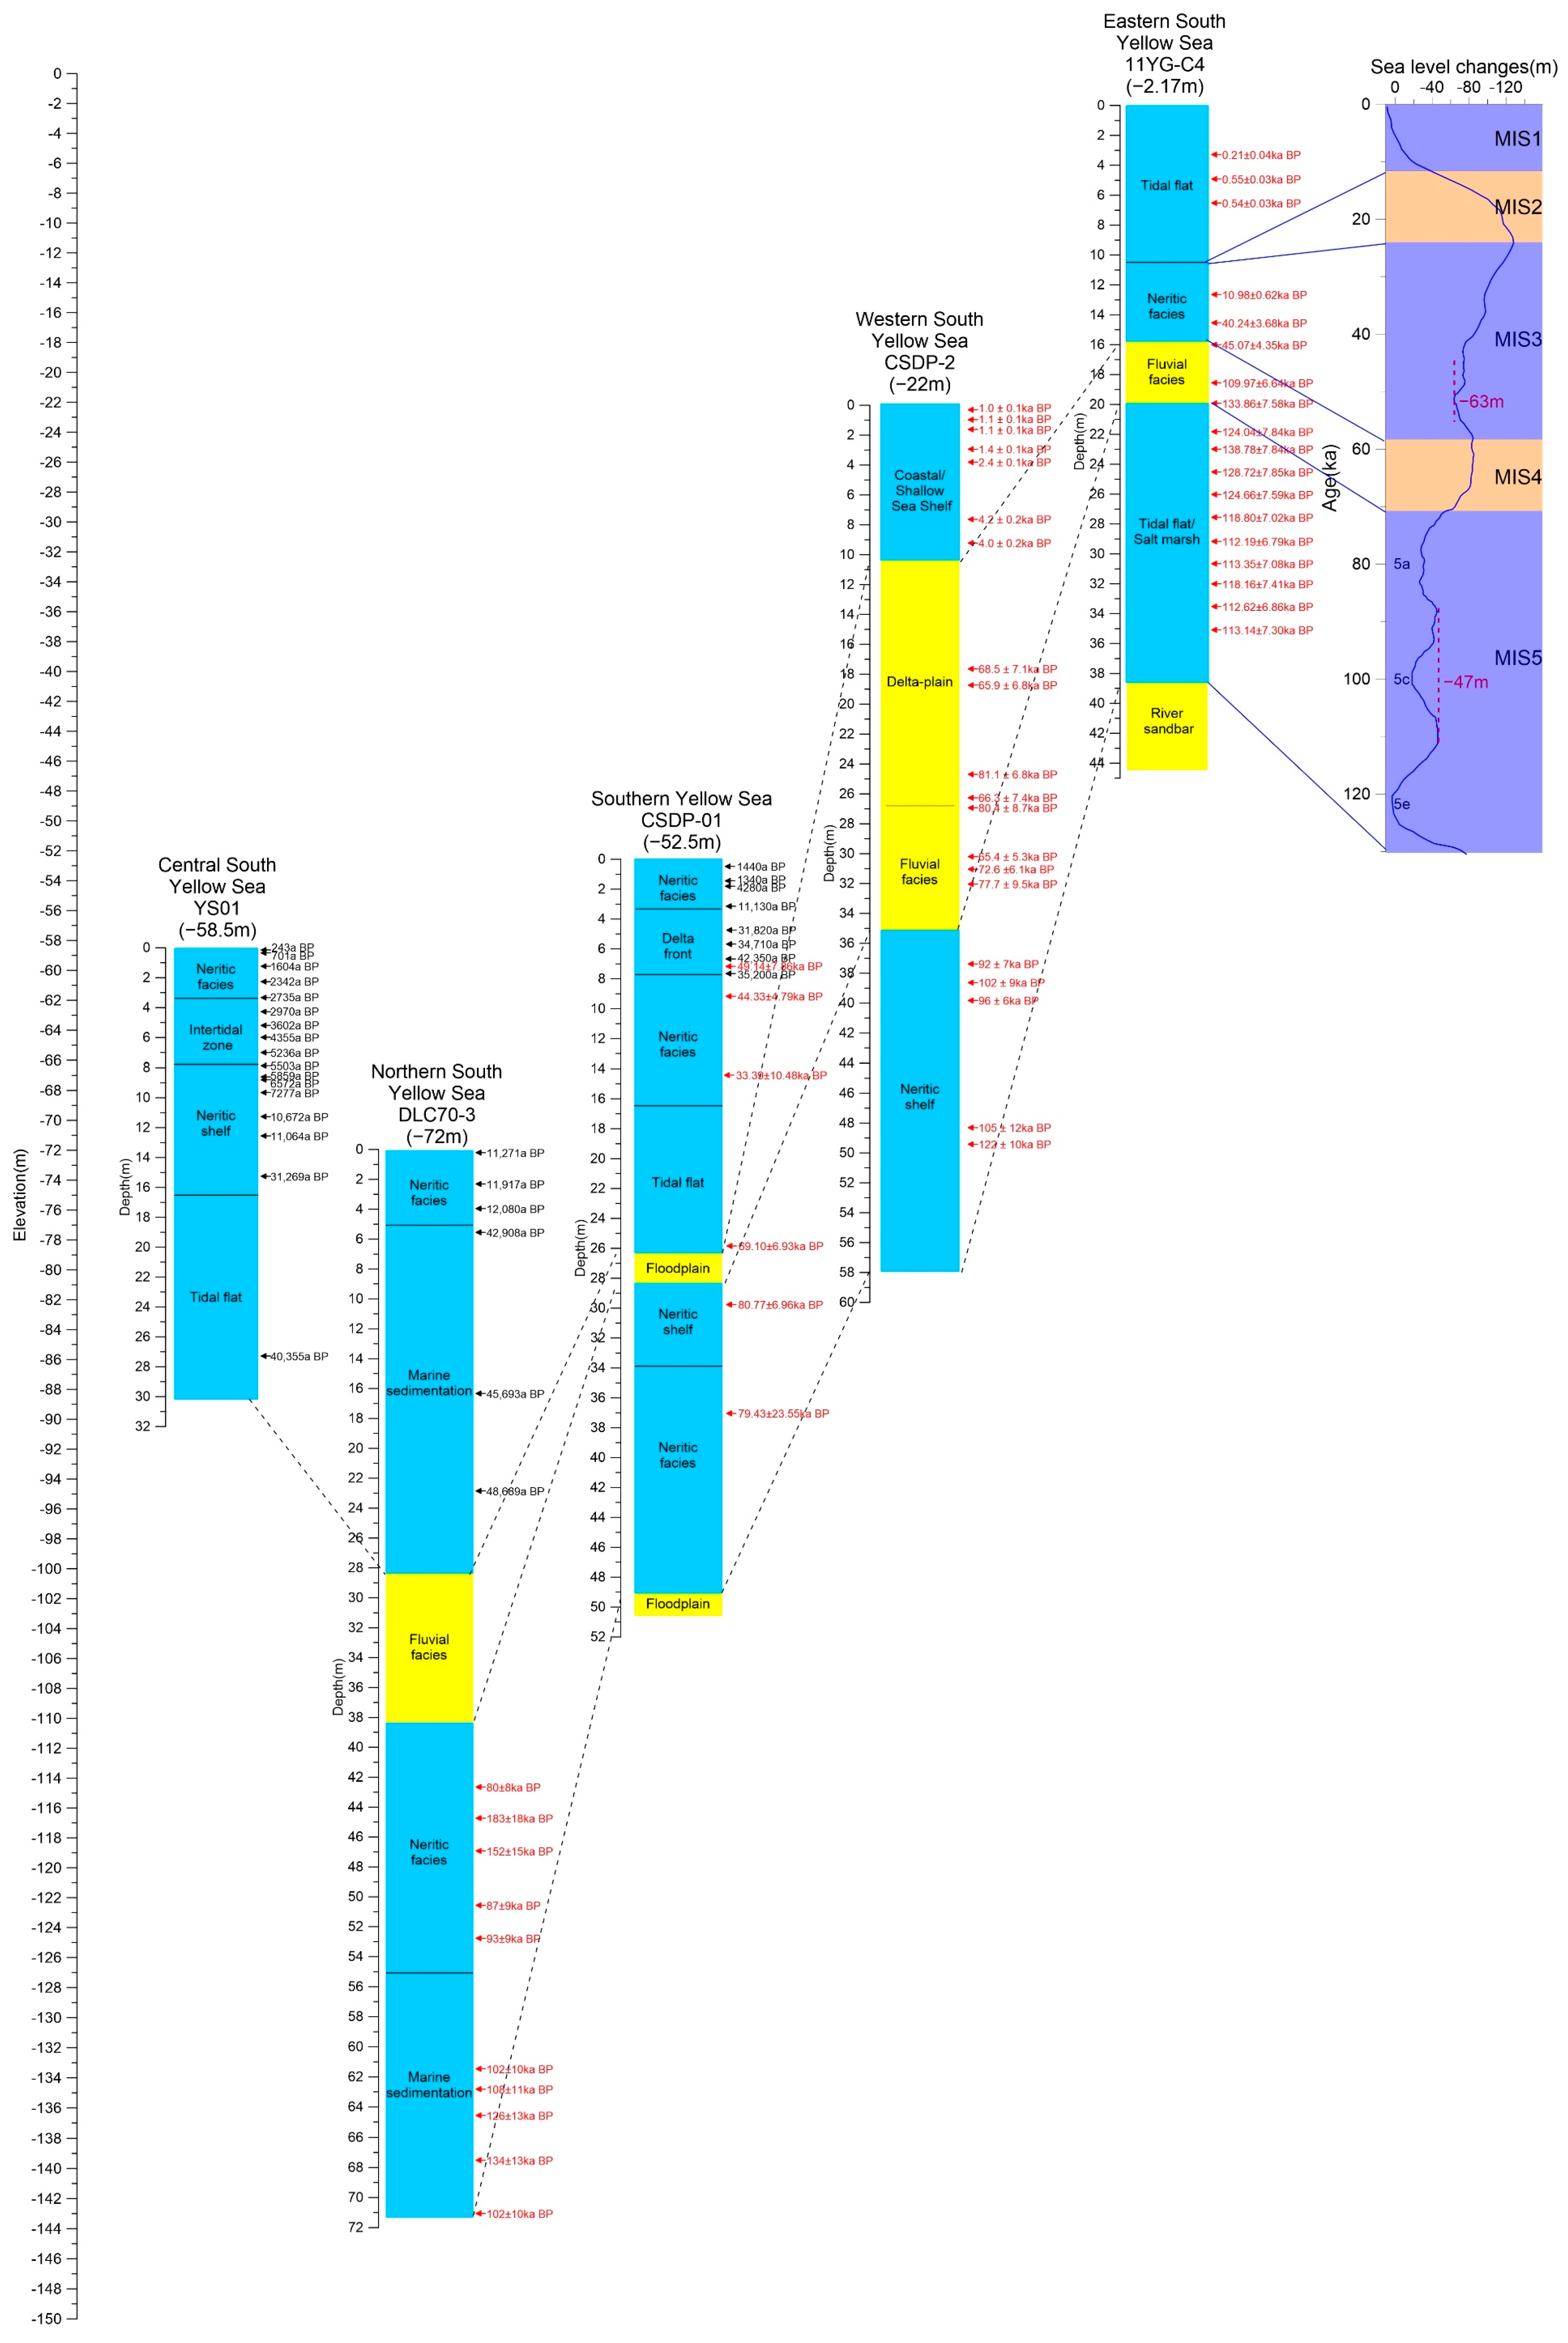
During the early Late Pleistocene, global warming and glacial melting triggered the largest Quaternary transgression (MIS5e) [36], submerging the location of all boreholes (Figure 7) under marine conditions. In the South Yellow Sea, depositional facies included tidal flats/salt marshes, neritic facies, and shelf environments (Figure 8), reflecting open, low-energy settings. The North Yellow Sea was dominated by nearshore near-shore deposits (Figure 9), while the Bohai Sea recorded tidal flats, near-shore deposits, neritic facies, and deltaic systems (Figure 10f,g). MIS5 sea-level oscillations—three highstands (>10 m above present) and lowstands (down to −47 m)—were most clearly preserved in the Bohai’s Yellow River Delta (CB2302), Laizhou Bay, and central North Yellow Sea. The South Yellow Sea boreholes lack complete records of these fluctuations, suggesting minimal regional impact compared to the more sensitive, high-elevation Bohai Basin. Chronological data reveal a south-to-north marine incursion sequence (South Yellow Sea > North Yellow Sea > Bohai). During lowstands, terrestrial deposition occurred locally, but subsequent highstand erosion erased most MIS5 terrestrial records.
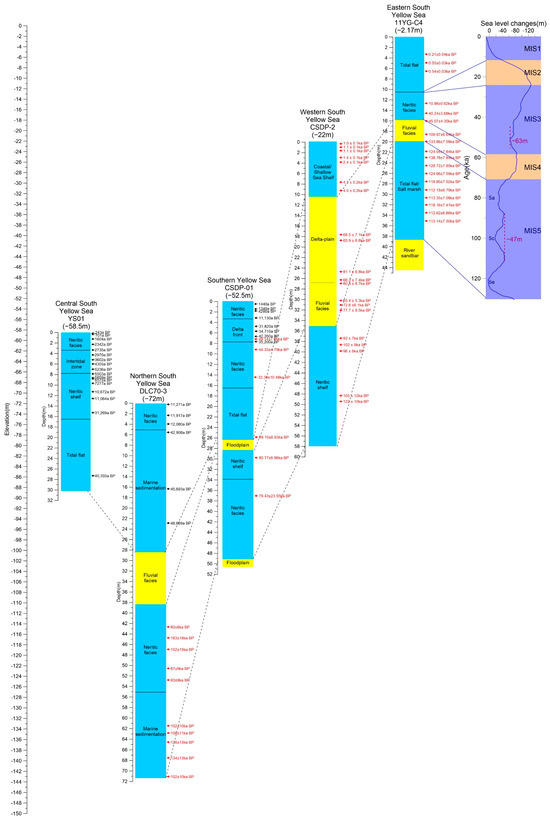
Figure 9.
Sedimentary facies and stratigraphic age distribution of representative boreholes in the South Yellow Sea (dashed lines represent stratigraphic correlations between equivalent units, while solid lines denote chronostratigraphic ties linking units to their temporal assignments).
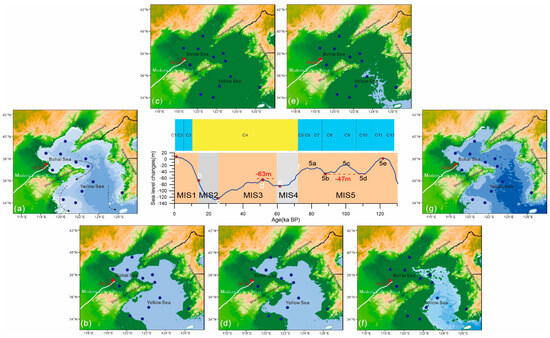
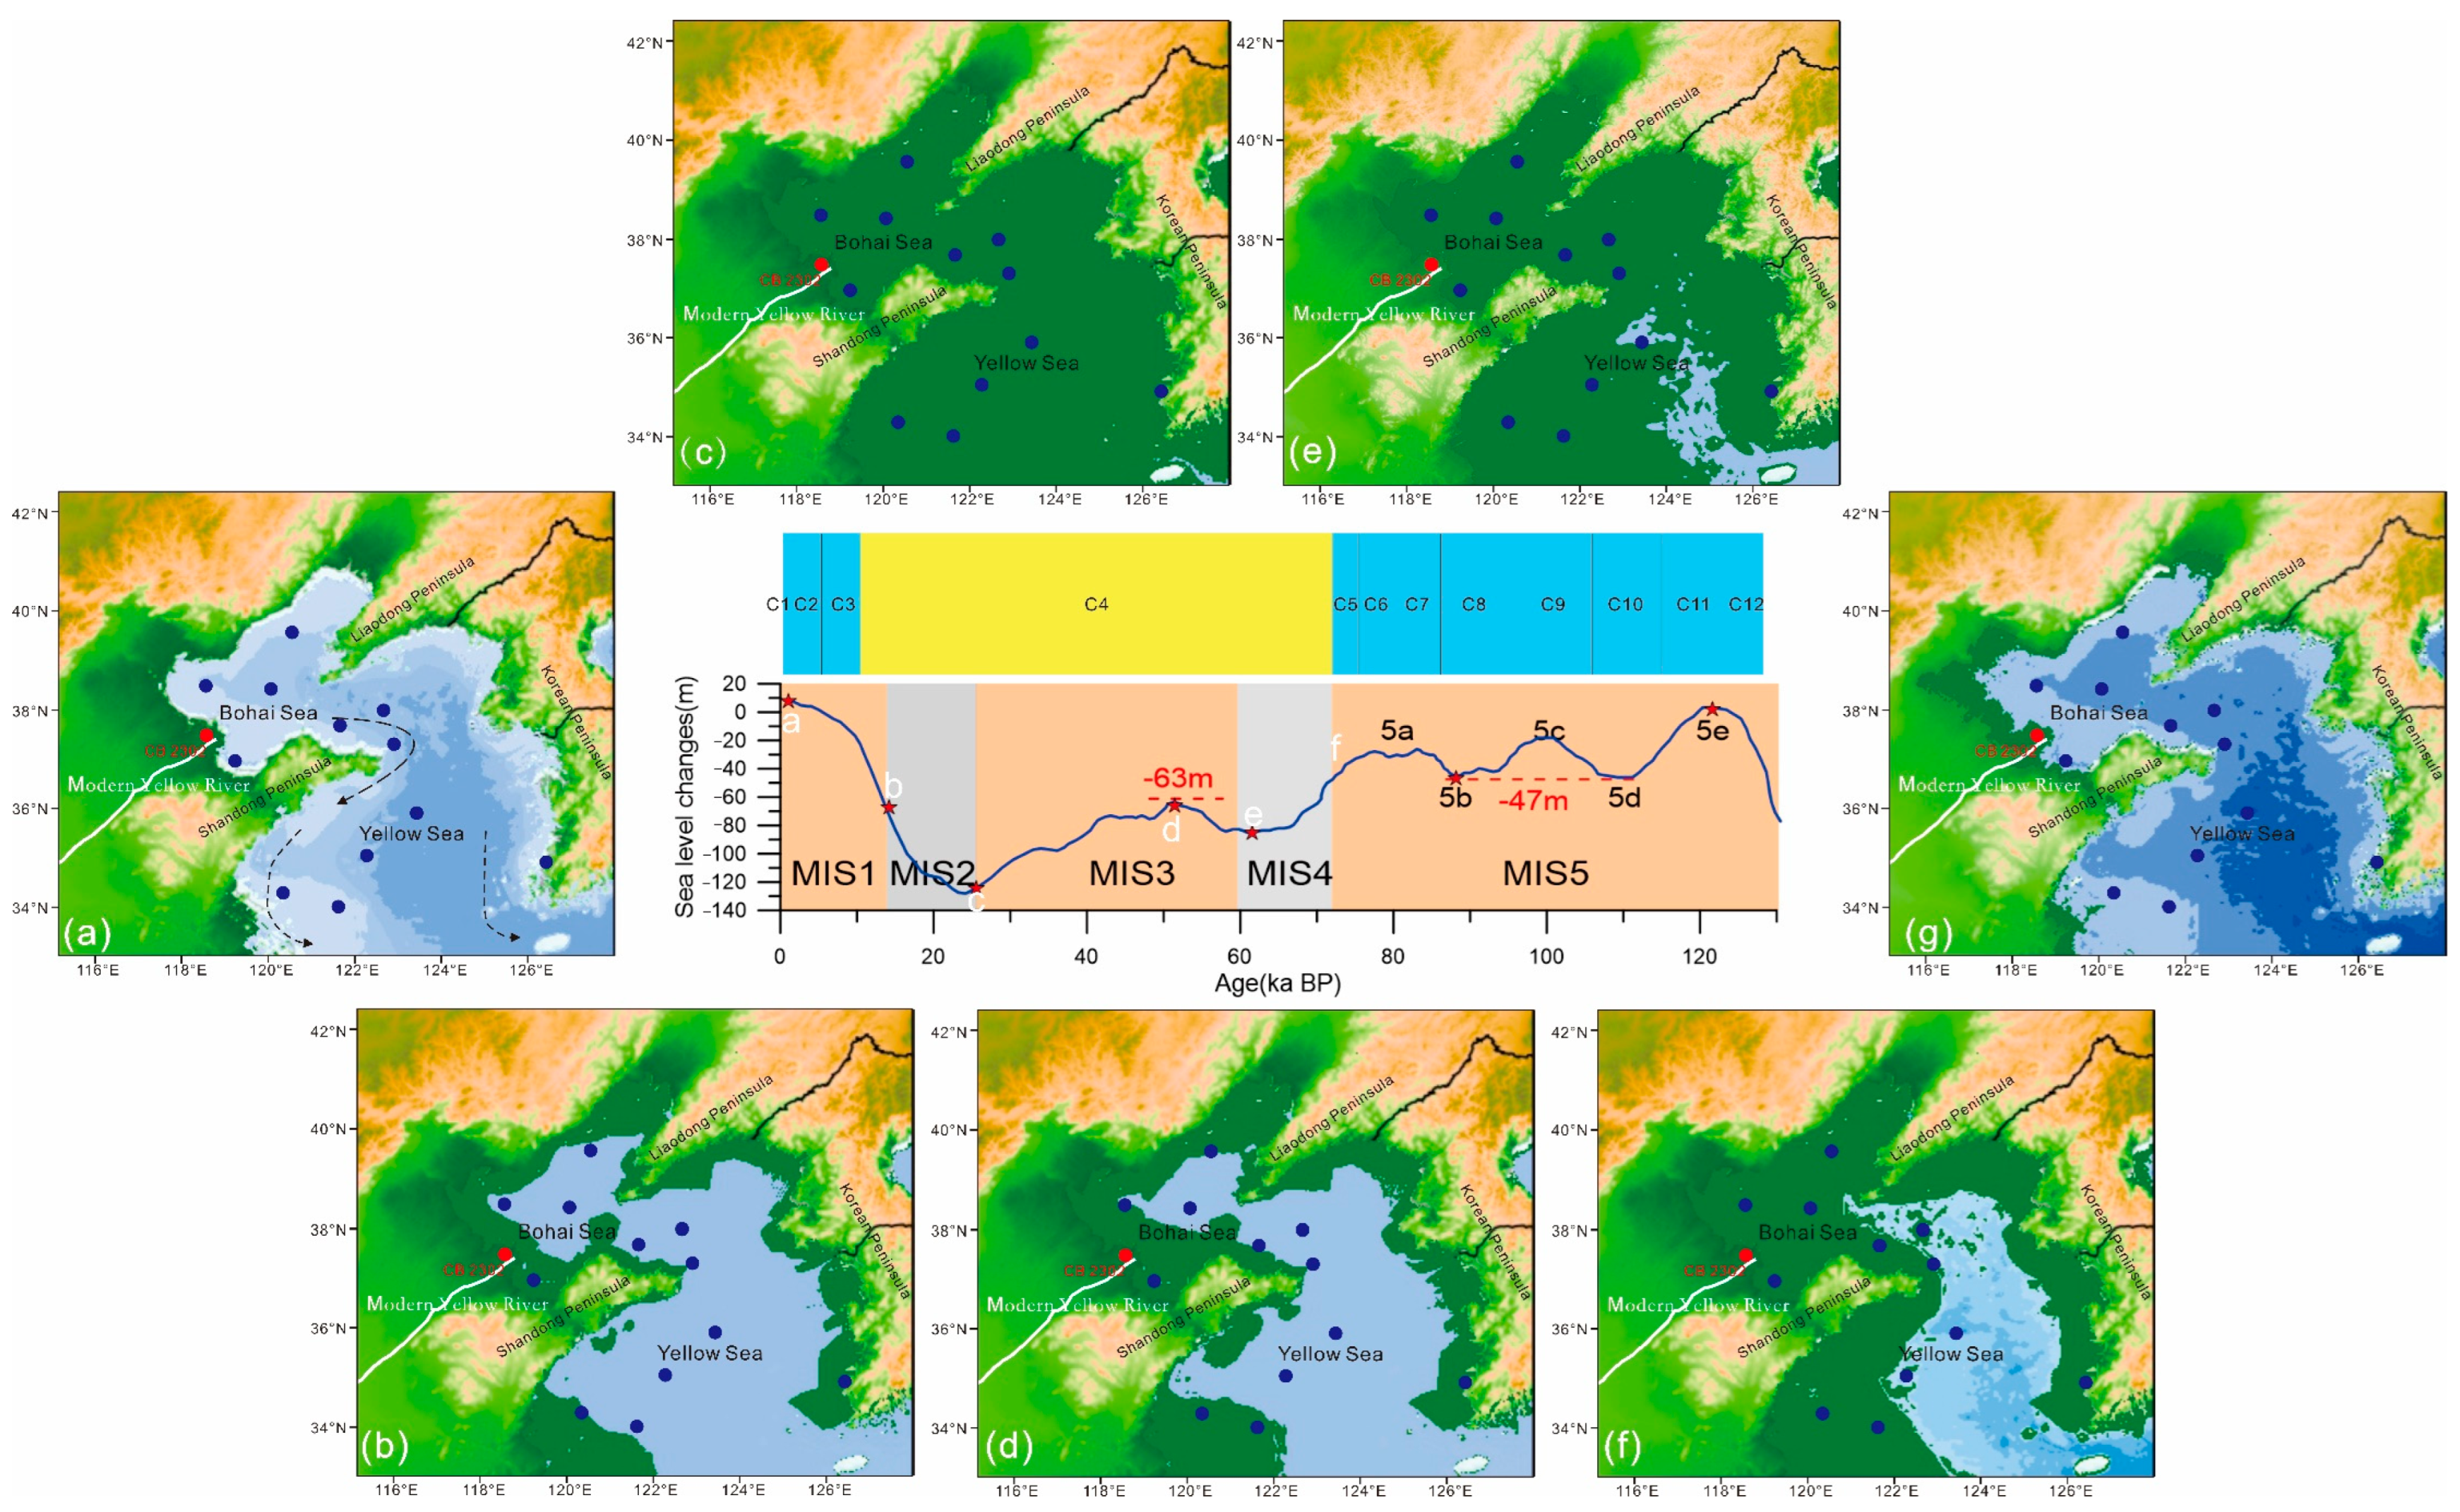
Figure 10.
Evolution model of the coastline of the Yellow Sea and Bohai Sea since the MIS5 period. (a) Today (MIS1 high sea level period); (b) Early MIS1 (low sea level period); (c) Early MIS2 (low water level period); (d) MIS3 high sea level period; (e) MIS4 low sea level period; (f) MIS5 low sea level period; (g) Maximum flooding surface of MIS5e.
- (2)
- MIS4
Sea-level decline to −85 m shifted deposition to terrestrial environments (Figure 10e). The South Yellow Sea developed fluvial, floodplain, and deltaic plain facies (Figure 9); the North Yellow Sea recorded estuary fills (Figure 8); and the Bohai Basin transitioned to fluvial-dominated terrestrial deposits (Figure 7).
- (3)
- MIS3
This Last Glacial interstadial saw marine deposition in the South Yellow Sea (neritic facies and tidal flat facies), with thicker, longer-duration offshore sequences (CSDP-1, YS01, DLC70-3) compared to thinner nearshore deposits (CSDP-2, 11YG-C4) (Figure 9). The North Yellow Sea remained dominated by estuary fills (Figure 8). In the Bohai, central (DLC70-1) and Liaodong Bay (LDD-7) boreholes preserved neritic facies, near-shore deposit, and tidal flat facies, while the Yellow River Delta (CB2302), Laizhou Bay (BH1302), and Bohai Bay (TJC-1) exhibited continuous terrestrial sequences (fluvial, floodplain, near-shore deposit, and paleo-terrestrial facies) (Figure 7). The −57 m basal elevation of LDD-7′s MIS3 layer—above the MIS3 maximum sea level (−63 m)—implies post-depositional tectonic uplift (Figure 10d).
- (4)
- MIS2
Marked by extreme regression (lowest Quaternary sea level), all study areas transitioned to terrestrial environments (Figure 10c). The North Yellow Sea recorded paleo-terrestrial deposits, while central Bohai (DLC70-1) and Liaodong Bay (LDD-7) boreholes preserved lacustrine and paleo-terrestrial facies (Figure 7). South Yellow Sea boreholes lack MIS2 terrestrial strata due to erosional hiatuses: DLC70-3 lies in a modern erosional zone [20]; CSDP-01 and YS01 show fluvial incision in SU2 (DU2); CSDP-2 and 11YG-C4 experienced enhanced tidal/wave erosion (Figure 9).
- (5)
- MIS1
Postglacial warming drove rapid transgression, with marine inundation recorded as tidal flat (subtidal) deposits transitioning to neritic facies, coastal–neritic facies, and shelf facies. Deltaic systems formed near river mouths (e.g., Yellow River Delta).
Three major sea-level cycles since MIS5 have reshaped the Yellow–Bohai Sea’s coastal configuration and depositional environments. Integrating CB2302’s stratigraphy with regional borehole data, we reconstruct a comprehensive transgression–regression model (Figure 10a,b), resolving the interplay of eustasy, sediment dynamics, and tectonic controls in this marginal sea system.
5. Conclusions
By integrating grain-size analysis, foraminiferal assemblages, AMS 14C dating, and regional stratigraphic correlations across the Yellow–Bohai Sea system, this study reconstructs the sedimentary evolution of the northern Yellow River Delta since MIS5, using borehole CB2302 as a key archive. The key findings are as follows:
- (1)
- Three sedimentary strata (DU1–DU3) and twelve depositional units (C1–C12) were identified in Borehole CB2302 based on grain-size distributions and microfossil assemblages, with marine-influenced units comprising modern Yellow River delta, neritic facies, tidal flats, near-shore deposits, coastal bars, and tidal channels.
- (2)
- A stratigraphic framework for the northern Yellow River Delta since MIS5 reveals three transgression–regression cycles (MIS5e, MIS5c, MIS5a), with terrestrial-dominated sedimentation prevailing during MIS4–2 and no evidence of MIS3 marine deposits.
- (3)
- The reconstructed transgression–regression model since MIS5 highlights distinct regional responses: During MIS5, three sea-level oscillations were sensitively recorded in the Bohai Sea but were weakly expressed in the Yellow Sea. MIS4 and MIS2 were marked by pervasive terrestrial environments across both seas. In contrast, MIS3 marine strata were restricted to central Bohai and Liaodong Bay and absent from most Bohai boreholes (e.g., CB2302). Finally, rapid MIS1 transgression established modern marine–terrestrial configurations, with deltaic and neritic facies dominating.
Author Contributions
Conceptualization, H.L. and G.L.; Methodology, H.L., G.L. and J.Y.; Software, S.L.; Validation, G.L.; Formal analysis, J.Z.; Investigation, J.Z., J.Y., L.X., W.J. and S.L.; Resources, J.Y.; Data curation, H.L., J.Y., L.X. and W.J.; Writing – original draft, H.L.; Writing – review & editing, G.L.; Supervision, G.L.; Project administration, G.L., J.Z. and J.Y.; Funding acquisition, G.L. All authors have read and agreed to the published version of the manuscript.
Funding
This study was jointly supported by the National Natural Science Foundation of China (Grant No. 42121005) and National Key Research and the Development Program of China (grant 2024YFE0116400). Users of the materials are required to clearly acknowledge the support of Ocean University of China.
Data Availability Statement
The original contributions presented in this study are included in the article materials. Further inquiries can be directed to the corresponding author.
Conflicts of Interest
Author Jiejun Yang was employed by the company Shandong Continental Shelf Marine Technology Co., Ltd. The remaining authors declare that the research was conducted in the absence of any commercial or financial relationships that could be construed as a potential conflict of interest.
References
- Qiu, J.; Liu, J.; Saito, Y.; Yang, Z.; Yue, B.; Wang, H.; Kong, X. Sedimentary evolution of the Holocene subaqueous clinoform off the southern Shandong Peninsula in the Western South Yellow Sea. J. Ocean. Univ. China 2014, 13, 747–760. [Google Scholar] [CrossRef]
- Liu, J.; Saito, Y.; Wang, H. Sedimentary evolution of the Holocene subaqueous clinoform off the Shandong Peninsula in the Yellow Sea. Mar. Geol. 2007, 236, 165–187. [Google Scholar] [CrossRef]
- Saito, Y.; Yang, Z.; Hori, K. The Huanghe (Yellow River) and Changjiang (Yangtze River) deltas: A review on their characteristics, evolution and sediment discharge during the Holocene. Geomorphology 2001, 41, 219–231. [Google Scholar] [CrossRef]
- Gao, S.; Collins, M.B. Holocene sedimentary systems on continental shelves. Mar. Geol. 2014, 352, 268–294. [Google Scholar] [CrossRef]
- Lei, H.; Chunting, X.; Siyuan, Y.; Alessandro, A.; Hongming, Y.; Shixiong, Y.; Laws, E.A. New evidence on the spatial-temporal distribution of superlobes in the Yellow River Delta Complex. Quat. Sci. Rev. Int. Multidiscip. Rev. J. 2019, 214, 117–138. [Google Scholar]
- Chen, Y.; Xia, F.; Zhang, Z.; Xu, Q.; Gui, F. Environmental and provenance change since MIS 2 recorded by two sediment cores in the central North Jiangsu Plain, East China. Front. Earth Sci. 2023, 10, 1077484. [Google Scholar] [CrossRef]
- Hao, T.; Liu, X.; Ogg, J.; Liang, Z.; Xiang, R.; Zhang, X.; Zhang, D.; Zhang, C.; Liu, Q.; Li, X. Intensified episodes of East Asian Winter Monsoon during the middle through late Holocene driven by North Atlantic cooling events: High-resolution lignin records from the South Yellow Sea, China. Earth Planet. Sci. Lett. 2017, 479, 144–155. [Google Scholar] [CrossRef]
- Hu, B.; Li, J.; Zhao, J.; Wei, H.; Yin, X.; Li, G.; Liu, Y.; Sun, Z.; Zou, L.; Bai, F.; et al. Late Holocene Elemental and Isotopic Carbon and Nitrogen Records from the East China Sea Inner Shelf: Implications for Monsoon and Upwelling. Mar. Chem. 2014, 162, 60–70. [Google Scholar] [CrossRef]
- Tentori, D.; Mancini, M.; Stigliano, F.; Milli, S.; Simionato, M.; Livani, M.; Moscatelli, M. Integrating Sequence Stratigraphy and Geostatistical Methods for 3D Lithofacies Modelling of the Tiber Alluvial Plain, Rome, Italy. Basin Res. 2025, 37, e70024. [Google Scholar] [CrossRef]
- Yuan, X.; Hu, R.; Feng, X.; Qiu, J.; Wang, N.; Yao, Z.; Zhu, L.; Li, J. Sedimentary records and implications for the evolution of sedimentary environments inferred from BH1302 during the late Quaternary in the Bohai Sea, China. Mar. Geol. 2023, 456, 106986. [Google Scholar] [CrossRef]
- Dahlen, M.Z. Sequence stratigraphy, depositional history, and middle to late Quaternary sea levels of the Ventura shelf, California. Quat. Res. 1992, 38, 234–245. [Google Scholar] [CrossRef]
- Long, Z.; Wang, Z.; Tu, H.; Li, R.; Wen, Z.; Wang, Y.; Zhang, Y.; Lai, Z. OSL and radiocarbon dating of a core from the Bohai Sea in China and implication for Late Quaternary transgression pattern. Quat. Geochronol. 2022, 70, 101308. [Google Scholar] [CrossRef]
- Gao, W. Stratigraphy Sequence of Diaokou Lobe in the Modren Yellow River Delta. Ph.D. Thesis, The Ocean University of China, Qingdao, China, 2012. (In Chinese). [Google Scholar]
- Xue, C.; Ye, S.; Gao, M.; Ding, X. Determination of depositional age in the Huanghe Delta in China. Acta Oceanol. Sin. 2009, 31, 117–124. (In Chinese) [Google Scholar]
- Zhang, X.; Liu, J.; Wang, Y.; Chen, T.; Abbas, M.; Qian, S. Timing of Sedimentary Evolution and Transgressions in the Bohai Sea During the Last ∼200 ka: Constraints from Luminescence Dating of a Core from the Yellow River Delta. Front. Earth Sci. 2022, 10, 865761. [Google Scholar] [CrossRef]
- Sun, S.; Zhao, J.; Li, J.; Hu, B. Stratigraphic and Paleo-Environmental Evolution of Liaodong Bay Since Late Pleistocene: Evidence from Core LDD7. J. Jilin Univ. (Earth Sci. Ed.) 2015, 45, 1460–1469. (In Chinese) [Google Scholar] [CrossRef]
- Lan, X.; Qin, Y.; Wang, Z.; Chen, X.; Mi, B.; Huang, L. The geochemical characteristics of sediments in the eastern part of Bohai Sea since the Late Pleistocene. Acta Sedimentol. Sin. 2016, 34, 892–901. (In Chinese) [Google Scholar] [CrossRef]
- Chen, X. Sedimentary Stratigraphic Structure and Provenance Environmental Evolution in the North Yellow Sea During the Late Quaternary. Ph.D. Thesis, Institute of Oceanology Chinese Academy of Sciences, Qingdao, China, 2014. (In Chinese). [Google Scholar]
- Li, Y.; Huang, X.; Hiep, N.T.; Lian, E.; Yang, S. Disentangle the Sediment Mixing from Geochemical Proxies and Detrital Zircon Geochronology. Marine Geology 2021, 440, 106572. [Google Scholar] [CrossRef]
- Mei, X. Sedimentary Record and Environmental Implications Since the Late Pleistocene from the Core DLC70-3 in South Yellow Sea. Ph.D. Thesis, Institute of Oceanology Chinese Academy of Sciences, Qingdao, China, 2011. (In Chinese). [Google Scholar]
- Wang, L. Sedimentary Characteristics of the South Yellow Sea During the Quaternary and Its Response to Climate Change. Ph.D. Thesis, The Ocean University of China, Qingdao, China, 2020. (In Chinese). [Google Scholar]
- Zhang, X. Chronology and Sedimentary Environment Change in the Coastal-Shelf Areas of Eastern China Since 200 ka. Ph.D. Thesis, China University of Geosciences, Beijing, China, 2022. (In Chinese). [Google Scholar]
- Chang, T.S.; Kim, J.C.; Yi, S. Discovery of Eemian marine deposits along the Baeksu tidal shore, southwest coast of Korea. Quat. Int. 2014, 349, 409–418. [Google Scholar] [CrossRef]
- Houbrechts, G.; Hallot, E.; Levecq, Y.; Denis, A.C.; Petit, F. Passega’s CM diagram of the Ardennian rivers. Bulletin de la Société géographique de Liège 2013, 61. Available online: https://www.researchgate.net/publication/286057028_Passega's_CM_diagram_of_the_Ardennian_rivers (accessed on 1 January 2013).
- GB/T12763.8-2007; Marine Survey Code—Part 8: Marine Geological and Geophysical Survey. Standardization Administration of China: Beijing, China, 2007.
- Zhao, S.; Yang, G.; Cang, S.; Zhang, H.; Liu, C. On the marine stratigraphy and coastlines of the western coast of the gulf of Bohai. Oceanol. Limnol. Sin. 1978, 9, 15–25. [Google Scholar]
- Liu, J.; Saito, Y.; Wang, H.; Zhou, L.; Yang, Z. Stratigraphic development during the Late Pleistocene and Holocene offshore of the Yellow River delta, Bohai Sea. J. Asian Earth Sci. 2009, 36, 318–331. [Google Scholar] [CrossRef]
- Yan, Y.; Wang, H.; Li, F.; Tian, L. Different Depositional Processes of Boreholes Bq1 and Bq2 in the Late Pleistocene on the West Coast of Bohai Bay. Quat. Ences 2006, 26, 321–326. [Google Scholar] [CrossRef]
- Chen, Y.K.; Li, Z.H.; Shao, Y.X.; Wang, Z.S.; Yang, X.L. Study on the Quaternary Chronostratigraphic Section in Tianjin Area. Dizhen Dizhi 2008, 30, 383–399. [Google Scholar]
- Rohling, E.J.; Foster, G.L.; Grant, K.M.; Marino, G.; Roberts, A.P.; Tamisiea, M.E.; Williams, F. Sea-level and deep-sea-temperature variability over the past 5.3 million years. Nature 2014, 508, 477–482. [Google Scholar] [CrossRef] [PubMed]
- Miller, K.G.; Browning, J.V.; Schmelz, W.J.; Kopp, R.E.; Mountain, G.S.; Wright, J.D. Cenozoic sea-level and cryospheric evolution from deep-sea geochemical and continental margin records. Sci. Adv. 2020, 6, eaaz1346. [Google Scholar] [CrossRef]
- Liu, J.; Zhang, J.; Miao, X.; Xu, S.; Wang, H. Mineralogy of the core YRD-1101 of the Yellow River Delta: Implications for sediment origin and environmental evolution during the last ~1.9 Myr. Quat. Int. 2020, 537, 79–87. [Google Scholar] [CrossRef]
- Bridgeman, J.G. Understanding Mississippi Delta Subsidence Through Stratigraphic and Geotechnical Analysis of a Continuous Holocene Core at a Subsidence Superstation; Tulane University School of Science and Engineering: New Orleans, LA, USA, 2018. [Google Scholar]
- Chappell, J.; Omura, A.; Esat, T.; McCulloch, M.; Pandolfi, J.; Ota, Y.; Pillans, B. Reconciliaion of late Quaternary sea levels derived from coral terraces at Huon Peninsula with deep sea oxygen isotope records. Earth Planet. Sci. Lett. 1996, 141, 227–236. [Google Scholar] [CrossRef]
- Fang, Y.; Chen, Y.; Tian, C.; Lin, T.; Hu, L.; Huang, G.; Tang, J.; Li, J.; Zhang, G. Flux and budget of BC in the continental shelf seas adjacent to Chinese high BC emission source regions. Glob. Biogeochem. Cycles 2015, 29, 957–972. [Google Scholar] [CrossRef]
- Gao, M.; Guo, F.; Huang, X.; Hou, G. China Sediment Distribution and provenance since Late Pleistocene in Laizhou Bay, Bohai Sea, China. China Geol. 2019, 2, 16–25. [Google Scholar] [CrossRef]


Disclaimer/Publisher’s Note: The statements, opinions and data contained in all publications are solely those of the individual author(s) and contributor(s) and not of MDPI and/or the editor(s). MDPI and/or the editor(s) disclaim responsibility for any injury to people or property resulting from any ideas, methods, instructions or products referred to in the content. |
© 2025 by the authors. Licensee MDPI, Basel, Switzerland. This article is an open access article distributed under the terms and conditions of the Creative Commons Attribution (CC BY) license (https://creativecommons.org/licenses/by/4.0/).