Abstract
In this paper, the application of the excessive acceleration (EA) criterion, one of five intact stability failure modes, within the second generation intact stability criteria (SGISC) framework, is shown for a set of naval vessels. First and second level vulnerability assessment of the criterion is applied to parent hulls D1 and D5 of D-Systematic Series, the US Office of Naval Research (ONR) Topside Series model, and the European multi-purpose frigate FREMM. All of which are semi-displacement, transom stern, and round bilge hull forms. Relatively low ship roll periods and great variations of hull geometry in vertical direction make this kind of ship potentially vulnerable to the EA phenomenon. Five displacements are considered for each vessel, and the minimum value of the height, which satisfies the Level 2 assessment, is computed for each of them. The curve of the minimum allowable is compared with the curve of the maximum complying with intact stability criteria specified in RINA (Registro Italiano Navale), classification rules for naval ships.
1. Introduction
In the last years, a great effort has been made by the International Maritime Organization (IMO) Correspondence Group on intact stability, to define and validate the SGISC which deal with intact ship stability failures in waves. The development of new generation criteria follows the revision of the Intact Stability Code (started in 2001, completed in 2006, and entered into force in 2008) carried out by the Intact Stability Working Group [1,2].
This new generation of stability criteria addresses five intact stability failure modes in waves: pure loss of stability, parametric roll, surf riding/broaching-to, dead ship condition, and excessive acceleration. A physical model was developed for each phenomenon, and a multilayered approach was adopted with three levels of assessment. A given ship should not fail at least one of the three levels of assessment, in each condition of loading. The first level is the most simple and the most conservative: if a ship fails it, then she is considered as unconventional, and Level 2 assessment is required. Level 2 is less conservative and more complex than Level 1, although some simplifying assumptions are used; if the ship does not also pass Level 2, then a direct stability assessment (DSA) has to be performed, which requires six degrees of freedom simulations of the ship behavior in seaway. Alternatively, operational measures (OM) could be developed for the loading conditions where Level 2 or DSA fails: They can limit the ship’s operation in given loading conditions (operational guidance, OG) or they can be a guidance which specifies combinations of ship speed and wave direction to be avoided in each relevant sea state (operational limitations, OL), as specified in [3].
Level 1 and Level 2 vulnerability assessment of the excessive acceleration criterion are considered in this paper. As regards Level 1, the assessment is performed through a comparison between two accelerations: one has to be computed according to formulas reported in the draft of the criterion, and the other is a threshold value. The first one has to be compared with the threshold value, known as the standard value. The ship meets Level 1 if the computed value is lower than the standard value. The Level 2 assessment is performed in probabilistic terms through the computation of a long term stability failure index, according to the procedure reported in the draft of the criterion. Then, the obtained value has to be compared with the standard value; Level 2 is satisfied if the first one is lower than the second one.
Because Level 1 is more conservative than Level 2, a ship that passes the first one should also pass the second one; otherwise, there is an inconsistency between the formulations of the two levels. The occurrence of such inconsistency was checked in the sample calculations, see Table 1 below, as reported in IMO documents drawn up by the Sub-Committee on Ship Design and Construction (SDC).

Table 1.
Summary of sample calculations.
The criterion was introduced later than the other four criteria, as a response to fatal accidents on board of two containerships, Chicago Express in 2008 during typhoon Hagupit, and CCNI Guayas in 2009 during typhoon Koppu. In both cases, lateral accelerations greater than 1.0 g were experienced on the bridge deck [4,5]. The investigations on the accidents showed that they were mainly due: to small roll period, about 10 seconds in both cases, caused by a great value of metacentric height (Chicago Express sailed partly loaded while CCNI Guayas was in ballast condition) and to low roll damping due to the fact that the vessels were sailing at very low speed at the time of the accidents.
After the accidents, Germany submitted a document to IMO [6], highlighting that excessive lateral accelerations due to synchronous roll were not addressed by the other four SGISC. In the first generation intact stability criteria, it is only suggested to avoid too high values of metacentric height which could cause dangerous accelerations.
Sample calculations, based on the excessive acceleration criterion drafts, for vessels of different size and typology, were submitted by Chinese, Japanese, CLIA (Cruise Line International Association), German and Danish delegations, in different IMO documents, [7,8,9], which are reported in Table 1. The number of ships tested and the threshold values (standard values) used to judge if a ship passed or not Level 1 and 2 of the criterion are reported. The current standard values, see [3], are reported in Table 2.
Table 2.
Current standards of EA criterion.
From Table 1, it can be observed how many ships were tested and what were the standard values used in the calculations. Each delegation reported if inconsistencies between the first and second levels were observed and proposed new standard values. As stated before, an inconsistency is observed when a ship passes Level 1 and fails Level 2; such ship is considered “false negative”.
As regards the standard values used by the German delegation in [10], they obtained them from backward analysis; they stated that the standards chosen must be able to find vulnerable to EA the loading condition of container vessel Chicago Express at the time of the accident. In other words, Germany performed calculations, taking into account Chicago Express in the loading mentioned above condition: the attained values were 7.66 m/s2 for Level 1 and 3.9 × 10⁻⁴ for Level 2. Hence, Germany suggested that 3.9 × 10⁻⁴ should be taken as the limit value for the Level 2 assessment, while a limit value of 5.88 m/s2 should avoid inconsistencies for Level 1. This last value was evaluated through sample calculations performed on a set of five container ships, one gas carrier, 13 cruise vessels, and three ro-pax ships. Germany also compared results obtained using this set of values with the ones obtained using standard values proposed by Chinese and Japanese delegations: these last were not able to judge the loading conditions of Chicago Express as vulnerable to EA at the time of the accident; at the opposite, the standard values proposed by Germany were able to identify this vulnerability, but at the same time they were quite severe and had a strong impact on ship design.
In the most recent versions of the drafts of the criterion, the following standard values for the EA assessment were chosen: 4.64 m/s2 for Level 1 and 3.9 × 10⁻⁴ for Level 2. This choice was made during the 6th session of the SDC Subcommittee, where delegations replied to a questionnaire in which four options for EA failure mode were presented [11]. Anyway, the French delegation noticed that this option is too conservative, judging oil tankers and bulk carriers vulnerable to EA, which are quite safe regarding this phenomenon.
In the present work, the EA assessment has been performed referring to a set of four naval vessels, with the aim to investigate the agreement of actual military vessels’ stability criteria with the new SGISC.
Although SGISC do not refer to naval vessels, recently, the application of SGISC to naval vessels was considered in [12,13,14,15]. In [12], Level 1 and Level 2 of parametric roll and surf-riding/broaching were assessed for eight notional naval ships of different sizes (amphibious ship, carrier, cruiser, destroyer, frigate, minehunter, patrol craft, and small combatant) in a given condition of loading. In [13], calculations on the 1st and 2nd level of assessment for parametric roll and pure loss of stability were performed for a helicopter carrier, a destroyer derived from model DTMB 5415, and an offshore patrol vessel. They represent a set of naval hull forms of different sizes and operational profiles. The limiting curves were obtained for various displacements and for each failure mode. These results were compared against the 2008 IS Code and French military regulations. The same three vessels were also investigated in [14], where the maximum allowable curves for Level 1 vulnerability assessment were reported for all five intact stability failure modes. It was also noted that the curve of minimum allowable complying with the EA criterion could conflict with the maximum curves. In [15], Level 2 assessment was performed for all five SGISC for the three vessels, and the “design space” was defined taking into account also maximum allowable curves associated with the Naval Ship Code. It was shown that: for the heli-carrier, the design space exists for all the operational draughts; for the destroyer, it does not exist for the highest draught; for the offshore patrol vessel, the design space does not exist at all.
As pointed out above, the main goals of the refinement of standards were to avoid inconsistencies and to identify all ships potentially vulnerable to the EA phenomenon, but in this way, the criterion became too conservative. Indeed, the application of the criterion to naval vessels performed in this paper shows that there are not inconsistencies, but Level 2 requires minimum values of the too high and in conflict with the limiting curves associated with intact stability requirements for naval ships.
Naval vessels considered in this work are two ships derived from models D1 and D5, parent hulls of D-Systematic Series [16]; a European multi-purpose frigate FREMM; a vessel derived from models of the US Office of Naval Research (ONR) Topside Series.
This set of vessels was already studied in [17]. The first and second levels of assessment of parametric roll, pure loss of stability, and surf-riding/broaching were assessed for a given condition of loading and different speeds. In addition, D1 and D5 models were scaled to 132 m length ships to be comparable with the ONR and FREMM dimensions.
In [18], Level 1 and Level 2 of surf-riding/broaching were assessed for all seven models of D-Systematic series, scaled to 90 m ships, identifying the critical ship speed. In [19], Level 1 and Level 2 of surf-riding/broaching and pure loss of stability for parent hulls D1 and D5, scaled on 90 length ships, were assessed.
These works are used here as the main reference for the input data.
2. Sample Naval Ships
A systematic series, known as D-Series [16], was developed in the 1990s, as a response to the trend toward shorter and broader ships (the average L/B ratio is about 6.00). Seven models, divided into two groups, were created: the first one from D1 to D4 and the second one from D5 to D7. D1 and D5 are, respectively, the parent hulls of the first and second groups. The body plans of parent hull forms are shown in Figure 1 and Figure 2.
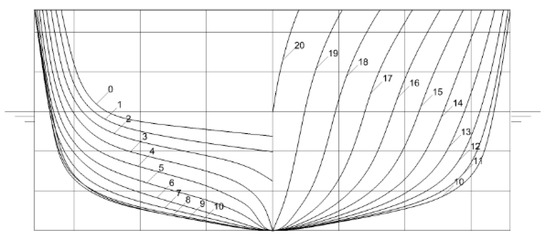
Figure 1.
The body plan of D1 model.
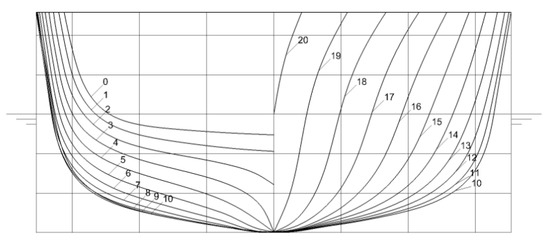
Figure 2.
The body plan of D5 model.
The FREMM, shown in Figure 3, is a class of multi-purpose frigates designed by Fincantieri and Naval Group for the navies of Italy and France. In Italy, the class is known as the Bergamini class while in France as the Aquitaine class.
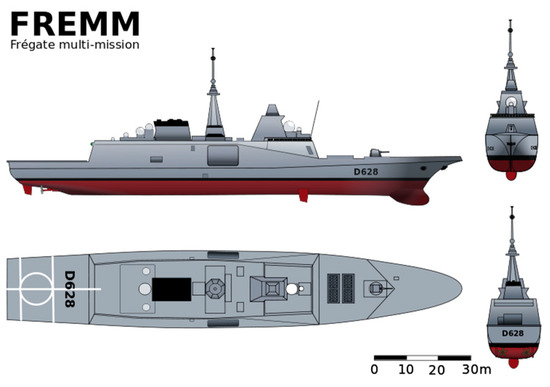
Figure 3.
FREMM, French Version (Wikipedia).
The ONR (The US Office of Naval Research) Topside Series hull forms represent typical high-speed ships. To investigate the influence of the topside geometry on ship motions, three configurations were originated: wall-sided (ONRWS), flared (ONRF), and tumblehome (ONRT), all with the same underwater geometry.
Only information about the underwater geometry is required for the assessment of the Level 2 EA criterion, so the results obtained can be considered common to all three possible configurations. The transversal underwater sections are reported in Figure 4.
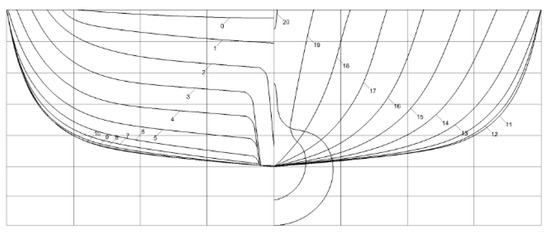
Figure 4.
The US Office of Naval Research (ONR) underwater sections.
3. Excessive Acceleration Criterion
3.1. Preliminary Remarks and Level 1 Assessment Procedure
The lateral acceleration acting on fixed points along the ship is a function of roll period and distance from the roll axis. If the roll amplitude does not change, a reduction in ship roll period causes an increase in lateral acceleration and vice versa; moreover, for the same roll period, an increase in the quote on the roll axis causes an increase in lateral acceleration. It is obvious that ships in loading conditions with great values of metacentric height are particularly sensitive to lateral accelerations due to the low roll period, which is inversely proportional to the square root of .
The excessive acceleration assessment was conducted following the draft reported in the IMO document [3] and explanatory notes in [20]. As the integration of previous documents, [7,11,21,22] was used.
For a given condition of loading, the assessment must be performed if two conditions are verified:
- The highest location along the length of the ship where passengers or crew may be present has a quote above the waterline greater than , where is is the breadth of the ship; and
- The metacentric height is greater than .
Level 1 assessment is a 1-DOF model, very simple to perform; it is satisfied if the computed value of acceleration is lower than the limit value, for the examined loading condition and for the highest position above the waterline where passengers or crew may be present:
where:
- is the limit value;
- is the characteristic roll amplitude;
- is a factor which takes into account the coupling of roll with other ship motions;
- is the height above the roll axis of the location considered;
- is the ship roll period.
The computation of these parameters can be easily done through the formulas reported in [3].
3.2. Level 2 Assessment Procedure
If Level 1 is not met, then Level 2 has to be performed. 1-DOF model is adopted to describe roll motion, which is modeled as uncoupled from longitudinal and transversal motions. This hypothesis is corrected using factor introduced in Level 1. The uncoupled equation of roll motion is non-linear, being non-linear the damping term. In still water, it may be written as:
where:
- is the roll moment of inertia comprising added inertia;
- is the non-linear roll damping moment;
- is the ship weight;
- is the initial metacentric height not corrected for the free surface effect.
A linearization of the damping term is performed introducing an equivalent linear roll damping factor able to take into account non-linearity.
The computation of is performed in EA assessment minimizing the expectation value of the square of the error associated with the linearization (by means of the least square method). A set of three damping coefficients (linear, quadratic, and cubic) has to be evaluated, fitting a quadratic parabola obtained, applying Ikeda’s simplified method [23]. These coefficients make possible the computation of an equivalent linear roll damping coefficient per unit mass moment of inertia , by an iterative procedure, for each sea state. Hence: .
In more detail, the first step to perform the linearization is to represent the non-linear damping moment through a cubic odd function:
Introducing this representation in the equation of roll motion and dividing both parts by , it becomes:
where and are the linear, quadratic, and cubic damping coefficients, respectively. Furthermore, , is the roll natural frequency, defined as:
This set of coefficients makes possible the definition of the linearized roll damping coefficient as:
being the roll amplitude.
In the case of irregular sea, the evaluation of the roll damping coefficients is performed, minimizing the expected value of the square of the error associated with the linearization, which is a random variable. This is made using the least square method. First, Ikeda’s simplified method has to be applied to compute, for a certain number of roll amplitudes, the equivalent linear roll damping factor . This method separates the damping into five components: the friction , the wave , the eddy , the lift and the bilge keel component:
In the EA assessment, a zero speed condition is assumed, hence the roll damping has the lowest possible value, being zero for the lift component and because the other four components assume their minimum value. This assumption is not too conservative, because accidents on board the Chicago Express and CCNI Guayas happened at very low speed.
Plotting as a function of the roll amplitude the following fitting has to be performed, using the method of least squares:
Once the roll damping coefficients are obtained, the equivalent linear roll damping factor can be obtained by means of the following equation, through an iterative procedure, as the standard deviation of roll rate is a function of the damping factor:
It is worth noting that the iterative procedure has to be performed for each sea state, i.e., for each combination of wave height and average zero up-crossing wave period.
Level 2 assessment is performed in probabilistic terms: a long-term probability index has to be computed and compared with the limit value . The vessel passes level 2 if:
where the index is obtained through the computations of a weighting factor and a short-term stability failure index , for each sea state reported in the North Atlantic wave scatter diagram (International Association of Classification Societies (IACS) recommendation no. 34); the index is given as a summation of the products of and :
is the probability of the occurrence of the sea state under consideration; represents the probability of exceeding the threshold value in the sea state considered (a Rayleigh distribution is assumed):
being the standard deviation of lateral acceleration at zero speed in beam seaway.
In each sea state, the computation of the short-term index requires the evaluation of sea spectra, to be corrected with an effective wave slope function in whole frequency range; the Froude–Krylov exciting roll moment, neglecting the diffraction component; linear roll damping factor (iterative procedure); roll amplitude in regular beam waves of unit amplitude; lateral acceleration spectrum; standard deviation of lateral acceleration.
4. Assessment of Excessive Acceleration Criterion for Naval Ships
A numerical code was written in Visual Basic for Applications (VBA) to assess the first and second levels. It was validated on the benchmark C11 class containership reported in [20]. Flowchart for the Level 2 assessment is shown in Figure 5.
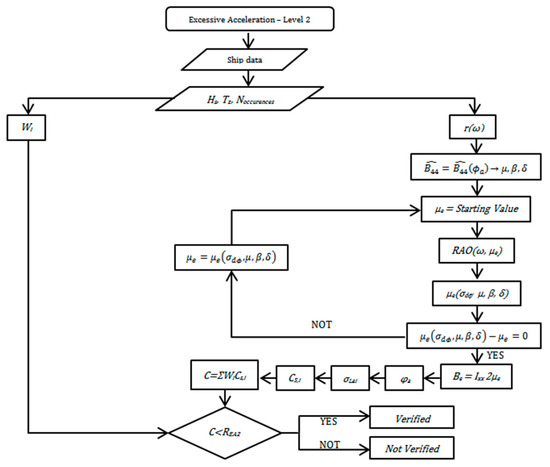
Figure 5.
Flowchart of the Level 2 procedure.
The assessment of excessive acceleration criterion was performed considering five displacements for each vessel. For naval vessels, great variation of displacement is not expected because they do not carry cargo in the usual sense. The lowest value of displacement was assumed to be about 20% smaller than the one in the full load condition. Hence, the highest and lowest draughts correspond to 100% and about 80% of displacement in the full load condition, respectively. The ships were assumed in a zero trim condition; no bilge keels were considered. Lateral accelerations were computed at the bridge.
The main particulars of the four ships in the full load condition are reported in Table 3. In this work, the aim was to investigate the operational limits, by means of limiting KG curves associated with Level 2, and not the specific loading case; therefore, there is no data on and in Table 3.
Table 3.
Principal particulars of the sample ships.
All four vessels were found vulnerable to Level 1 at each displacement (assuming a reasonable value): therefore, Level 2 was required for each of them.
As an example, the main results for the ONR model in the full load condition are reported. The main parameters in this condition are reported in Table 4.
Table 4.
The US Office of Naval Research (ONR) model main parameters in the full load condition.
As regards Level 1, it was not satisfied:
A second level of assessment was required. To evaluate Froude–Krylov moment due to waves, the effective wave slope function was calculated, as a function of the wave circular frequency, using the standard methodology, [7], see Figure 6. It is a reduction factor able to take into account the effect of the finite wave length on the exciting roll moment. The hull was divided into several transversal sections; the underwater part of each of them was transformed in an equivalent rectangular section, making possible the analytical computation of the wave incident pressure.
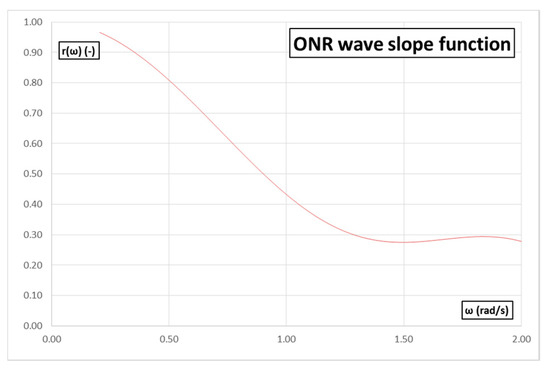
Figure 6.
ONR model, wave slope function in the full load condition.
The estimation of roll damping was performed numerically using Ikeda’s simplified method [23]. The vessel was considered without bilge keels and at zero speed, so the bilge keel and lift components of roll damping were both equal to zero. Hence, the damping moment was given only by the friction, wave, and eddy-making components.
The plot of the non-dimensional roll damping factor as a function of the roll amplitude , , was obtained performing the computation in the range from 1 deg to 20 deg, with a step of 1 deg. Then, linear, quadratic, and cubic roll damping coefficients were obtained fitting the quadratic parabola, Figure 7:
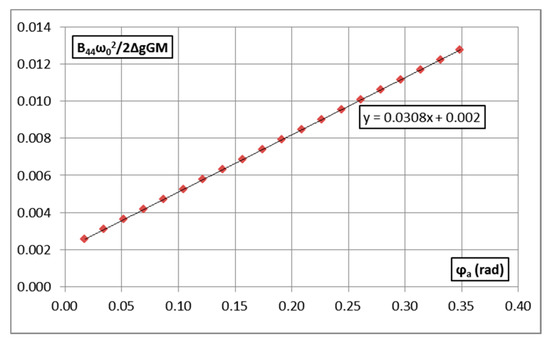
Figure 7.
ONR model, quadratic parabola in the full loading condition.
Linear, quadratic, and cubic roll damping coefficients computed in the full loading condition are reported in Table 5.
Table 5.
ONR model, roll damping coefficients in the full load condition.
It must be noted that for these hull forms, the midship section coefficient is lower than the limit of the range of applicability of Ikeda’s simplified method. As specified in the method, if one or more parameters exist outside the range of applicability, they should be set to the corresponding limit value. Ikeda’s method is based on a regression analysis on a sample of ships having hull forms quite different from those taken into account in this work, hence the reliability of the roll damping results obtained applying this method and how the final results of the Level 2 assessment are affected by this difference should be further investigated.
Computing the weighting factor and the short-term stability failure index for each sea state, summing the products, the long-term probability index was obtained and compared with the limit value:
The result shows that Level 2 was not verified.
The values of index for the ONR model, and , are reported as a function of the draught in Table 6.
Table 6.
ONR model: Long-term stability failure index.
To find the minimum value of the height which satisfies Level 2, the computation was repeated for each vessel and for each displacement varying the value of by step of 0.1 m.
In Figure 8, how the long-term stability failure index changes for different height , for all models in the full load condition is shown. The red line represents the limit value below which Level 2 of assessment is met. As can be seen, a minimum value of the height of the center of gravity complying with the second level of assessment may be defined for each vessel.
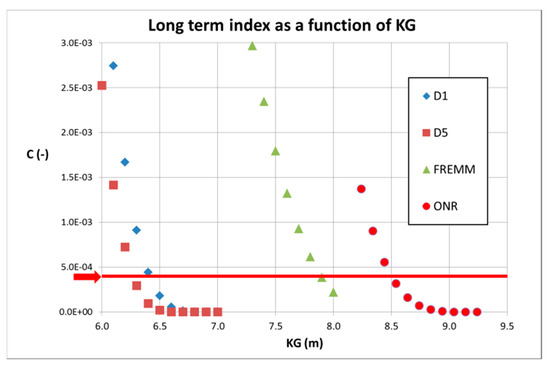
Figure 8.
Long term index for all vessels.
In Figure 9, the ratio of the maximum allowable complying with Level 2 assessment as a percentage of the breadth of the ship is reported. As can be seen, the maximum allowable was always lower than 8% of the breadth, which appears reasonable and congruent with the condition of assessment of the excessive acceleration criterion if , for the condition of loading considered.
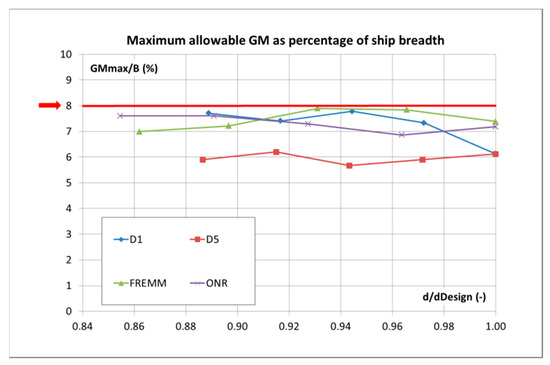
Figure 9.
Maximum allowable GM as a percentage of ship breadth.
5. Classification Rules for Naval Ships
Intact stability criteria impose a maximum curve and a minimum curve, except for the excessive acceleration criterion. As a consequence, the simultaneous assessment of all intact stability criteria should define a range of allowable (or, it is the same, a range of allowable ), for each displacement. The envelope of the maximum allowable was obtained by applying the intact stability criteria specified in RINA (Registro Italiano Navale) classification rules for naval ships, [24], to define the range of allowable for the considered ships.
The intact stability criteria for naval ships are more conservative than the analogous criteria for commercial vessels. In the present work, the criteria related to the righting arms curve and the severe wind and rolling criterion, as reported in [24], were considered. The severe wind and rolling criterion takes into consideration a profile of the wind speed as a function of the elevations above the waterline. The value of the wind speed, at 10 meters above the waterline, is a function of the service of the ship: for unrestricted service, the wind speed to be considered is 100 knots if the ship has to face extreme weather conditions, 80 knots if the ship has to avoid these conditions. Probably, if SGISC were adopted for naval ships, different wave scatter tables based on type of service and environment should be used.
A wind speed of 80 knots was considered for D1 and D5 models, while for the FREMM and the ONR, a wind speed of 100 knots. The reduced wind speed for D1 and D5 models, which can be considered representative of corvettes, is because, for this type of ship, it is not expected that they will face very heavy conditions. In the Naval Ship Code, a similar distinction is made according to the type of service and the environmental conditions that ships have to endure. In survival mode, a wind speed of 100 knots has to be considered for ships with “Ocean unlimited” service class, which corresponds to a significant wave height of 17.7 m; a wind speed of 80 knots has to be considered for ships with “Ocean limited” service class, which corresponds to a significant wave height of 11.2 m.
Furthermore, a hypothetical superstructure for D1 and D5 models was supposed, based on that of class Braunschweig (K-130) corvettes of the German Navy. The maximum curves were obtained in AutoHydro® program.
In Table 7, maximum and minimum values complying with navy regulations and EA assessment are given for all vessels at maximum draught.
Table 7.
Maximum and minimum allowable KG at maximum draught.
Referring to model D1, in Figure 10, the maximum and minimum allowable curves complying with intact stability criteria for navy ships (red line) and excessive acceleration criterion (blue line), respectively, are reported. The same is done for the D5 model, FREMM, and ONR model in Figure 11, Figure 12 and Figure 13, respectively.
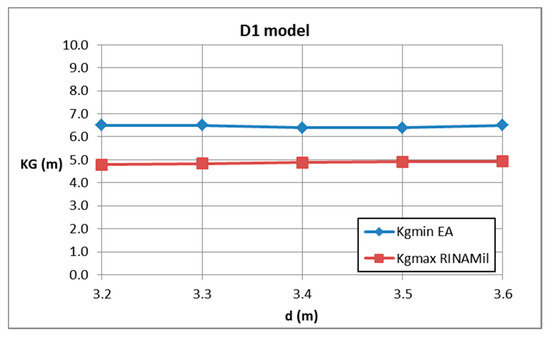
Figure 10.
D1 model, maximum and minimum allowable KG curve.
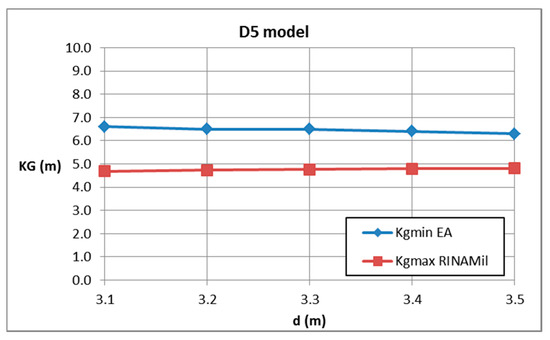
Figure 11.
D5 model, maximum and minimum allowable KG curve.
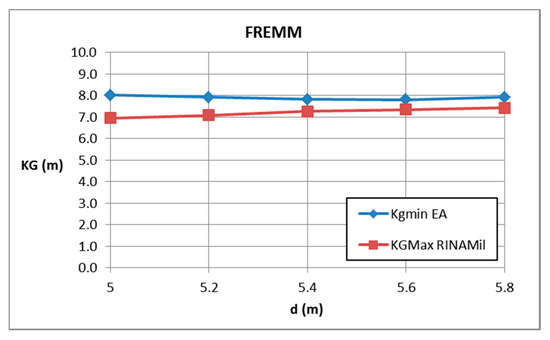
Figure 12.
FREMM, maximum and minimum allowable KG curve.
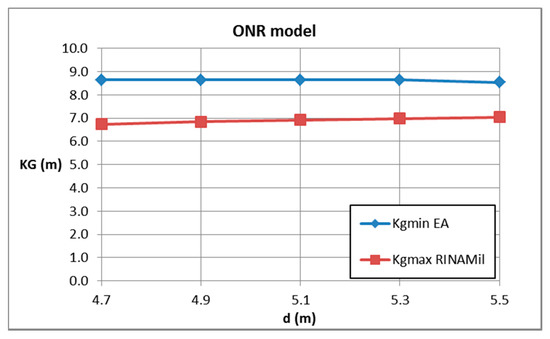
Figure 13.
ONR model, maximum and minimum allowable KG curve.
6. Roll Damping Estimation
In Section 4, it was noted that the reliability of the roll damping estimation for naval hull forms, like those considered in this work, which are very slender forms, should be investigated. All considered ships have the midship section coefficient lower than the limit of the range of applicability of the method.
In recent years, the accuracy of Ikeda’s method was the object of investigation in several works. In [25], the German delegation compared results obtained according to Ikeda’s simplified method with model tests available for two containerships in various loading conditions and different forward speeds, showing that this method overestimated roll damping in some cases. This usually happened when draught was small, and was large. Other critical remarks can be found in [26], where it was shown that for all considered vessels in sample calculations, there was at least one draught for which one or more parameters exceed the range of applicability. In [27], the reliability of simplified Ikeda’s method for inland vessels was investigated, showing that it underestimated the eddy-making component of damping for hull forms with high values of the block coefficient.
In [28], roll damping estimated using Ikeda’s method, model tests, and CFD simulations, referring to a set of three Pure Car and Truck Carries, was compared. These ships are characterized by a high center of gravity. It was shown that Ikeda’s method overestimates the hull lift component of damping and underestimates lift force acting on bilge keels. Hence, a refinement of the expressions of the lift and bilge keel damping components could improve the accuracy of the method.
Alternatively, an estimation of roll damping could be performed, referring to experimental results or numerical simulations. In the first case, a roll decay test should be performed, and an estimation of linear, quadratic, and roll damping coefficients could be made from the time history of decay [29]. If a numerical simulation is performed, great attention should be dedicated to degrees of freedom, grid refinement, and dimensions of the domain, which represent the main sources of uncertainty, because is still limited the experience of simulations of this phenomenon. Detailed information on numerical simulations topic can be found in [30].
7. Conclusions
An assessment of the excessive acceleration criterion has been performed for four naval ships at five displacements.
The minimum allowable curve complying with Level 2 of the EA criterion was computed for each ship and compared with limiting curves associated with intact stability criteria for navy ships [24].
As expected from the IMO documents, no inconsistencies were found between the first and second level EA assessments, but it was shown that the minimum allowable complying with Level 2 of the EA criterion was always greater than maximum allowable complying with military intact stability criteria, for all vessels and for each displacement. In other words, there are not values satisfying excessive acceleration and navy ships criteria at the same time. This is partly due to the fact that stability rules for naval vessels are more severe than the ones for merchant ship; it is also difficult to think that larger allowable lateral accelerations could be introduced on board of naval ships. Indeed, this is not an operability issue but it regards the safety of the lives of people embarked.
Fitting the vessels with bilge-keels and increasing the roll damping could be beneficial, although it is difficult to think that this reduction could be sufficiently great enough to ensure the condition minimum is sufficiently lower than the maximum in each condition of loading.
In addition to this, the envelope of the maximum allowable obtained applying parametric roll, pure loss of stability, and dead ship condition criteria should be considered with special attention on roll damping coefficients’ assessment, although the application of these criteria appears unnecessary because a conflict still exists between the stability rules currently into force and the EA criterion.
Further work will consider the effect of the more “accurate” roll damping assessment for naval ships on the EA criteria values.
Author Contributions
Conceptualization, project administration, supervision: G.B.; methodology: G.B and G.R.; formal analysis, resources, software, validation, data curation, writing—original draft preparation, writing—review and editing, visualization: G.R.
Funding
This research received no external funding.
Acknowledgments
The authors would like to acknowledge Ermina Begović and Barbara Rinauro, from the University of Naples Federico II, for valuable comments and suggestions during the preparation of this work. The authors would also like to express their gratitude to Igor Bačkalov and Stefan Rudaković, from the University of Belgrade, for help in the validation of the numerical code for the assessment of excessive acceleration stability failure mode and for valuable advice and discussions.
Conflicts of Interest
The authors declare no conflict of interest.
Nomenclature
| Symbol | SI Units | ||
| Quadratic roll damping coefficient | 1/rad | ||
| Cubic roll damping coefficient | s/rad2 | ||
| Ship displacement | t | ||
| Linear roll damping coefficient | 1/s | ||
| Linear equivalent roll damping coefficient | 1/s | ||
| Roll amplitude in regular beam waves of unit amplitude at zero speed | rad/m | ||
| Natural roll frequency | rad/s | ||
| Breadth of the ship | m | ||
| Equivalent linear roll damping factor | kNms | ||
| Non-dimensional equivalent linear roll damping factor | - | ||
| Long-term excessive acceleration failure index | - | ||
| Block coefficient | - | ||
| Short-term excessive acceleration failure index | - | ||
| Midship section coefficient | - | ||
| Mean draught | m | ||
| Gravity acceleration | m/s2 | ||
| Metacentric height in calm water not corrected for free surface effect | m | ||
| Height above the roll axis of the location where passengers or crew may be present | m | ||
| Roll moment of inertia comprising added inertia | tm2 | ||
| Height of the centre of gravity above the keel line | m | ||
| Factor taking into account coupling of roll with other motions | - | ||
| Length of the ship | m | ||
| Non-linear roll damping moment | Nm | ||
| Effective wave slope function | - | ||
| RAO | Response amplitude operators of roll angles | - | |
| Natural roll period of the ship | s | ||
| W | Ship weight | N | |
References
- Francescutto, A. Intact Stability Criteria of Ships—Past, Present and Future. In Proceedings of the 12th International Conference on the Stability of Ships and Ocean Vehicles, Glasgow, UK, 14–19 June 2015. [Google Scholar]
- Francescutto, A.; Umeda, N. Current status of the second generation intact stability criteria—Achievements and remaining issues. In Proceedings of the 15th International Ship Stability Workshop, Stockholm, Sweden, 13–15 June 2016. [Google Scholar]
- IMO SDC 6/5. Report of the Correspondence Group (Part 1). London, UK, 1 November 2018. Submitted by Japan. Available online: http://www.imo.org/en/Pages/Default.aspx (accessed on 4 December 2019).
- Federal Bureau of Marine Casualty Investigation. Investigtation Report 510/08. Fatal Accident on Board the CMV CHICAGO EXPRESS during Typhoon “HAGUPIT” on 24 September 2008 off the Coast of Hong Kong, Hamburg, Germany, November 2009. Available online: https://www.atsb.gov.au/media/3446314/bsu%20investigation%20report%20510_08%20-%20cmv%20chicago%20express.pdf (accessed on 27 November 2019).
- Federal Bureau of Marine Casualty Investigation. Investigtation Report 391/09. Fatal Accident on Board the CMV CCNI GUAYAS during Typhoon “KOPPU” on 15 September 2009 in the Sea Area of Hong Kong (Including Analysis of Serious Marine Casualty 520/09 Pilot Injured on Board the CMV FRISIA LISSABON on 16 October 2009 West of Bokum on the Westerems), Hamburg, Germany, June 2011. Available online: https://www.atsb.gov.au/media/3474326/german%20bsu%20report%20391-09.pdf (accessed on 27 November 2019).
- IMO SLF 52/3/5. Development of New Generation Intact Stability Criteria. Proposal with Regard to the Scope of New Generation Criteria. London, UK, 18 November 2009. Submitted by Germany. Available online: http://www.imo.org/en/Pages/Default.aspx (accessed on 4 December 2019).
- IMO SDC 3/INF.10. Information Collected by the Correspondence Group on Intact Stability Regarding Second Generation Intact Stability Criteria. London, UK, 13 November 2015. Submitted by Japan. Available online: http://www.imo.org/en/Pages/Default.aspx (accessed on 4 December 2019).
- IMO SDC 4/INF.4/Add.2. Finalization of Second Generation Intact Stability Criteria. Information Collected by the Correspondence Group on Intact Stability. London, UK, 9 December 2016. Submitted by Japan. Available online: http://www.imo.org/en/Pages/Default.aspx (accessed on 4 December 2019).
- IMO SDC 4/INF.9. Finalization of Second Generation Intact Stability Criteria. Sample Ship Calculation Results. London, UK, 8 December 2016. Submitted by Denmark. Available online: http://www.imo.org/en/Pages/Default.aspx (accessed on 4 December 2019).
- IMO SDC 4/5/13. Finalization of Second Generation Intact Stability Criteria. Comments on Documents SDC 4/5/1 and SDC 4/INF.4. London, UK, 22 December 2016. Submitted by Germany. Available online: http://www.imo.org/en/Pages/Default.aspx (accessed on 4 December 2019).
- IMO SDC 6/INF.3. Information Collected by the Correspondence Group on Intact Stability. London, UK, 30 November 2018. Submitted by Japan. Available online: http://www.imo.org/en/Pages/Default.aspx (accessed on 4 December 2019).
- Tomaszek, H.; Bassler, C.C. Dynamic Stability Assessment of Naval Ships in Early-Stage Design. In Proceedings of the 12th International Conference on the Stability of Ships and Ocean Vehicles, Glasgow, UK, 14–19 June 2015. [Google Scholar]
- Grinnaert, F.; Gualeni, P.; Billard, J.; Laurens, J.; Petacco, N. Application of 2nd Generation Intact Stability Criteria on Naval Ships. In Proceedings of the 15th International Ship Stability Workshop, Stockholm, Sweden, 13–15 June 2016. [Google Scholar]
- Petacco, N.; Gualeni, P.; Billard, J.; Grinnaert, F. An integration of present navy ships intact stability criteria in the perspective of ship performance assessment in a seaway. In Proceedings of the 16th International Ship Stability Workshop, Belgrade, Serbia, 5–7 June 2017. [Google Scholar]
- Petacco, N. Second Generation Intact Stability Criteria: Analysis, Implementation and Application to significant ship tipologies. Ph.D. Thesis, Università degli Studi di Genova, Genoa, Italy, 24 May 2019. [Google Scholar]
- Kracht, A.M.; Jacobsen, A. D-Series Systematic Experiments with Models of Fast Twin-Screw Displacement Ships. Sname Trans. 1992, 100, 199–222. [Google Scholar]
- Begovic, E.; Rinauro, B.; Cakici, F. Application of the 2nd Generation Intact Stability Criteria for fast semi-displacement ships. In Proceedings of the 18th International Congress of the International Maritime Association of the Mediterranean (IMAM 2019), Varna, Bulgaria, 9–11 September 2019. [Google Scholar]
- Begovic, E.; Bertorello, C.; Boccadamo, G.; Rinauro, B. Application of surf-riding and broaching criteria for the systematic series D models. Ocean Eng. 2018, 170, 246–265. [Google Scholar] [CrossRef]
- Rinauro, B.; Begovic, E. Vulnerability assessment of surf-riding-broaching and pure loss of stability for Systematic Series D1 model. Ships Offshore Struct. 2019. [Google Scholar] [CrossRef]
- IMO SDC 4/5/1/Add.4. Report of the Correspondence Group (Part 5). London, UK, 11 November 2016. Submitted by Japan. Available online: http://www.imo.org/en/Pages/Default.aspx (accessed on 4 December 2019).
- IMO SDC 4/5/1/Add.1. Report of the Correspondence Group (Part 2). London, UK, 11 November 2016. Submitted by Japan. Available online: http://www.imo.org/en/Pages/Default.aspx (accessed on 4 December 2019).
- IMO SDC 4/5/6. Draft Consolidated Explanatory Notes for the Second Generation Intact Stability Criteria. London, UK, 10 November 2016. Submitted by the United States. Available online: http://www.imo.org/en/Pages/Default.aspx (accessed on 4 December 2019).
- Kawahara, Y.; Maekawa, K.; Ikeda, Y. A simple prediction formula of roll damping of conventional cargo ships on the basis of Ikeda’s method and its limitation. In Proceedings of the 10th International Conference on Stability of Ships and Ocean Vehicles, St. Petersburg, Russia, 22–26 June 2009. [Google Scholar]
- RINA. Rules for the Classification of Naval Ships. Part B, Hull and Stability; RINA: Genova, Italy, 2017; Available online: https://www.rina.org/it/rules-for-naval-ships (accessed on 4 December 2019).
- IMO SDC 3/INF.11. Information for criteria and explanatory notes for excessive acceleration stability failure mode. London, UK, 13 November 2015. Submitted by Germany. Available online: http://www.imo.org/en/Pages/Default.aspx (accessed on 4 December 2019).
- Schrøter, C.; Lützen, M.; Erichsen, H.; Jensen, J.J.; Kristensen, H.O.; Lauridsen, P.H.; Tunccan, O.; Baltsersen, J.P. Sample Applications of the Second Generation Intact Stability Criteria—Robustness and Consistency Analysis. In Proceedings of the 16th International Ship Stability Workshop, Belgrade, Serbia, 5–7 June 2017. [Google Scholar]
- Rudaković, S.; Bačkalov, I. On application of standard methods for roll damping assessment to inland vessels. In Proceedings of the 16th International Ship Stability Workshop, Belgrade, Serbia, 5–7 June 2017. [Google Scholar]
- Söder, C.J.; Rosén, A.; Huss, M. Ikeda revisited. J. Mar. Sci. Technol. 2017, 24, 306–316. [Google Scholar] [CrossRef]
- Begovic, E.; Day, A.H.; Incecik, A. An experimental study of hull girder loads on an intact and damaged naval ship. Ocean Eng. 2017, 133, 47–65. [Google Scholar] [CrossRef]
- Mancini, S.; Begovic, E.; Day, A.H.; Incecik, A. Verification and validation of numerical modeling of DTMB 5415 roll decay. Ocean Eng. 2018, 162, 209–223. [Google Scholar] [CrossRef]
© 2019 by the authors. Licensee MDPI, Basel, Switzerland. This article is an open access article distributed under the terms and conditions of the Creative Commons Attribution (CC BY) license (http://creativecommons.org/licenses/by/4.0/).