Article

Ocean Surface Anomalies after Strong Winds in the Western Mediterranean Sea

1
Department of Earth and Environmental Sciences, University of Milan-Bicocca, 20126 Milan, Italy
2
Université Lyon, ENS de Lyon, Université Claude Bernard, CNRS, Laboratoire de Physique, 69342 Lyon, France
*
Author to whom correspondence should be addressed.
J. Mar. Sci. Eng. 2019, 7(6), 182; https://doi.org/10.3390/jmse7060182
Submission received: 14 May 2019 / Revised: 7 June 2019 / Accepted: 9 June 2019 / Published: 11 June 2019
(This article belongs to the Section Physical Oceanography)

Abstract

:
The Western Mediterranean Sea is often subject to intense winds, especially during the winter season. Intense winds induce surface cooling associated with anomalous ocean heat loss, upwelling and diapycnal mixing. In this study we investigate the overall impact of extreme wind events on the upper ocean in the Western Mediterranean sea using sea surface temperature and sea surface height observational data products over the period 1993–2014. We show that the largest thermal anomaly is observed a couple of days after the intense wind event and that it is dependent on the wind intensity. During winter, when deep water formation occurs, it persists for over a month. During summer, when the thermocline is very shallow, the recovery time scale is typically less than 10 days. The sea surface height signal reaches a minimum in correspondence to the intense wind, and normal conditions recover in about six weeks. Unlike for intense winds in the tropics associated to the passage of tropical cyclones, no long term sea surface height anomaly is observed, indicating that the water column heat content is not significantly modified. The observed recovery times suggest instead the possibility of feedbacks on the dynamics of intense cyclones at sub-monthly time scales.

1. Introduction

Intense winds typically leave a cold wake on the surface of the ocean. The surface cooling is related to three different processes. First, air–sea fluxes of sensible and latent heat, that are typically an enthalpy loss for the ocean, monotonically increase with wind speed. Second, the action of the winds induces a surface intensified current, whose vertical shear generates instability and produces vertical mixing with the underlying water, which is typically colder than the surface water. Third, when the winds are associated with a synoptic or mesoscale cyclonic pattern in the atmosphere, the generated Ekman flow leads to horizontal divergence at the surface and upwelling of deeper and colder water. The overall net effect of the three processes is surface cooling, and their relative importance is dependent on the wind properties [1,2].
Studies on tropical regions have investigated the cold wake left at the ocean surface by tropical cyclones [2], revealing that the amplitude of the cold surface anomaly depends on the intensity of the winds, on the translational speed of the atmospheric pattern causing them, and crucially on the stratification properties of the upper ocean [2,3]. Furthermore, the sea surface temperature recovery time scale has been estimated on the scale of a couple of weeks [2,4,5], as an effect of anomalous air–sea fluxes and mixed layer baroclinic instabilities associated with the front induced by the localized mixing [6,7]. While the surface signature disappears within a few weeks, the subsurface warming associated with the wind intensified vertical mixing survives for a much longer time, resulting in a long term warming effect of tropical cyclones on the water column [8,9,10,11].
The net long-term warming of the water column due to the action of the intense winds can affect ocean heat transport and impact processes that depend on ocean heat content [11]. Studies of these mechanisms have been limited so far to the tropical regions, while little attention has been given to extra-tropical environments. The aim of this work is to perform the same type of analysis in the Mediterranean Sea. This type of processes could be of special interest in this region, where quasi-tropical cyclones known as Medicanes can occur and are attracting growing interest in recent years (e.g., [12,13,14,15] and references therein).
The strongest winds in the Mediterranean region occur in its Western basin. This is a very peculiar region, as it is one of the few places in the world where deep water formation occurs, in particular in the Gulf of Lions at the end of the winter seasons, as documented for the first time by the MEDOC experiment [16]. Deep water formation affects the thermal properties of the water column. Consequently, the stratification of the Western Mediterranean shows a strong seasonal variability. The Mediterranean mixed layer depth (MLD) seasonal variability is characterized by a basin scale deepening from November to February-March and an abrupt restratification in April, which is maintained throughout the summer and early autumn [17,18].
Deep water formation is an intermittent process with a large interannual variability [19], and is closely related to the presence of intense winds in the region. Particularly intense dry winds acting above the doming isopycnals generated by the cyclonic circulation present in the Gulf of Lyons allow for the erosion of the upper ocean stratification related to the intrusion of warm and salty Levantine Intermediate Water [16,20] (although very recent results somewhat moderate the direct role of the wind on deep water formation [21,22]). The mechanisms of deep water formation are not the subject of this work. However, the peculiar stratification properties of the region due to the presence of deep convection and thus of weak stratification in winter makes it an interesting area where to study the impact of intense wind events on the thermodynamical properties of the upper ocean.
In this paper we exploit high resolution gridded observational datasets over the period 1993–2014 for surface winds (CCMP, http://www.remss.com/measurements/ccmp), sea surface temperature (OISST, https://www.ncdc.noaa.gov/oisst) and sea surface height (CMEMS, http://marine.copernicus.eu/), in order to perform a systematic statistical analysis of the response of the state of the upper ocean to the occurrence of particularly strong winds. While in situ measurements and numerical model analysis allow to better study and disentangle the contributions coming from the different physical processes occurring in response to the intense wind events, gridded products like the ones we use in this paper are better suited to perform a statistical and climatological analysis.
The paper is structured as follows. In Section 2 we present the observational datasets and the statistical methods we have employed. In Section 3 we describe the short term (few weeks) behaviour of sea surface temperature and sea surface height anomalies just after the occurrence of the intense wind events, and the persistence (or lack of) on seasonal scale of the signature that strong winds generate on the upper ocean. The analysis is performed separately for the winter and summer seasons, where different stratification properties lead to different responses. In Section 4 we draw our conclusions and discuss the implications of our findings.

2. Materials and Methods

2.1. Data

Daily sea surface temperature data for the period 1981 to November 2016 are obtained from the NOAA daily Optimum Interpolation Sea Surface Temperature dataset (OISST, https://www.ncdc.noaa.gov/oisst), an analysis combining observations from different platforms (satellites, ships, buoys) interpolated on a regular global grid at 0.25 resolution [23]. The methodology includes bias adjustment of satellite and ship observations (referenced to buoys) to compensate for platform differences and sensor biases. The version of OISST we consider uses as relevant satellite SST sensor the Advanced Very High Resolution Radiometer (AVHRR), which, as an infrared instrument, can make observations at relatively high resolution but cannot see through clouds.
Daily mean sea height anomalies over the Mediterranean with a spatial resolution of 0.125 for the period 1993–2016 were obtained from the Copernicus Marine and Environment Monitoring Service (CMEMS, http://marine.copernicus.eu/). They are produced from the SL-TAC multi-mission altimeter data processing system. Optimal Interpolation is applied to all altimeter fields in order to obtain gridded sea level anomalies merging all the satellites data.
Sea surface wind data are taken from the V2.0 Cross-Calibrated Multi-Platform (CCMP, http://www.remss.com/measurements/ccmp) gridded surface vector winds product [24,25]. The V2.0 CCMP processing merges Remote Sensing System (RSS) radiometer wind speeds (SSM/I, SSMIS, AMSR, TMI, WindSat and GMI), QuikSCAT and ASCAT scatterometer wind vectors, moored buoy wind data, and ERA-Interim model wind fields using a Variational Analysis Method (VAM, [26]) to produce 6 hourly maps of 0.25° degree gridded vector winds. VAM combines RSS instrument data with moored buoy measurements and a starting estimate of the wind field, provided by the ERA-Interim reanalysis winds. All wind observations (satellite and buoy) and model analysis fields are referenced to a height of 10 m.
We have remapped the sea surface height data on the coarser 0.25° grid of the winds by bilinear interpolation. The wind data have a time resolution of 6 h, while sea surface temperature and height are provided daily. The wind dataset extends from July 1987 to July 2015, the sea surface temperature dataset from 1981 to November 2016, and the sea surface height dataset from January 1993 to December 2017. We have therefore limited the analysis to the overlapping period 1993–2014. Despite the relatively high resolution, the data used in this study can miss some small scale processes. Wind data may misrepresent small scale structures like Medicanes and miss thunderstorms. Sea surface temperature and sea surface height data miss mesoscale processes at scales of 1–20 Km that are important in the upper ocean dynamics [27,28,29]. However, we stress that the data we have used have the highest horizontal resolution among the gridded homogeneous obervational datasets currently available.
The average wind intensity over the Mediterranean region computed from the CCMP dataset shows a strong non-stationarity across the 1993–2014 period. The average kinetic energy of the winds increases by a 20% factor during this time period. This is likely to be a bias of the dataset, caused by inhomogeneities in the assimilation procedure used to merge the ERA-Interim first guess with observations (Ross Hoffman, personal communication). Due to the non stationary number of observational data, observations tend to weight more in the estimate towards the end of the time period, while in the first part the ERA-Interim background field dominates the average. Since ERA-Interim has a coarse spatial resolution, it tends to underestimate wind intensity extremes with respect to observations. More intense wind events are thus observed in the second half of the time period rather than in the first half. Using the CCMP dataset to study climatic trends at global and regional scale [30], at least in the Mediterranean area, is therefore questionable. This issue is of relatively little concern for our analysis though, as we are not interested in the temporal changes of the statistics of wind intensity. Having artificially weaker extreme winds in the first period of the dataset leads to miss events happening at earlier times, hence to have a poorer statistics overall, but does not affect our results otherwise. See Appendix A for a more in depth discussion on this issue.

2.2. Methods

2.2.1. Intense Wind Events Characterization

The intensity and frequency of winds in the Mediterranean region has a strong seasonal dependence. Strongest winds typically occur during the winter months, when the region is subject to the extratropical storms typical of the mid latitudes: About 90% of the events within the local upper fifth percentile in terms of wind intensity occur between November and March [31], and very few occur during the summer months from June to August [31]. This aspect, together with the fact that the upper ocean conditions have a strong seasonal cycle which can lead to different ocean responses to intense winds in different seasons, is at the basis of the separation of the analysis into two seasons: a winter season, here including the 5 months period from November to March, and a summer season from June to August.
From the CCMP dataset we consider the instantaneous 6-hourly surface wind velocity vector u ( ϕ , λ , t 6 ) at latitude ϕ , longitude λ and time t 6 . Figure 1 shows u 95 ( ϕ , λ ) , the 95th percentile of the local winter wind intensity u ( ϕ , λ , t 6 ) = u ( ϕ , λ , t 6 ) . Locations with larger values of u 95 feature more intense and more frequent intense wind events. Maximum values are found in the area of the Gulf of Lions in the Western Mediterranean, with secondary maxima present in the Eastern Mediterranean. We limit the analysis to the area characterized by u 95 > 15 ms 1 (solid black line in Figure 1), where winds intense enough to induce a significant signal on the upper ocean state are relatively frequent. In this paper, we refer to this region as the Gulf of Lions, although it encompasses both the Gulf of Lions shelf (depth < 200 m) and the neighboring sea (where the depth can exceed 2000 m). Changing the area by changing the threshold to u 95 > 14 ms 1 (dashed black line in Figure 1) alters our results only very slightly from the quantitative point of view, and does not change them qualitatively, nor changes their statistical significance. In general we do not expect the results to change as long as the considered area remains in the Western Mediterranean. Strong winds in the Eastern Mediterranean are due to distinctively different circulation patterns [32], and may yield to different results.
The area considered coincides with the area of deep water formation in the Western Mediterranean [17,18,33], where deep convection is in large part triggered exactly by the strong atmospheric forcing due to the presence of intense winds in the winter season [17]. Strong winds generate cooling and mixing that at the beginning of the winter erode the stratification, reducing the buoyancy of the subsurface warm and salty Levantine Intermediate Water. Underneath, a weakly stratified Western Mediterranean Deep Water favors deep convection that at the end of the winter period can reach the bottom. The peculiar stratification properties will give very different responses in winter or summer. We stress, however, that here we are not interested in the process of deep water formation per se.
The Gulf of Lions has a scale size of less than 500 km, and it is thus expected that spatial correlations (both in the atmospheric forcing and in the ocean conditions) are present. To avoid computing statistics out of strongly correlated data, we define an intense wind event as the occurrence u ( ϕ , λ , t 6 ) > a , with a a threshold varied between 16 ms 1 and 20 ms 1 , for a temporal coordinate ( t 6 ) and for at least one couple of spatial coordinates ( ϕ , λ ) within the region inside the closed solid line in Figure 1. Furthermore, the wind dataset has a time resolution of 6 h, while sea surface temperature and sea surface height have a time resolution of 1 day. For this reason, we define an intense wind day a day in which there is at least one intense wind event, as previously defined. Each intense wind day is assigned to the winter or summer dataset depending on its date of occurrence, t i , with i = 1 , . . , N , and with N = N w , N s the total number of intense wind days in the winter and summer datasets, respectively.

2.2.2. Composite Analysis of Ocean Signature of Intense Wind Events

We study the impact of the intense wind days on the state of the upper ocean by means of a composite analysis. In the composite averages we mix values of the observable from different years and different calendar days, which are statistically not equivalent due to long term variations and seasonal cycle. Therefore, we remove from the sea surface temperature and the sea surface height locally at each point ( ϕ , λ ) the long term linear trend and the seasonal cycle. We refer to the detrended and deseasoned sea surface temperature anomaly and sea surface height anomaly as SSTA and SSHA respectively.
Let us consider a generic surface observable O ( ϕ , λ , t ) , in the following either SSTA or SSHA, with t at daily resolution. We compute its average over the area of the Gulf of Lions Ω
O ¯ ( t ) = 1 Ω Ω O ( ϕ , λ , t ) d Ω .
and then consider its time evolution before and after the day of occurrence of an intense wind event, at a time lag τ . We define the average composite evolution of the area averaged observable at a time lag τ from the intense wind day as
O ¯ w , s τ = 1 N w , s Ω i = 1 N w , s Ω O ( ϕ , λ , t i + τ ) d Ω .
where the subscript w , s refers to the winter or summer occurrence of the event considered. The composite evolution for sea surface temperature and sea surface height anomalies have been computed for values of τ ranging from 90 days to + 180 days. Note that with this definition of the events, days when local intense wind events occur in one hundred grid points weight in the sum as much as days when local intense wind events occur in ten grid points.
The error on the estimates given by Equation (2) is computed as the standard deviation related to the sum involved in the formulas, divided by the square root of N w , s , the number of days in the considered region when at least one intense wind event has been recorded.

3. Results

3.1. Intense Winds Record

Strong winds in the study region preferentially come from the North West direction (Mistral), both in winter and during summer (see the wind roses in Figure 2). During winter, a small fraction of events are north easterly winds. Despite the fact that the orientation of wind vectors might influence the oceanic response, especially near the coast, the limited number of events other than Mistral does not allow us to perform an analysis conditioned to the different wind directions.
The number of local episodes of intense winds in the winter period (November through March), decreases from about 140,000 for the lowest value of the threshold, a = 16 ms 1 , to less than 28,000 for the largest value, a = 20 ms 1 . Correspondingly, the number of days featuring at least one intense event N w decreases from 990 to 342. Values of N w of a few hundreds allow for a robust statistical analysis. During one day, the fraction of area on average occupied by winds locally above the threshold decreases from about 78% for the lowest threshold to about 44% for the threshold at 20 ms 1 . The average number of days per year featuring intense winds similarly decreases from about 45 to about 15 over the winter months. These events are thus relatively common for this area; however, they are extremely rare when considering the entire Western Mediterranean basin.
During summer (June through August) the intense winds events are significantly rarer. In the considered area the number of local intense winds goes from about 8200 for a = 16 m s 1 , to just 176 for a = 20 ms 1 . These values correspond to 122 and 11 days featuring at least one intense event. Therefore, statistical robustness is expected only for low values of the threshold. The area covered on average by intense winds every day recorded as intense wind day is also substantially smaller, dropping form 38% for a = 16 ms 1 to just 9% for a = 20 ms 1 . The average number of intense wind days per year similarly drops from about 6 to about 0.5.

3.2. Composite Analysis in Winter

The composite average of the time evolution of winter SSTA before and after the occurrence of intense wind events, computed for a few different thresholds is shown in Figure 3a. The area averaged sea surface temperature anomaly drops by O ( 10 1 ) K, reaching a minimum a few days after the occurrence of the intense wind. Note that the drop actually starts slightly before the occurrence of the intense wind event. This shift might be due to the fact that sea surface temperature are provided daily in the OISST dataset, but they have been obtained by performing a bias adjustment using a spatially smoothed 7-day in situ sea surface temperature average, which might anticipate the temporal signal [34]. Additionally, weather conditions favoring surface cooling are probably present in the days preceding the individual days with intense winds as those are usually embedded in a synoptic scale perturbation, and during wintertime winds have a temporal correlation of about a week (not shown).
The cooling in correspondence of the anomalous winds can be in principle related to three mechanisms: the enhanced enthalpy fluxes associated with intense winds, the mixing of the upper ocean generated by vertical shear instabilities of horizontal currents induced by the winds at the surface, and the Ekman upwelling induced by the cyclonic winds. Disentangling the contribution of the three different processes can not be done with the data used in this paper. In situ measurements and/or numerical models could be used to investigate this aspect. However, each of those processes is dependent on the intensity of the winds, with stronger winds generating a larger cooling. Their overall effect is clearly shown in Figure 3a, with a minimum of about −0.2 K for winds stronger than 16 m/s and a minimum of about −0.3 K for winds stronger than 20 m/s.
The values of the sea surface temperature anomalies are very small, consistent with the fact that the deep water formation region in the Gulf of Lions is usually very weakly stratified during the winter season. Strong winds bring up deep water, but this is only marginally colder than the water above [35]. Similarly, enhanced enthalpy fluxes associated with intense winds have a minimal impact on the sea surface temperature reduction when the loss is shared among the whole water column and not limited to a surface layer.
After reaching a minimum a few days after the occurrence of the strong wind, SSTA slowly returns to zero. Two time scales seem to be involved. A first roughly exponential recovery is followed by a series of oscillations. SSTA returns to a statistically stable state after about 100–120 days. The relaxation time scale of the first recovery is about 40 days, computed by fitting with an exponential the SSTA composite average in the first 60 days after the maximum of the drop, and does not depend on the value of the threshold. The first recovery period lasts for about 60 days, at the end of which the system has not yet properly reached a state that is zero compatibly with the error bars. A subsequent oscillation on a period of about 20 days follows, even if the extremely noisy nature of the signal makes it difficult to interpret its behavior after the first 60 days.
The composite averaged winter SSHA from 90 days before the event to 180 days after is shown in Figure 3b. The SSHA signal is less noisy on short time scales of one or few days with respect to the SSTA signal. This is likely due to the fact that SSHA is a vertically integrated measure which depends on the thermal properties of the entire water column, and it is thus less sensitive to the fast fluctuations of the surface fluxes due to weather activity. Beside that, the general behavior of the SSHA signal qualitatively resembles that of the SSTA signal, with some notable differences. Composite SSHA starts decreasing well before, 10 to 15 days, the occurrence of the strong wind event, much earlier than the SSTA signal. This is likely not related to the passage of the atmospheric dynamical structure itself, and it is unlikely that it is due to some interpolation procedure in the creation of the dataset. The same feature has been observed in a similar analysis of the effect on SSHA of the passage of hurricanes in the Tropics (Supplementary Information in [11]), but to our knowledge no explanation has been given yet.
In general, sea surface height is influenced by both dynamical and thermodynamical processes related to the occurrence of the strong wind. The inverse barometer effect associated with the low pressure system that typically embeds these events can be responsible for a small increase in the sea level. Ekman divergence and upwelling characteristic of the cyclonic wind circulation causes a drop in sea surface height. Heat loss at the air–sea interface further reduces sea surface height because of thermal contraction of the water column. It is unclear at present what is the magnitude of each of these mechanisms. As an aggregated effect, the SSHA signal shows a sensitivity to the intensity of the wind, with an area averaged drop peaking at −12 mm for winds stronger than 16 m/s and at −17 mm for winds stronger than 20 m/s. The minimum SSHA is reached exactly at the occurrence of the intense wind events, while for SSTA it was a few days later. Clearly this difference might be in part due do the interpolation procedure to obtain spatially and temporally uniform fields, but the physical mechanism at the base of the signal can also be relevant: sea surface height responds to enthalpy fluxes and Ekman pumping, which impact the sea level on short timescales, while the signal in SSTA requires mixing that develops by shear instabilities and convection, which require time to develop.
Winter SSHA shows a similar initial recovery period as SSTA: it increases for the first 60 days, and is significantly different from zero, according to the uncertainty estimate, at least for the first 40 days. Thanks to the fact that the SSHA is less noisy than SSTA, it is more clear the appearance of an oscillation on a period of about 20 days, whose nature remains unclear, but whose presence appears ubiquitous in our composite analysis.

3.3. Composite Analysis in Summer

For completeness, we report in Figure 4a,b also the results of the analysis relative to the summer months (June through August). In general the signal is noisier than for the winter case due to the limited number of events.
It is clear that the maximum sea surface temperature anomaly is one order of magnitude larger than for winter events, reaching values of about 2.5 K for the strongest winds (note the different scale in the temperature axis). Clearly, the strong stratification typical of summer months [17] is responsible for the large drop in sea surface temperature as the shallow strong stratification favors the upwelling of water several degrees colder than the surface water. The initial recovery time scale is about ten days, much shorter than during winter, probably because the large short wave radiation input quickly restratifies the water column, but possibly also due to the stronger SST gradients that generate a more intense baroclinic response with the production of mixed layer eddies that contribute to the restratification process [6,7]. It remains to be determined whether a warm anomaly survives below the surface for longer times, as it happens for tropical cyclones.
Note that the decay time in summer seems to be faster and larger for strong winds (Figure 4a). This might be related to the fact that the larger fronts generated by more intense winds might lead to a faster restratification, as discussed before, but it should also be noticed that in summer the statistics of the strongest events is limited. Consequently, error bars for the red curve in Figure 4a are quite large. If we compare the width of the error bars of the red curve with the distance between the curves in the decay phase, we can see that the differences are within the statistical errors. It is therefore possible that the faster decay for stronger winds in Figure 4a is accidental.
During the summer season, no significant SSHA is detected, due to the large fluctuations associated to the low number of events occurring during this season (see Figure 3b). It might also be that the signal is smaller during summer than winter because events are not associated to synoptic scale cyclones and the Ekman divergence is smaller.

4. Discussion

We have performed a composite analysis of the impact of intense wind events on the state of the upper ocean in the Western Mediterranean area from 1993 to 2014, using publicly available high resolution observational datasets for wind, sea surface temperature and sea surface height. In this region the vast majority of intense wind events occur in winter in the Gulf of Lions, where deep water formation occurs [17,18,33]. While deep water formation is linked to the presence of strong winds, in this paper we have not focused on the mechanisms responsible for the deep water formation, but rather we have studied the transient response of the upper ocean to the individual wind events.
Strong winds at the surface induce mixing of the upper ocean water, which results in a drop of sea surface temperature in the days immediately following the events. During winter time, the maximum drop is only of the order of 0.1° K, as the water column is well mixed, while during summer time the drop is one order of magnitude larger due to the strong stratification and the shallow mixed layer. More intense winds in general induce deeper mixing, and therefore bring up to the surface deeper, usually colder, water. The sea surface temperature anomaly drop in fact increases with the threshold set to select the intense wind events. The sea surface temperature anomaly goes back to zero after about 40–60 days. This recovery time, estimated with an exponential fit, does not significantly depend on the wind intensity.
We have also analyzed sea surface height. The response of sea surface height anomalies is characterized by a drop of a few cm, caused by divergent Ekman flow induced by the cyclonic wind stress during the passage of the storm and also to the evaporative enthalpy loss [11]. The signal is particularly evident during winter, when the cyclonic nature of the synoptic scale perturbation in which the strong winds are embedded is responsible for a large Ekman divergence. The amplitude of the SSHA depends on the wind intensity. The recovery time is consistent with what found for sea surface temperature anomalies, and does not depend on the wind intensity. Unlike for the tropics, where intense winds associated with tropical cyclones are responsible for long term warming of the upper ocean, no long term SSHA signal is observed. This is probably related to the very different stratification of the water column: In the tropics a warm mixed layer is present at the surface and intense winds mix water at the thermocline, bringing warm water down which, after the upper layer returns to normal conditions, is responsible for a net increase of the water column heat content [2]. In the Gulf of Lyons, on the other hand, the very weak winter stratification prevents the burial of heat in the lower layers as the mixing water is nearly homogeneous in temperature. Thus the SSHA returns to zero after a few weeks.
The impact of the strong winds during a storm on the state of the upper ocean can lead to memory effects influencing the coupled atmosphere-ocean system at different time scales. In the Tropics, this extends to seasonal time scales: it has been shown that hurricanes on the long term pump heat into the ocean leading to a warming detectable 4–6 months after the event [8,9,10,11]. Our results show that in the Western Mediterranean this process is not at play.
The results indicate that the signature of intense wind events on the state of the upper ocean in the region persists for several weeks. The decorrelation time for winds in the region is of 2–3 days, and the time interval between events in wintertime is typically of a few days. The recovery process is longer than this interval. However, we should consider that the anomalies are calculated with respect to the climatological conditions, that already account for the effects of the typical winter winds. Therefore, the anomalies reveal the occurrence of anomalous conditions which induce a recognisable signature on the upper ocean. The subsequent evolution of the anomalies has large fluctuations because of the correlations that exist in the dataset, but the estimate of the general decay time scale is probably reliable.
The impact of intense wind events in the region has the potential to influence air–sea processes on different time scales. For example, it has been shown in a modeling case study [36] that a strong wind event can influence weather on a time scale of a week through the signature on the sea surface temperature and its consequent impact on the air–sea fluxes. Similarly, air–sea coupling on sub-monthly time scale has been found to be important in the modulation of heavy precipitation events in this and other regions of the Mediterranean in a climatic modeling study [37]. Our results indicate that surface thermal anomalies persist for at least 30 days, which confirms thus the potential of sub-monthly to monthtly scale feedbacks.
While the gridded observational datsets we have used in this work allow for a systematic statistical analysis of the impact of strong winds on the upper ocean in the Western Mediterranean, the nature of these data does not allow to disentangle the contribution of the different physical processes at play. In situ measurements and/or numerical models could be used to complement this statistical analysis in future works. Finally, it would be interesting to further characterize the upper ocean response to intense winds in terms of the salinity. This will become possible in the future, when satellite missions will have collected several years of sea surface salinity data.

Author Contributions

Conceptualization, C.P. and F.R.; methodology, C.P. and F.R.; investigation, F.R., C.P., A.M. and A.N.; data curation, F.R.; writing—original draft preparation, F.R. and C.P.; writing—review and editing, F.R. and C.P.; supervision, C.P.

Funding

This article is an outcome of Project “MIUR Dipartimenti di Eccellenza 2018–2022”. CP acknowledges support from the Flagship Project RITMARE funded by the Italian Ministry of Education, University and Research.

Conflicts of Interest

The authors declare no conflict of interest. The funders had no role in the design of the study; in the collection, analyses, or interpretation of data; in the writing of the manuscript, or in the decision to publish the results.

Appendix A. Spurious Trends in CCMP Wind Data in the Mediterranean Region
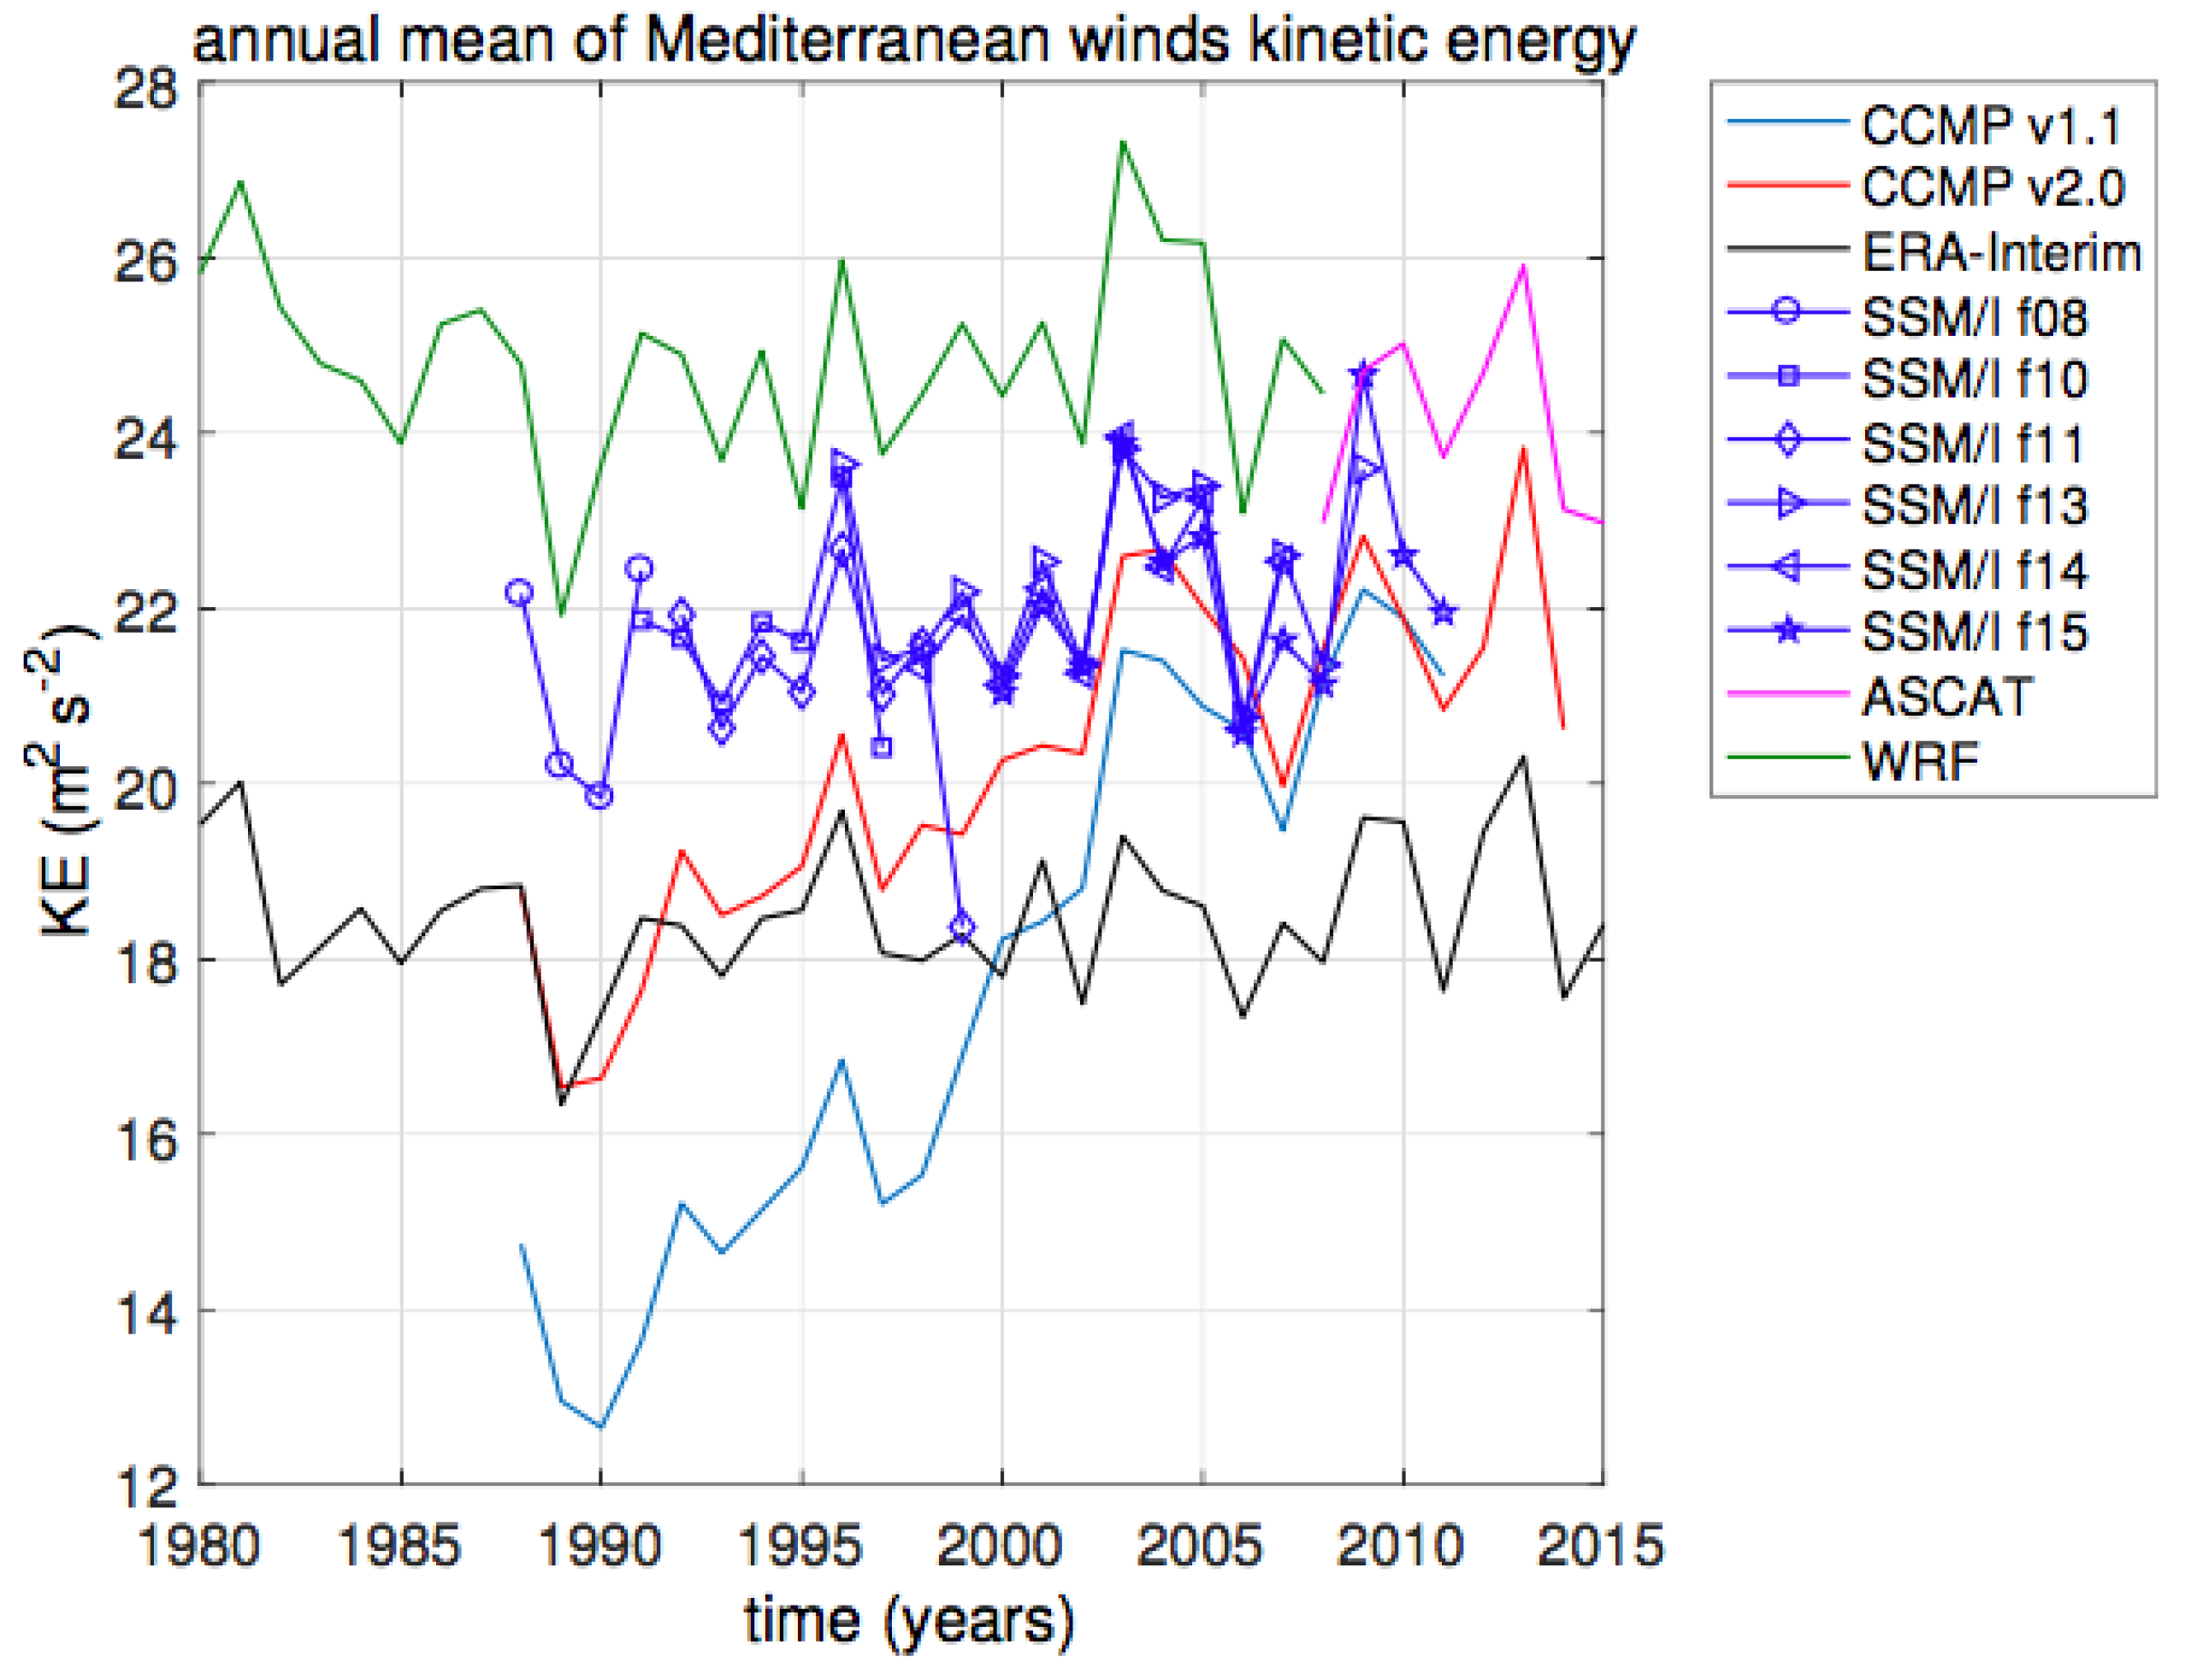
The statistical properties of wind intensity over the Mediterranean region in the CCMP dataset show a strong non-stationarity during the period we have analyzed. In particular, the average kinetic energy of the winds over the basin increases by a 20% factor, from about 18 m 2 s 2 to about 22 m 2 s 2 (red line of Figure A1). In the previous version of the CCMP product (version 1.1, light blue) the trend is even stronger, as the estimate at later times is close to the estimate of the new product, while they differ at the beginning of the time period. However, such signal appears not to be present in other observational dataset that are part of the assimilation process of the CCMP product.
We have considered the same annual average of KE in the ERA-Interim reanalysis (which is used as first guess or background field for the CCMP estimate), in the SSM/I radiometer data (http://www.remss.com/missions/ssmi/) and in the ASCAT scatterometer data (http://www.remss.com/missions/ascat/). Additionally, we have compared these results with a 30 years long run of the atmospheric regional model WRF in non-hydrostatic setup, at 4 Km horizontal resolution, forced with ERA-Interim data [38].
Average KE appears to be stationary in ERA-Interim (black) with values very similar to the CCMP estimate at the beginning of the time period. No significant trends are present in the SSM/I radiometer data (blue) and ASCAT scatterometer data (magenta), both of which feature larger values than ERA-Interim, closer to the CCMP estimate towards the end of the time period. Note that there is no trend also in a 30 years long run with the high-resolution atmospheric regional model WRF (green) forced with ERA-Interim data. The WRF estimate features the largest values of the group, close to the ASCAT estimate.
Figure A1. Annual mean of specific kinetic energy of surface winds averaged over the Mediterranean basin, from different sources. We compare results from the CCMP v1.1 (light blue) and v2.0 (red) products against ERA-Interim (black) data, radiometer (blue, for different instrument each covering a different time period) and scatterometer (magenta) data. We present also the results obtained by a high resolution 30 years long run with WRF in non-hydrostatic setup and forced by ERA-Interim data (green).
Jmse 07 00182 g0a1
Summarizing, the CCMP estimate is almost identical to the low values of the ERA-Interim first guess at the beginning of the time period, and then increases to larger values typical of the observational datasets or high-resolution numerical results by the end of the time period. This is an artificial behavior, caused by the increase in the number of satellite observations and the relative offset in mean speed between the satellite observations and ECMWF (Ross Hoffman, personal communication). As a result, the reanalysis background field weights more on average at the beginning of the assimilated period, while observations gradually become more important at later times. The background field given by the reanalysis has a relatively coarse spatial resolution of about 80 Km, while observational data have a resolution of about 25 Km and the WRF run of about 4 Km. Therefore, the background field underestimates the largest values of the the wind speed u , which, being KE a quadratic function of u , leads to a severe underestimate of KE. This ultimately leads in the CCMP product to a lower estimate of KE at earlier times, when the contribution of the background field is dominant.
The presence of this spurious trend makes questionable to use the CCMP dataset for studying global and regional trends, at least in the Mediterranean region, despite having be used sometimes for this purpose in the recent past [30]. For our study however this is not a serious issue, as we are not interested in the statistics of wind speed per se. The underestimate of strong winds at earlier times results in our case simply in missing intense wind events in the first part of the dataset (indeed we observe that about two thirds of intense wind events are found the second half of the considered period). Since we study the response of the state of the upper ocean to intense wind events, and since we can safely assume that the nature of this interaction has not changed with time, we only have a problem of loss of statistics rather than of biasing.

References

  1. Price, J.F. Upper ocean response to a hurricane. J. Phys. Oceanogr. 1981, 11, 153–175. [Google Scholar] [CrossRef]
  2. Mei, W.; Pasquero, C. Spatial and temporal characterization of sea surface temperature response to tropical cyclones. J. Clim. 2013, 26, 3745–3765. [Google Scholar] [CrossRef]
  3. Mei, W.; Pasquero, C.; Primeau, F. The effect of translation speed upon the intensity of tropical cyclones over the tropical ocean. Geophys. Res. Lett. 2012, 39, L07801. [Google Scholar] [CrossRef]
  4. Sanford, T.B.; Price, J.F.; Girton, J.B.; Webb, D.C. Highly resolved observations and simulations of the ocean response to a hurricane. Geophys. Res. Lett. 2007, 34, L13604. [Google Scholar] [CrossRef]
  5. Price, J.F.; Morzel, J.; Niiler, P.P. Warming of SST in the cool wake of a moving hurricane. J. Geophys. Res. Ocean. 2008, 113, C07010. [Google Scholar] [CrossRef]
  6. Boccaletti, G.; Ferrari, R.; Fox-Kemper, B. Mixed layer instabilities and restratification. J. Phys. Oceanogr. 2007, 37, 2228–2250. [Google Scholar] [CrossRef]
  7. Mei, W.; Pasquero, C. Restratification of the upper ocean after the passage of a tropical cyclone: A numerical study. J. Phys. Oceanogr. 2012, 42, 1377–1401. [Google Scholar] [CrossRef]
  8. Emanuel, K. Contribution of tropical cyclones to meridional heat transport by the oceans. J. Geophys. Res. Atmos. 2001, 106, 14771–14781. [Google Scholar] [CrossRef]
  9. Sriver, R.L.; Huber, M. Modeled sensitivity of upper thermocline properties to tropical cyclone winds and possible feedbacks on the Hadley circulation. Geophys. Res. Lett. 2010, 37, L08704. [Google Scholar] [CrossRef]
  10. Jansen, M.F.; Ferrari, R.; Mooring, T.A. Seasonal versus permanent thermocline warming by tropical cyclones. Geophys. Res. Lett. 2010, 37, L03602. [Google Scholar] [CrossRef]
  11. Mei, W.; Primeau, F.; McWilliams, J.C.; Pasquero, C. Sea surface height evidence for long-term warming effects of tropical cyclones on the ocean. Proc. Natl. Acad. Sci. USA 2013, 110, 15207–15210. [Google Scholar] [CrossRef] [PubMed] [Green Version]
  12. Emanuel, K. Genesis and maintenance of Mediterranean hurricanes. Adv. Geosci. 2005, 2, 217–220. [Google Scholar] [CrossRef]
  13. Cavicchia, L.; von Storch, H.; Gualdi, S. Mediterranean Tropical-Like Cyclones in Present and Future Climate. J. Clim 2014, 27, 7493–7501. [Google Scholar] [CrossRef] [Green Version]
  14. Ragone, F.; Mariotti, M.; Parodi, A.; Von Hardenberg, J.; Pasquero, C. A Climatological Study of Western Mediterranean Medicanes in Numerical Simulations with Explicit and Parameterized Convection. Atmosphere 2018, 9, 397. [Google Scholar] [CrossRef]
  15. Gonzalez-Aleman, J.J.; Pascale, S.; Gutierrez-Fernandez, J.; Murakami, H.; Gaertner, M.A.; Vecchi, G.A. Potential Increase in Hazard From Mediterranean Hurricane Activity With Global Warming. Geophys. Res. Lett. 2019, 46, 1754–1764. [Google Scholar] [CrossRef]
  16. MEDOC GROUP. Observation of formation of deep water in the Mediterranean sea, 1969. Nature 1970, 227, 1037–1040. [Google Scholar] [CrossRef]
  17. D’Ortenzio, F.; Iudicone, D.; de Boyer Montegut, C.; Testor, P.; Antoine, D.; Marullo, S.; Santoleri, R.; Madec, G. Seasonal variability of the mixed layer depth in the Mediterranean Sea as derived from in situ profiles. Geophys. Res. Lett. 2005, 32, L12605. [Google Scholar] [CrossRef]
  18. Houpert, L.; Testor, P.; de Madron, X.D.; Somot, S.; D’Ortenzio, F.; Estournel, C.; Lavigne, H. Seasonal cycle of the mixed layer, the seasonal thermocline and the upper-ocean heat storage in the Mediterranean Sea derived from observations. Prog. Oceanogr. 2014, 132, 333–352. [Google Scholar] [CrossRef]
  19. Somot, S.; Houpert, L.; Sevault, F.; Testor, P.; Bosse, A.; Taupier-Letage, I.; Bouin, M.N.; Waldman, R.; Cassou, C.; Sanchez-Gomez, E.; et al. Characterizing, modelling and un- derstanding the climate variability of the deep water formation in the North-Western Mediterranean Sea. Clim. Dyn. 2018, 51. [Google Scholar] [CrossRef]
  20. Schott, F.; Visbeck, M.; Send, U. Open ocean deep convection, Mediterranean and Greenland Seas. In Ocean Processes in Climate Dynamics; Malanotte-Rizzoli, P., Robinson, A., Eds.; Kluwer Acad.: Norwell, MA, USA, 1994; pp. 203–225. [Google Scholar]
  21. Giordani, H.; Lebeaupin-Brossier, C.; Leíge, F.; Caniaux, G. A PV-approach for dense water formation along fronts: Application to the Northwestern Mediterranean. Geophys. Res. Lett. 2017, 122, 995–1015. [Google Scholar] [CrossRef]
  22. Waldman, R.; Brüggeman, N.; Bosse, A.; Spall, M.; Somot, S.; Sevault, F. Overturning the Mediterranean thermohaline circulation. Geophys. Res. Lett. 2018, 45, 8407–8415. [Google Scholar] [CrossRef]
  23. Banzon, V.; Smith, T.M.; Chin, T.M.; Liu, C.; Hankins, W. A long-term record of blended satellite and in situ sea-surface temperature for climate monitoring, modeling and environmental studies. Earth Syst. Sci. Data 2016, 8, 165–176. [Google Scholar] [CrossRef] [Green Version]
  24. Atlas, R.; Hoffman, R.N.; Ardizzone, J.; Leidner, S.M.; Jusem, J.C.; Smith, D.K.; Gombos, D. A cross-calibrated, multiplatform ocean surface wind velocity product for meteorological and oceanographic applications. Bull. Am. Meteorol. Soc. 2011, 92, 157–174. [Google Scholar] [CrossRef]
  25. Wentz, F.; Scott, J.; Hoffman, R.; Leidner, M.; Atlas, R.; Ardizzone, J. Remote Sensing Systems Cross-Calibrated Multi-Platform (CCMP) 6-Hourly Ocean Vector Wind Analysis Product on 0.25 deg Grid, Version 2.0. 2015. Available online: http://www.remss.com/measurements/ccmp (accessed on 10 June 2019).
  26. Hoffman, R.N.; Leidner, S.M.; Henderson, J.M.; Atlas, R.; Ardizzone, J.V.; Bloom, S.C. A Two-Dimensional Variational Analysis Method for NSCAT Ambiguity Removal: Methodology, Sensitivity, and Tuning. J. Atmos. Ocean. Technol. 2003, 20, 585–605. [Google Scholar] [CrossRef]
  27. Herrmann, M.; Bouffard, J.; Beranger, K. Monitoring open-ocean deep convection from space. Geophys. Res. Lett. 2009, 36. [Google Scholar] [CrossRef] [Green Version]
  28. Herrmann, M.; Auger, P.A.; Ulses, C.; Estournel, C. Long-term monitoring of ocean deep convection using multisensors altimetry and ocean color satellite data. J. Geophys. Res. Ocean. 2017, 122, 1457–1475. [Google Scholar] [CrossRef]
  29. Amores, A.; Jordá, G.; Arsouze, T.; Le Sommer, J. Up to what extent can we characterize ocean eddies using present?day gridded altimetric products? J. Geophys. Res. Ocean. 2018, 123, 7220–7236. [Google Scholar] [CrossRef]
  30. Zheng, C.W.; Pan, J.; Li, C.Y. Global oceanic wind speed trends. Ocean Coast. Manag. 2016, 129, 15–24. [Google Scholar] [CrossRef]
  31. Sempreviva, A.M.; Schiano, M.E.; Pensieri, S.; Semedo, A.; Tome, R.; Bozzano, R.; Borghini, M.; Grasso, F.; Soerensen, L.; Teixeira, J.; et al. Observed development of the vertical structure of the marine boundary layer during the LASIE experiment in the Ligurian Sea. Ann. Geophys. 2010, 28, 17–25. [Google Scholar] [CrossRef] [Green Version]
  32. Pfahl, S. Characterising the relationship between weather extremes in Europe and synoptic circulation features. Nat. Hazards Earth Syst. Sci. 2014, 14, 1461–1475. [Google Scholar] [CrossRef] [Green Version]
  33. Houpert, L.; de Madron, X.D.; Testor, P.; Bosse, A.; D’Ortenzio, F.; Bouin, M.N.; Dausse, D.; Le Goff, H.; Kunesch, S.; Labaste, M.; et al. Observations of open-ocean deep convection in the northwestern Mediterranean Sea: Seasonal and interannual variability of mixing and deep water masses for the 2007–2013 Period. J. Geophys. Res. Ocean. 2016, 121, 8139–8171. [Google Scholar] [CrossRef]
  34. Reynolds, R.W.; Smith, T.M.; Liu, C.; Chelton, D.B.; Casey, K.S.; Schlax, M.G. Daily high-resolution-blended analyses for sea surface temperature. J. Clim. 2007, 20, 5473–5496. [Google Scholar] [CrossRef]
  35. Waldman, R.; Somot, S.; Herrmann, M.; Bosse, A.; Caniaux, G.; Estournel, C.; Houpert, L.; Prieur, L.; Sevault, F.; Testor, P. Modeling the intense 2012–2013 dense water formation event in the northwestern Mediterranean Sea: Evaluation with an ensemble simulation approach. J. Geophys. Res. Ocean. 2017, 122, 1297–1324. [Google Scholar] [CrossRef]
  36. Lebeaupin Brossier, C.; Drobinski, P.; Béranger, K.; Bastin, S.; Orain, F. Ocean memory effect on the dynamics of coastal heavy precipitation preceded by a mistral event in the Northwestern Mediterranean. Q. J. R. Meteorol. Soc. 2013, 139, 1583–1597. [Google Scholar] [CrossRef]
  37. Berthou, S.; Mailler, S.; Drobinski, P.; Arsouze, T.; Bastin, S.; Béranger, K.; Flaounas, E.; Lebeaupin Brossier, C.; Somot, S.; Stéfanon, M. Influence of submonthly air–sea coupling on heavy precipitation events in the Western Mediterranean basin. Q. J. R. Meteorol. Soc. 2016, 142, 453–471. [Google Scholar] [CrossRef]
  38. Pieri, A.B.; von Hardenberg, J.; Parodi, A.; Provenzale, A. Sensitivity of precipitation statistics to resolution, microphysics, and convective parameterization: A case study with the high-resolution WRF climate model over Europe. J. Hydrometeorol. 2015, 16, 1857–1872. [Google Scholar] [CrossRef]
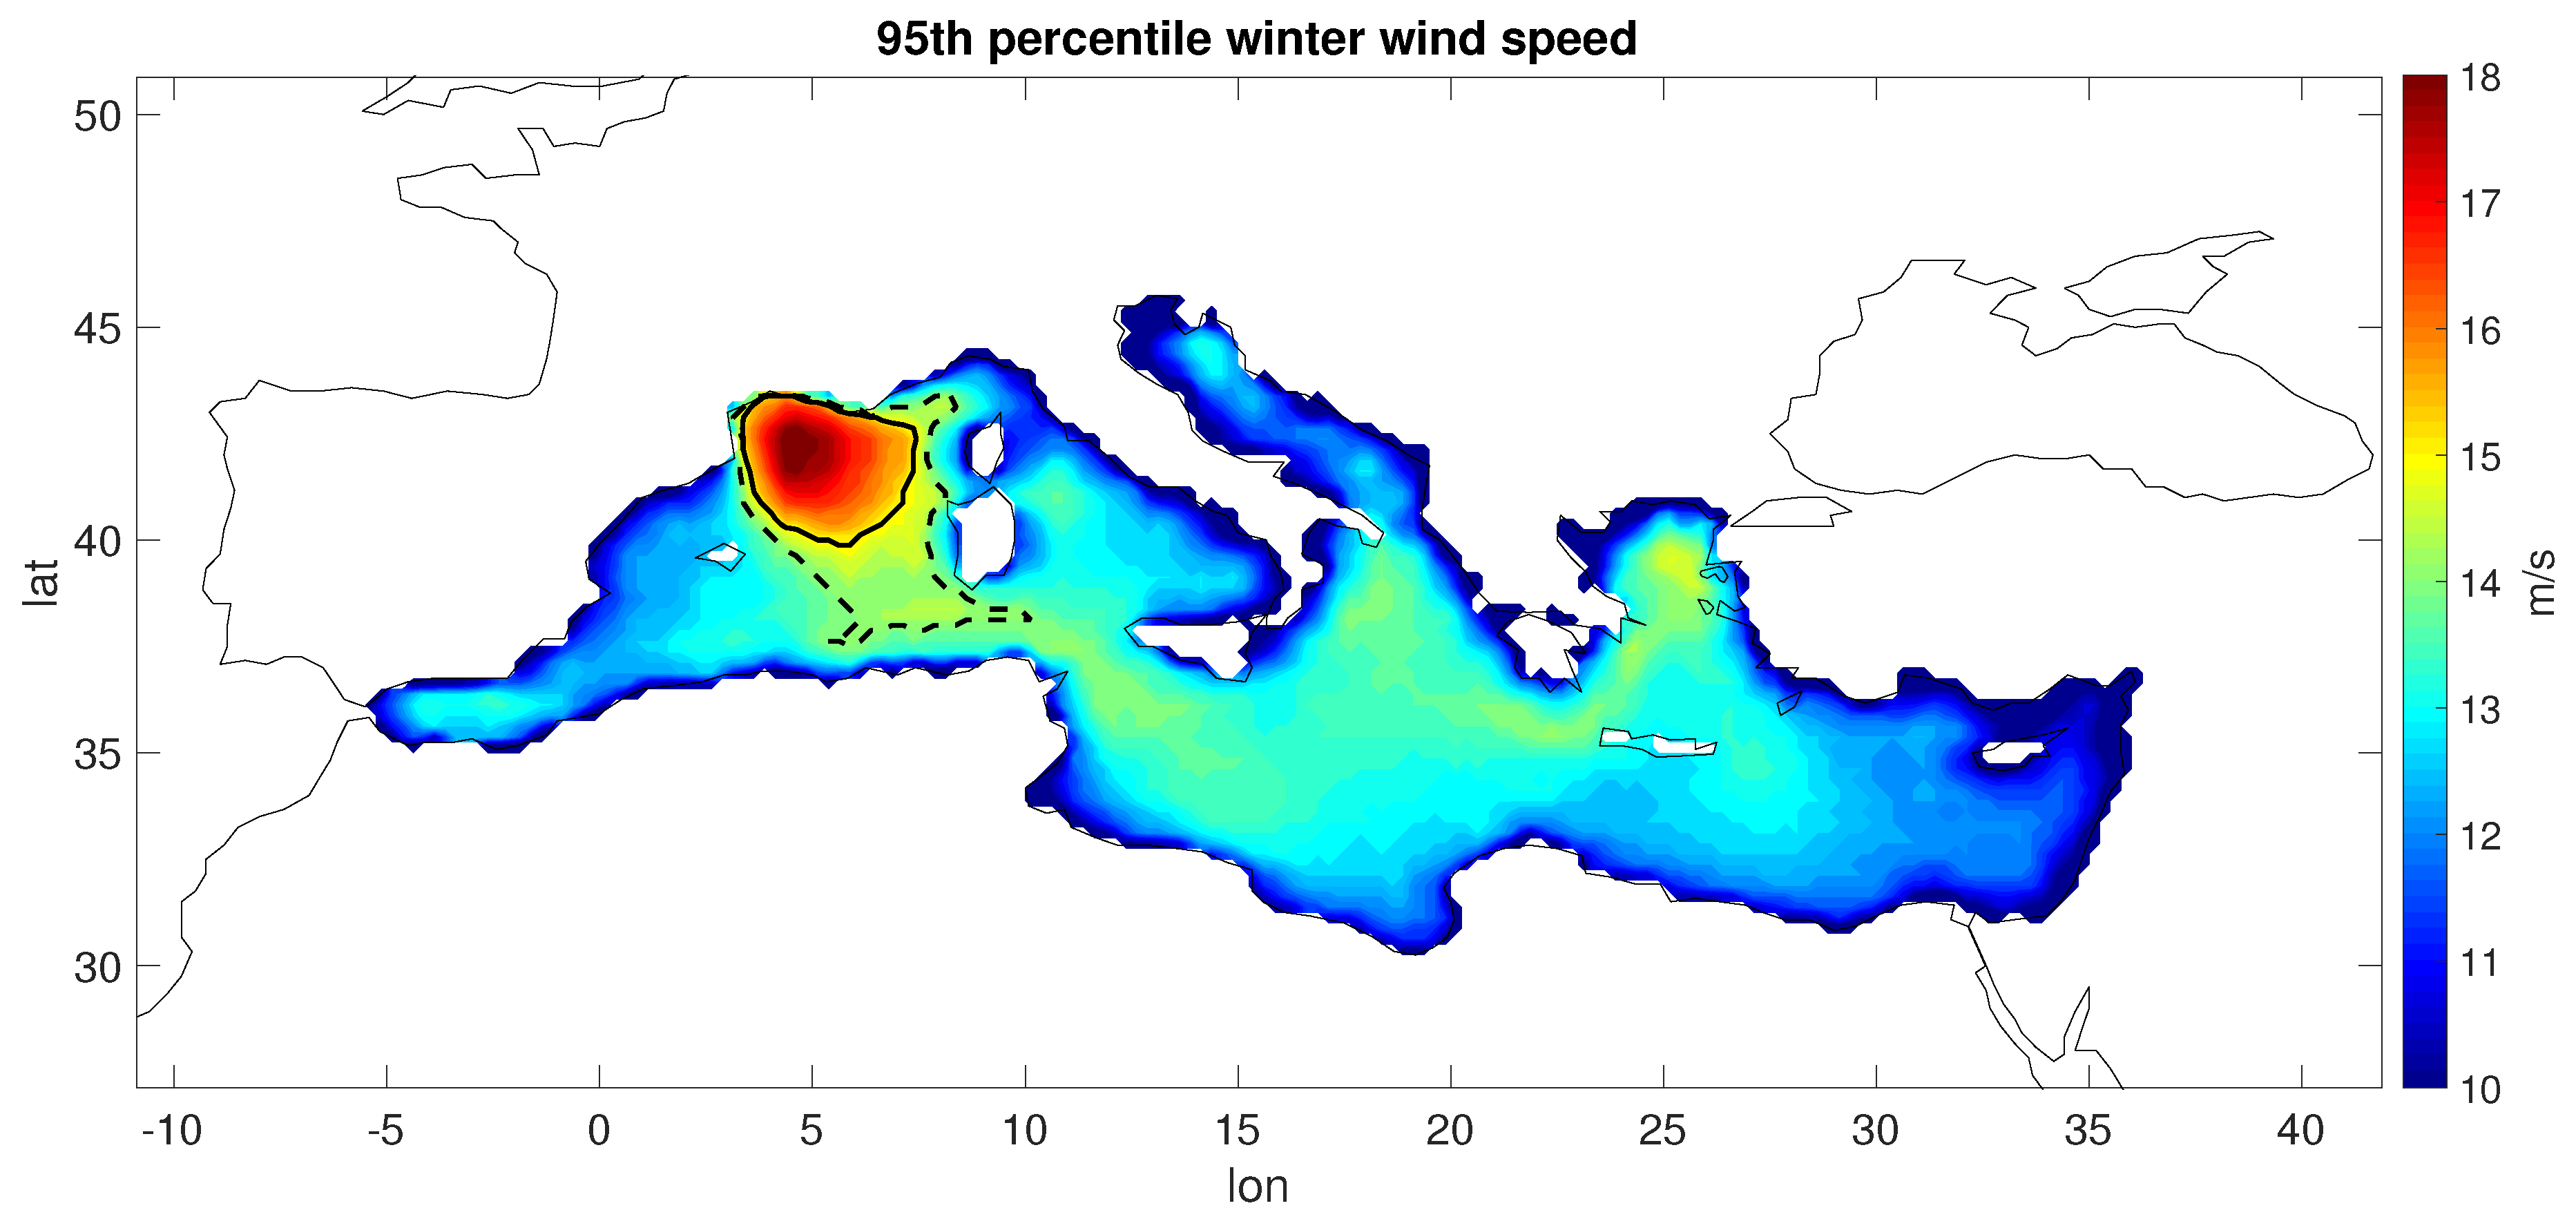
Figure 1. 95th percentile of 6-hourly winter wind intensity. The black solid line highlights the contour line at 15 ms 1 , enclosing the region in which the analysis presented in this study has been performed. The black dashed line highlights the contour line at 14 ms 1 , limited to the Western Mediterranean.
Jmse 07 00182 g001
Figure 2. Wind roses for winter (a) and summer (b) of wind directions for intense wind events in the region considered for the analysis. Events are binned with respect to the wind speed | u | , accordingly to the different values of the threshold used in the paper.
Jmse 07 00182 g002
Figure 3. Composite average of time evolution before and after the intense wind events of area averaged sea surface temperature anomaly (SSTA) (a) and sea surface height anomaly (SSHA) (b) during the winter season, for wind speed thresholds of 16 (blue), 18 (magenta) and 20 (red) ms 1 . Error bars around −50, 5, 60 and 150 days are computed as 2 standard deviations of the composite sample. Note the different axis range in the two panels.
Jmse 07 00182 g003
Figure 4. Composite average of time evolution before and after the intense wind events for SSTA (a) and SSHA (b) during the summer season, for wind speed thresholds of 16 (blue), 18 (magenta) and 20 (red) ms 1 . Error bars at −50, 5, 60, and 120 days are computed as 2 standard deviations of the composite sample.
Jmse 07 00182 g004