Article

Estimation of the Motion Performance of a Light Buoy Adopting Ecofriendly and Lightweight Materials in Waves

1
Department of Naval Architecture and Ocean Engineering, Chosun University, Gwangju 61452, Korea
2
Department of Naval Architecture and Ocean Engineering, Graduate School of Chosun University, Gwangju 61452, Korea
3
Department of Aerospace Engineering, Chosun University, Gwangju 61452, Korea
*
Author to whom correspondence should be addressed.
J. Mar. Sci. Eng. 2020, 8(2), 139; https://doi.org/10.3390/jmse8020139
Submission received: 14 January 2020 / Revised: 18 February 2020 / Accepted: 19 February 2020 / Published: 20 February 2020
(This article belongs to the Special Issue Waves and Ocean Structures)

Abstract

:
In this study, the methods and results of numerical simulations to estimate the motion performance of a newly developed lightweight light buoy in waves and to check the effect of conceptually developed appendages on that performance were introduced. The results from a potential-based motion analysis with viscous damping coefficients obtained from free decay tests using computational fluid dynamics (CFD) and those obtained from wave motion simulation using CFD were compared. From these results, it was confirmed that viscous damping should be considered when the frequency of an incoming wave is close to the natural frequency of the buoy. It was estimated that the pitch and heave motions of the light buoy became smaller when the developed appendages were adopted. Although the quantitative superiority of the appendages was different, the qualitative superiority was similar between both results.

1. Introduction

Light buoys are equipped with a lighting function and navigation sign (Figure 1). The buoy guides vessels sailing nearby in the daytime with its shape and color, and at night with its light. It also plays a role in notifying vessels about the presence of obstacles such as reefs and shallows.
Because conventional large buoys are mainly made of steel, they are heavy and vulnerable to corrosion and erosion by seawater. This makes the installation and maintenance of the buoys difficult. Moreover, vessel collision accidents with buoys and damage to vessels due to the light buoys’ material (e.g., steel) are reported every year in Korea. Recently, light buoys adopting eco-friendly and lightweight materials have come into the spotlight to solve the previously mentioned problems. In Korea, a new lightweight light buoy with a 7-nautical-mile lantern, adopting an expanded polypropylene (EPP) and aluminum buoyant body and tower structure was developed by Jeong et al. [1]. Figure 2 shows the comparison of the conventional light buoy with the newly developed one. The total weight and manufacturing cost of the new buoys are approximately 40% and 27% lower than the conventional ones, respectively.
When the light buoy operates on the ocean, the visibility and angle of light from its lantern changes, which may cause it to function improperly. From this point of view, the pitch and roll motions of a light buoy are important. Moreover, large heave motions may cause structural damage to the mooring system. The motion of a floating body is greatly affected by external environmental loads, especially waves. To ensure motion stability and structural reliability, the natural frequency of the floating body needs to be very different from that of the dominant waves at the installation site. Because the mass distribution and center of gravity of the lightweight buoy are different from those of conventional one, the motion performance of the new type of buoy in waves should be assessed.
Therefore, after checking the static stability, Son et al. [2] carried out a motion analysis of a newly developed lightweight light buoy under various environmental conditions using potential-based commercial software ANSYS AQWA(Ansys, In., Canonsburg, PA, U.S.) that considers wind and current loads estimated by numerical simulations using the commercial computational fluid dynamics (CFD) software Siemens STAR-CCM+ (Siemens Industry Software Ltd., Plano, TX, U.S.) to increase the accuracy of the motion analysis. As a result, it was predicted that the pitch and roll motion were large and did not meet the design targets in specific conditions. As mentioned in several studies [3,4,5,6,7], one of the reasons might be that the viscous damping effect is ignored in the potential-based simulations commonly performed for the motion analysis.
A widely used way to consider the viscous effect in potential-based motion analyses is to evaluate and apply a viscous damping coefficient using the free decay test or force harmonic oscillation test [8,9]. These tests can also be conducted through CFD simulations. Wassermann et al. [10] estimated the roll damping of ships using CFD simulations of free decay and harmonic excited roll motion tests. They compared the advantages and disadvantages of both techniques. Wilson et al. [11] performed free roll decay tests on a surface combatant ship using CFD and compared the estimated damping coefficients with experimental results. Irkal et al. [12] carried out experiments and CFD simulations of free roll decay tests with different dimensions of a bilge keel. Song et al. [13] and Kianejad et al. [14] estimated the roll damping coefficient of a 2D section of a floating body and container ships through harmonic excited roll motion tests using CFD simulations.
Some studies based on CFD simulations were conducted to determine the resonance condition of a floating body as an energy harvesting device. Zhang et al. [15] investigated the influences of selected parameters such as incident wave condition, submerged depth, and power take off damping on the hydrodynamic performances of 2-D sections of rectangular heaving buoys. Luan et al. [16] estimated the hydrodynamic performance of a wave energy converter under various wave conditions and confirmed the relationship between optimal linear damping and incident wave conditions. Mohapatra et al. [17] formulated the mathematical modelling of wave diffraction by a floating fixed truncated vertical cylinder based on Boussinesq-type equations in the application range of weakly dispersive Boussinesq model, and showed the fidelity of the model by comparing the results from the developed analytical model with those from experiments and their CFD simulations using OpenFOAM.
The adoption of a proper appendage, such as a (bilge) keel or a heave (damping) plate, is one of the options for improving the motion performance of a floating body in waves. Although it is difficult to find motion reduction devices specifically designed for a light buoy, a heave damping plate for a vertical circular cylinder or a spar platform would be effective for a light buoy because of its geometrical similarity. Research on the effect of heave damping plates can be found in the following papers. Koh and Cho [18] carried out analytical and experimental studies to investigate the heave motion response of a circular cylinder according to the characteristics of dual damping plates as heave motion reduction appendages. Tao and Cai [19] investigated the vortex shedding pattern and hydrodynamics forces arising from the flow separation and vortex shedding around a damping plate of a circular cylinder. Through a series of experiments, some approximation equations were developed to calculate the added mass of the floating cylinder with a separate heave plate, and the motion response of a vertical circular cylinder with a heave plate to a series of regular waves was examined by Zhu and Lim [20]. Sudhakar and Nallayarasu [21,22] investigated the influence of single and double damping plates on the hydrodynamic response of a spar in regular and irregular waves by experimental studies. Koh et al. [23] performed free decay tests by experiments to obtain the viscous damping coefficients of a circular cylinder with a heave damping plate changing the porosity of the damping plate. From their experiments for regular and irregular waves, the pronounced motion reduction was observed by applying a porous plate.
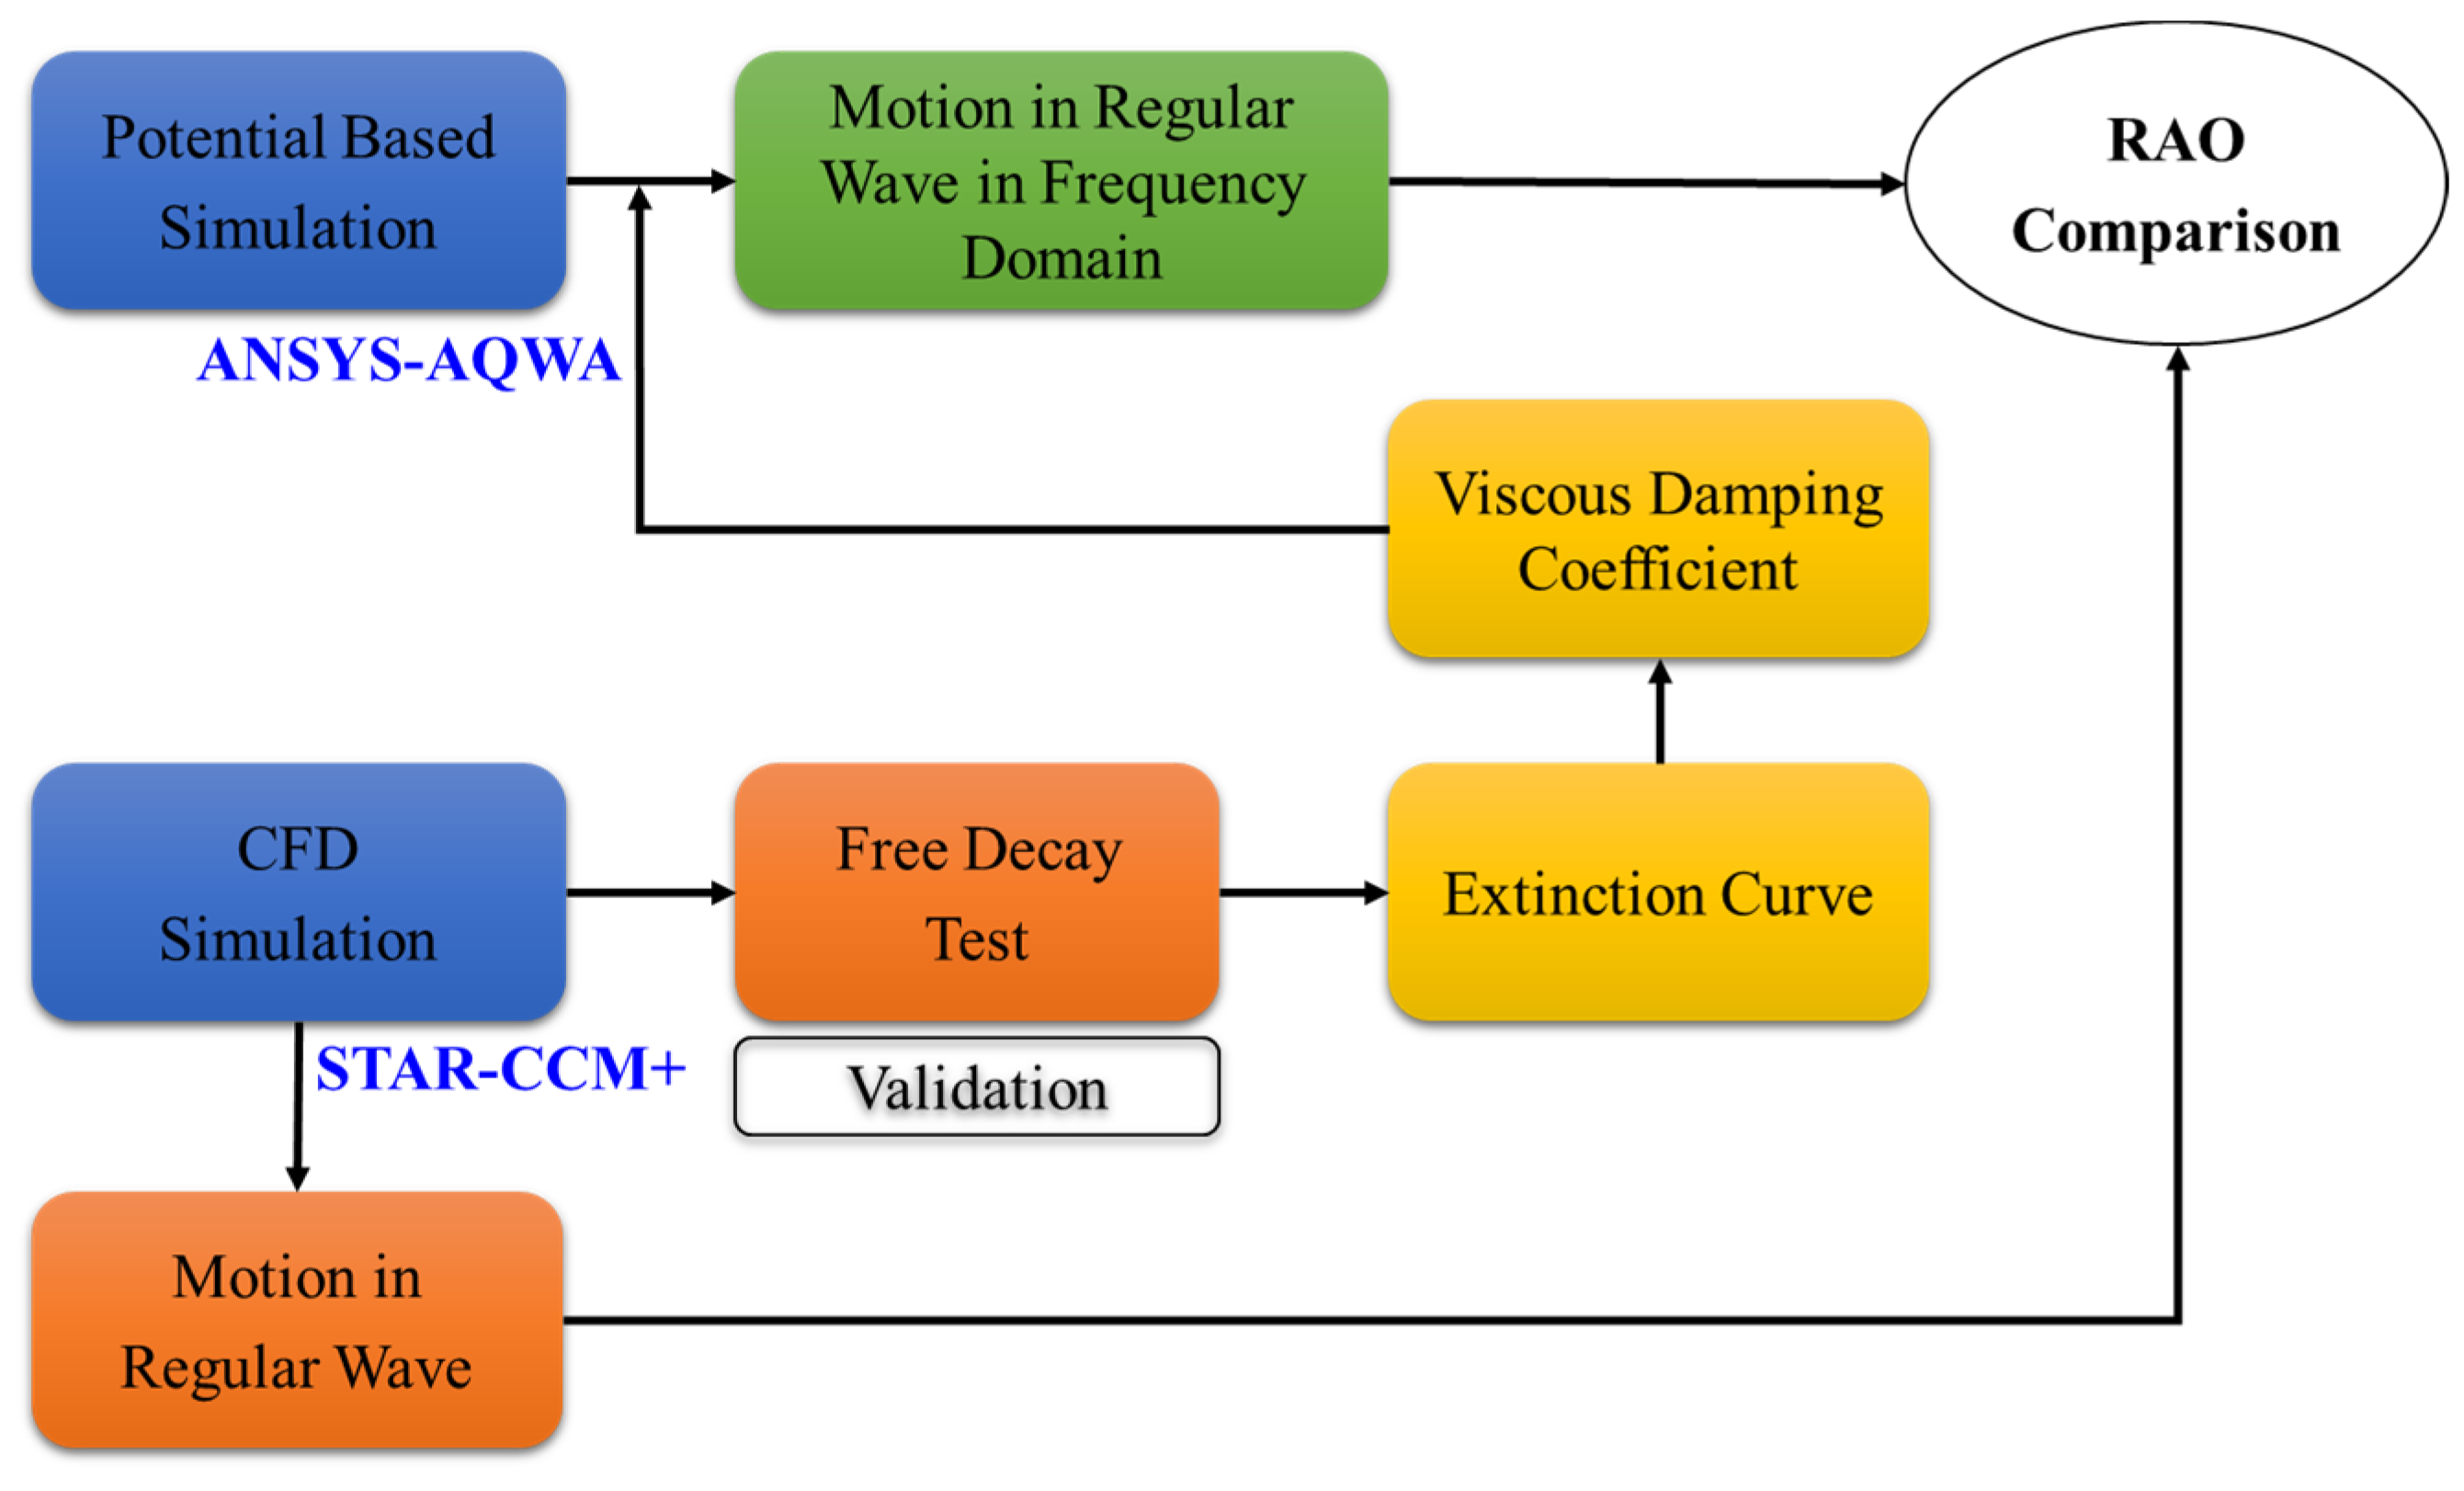
In this study, motion analyses of a newly developed lightweight light buoy in waves were performed to predict the motion performance and to check the effects of the conceptually developed appendages intended for improving the motion performance. First, free decay tests including benchmark cases using CFD were carried out to estimate the viscous damping coefficients that cannot be obtained by potential-based simulations. Then, the results from potential-based simulations considering the viscous damping coefficients estimated by CFD were compared with the results of motion simulations in regular waves using CFD simulations (Figure 3).

2. Problem Formulation

2.1. Governing Equation

For incompressible turbulent flows, the governing equations are the continuity and Reynolds-averaged Navier-Stokes equations, as shown in Equations (1) and (2), respectively.
u i x i = 0
u i t + ( u i u j ) x j = 1 ρ p x i + x j { ( ν + ν t ) u i x j } + f i ,
where u i and x i are the velocity component and coordinate in the i -direction; ρ is the density; p is the pressure; ν is the kinematic viscosity; ν t is the eddy viscosity; and f i is the external force per unit mass.

2.2. Estimation Procedure of Viscous Damping Coefficients from a Free Decay Test

The 1-degree of freedom (DOF) motion equations of pitch and heave of a floating body are as follows.
( I + I a ) θ ¨ + b 55 θ ˙ + c 55 θ = M ( t )
( m + m a ) z ¨ + b 33 z ˙ + c 33 z = F ( t ) ,
where I and I a are the moment of inertia and added moment of inertia, respectively; θ is the angular displacement; b and c are the total damping and restoring coefficients, respectively; and M ( t ) is the pitch wave excitation moment. In Equation (4), m and m a are the mass and added mass, respectively; z is the vertical displacement; and F ( t ) is the heave wave excitation force.
The total damping coefficients of pitch and heave were calculated from the free decay test using Equations (5) and (6), respectively.
b 55 = 2 ζ 55 ( I + I a ) c 55
b 33 = 2 ζ 33 ( m + m a ) c 33 ,
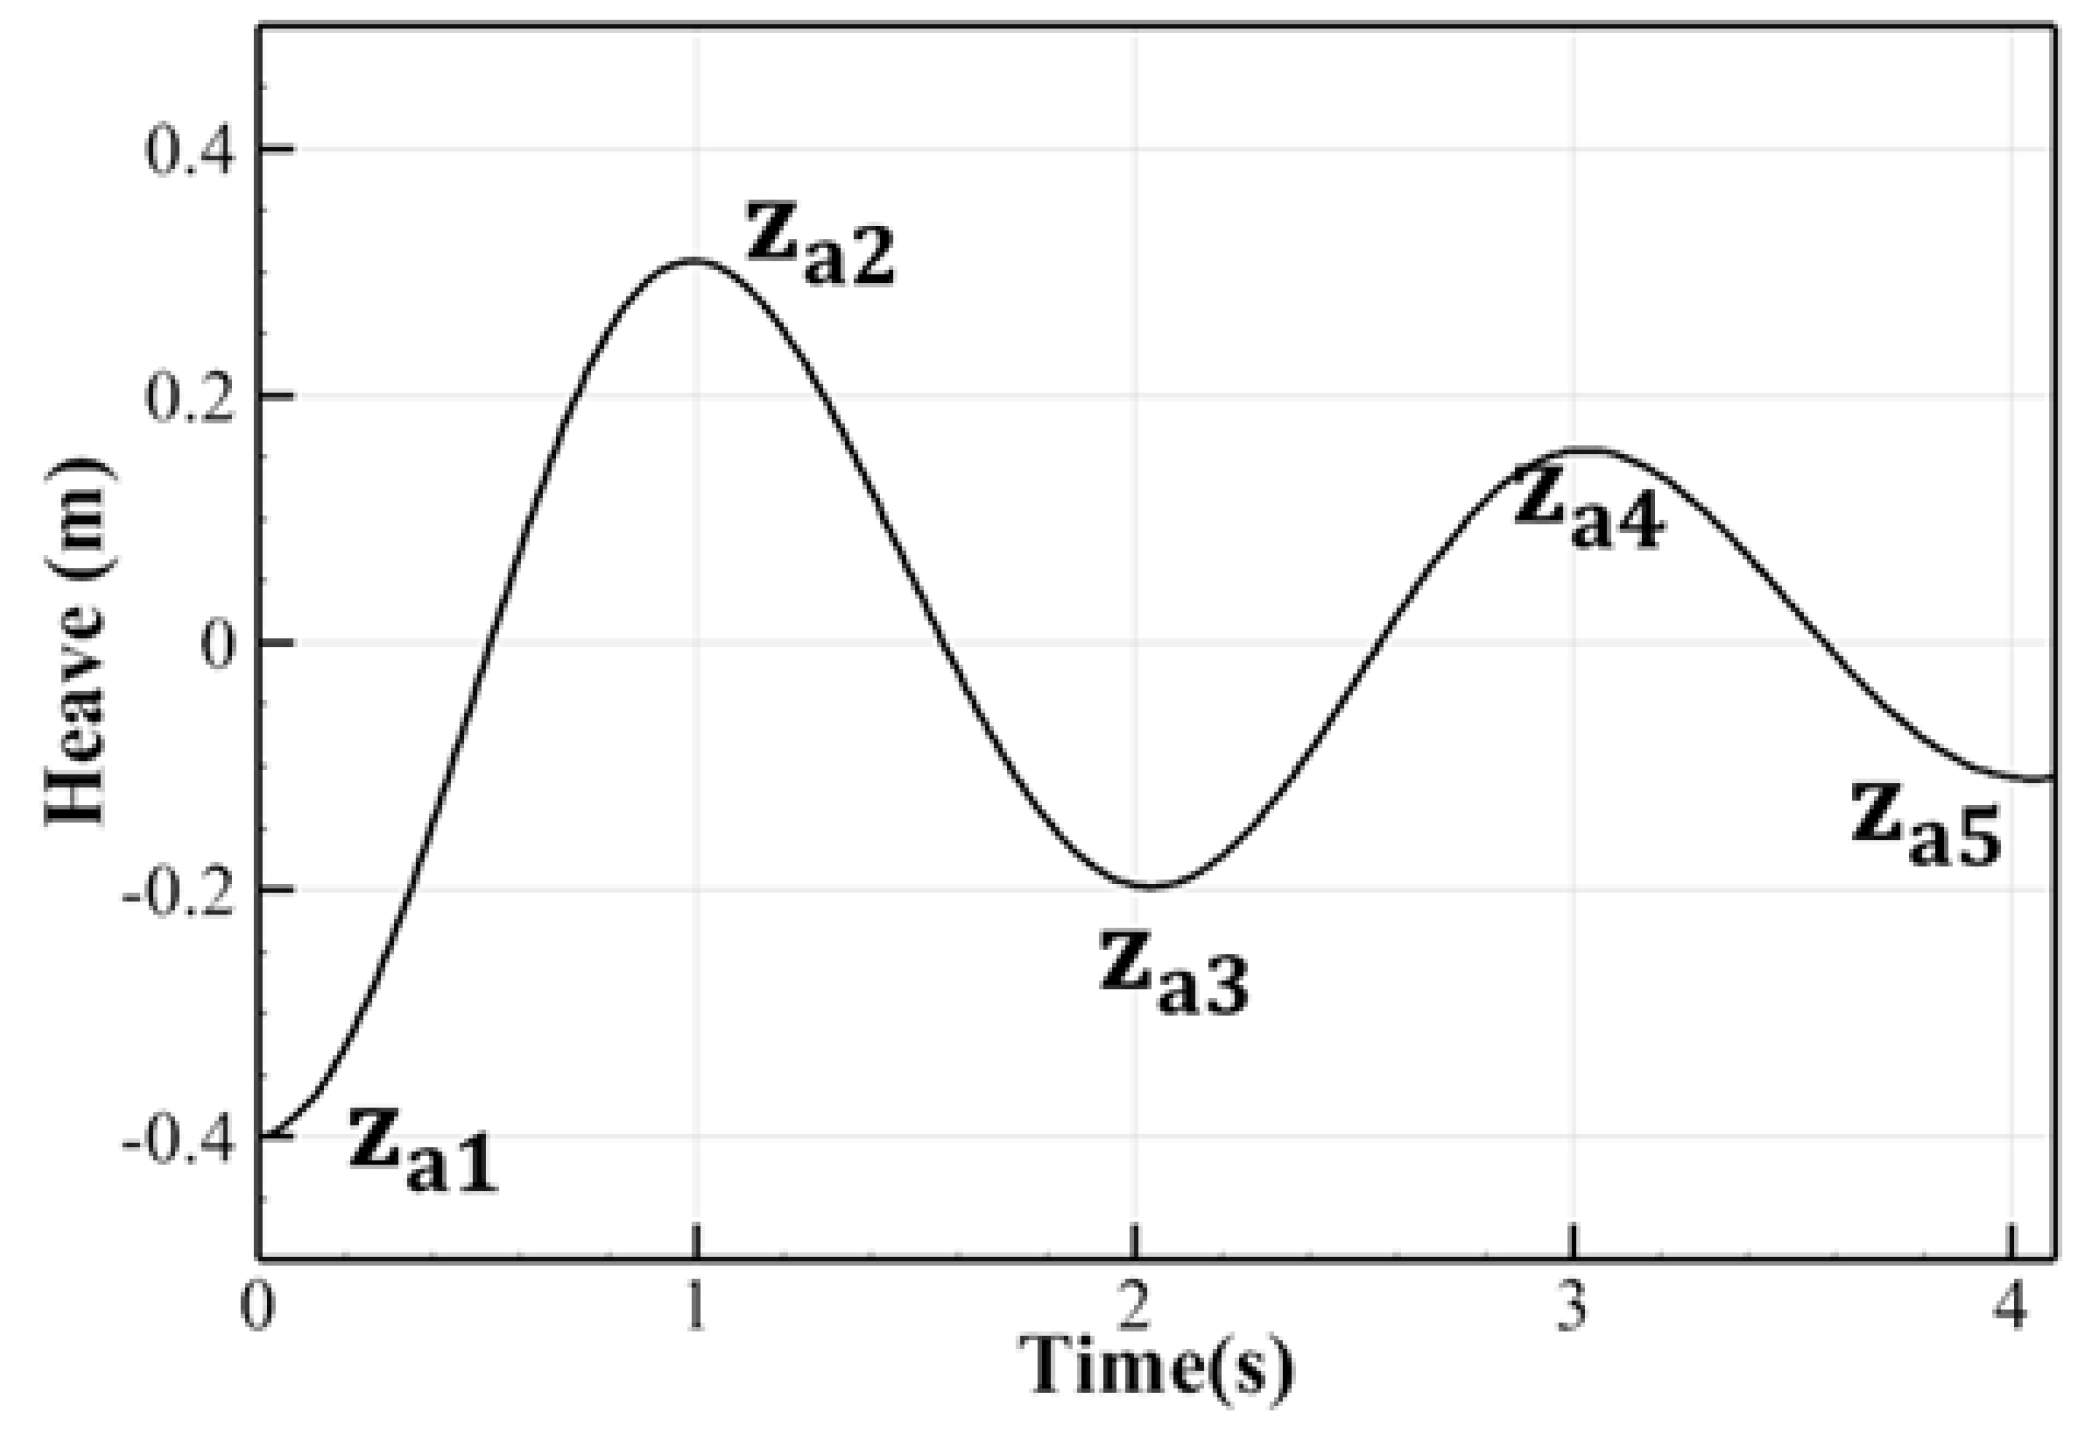
where ζ is a non-dimensional total damping coefficient estimated by the method of Journée and Massie [9], for which four peaks of motion from the free decay test, as shown in Figure 4, were chosen to evaluate ζ through Equation (7).
ζ = 1 2 π · l n (   z a 1 z a 2 z a 3 z a 4   )
The viscous damping coefficients were derived from Equations (8) and (9) proposed by Koh and Cho [18].
b 55 ,   v i s = b 55 ν 55 ( ω o ,   55 )
b 33 ,   v i s = b 33 ν 33 ( ω o , 33 )
where ν 55 ( ω o ,   55 ) and ν 33 ( ω o , 33 ) are the radiation damping coefficients, which were evaluated by the ANSYS-AQWA software in this study, at the undamped natural frequencies of pitch and heave motions defined as ω o ,   55 = c 55 / ( I + I a ) and ω o ,   33 = c 33 / ( m + m a ) , respectively.

3. Numerical Simulations

3.1. Simulation Method

STAR-CCM+ 11.04 was used to simulate the free decay test and for the motion simulations in regular waves. To capture the free surface, the volume of fluid (VOF) method was used. The realizable k-ε model was applied as a turbulent model. In addition, the overset grid and dynamic fluid body interaction techniques were used to handle the motion of the floating body. 3-DOF (surge, heave, and pitch) and 6-DOF simulations were performed for the free decay tests and motion simulations in regular waves, respectively.
With the application of the viscous damping coefficients, which were estimated by CFD simulations, the motion analyses were performed using ANSYS-AQWA, which is based on panel methods.

3.2. Modeling of Lightweight Light Buoys

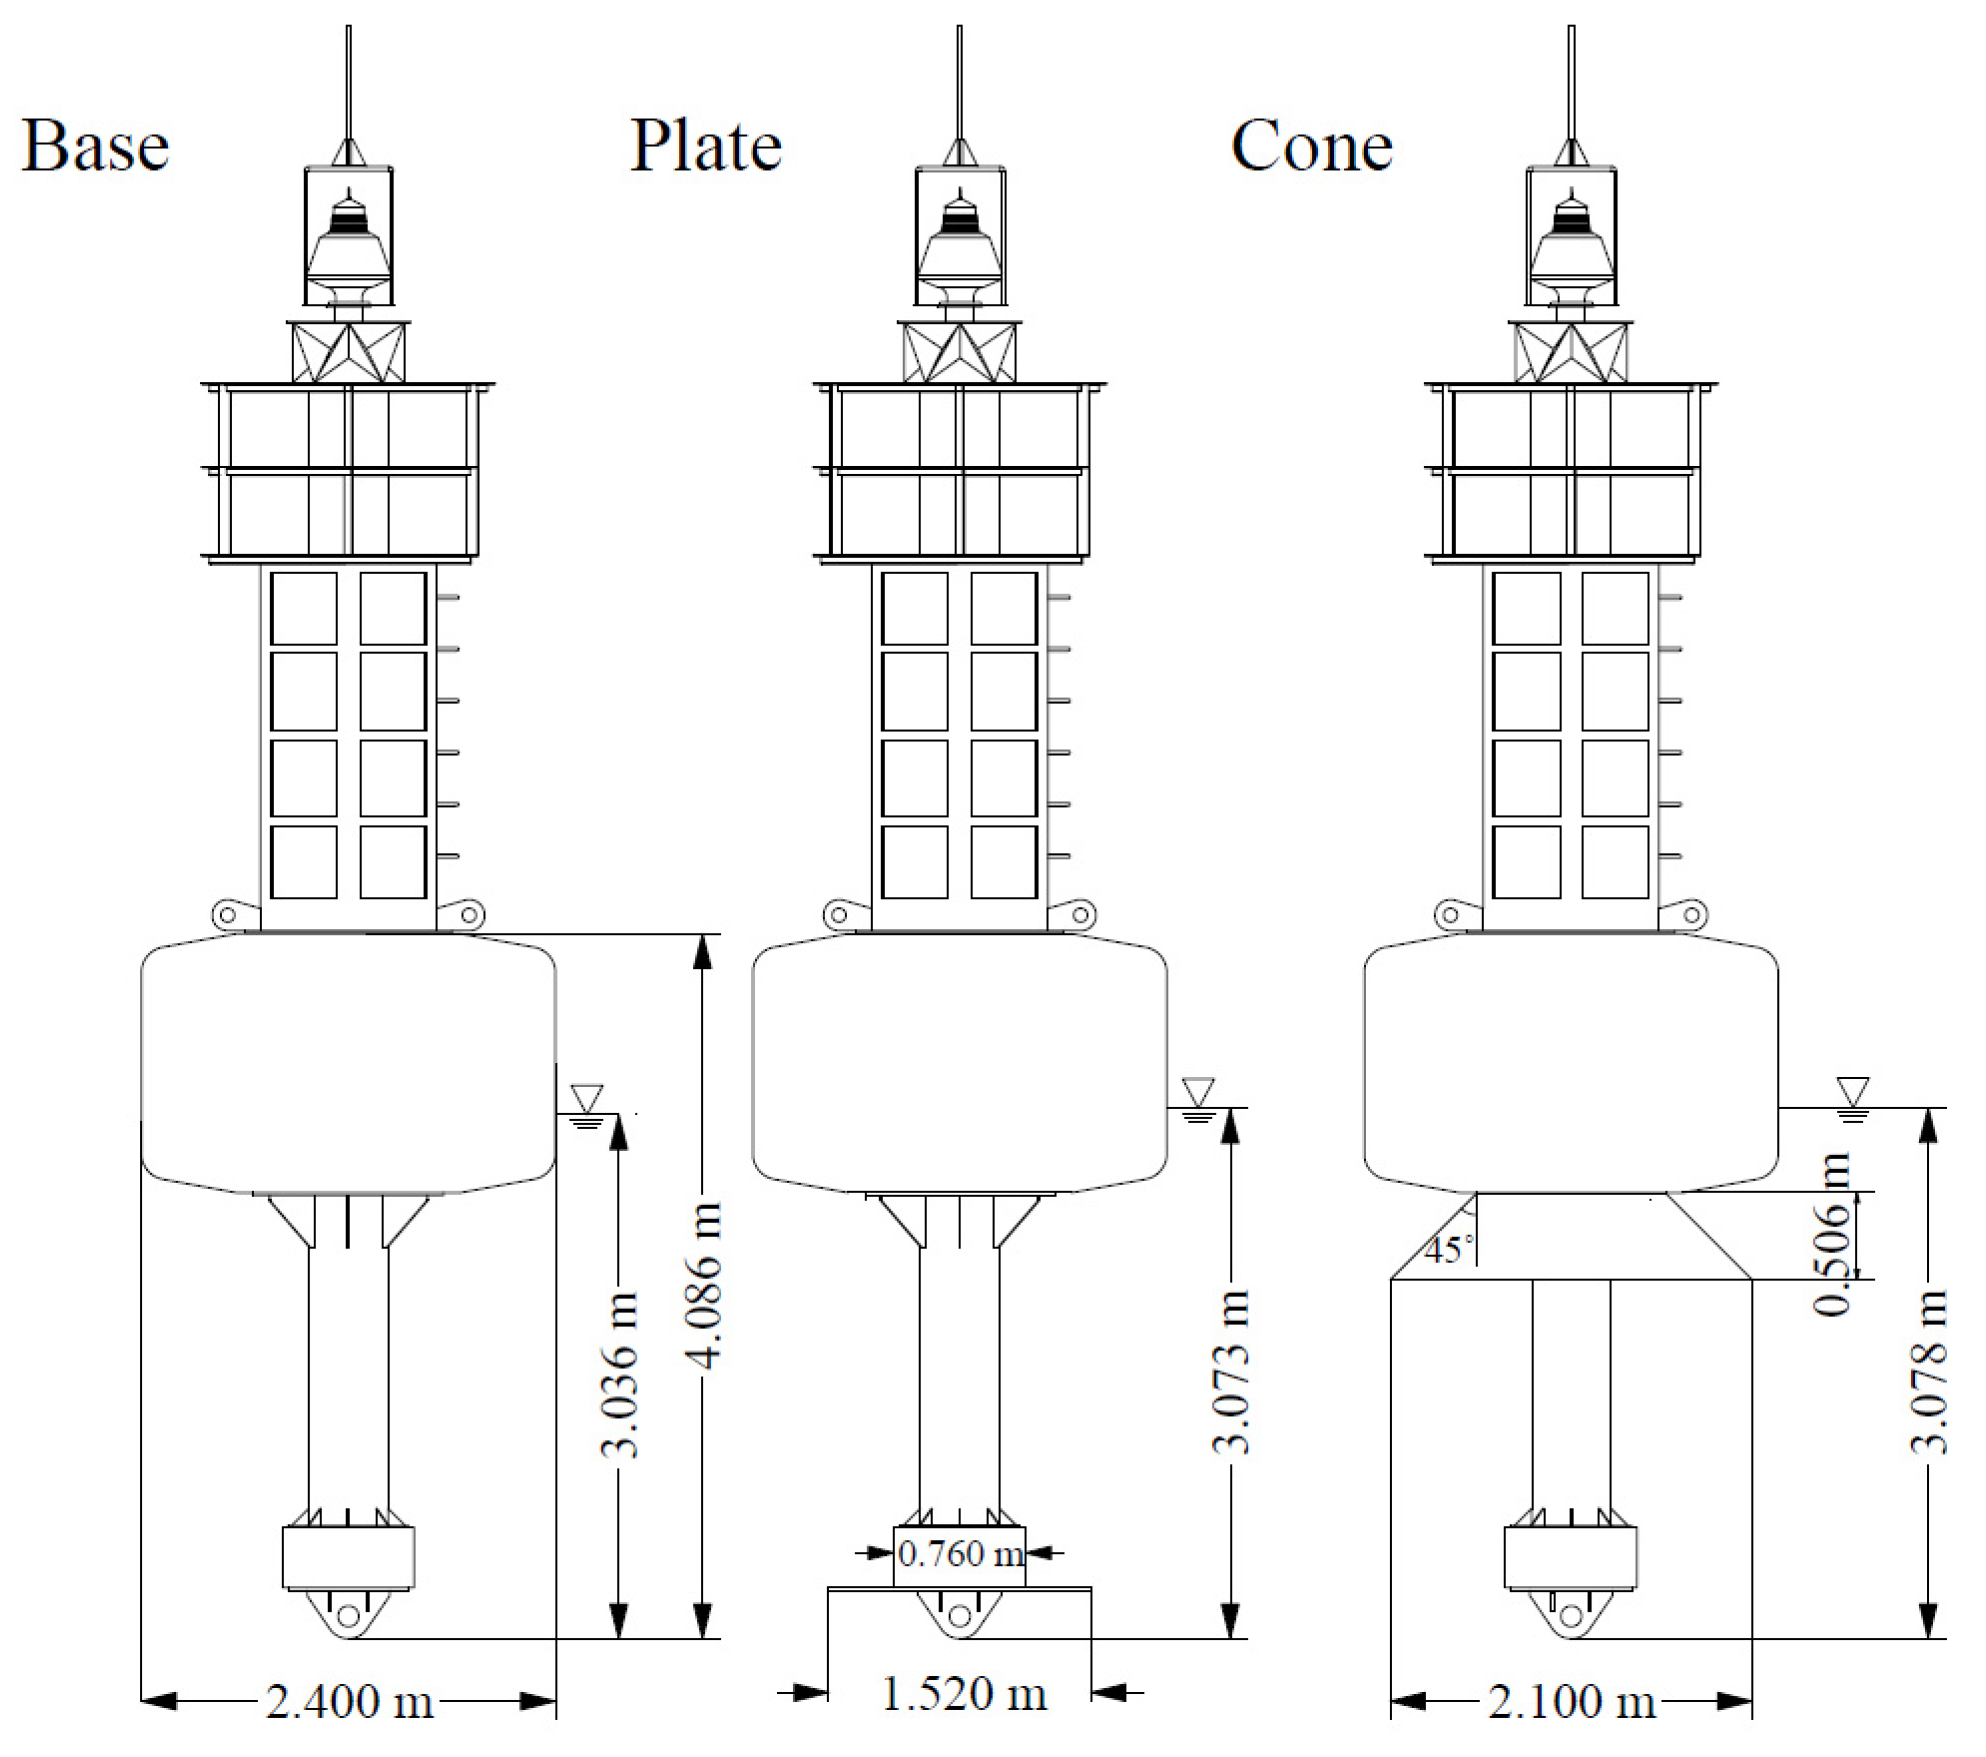
To improve the motion performance of the recently developed lightweight light buoy, named “Base,” two kinds of appendages were conceptually designed and assumed to be installed on the light buoy, as illustrated in Figure 5. The first addition is similar to a heave damping plate for an offshore structure; it is named “Plate” hereafter. The other addition is a conical shape similar to a ship’s bilge keel, which is marked as “Cone” in the present paper. From the research of Koh et al. [23], the damping coefficient of a vertical circular cylinder with a porous damping plate is larger than that with a non-porous damping plate. Therefore, the effect of the porosity of the appendage was also evaluated in this study. The models considering the porosity are named “Porous Plate” and “Porous Cone.”
The simplified geometries of the lightweight light buoys with and without the developed appendages for the numerical analysis are shown in Figure 6, where only the major parts affecting the motion of the buoy were modeled considering the total mass and mass moment of inertia of the tower structure. The particulars and hydrostatic properties of the buoys are listed in Table 1. The mass of the light buoy with the appendages is approximately 7% higher than that of the Base model.

3.3. Estimation of Viscous Damping Coefficient Using CFD Simulation

3.3.1. Validation

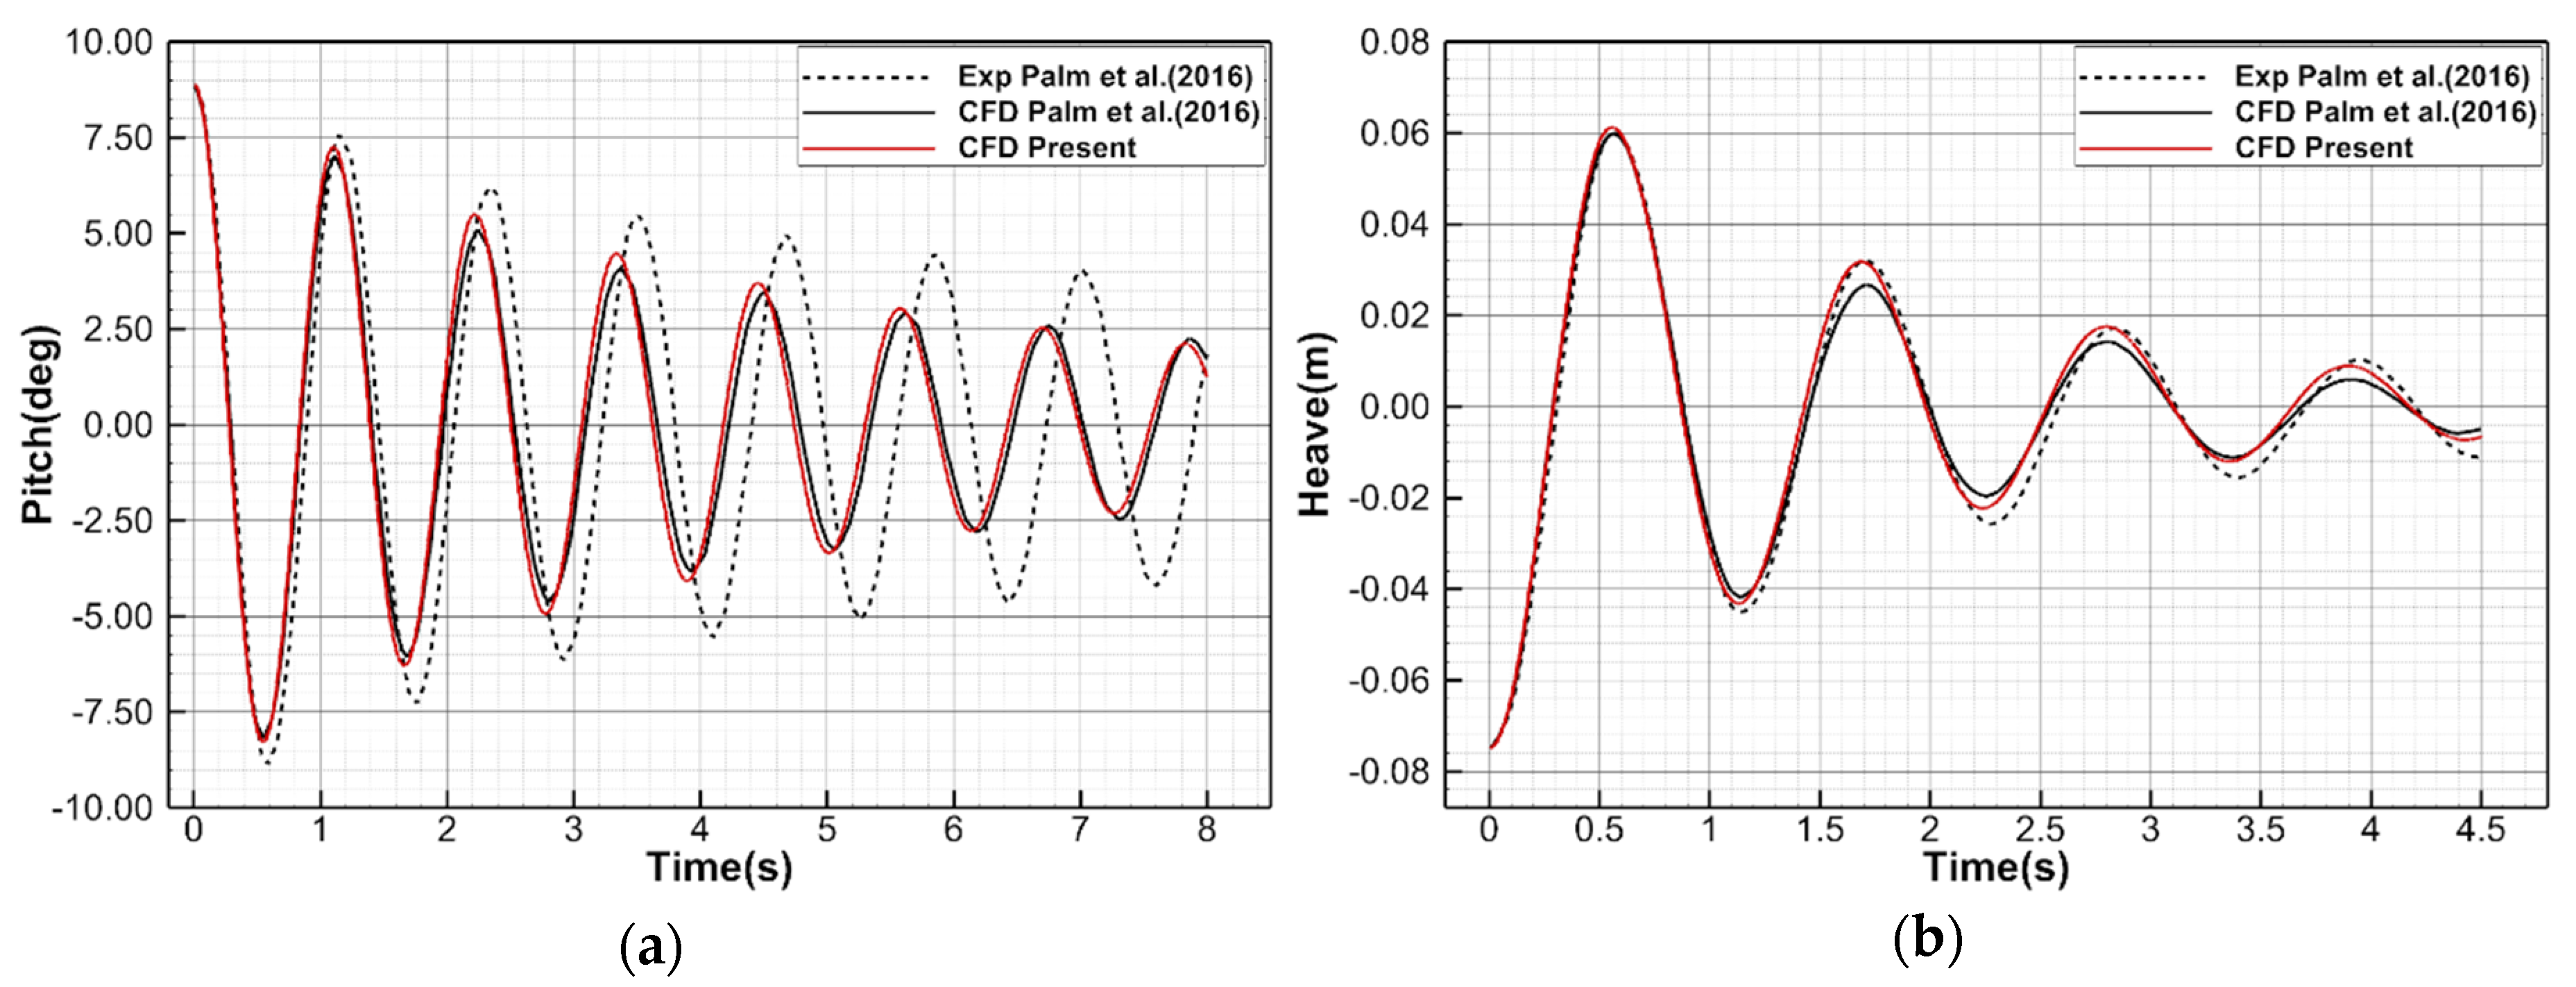
To confirm the accuracy of the present numerical schemes and methods, CFD simulations of the free pitch and heave decay tests of a circular cylinder were performed under the same conditions as Palm et al. [24], who carried out experimental and numerical tests. A vertically truncated cylinder was tested in a wave tank with a water depth of 0.9m. The mass and diameter of the cylinder were 35.85kg and 0.515m, respectively. The moment of inertia around the center of gravity was 0.9kgm2 and the center of gravity was placed 0.0758m above the bottom of the buoy along the symmetry z-axis.
Figure 7 shows the comparisons of the pitch and heave time histories obtained from the present CFD simulations with the results of the reference. The results of the present study are in good agreement with those of the reference. The reason for the discrepancy in pitch motion between the numerical and experimental results is thought to be the limitation of a small-scale experiment, in which generally allowable errors in the controlling and measured variables, such as the draft and center of gravity, may result in considerable differences in the motion response, as pointed out by Palm et al. in their work [24].

3.3.2. Computational Domain, Boundary Conditions, and Grid System

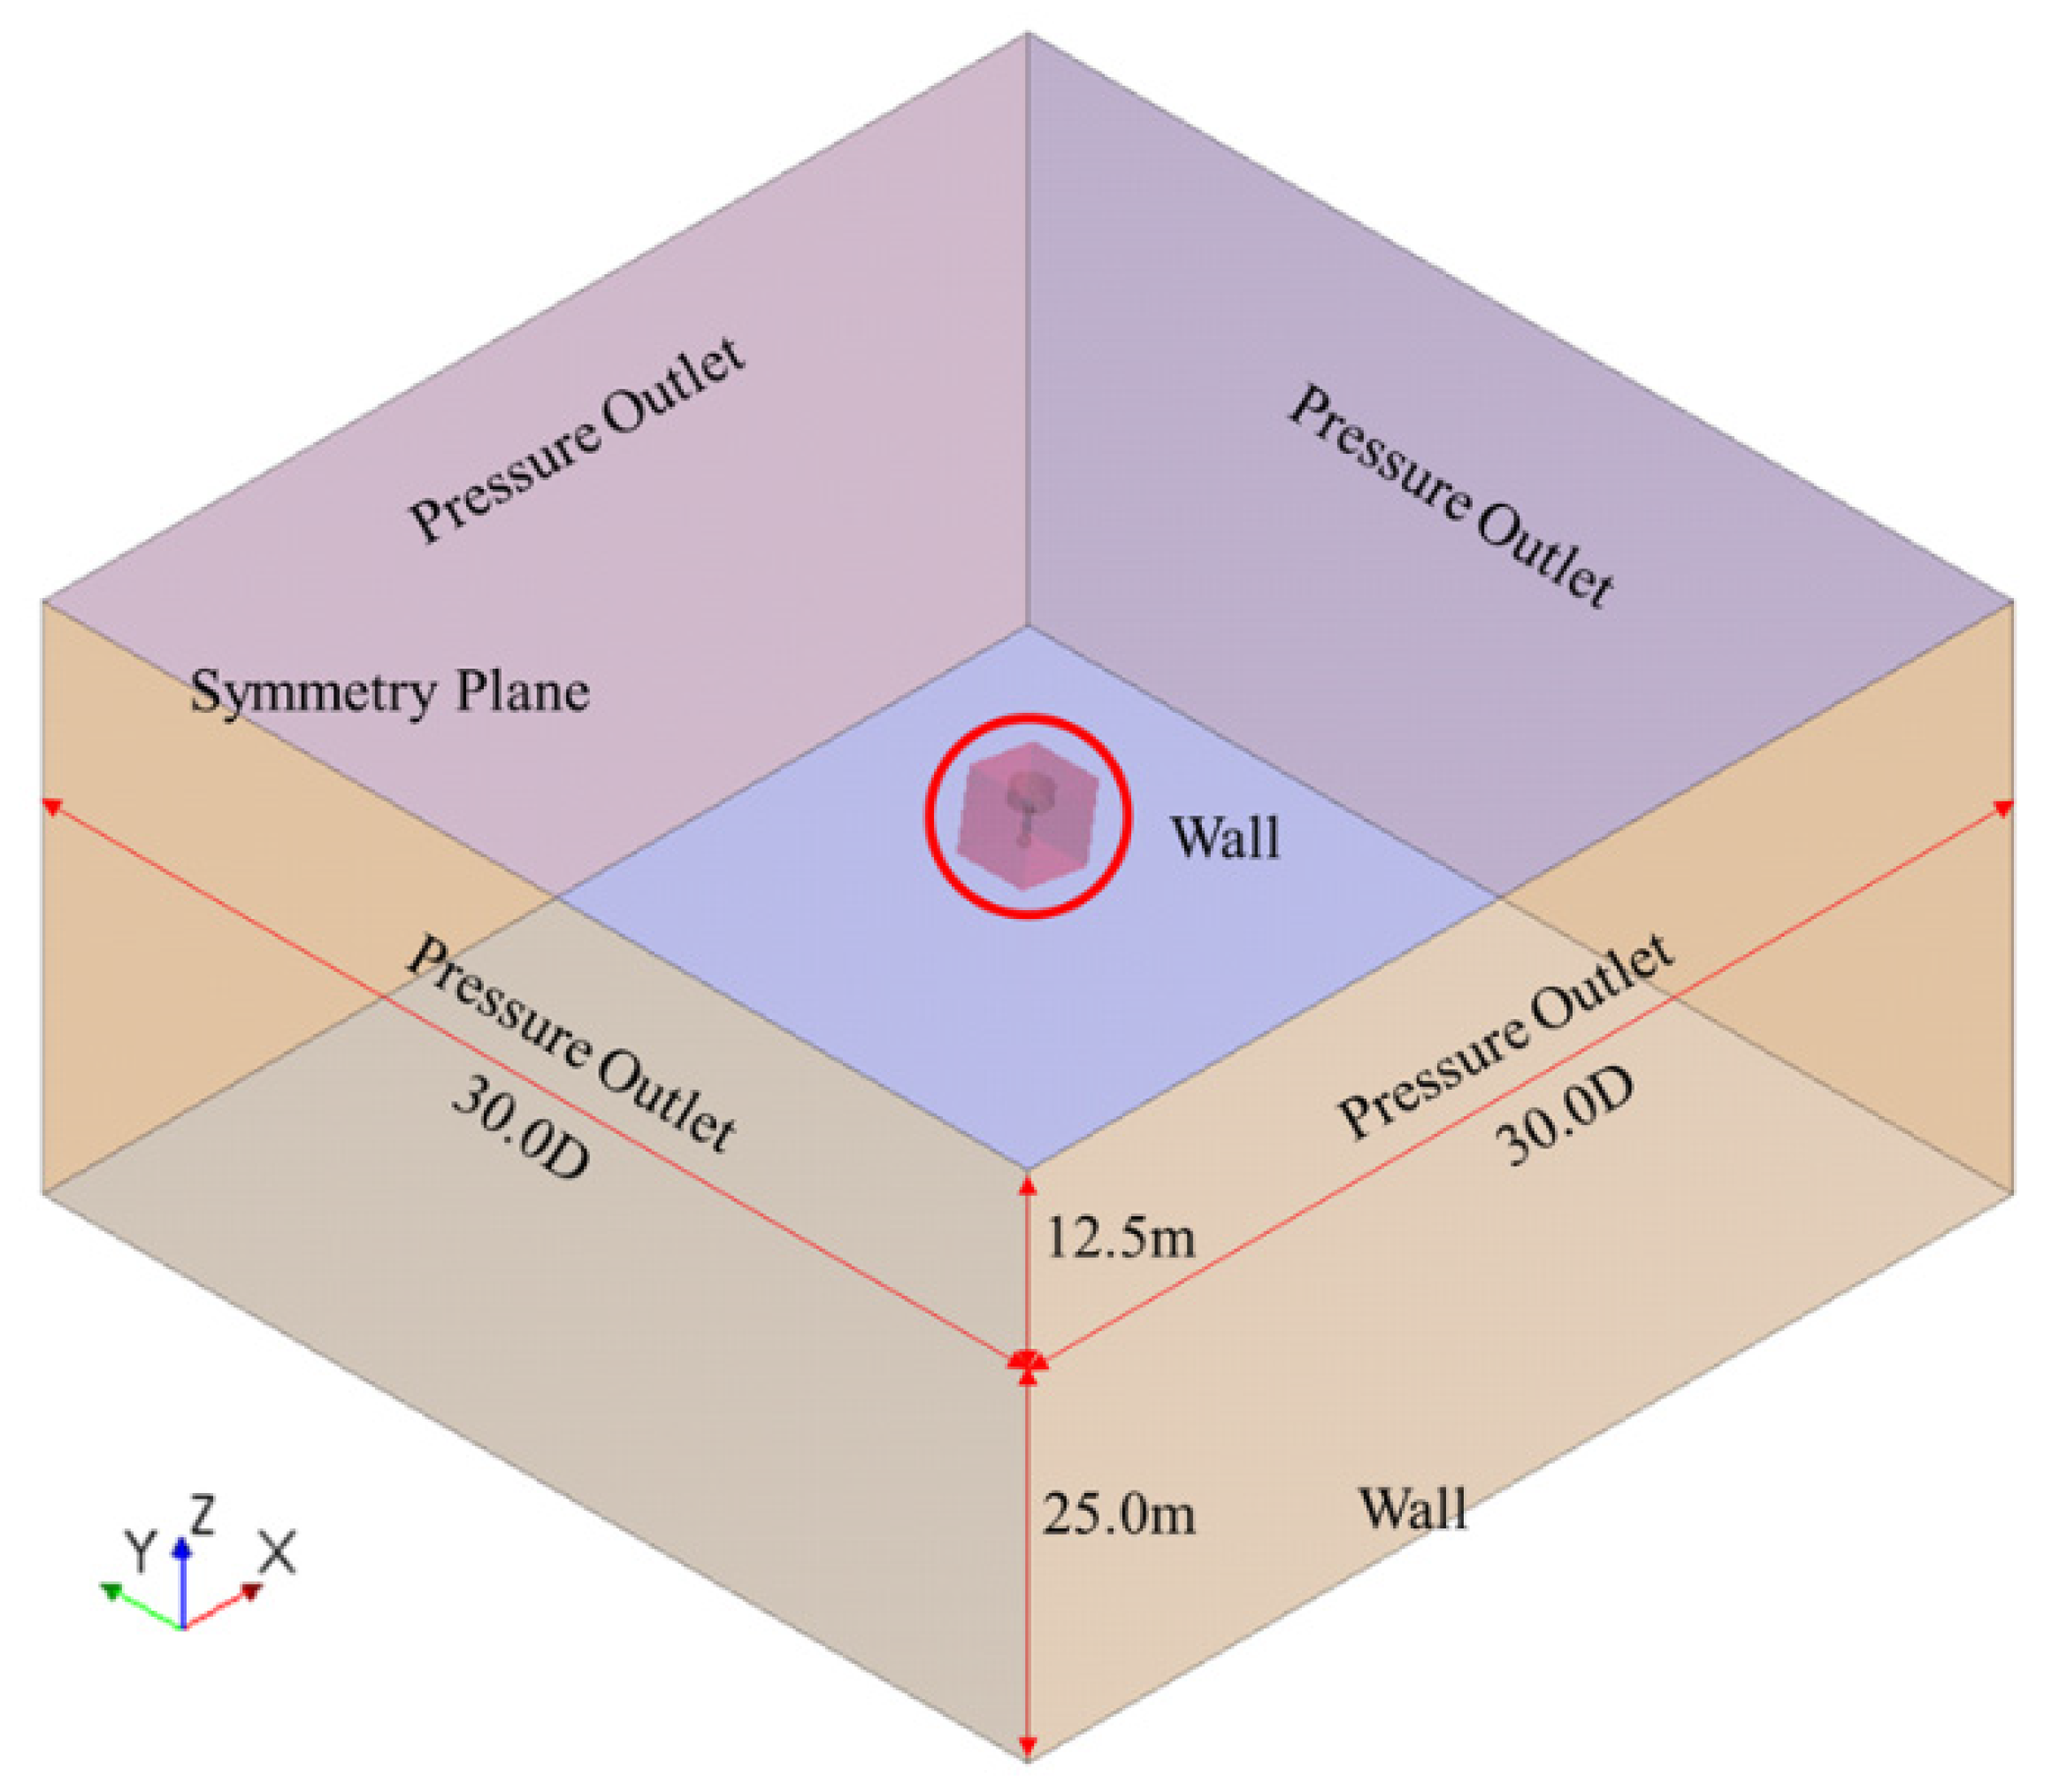
Figure 8 shows the computational domain and boundary conditions of the free decay test for the light buoys using CFD. The size of the computational domain was set to 25 m in the depth direction below the free surface. The length and width are 30.0 D based on the diameter D (2.40 m) of the light buoy. To suppress the radiated waves from the light buoys, a numerical wave damping scheme is applied at the ends of the side boundaries to approximately one third of the computational domain.
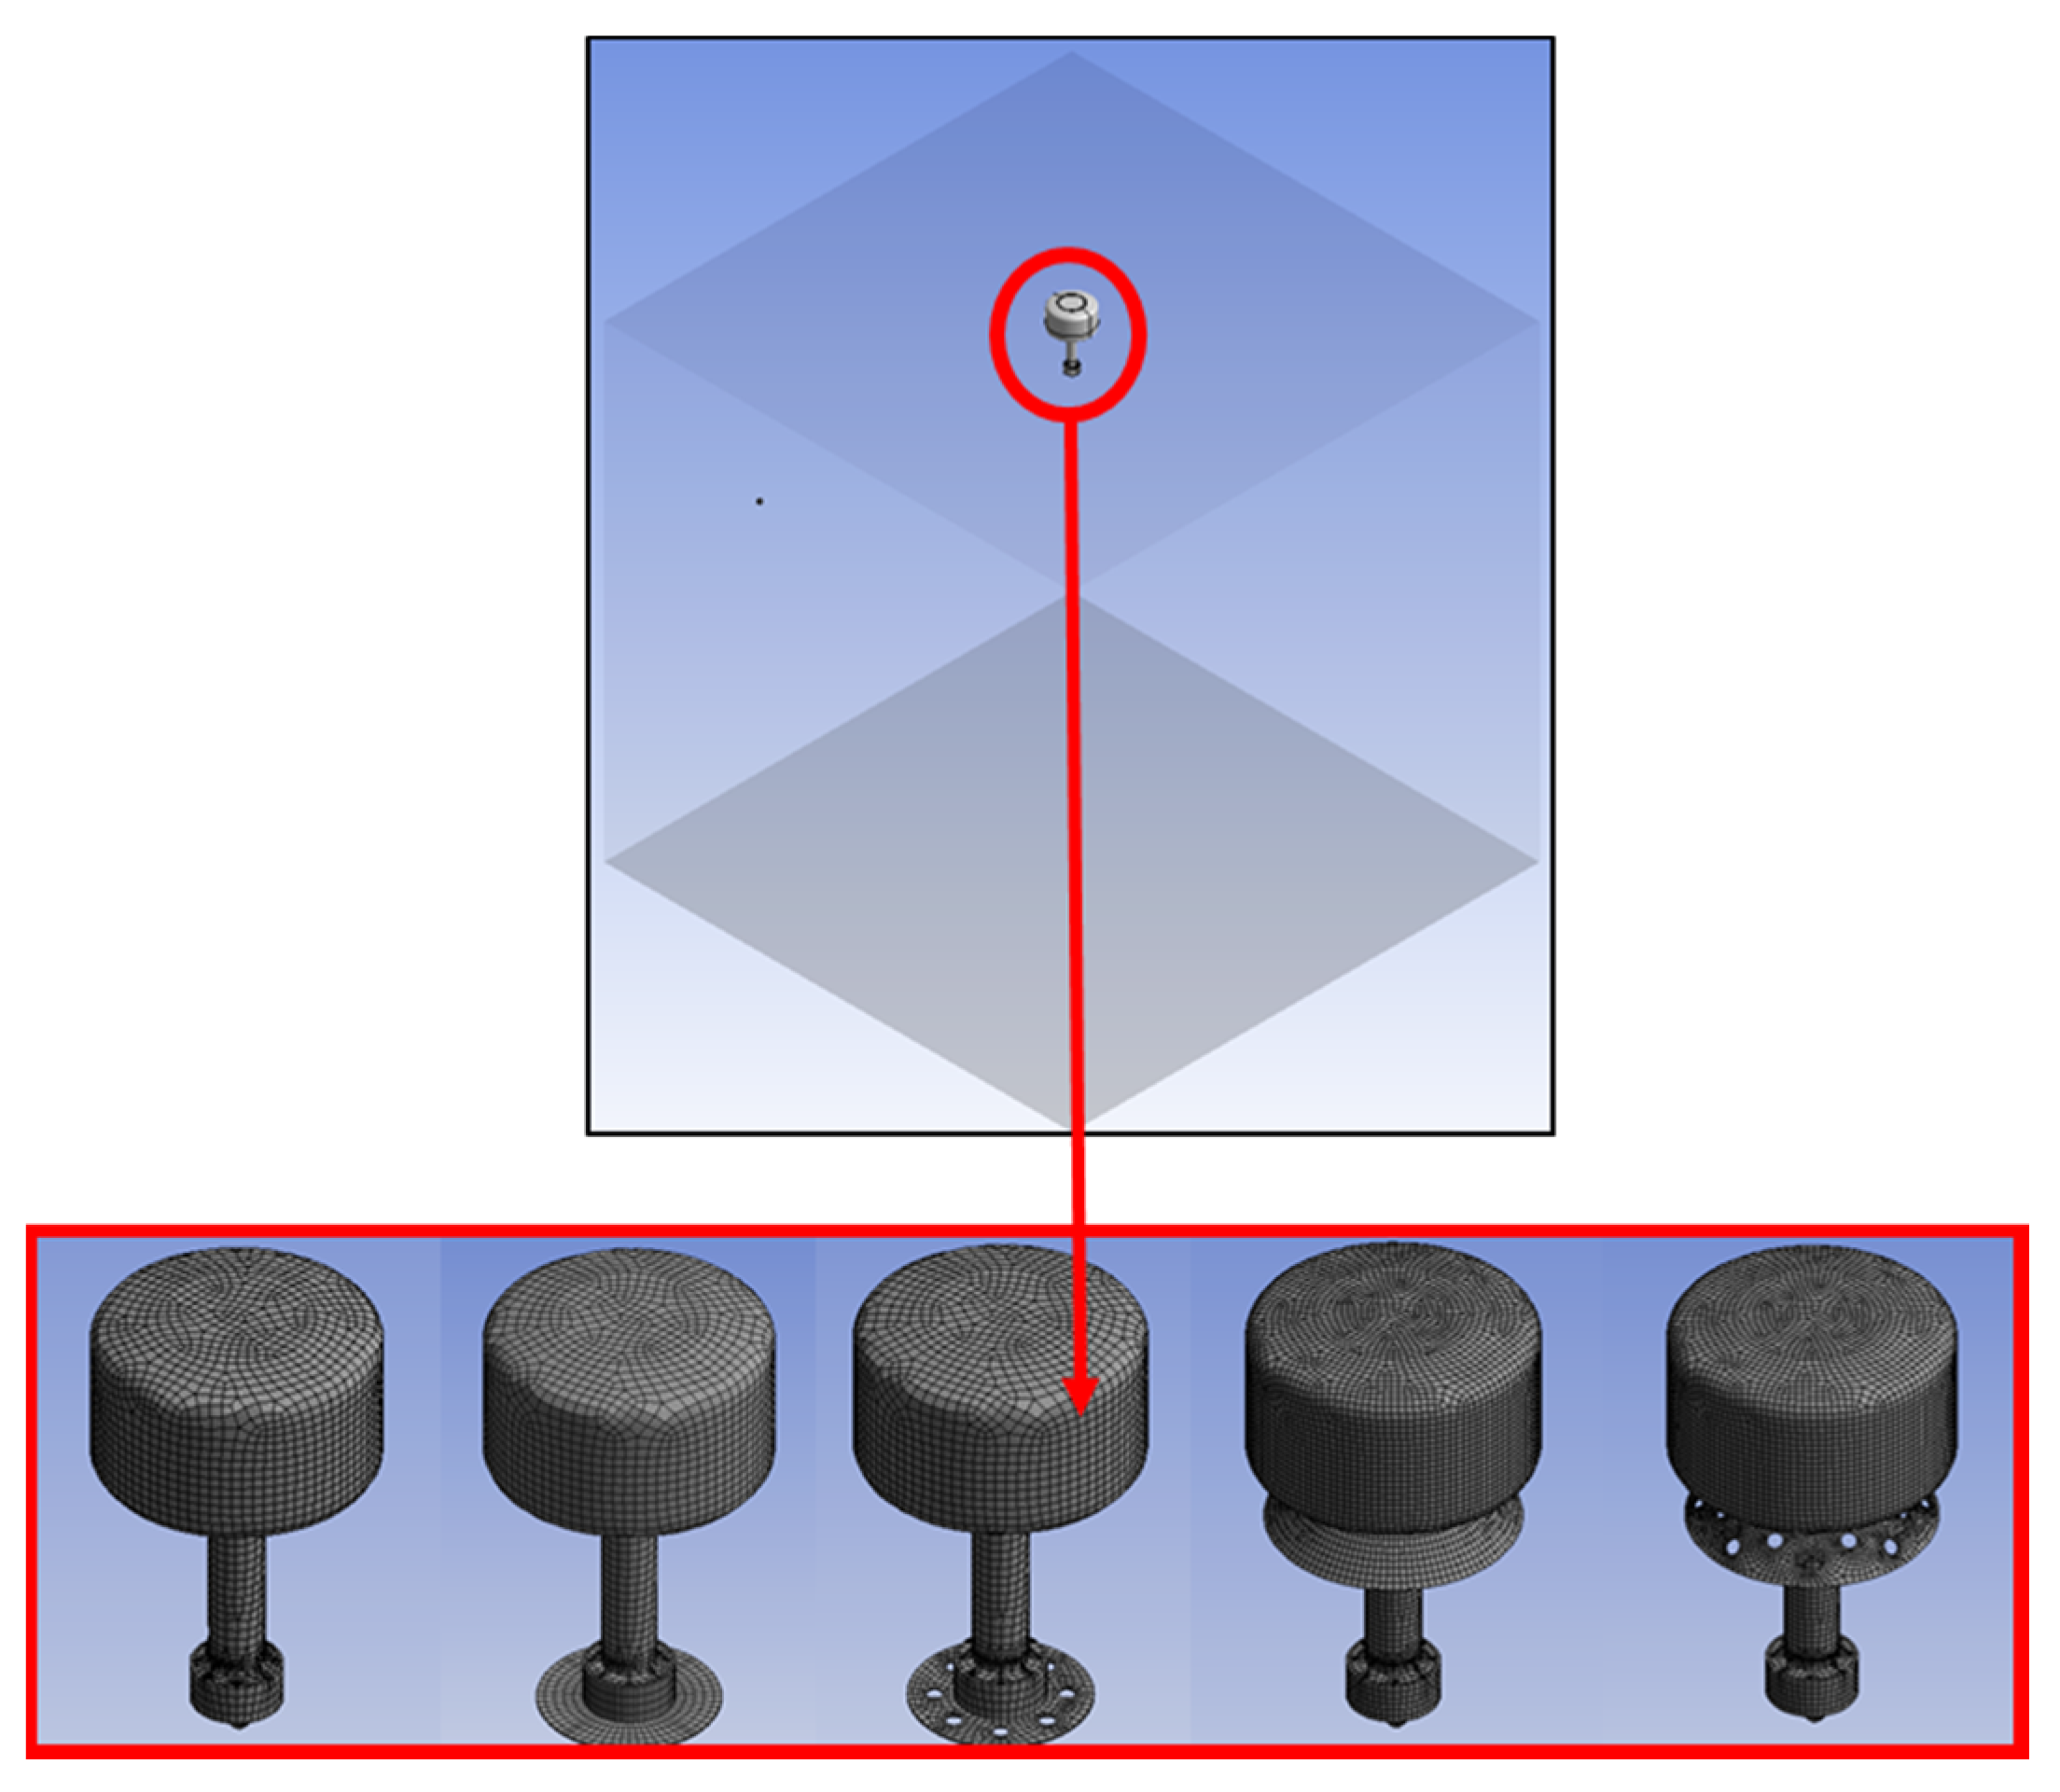
Figure 9 shows the grid system of the free decay test using CFD. The grid system was generated using surface remesher, trimmer mesh, and prism layer mesh in STAR-CCM+. Near the light buoy and free surface, grids are refined to accurately capture the complicated flow around the buoy including the appendage and free surface.

3.3.3. Results

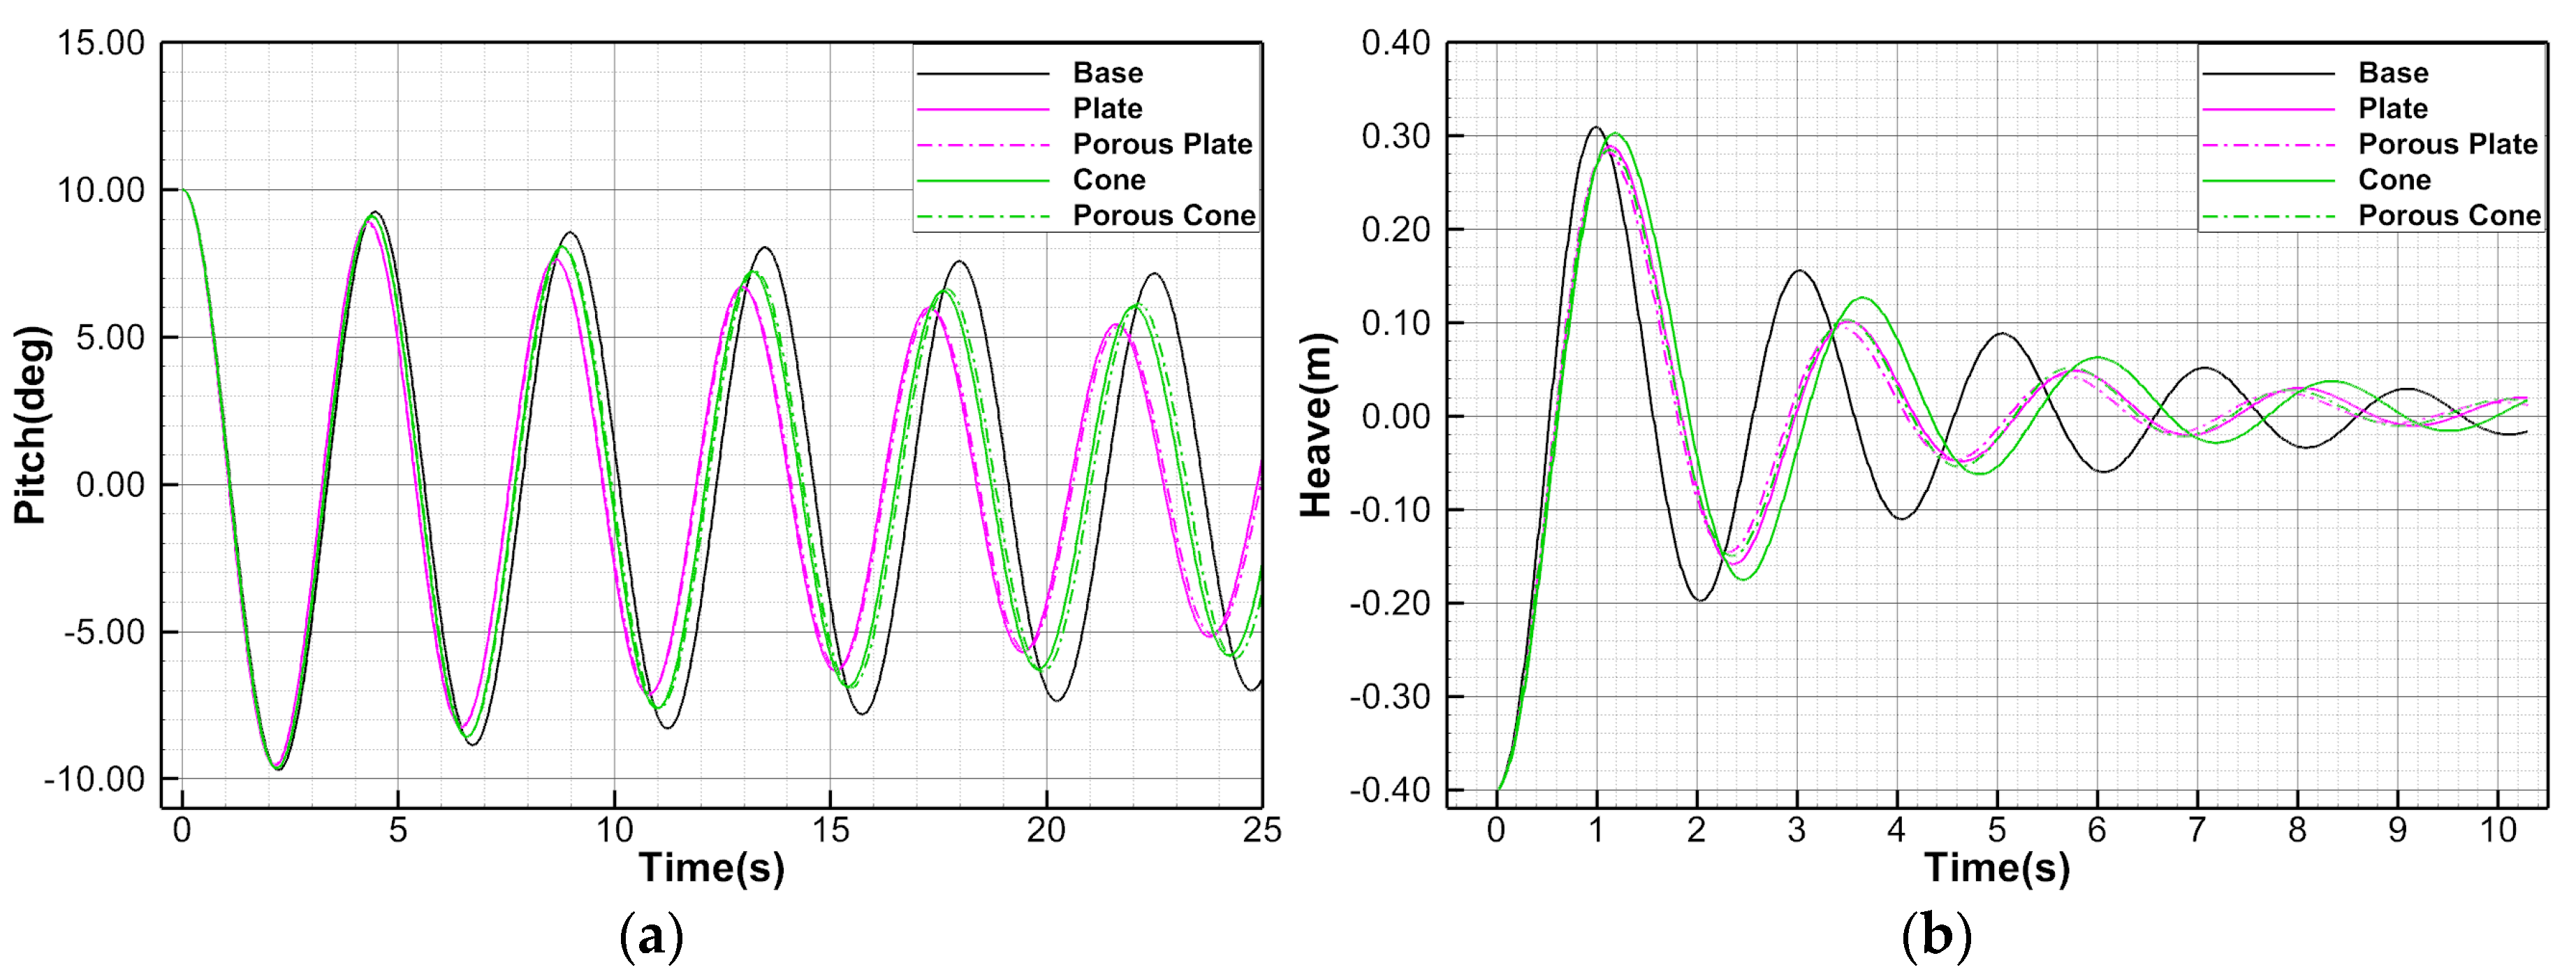
The free pitch and heave decay curves of the light buoys are shown in Figure 10. As seen in the figure, the decay of the motions becomes faster when the appendages are adopted. The plate-type appendages are more effective than the conical-type ones for the reduction of pitch motions, while the effect of the porous cone appendage is almost the same as that of the plate-type one in reducing heave motions.
Table 2 shows the estimated non-dimensional damping coefficient and natural frequencies of the light buoys from the free decay tests. With the adopted appendages, the pitch natural frequencies of the buoys became higher than those of the Base model, resulting from the increase in the restoring moment due to the increments in metacentric height (GM) and draft. The reason the heave natural frequencies of the models with appendages become 10%–15% smaller might be related to the change in mass and added mass, and the viscous and radiation damping.
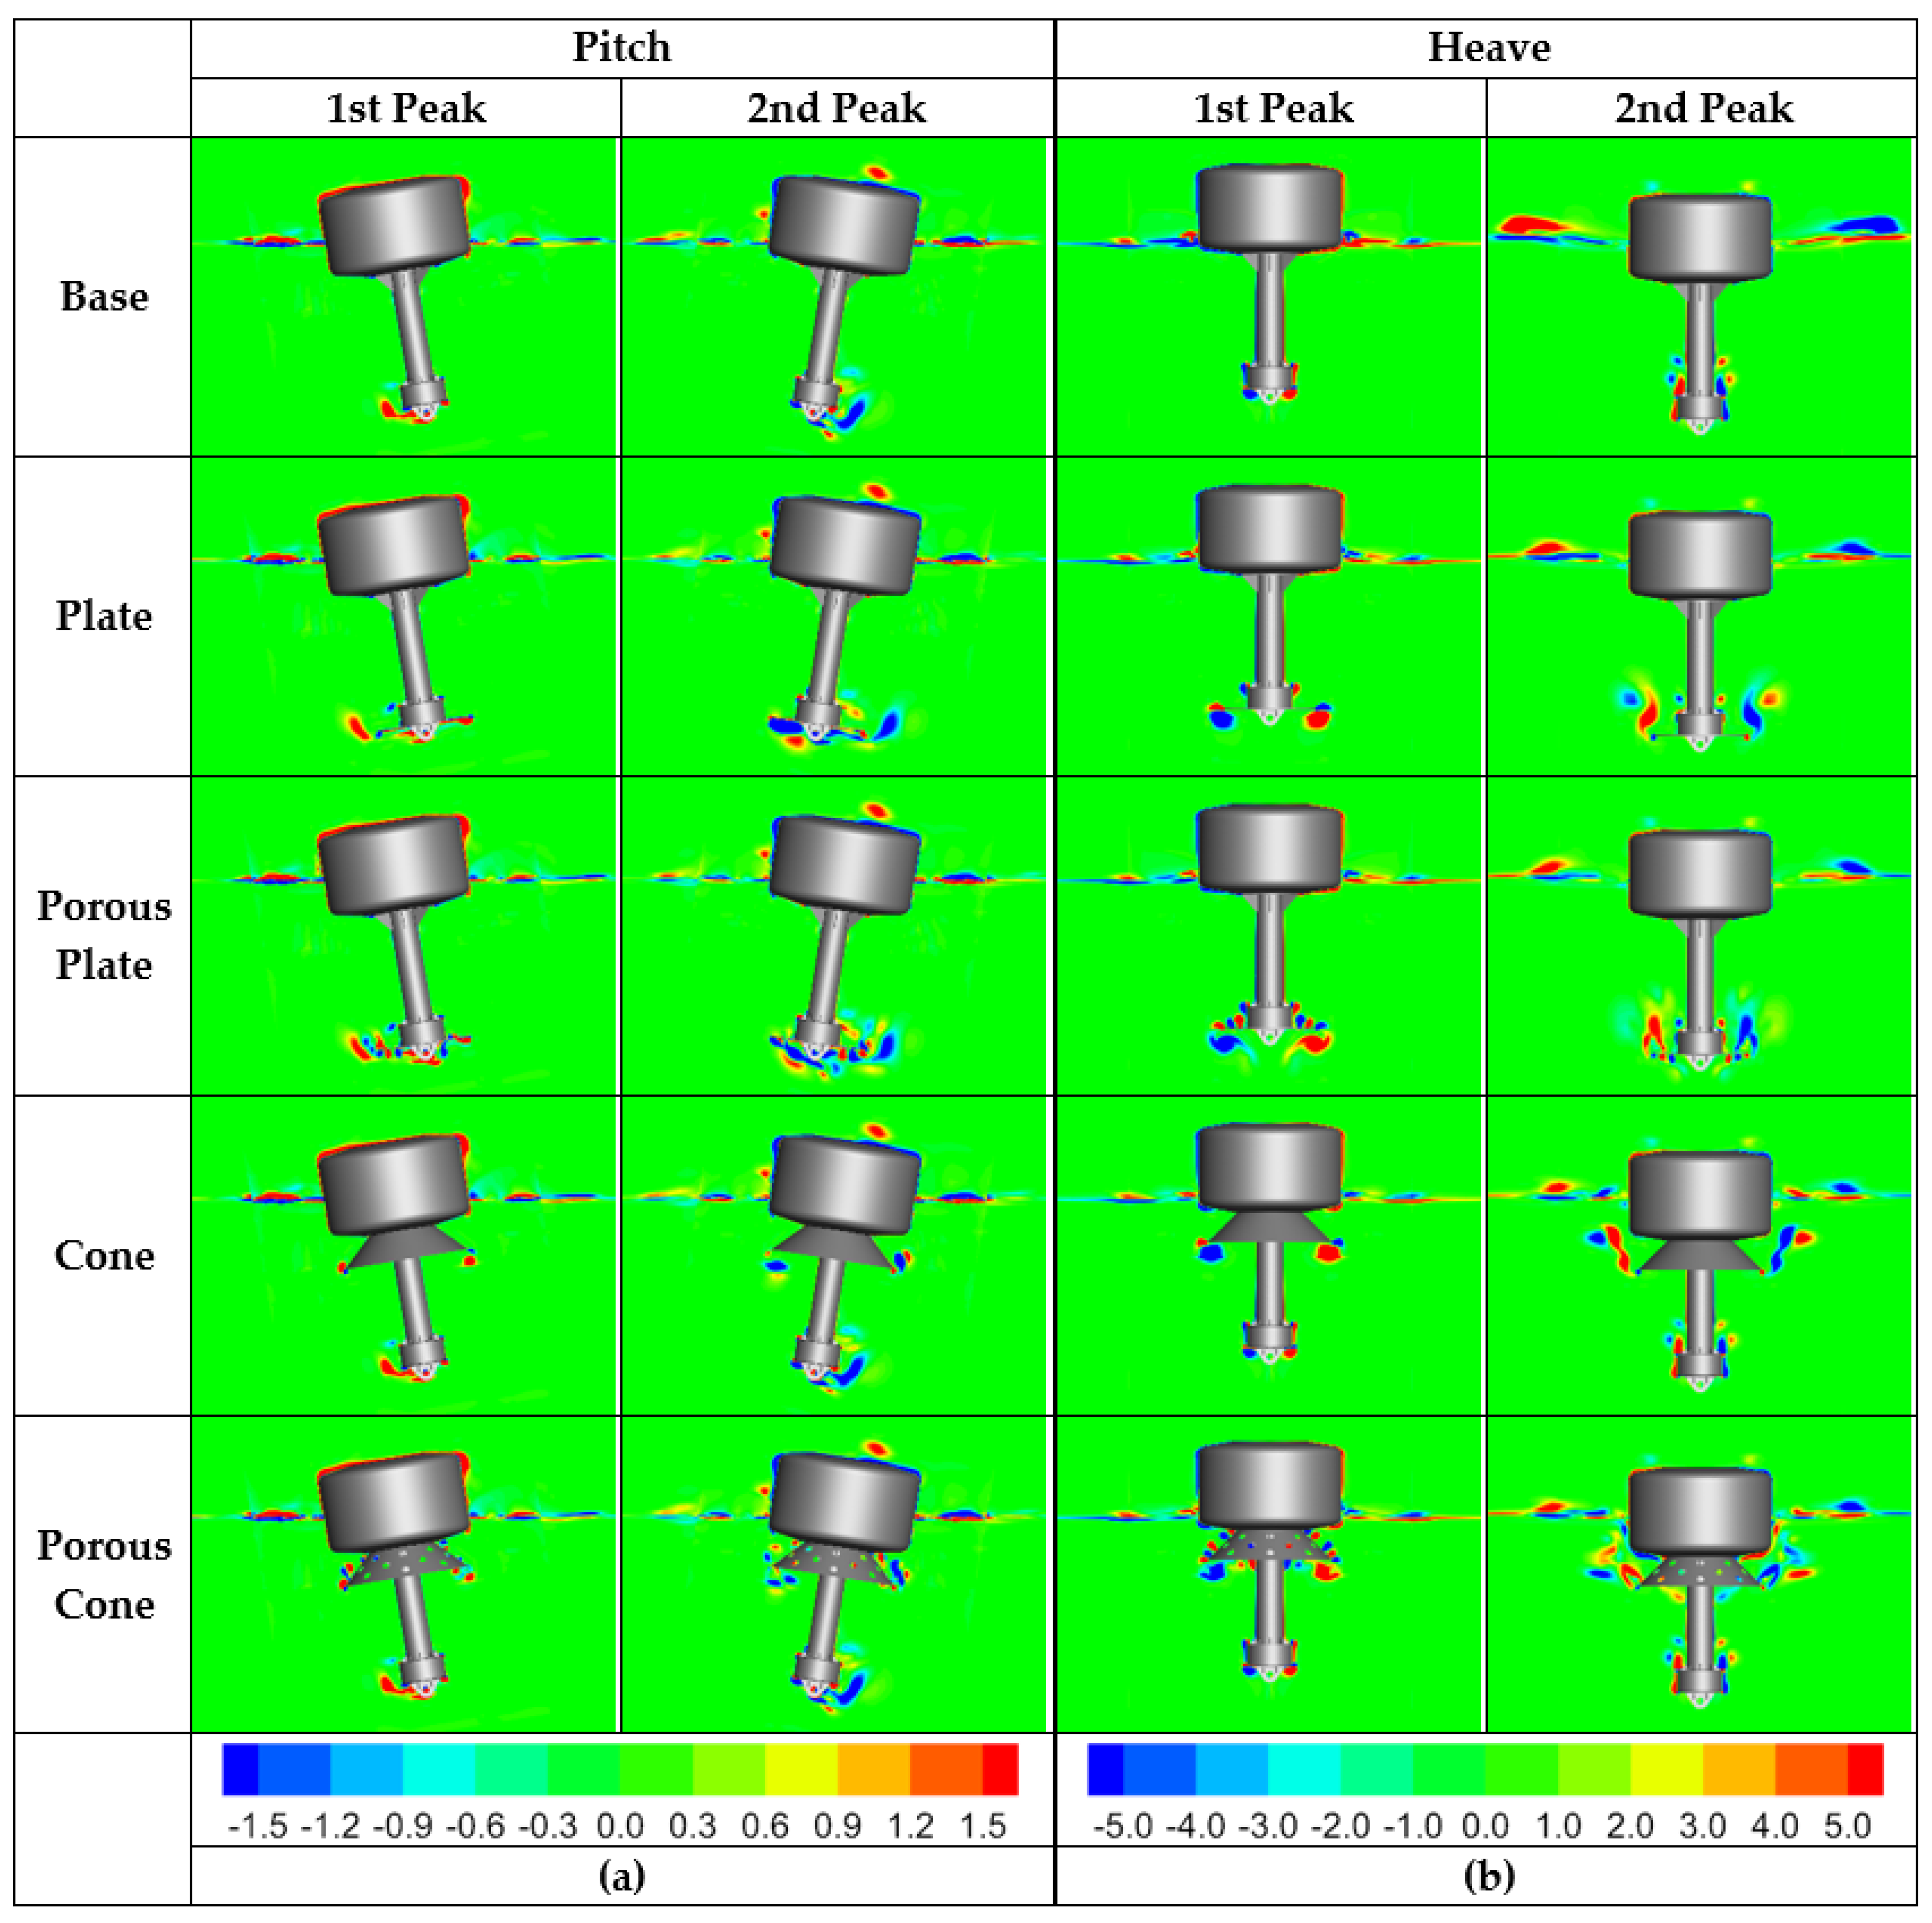
Figure 11 shows the vorticity distributions at the first and second peaks of motion, which were observed during the free decay simulations. Around the appendages, complicated flows and strong vortexes were observed, which led to high energy dissipations and strong viscous effects.

3.4. Potential-Based Motion Analysis

3.4.1. Computational Conditions

Figure 12 shows the computational domain and the panels on the surfaces of the light buoys. Heading waves with frequencies of 0.1 to 6.0 rad/s were considered. The maximum panel size was approximately 1/7 times that of the shortest wavelength. The minimum and maximum numbers of the generated panels were approximately 4000 and 18,300 for the Base and Porous Cone models, respectively. The motion analyses of the light buoys were performed using ANSYS-AQWA with and without the application of the viscous damping coefficients, which were estimated using CFD simulations, as discussed in the previous section.

3.4.2. Results

Table 3 lists the estimated coefficients of the added and total mass moment of inertia, the viscous and radiation damping, and the ratio of viscous damping to total damping for the pitch motion at the natural frequencies of each model from the potential-based motion analysis. As seen in the table, the added mass moment of inertia and viscous damping, which is much larger than the radiation damping, becomes larger with the adopted appendages, which may result in the reduction of motion.
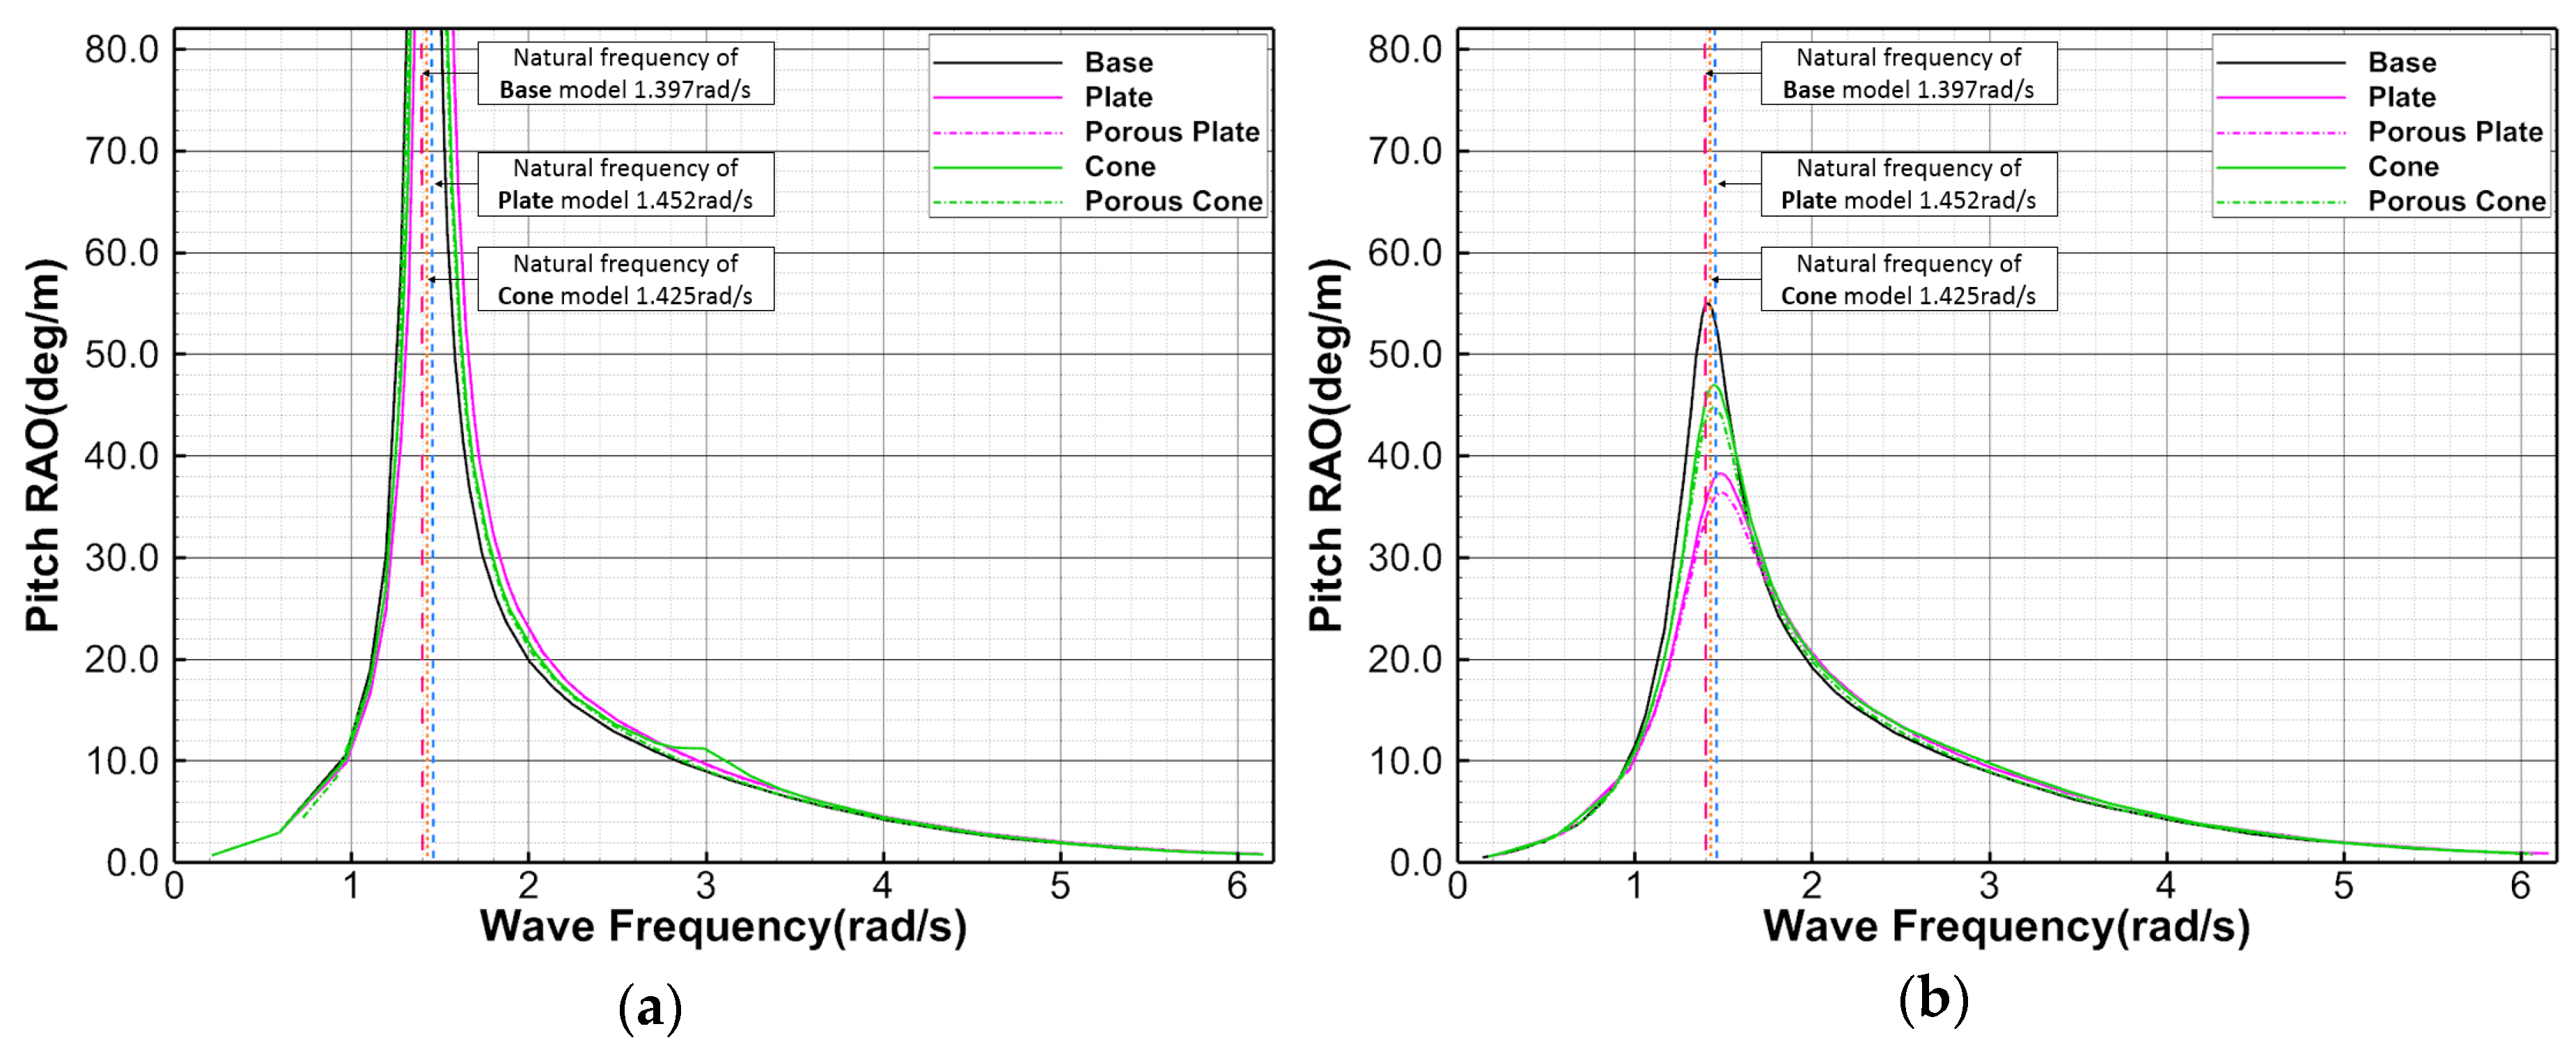
Figure 13 shows the pitch response amplitude operators (RAOs) of the buoys. Near the natural frequencies of the buoys, the RAOs of all models become very small when the viscous damping is considered. The maximum pitch motions are expected to be reduced by approximately 20%–40% with the adoption of the appendages. Because the radiation damping is small, and the viscous damping was estimated and applied from the CFD simulations of free decay tests, plate-type appendages are more effective than the conical-type ones.
Table 4 shows the estimated added mass, total mass, coefficients of viscous and radiation damping, and ratio of viscous damping to total damping for heave motion at the natural frequencies of each model from the potential-based motion analysis. Unlike for pitch motion, radiation damping is greater than viscous damping except for that of the Cone model. The reason for this can be easily deduced, as the vertical translation motion of a cylinder generates more waves than the rotation motion.
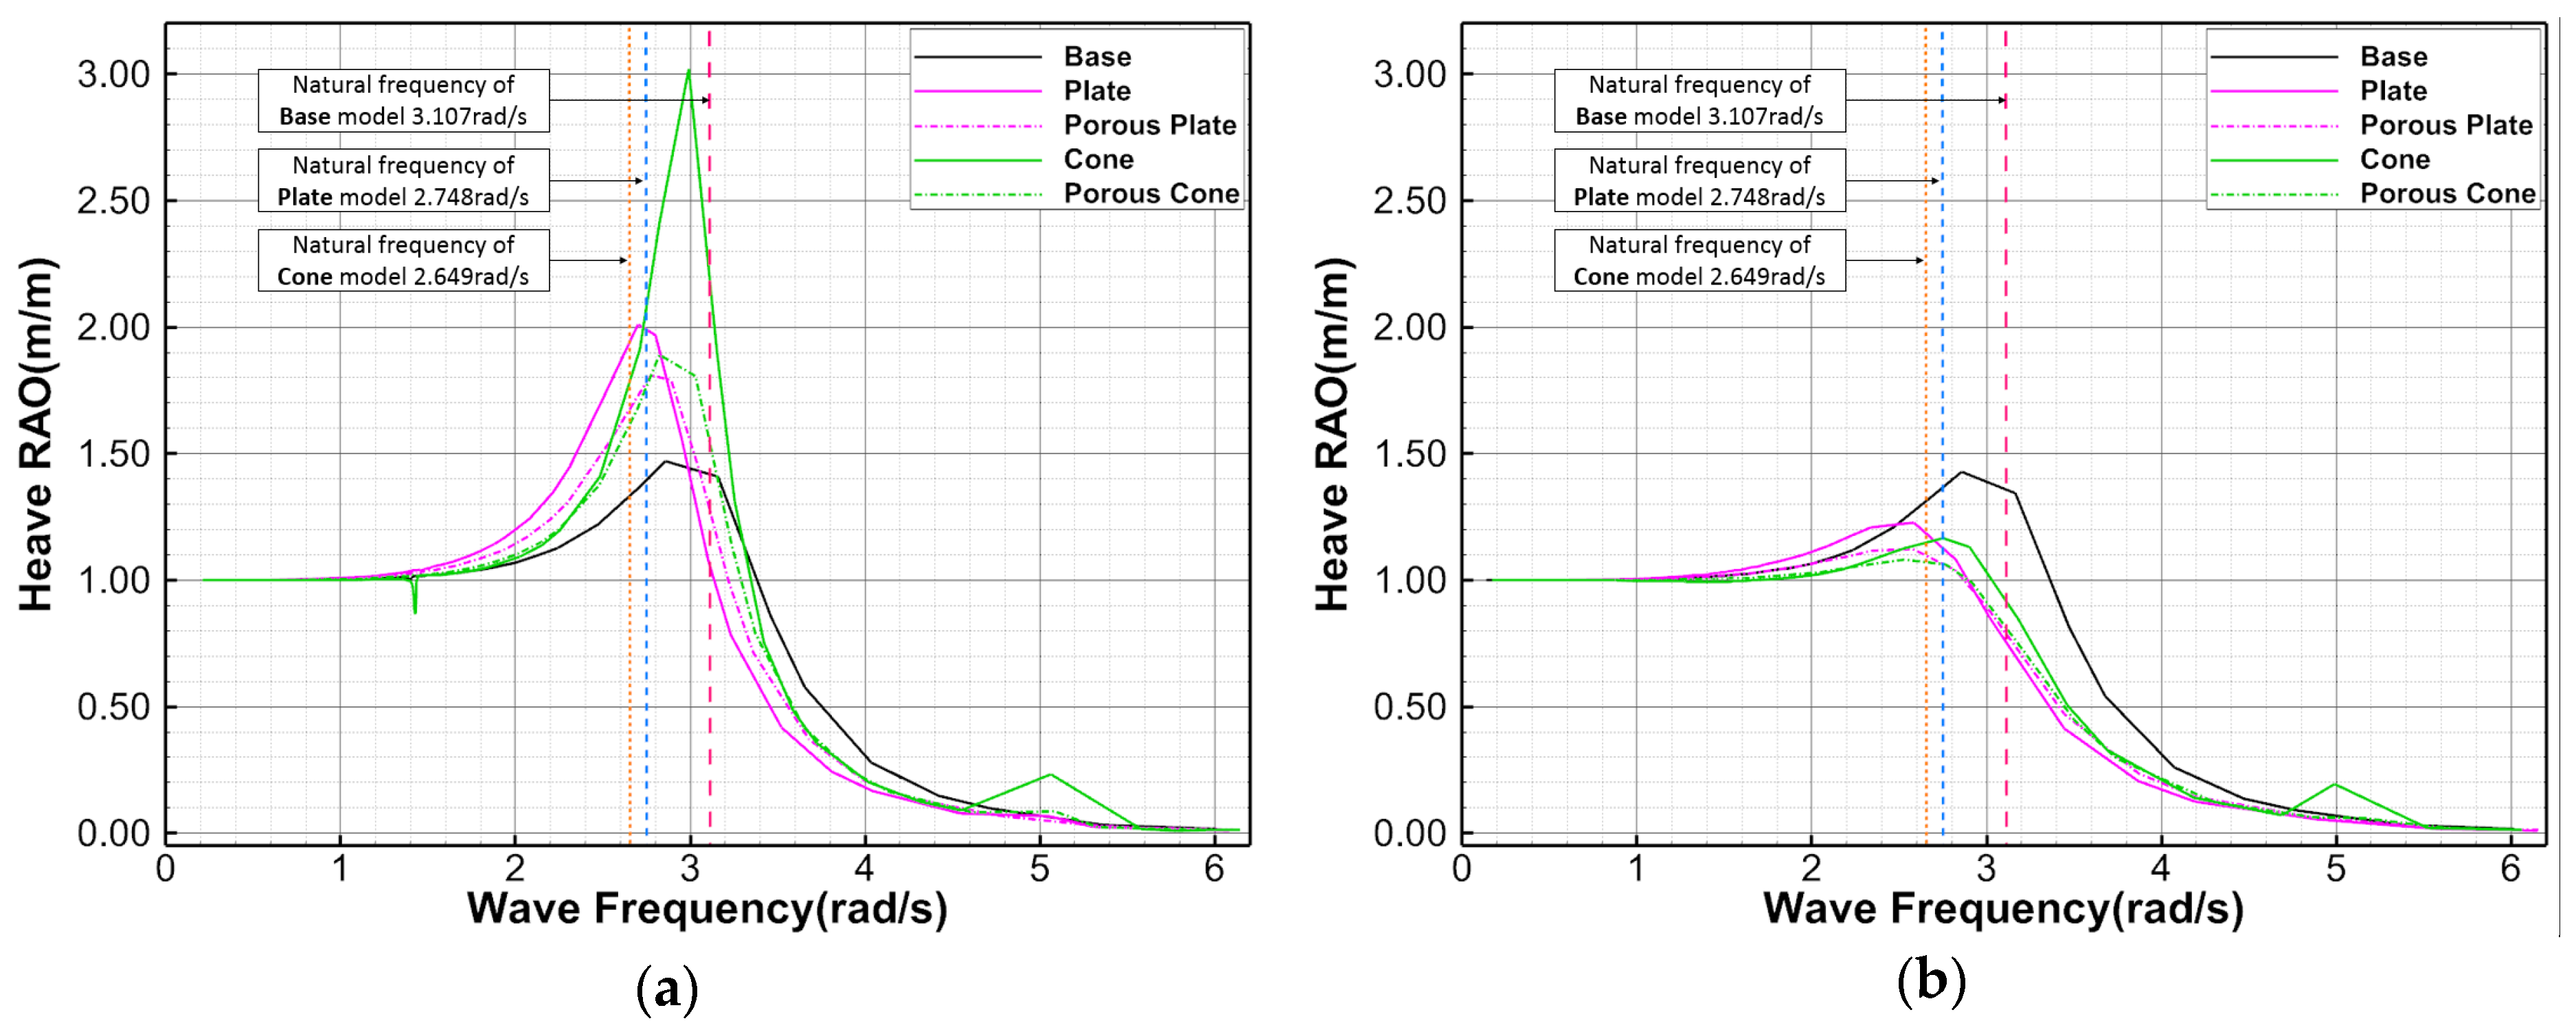
The heave RAOs of the light buoys without and with considering the viscous damping coefficients are shown in Figure 14. Near the natural frequencies of the buoys, the RAOs of the models with appendages become small when viscous damping is considered, while there is not much difference with the Base model. In the comparison of the maximum heave motions of each model, porous appendages are expected to be more effective than non-porous ones for all frequencies in reducing the heave motion even if the differences are not large.

3.5. Motion Simulation in Regular Waves Using CFD

3.5.1. Computational Domain and Grid System

Figure 15 shows the computational domain and boundary conditions for the motion simulation in regular waves using CFD. To enhance the accuracy of CFD simulations including waves, it is important to minimize the artificial diffusion of generated waves and wave reflections at boundaries. One of the methods to reduce wave reflection and computational cost while maintaining accuracy is the wave forcing method. As an inflow boundary condition, second-order Stokes wave theory was applied as the “velocity inlet” to express waves with the Euler-overlay method (EOM), which is a built-in forcing method of STAR-CCM+ [25,26]. In the overlay zone located from the inlet boundary to 2.4 m ahead of the buoy in the x-direction, analytic solutions and CFD solutions are gradually blended by applying source terms to VOF and momentum equations. No-slip conditions were imposed on the buoy surface and bottom boundary. For outflow boundary, the “pressure outlet” boundary condition was used while adopting grid damping technique [27] to minimize the wave reflection at the boundary. For the side boundaries, the “symmetry plane” boundary condition was used [25,26].
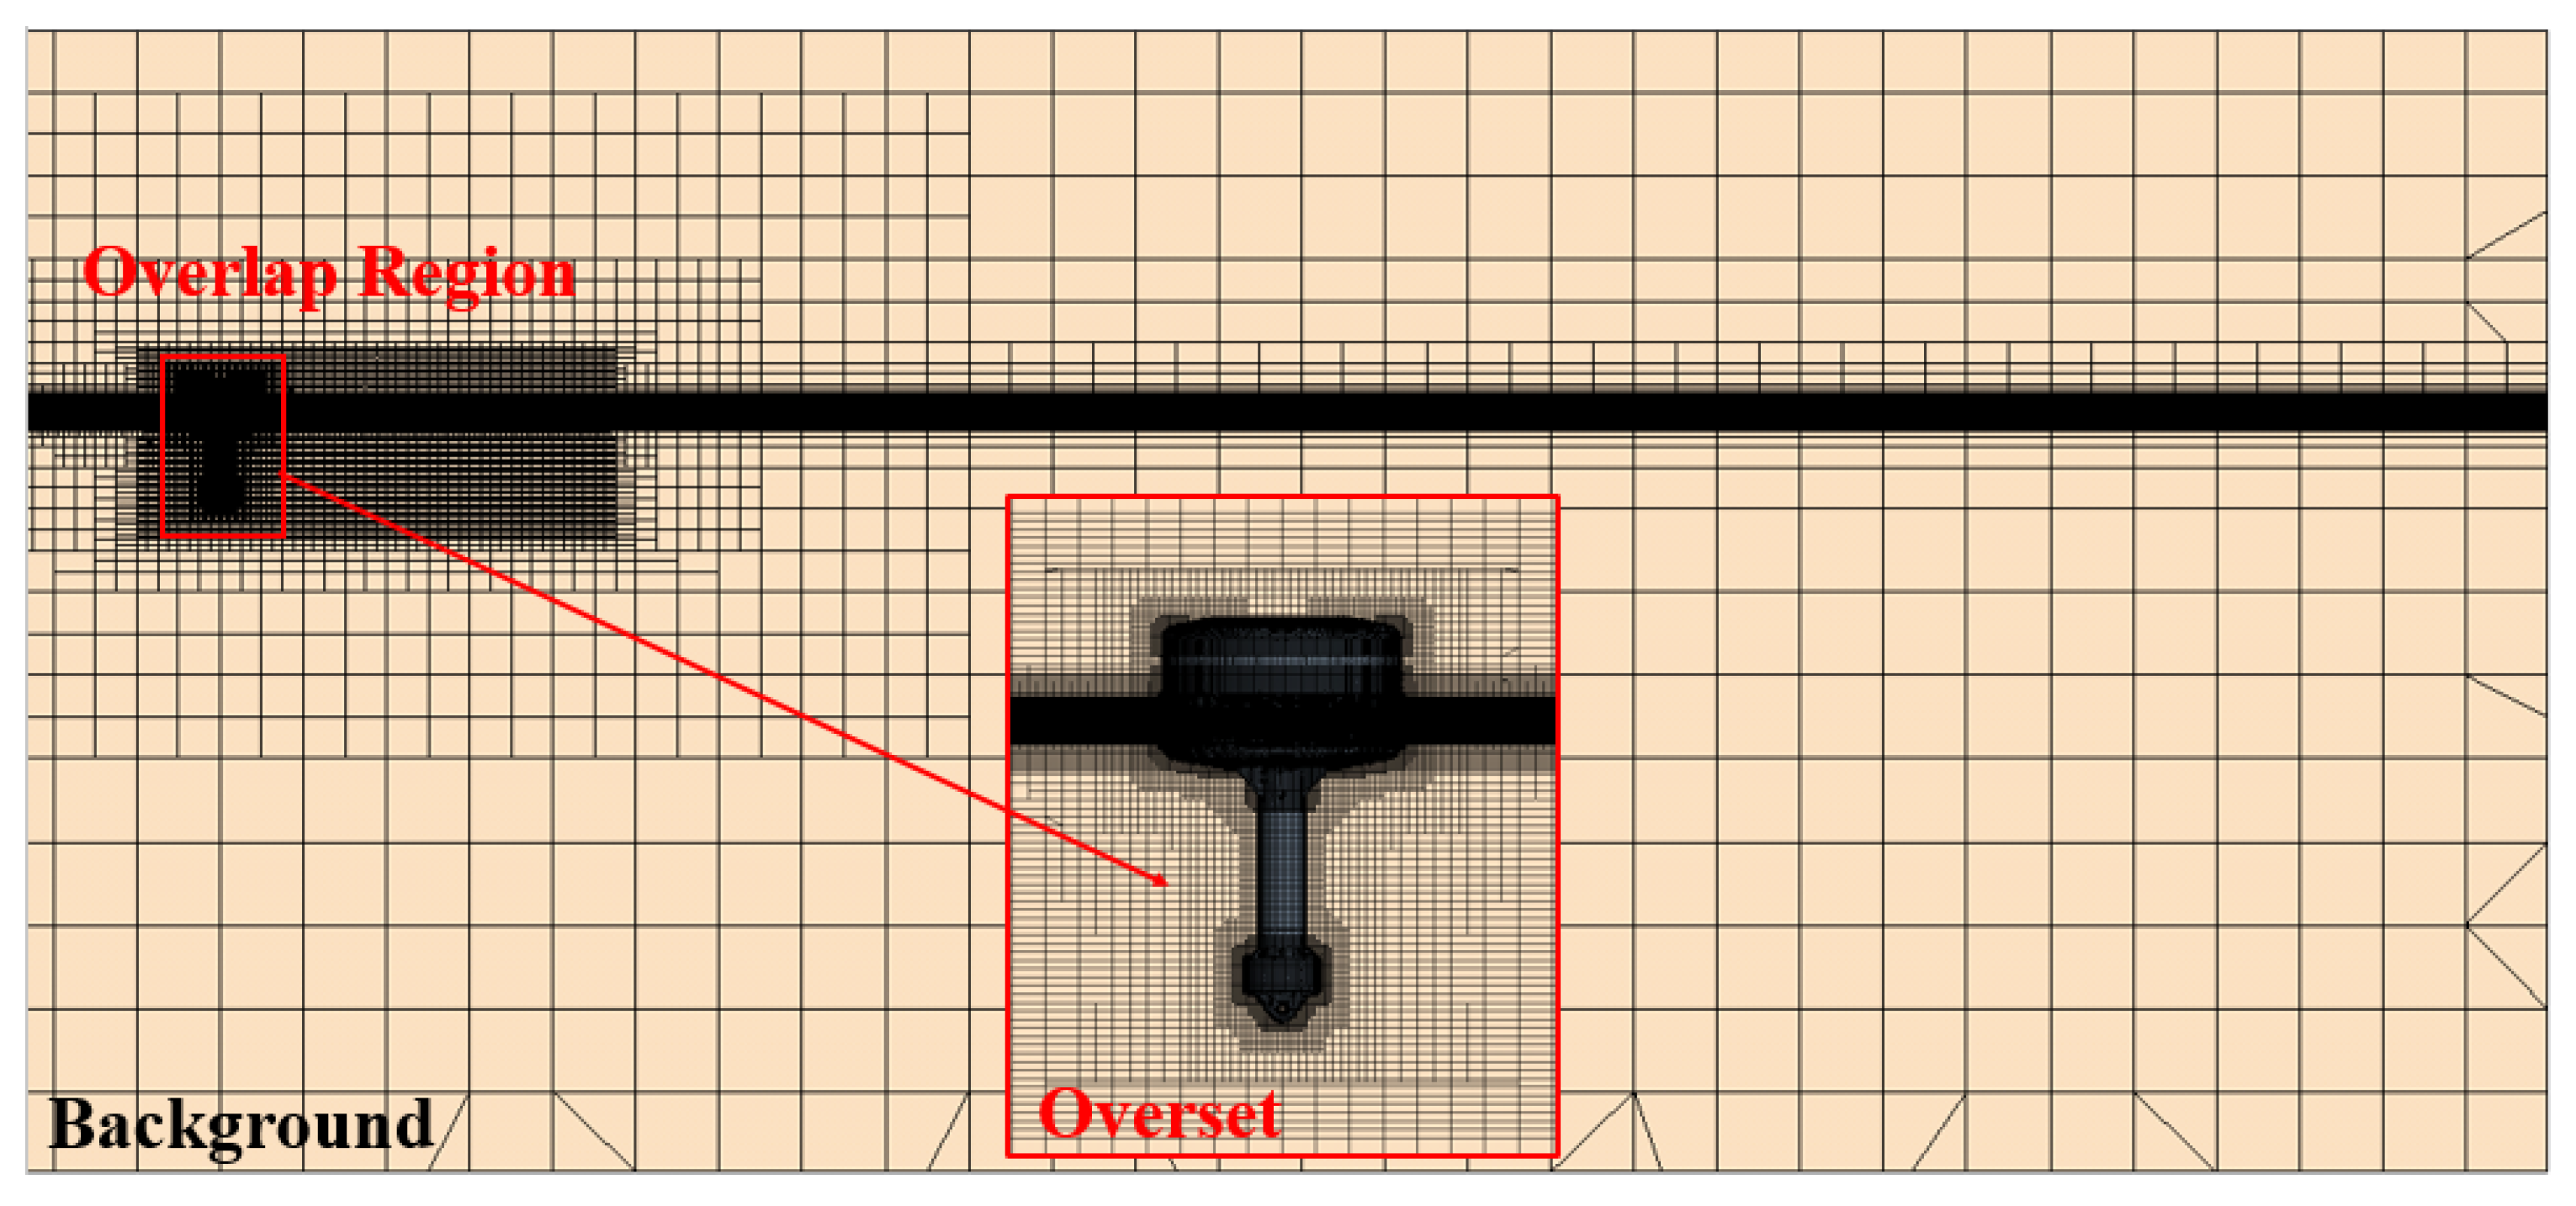
Figure 16 shows the grid system for the CFD simulations. The numbers of cells per wavelength and height were 140 and 30, respectively. The minimum and maximum numbers of the total generated cells were approximately 3.0 and 3.74 million for the Base and Porous Cone models, respectively.

3.5.2. Regular Wave Conditions for Motion Analysis Using CFD

Table 5 shows the wave conditions (i.e., simulation cases) for the CFD motion analysis. Eight waves of different wave frequencies, including the pitch and heave natural frequencies of the Base model, were selected. The amplitude of each wave was determined under the assumption that the wave steepness was 1/40.

3.5.3. Results

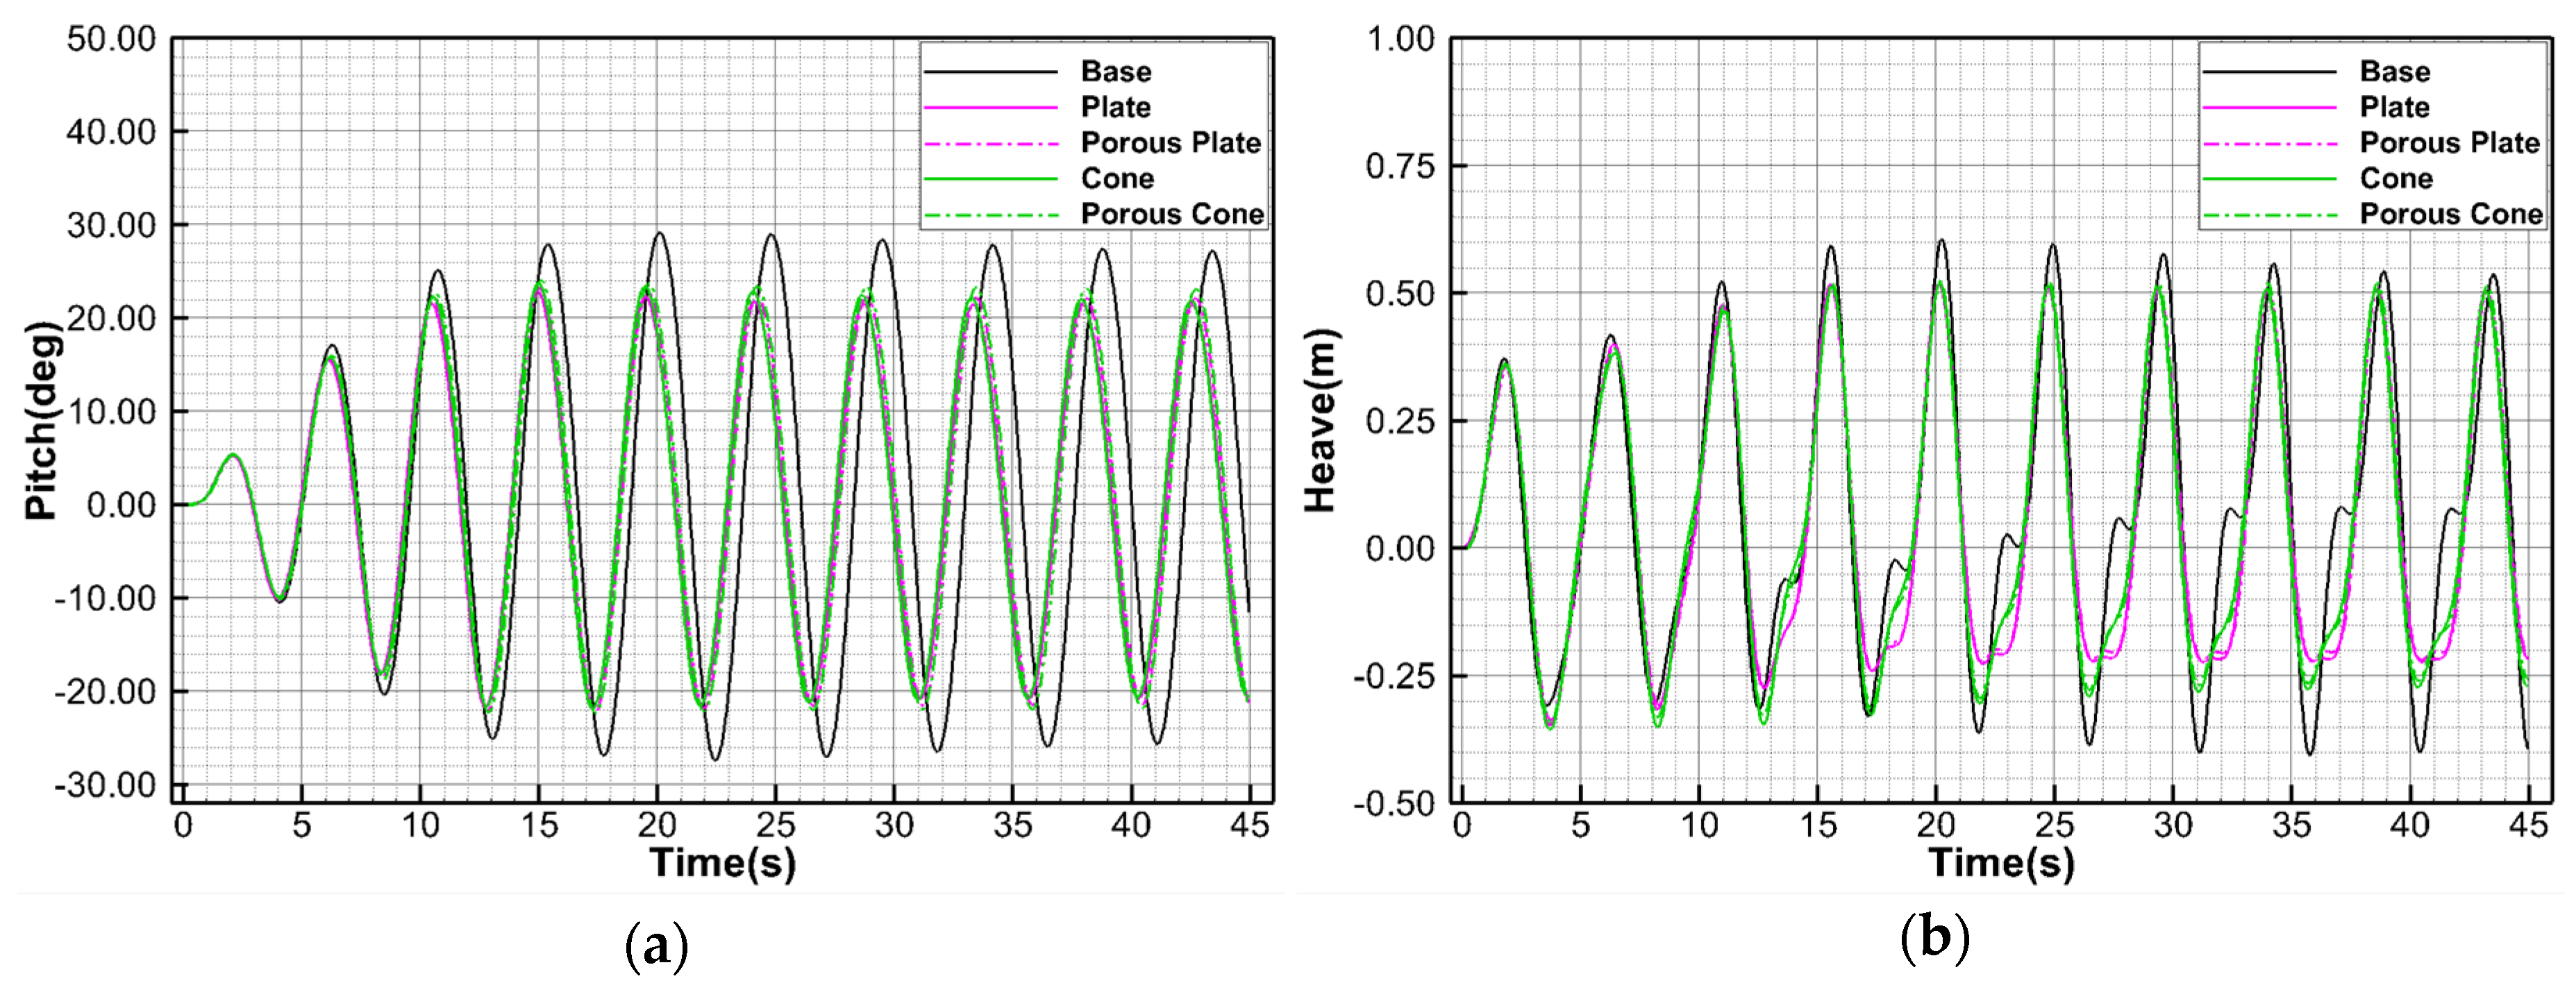
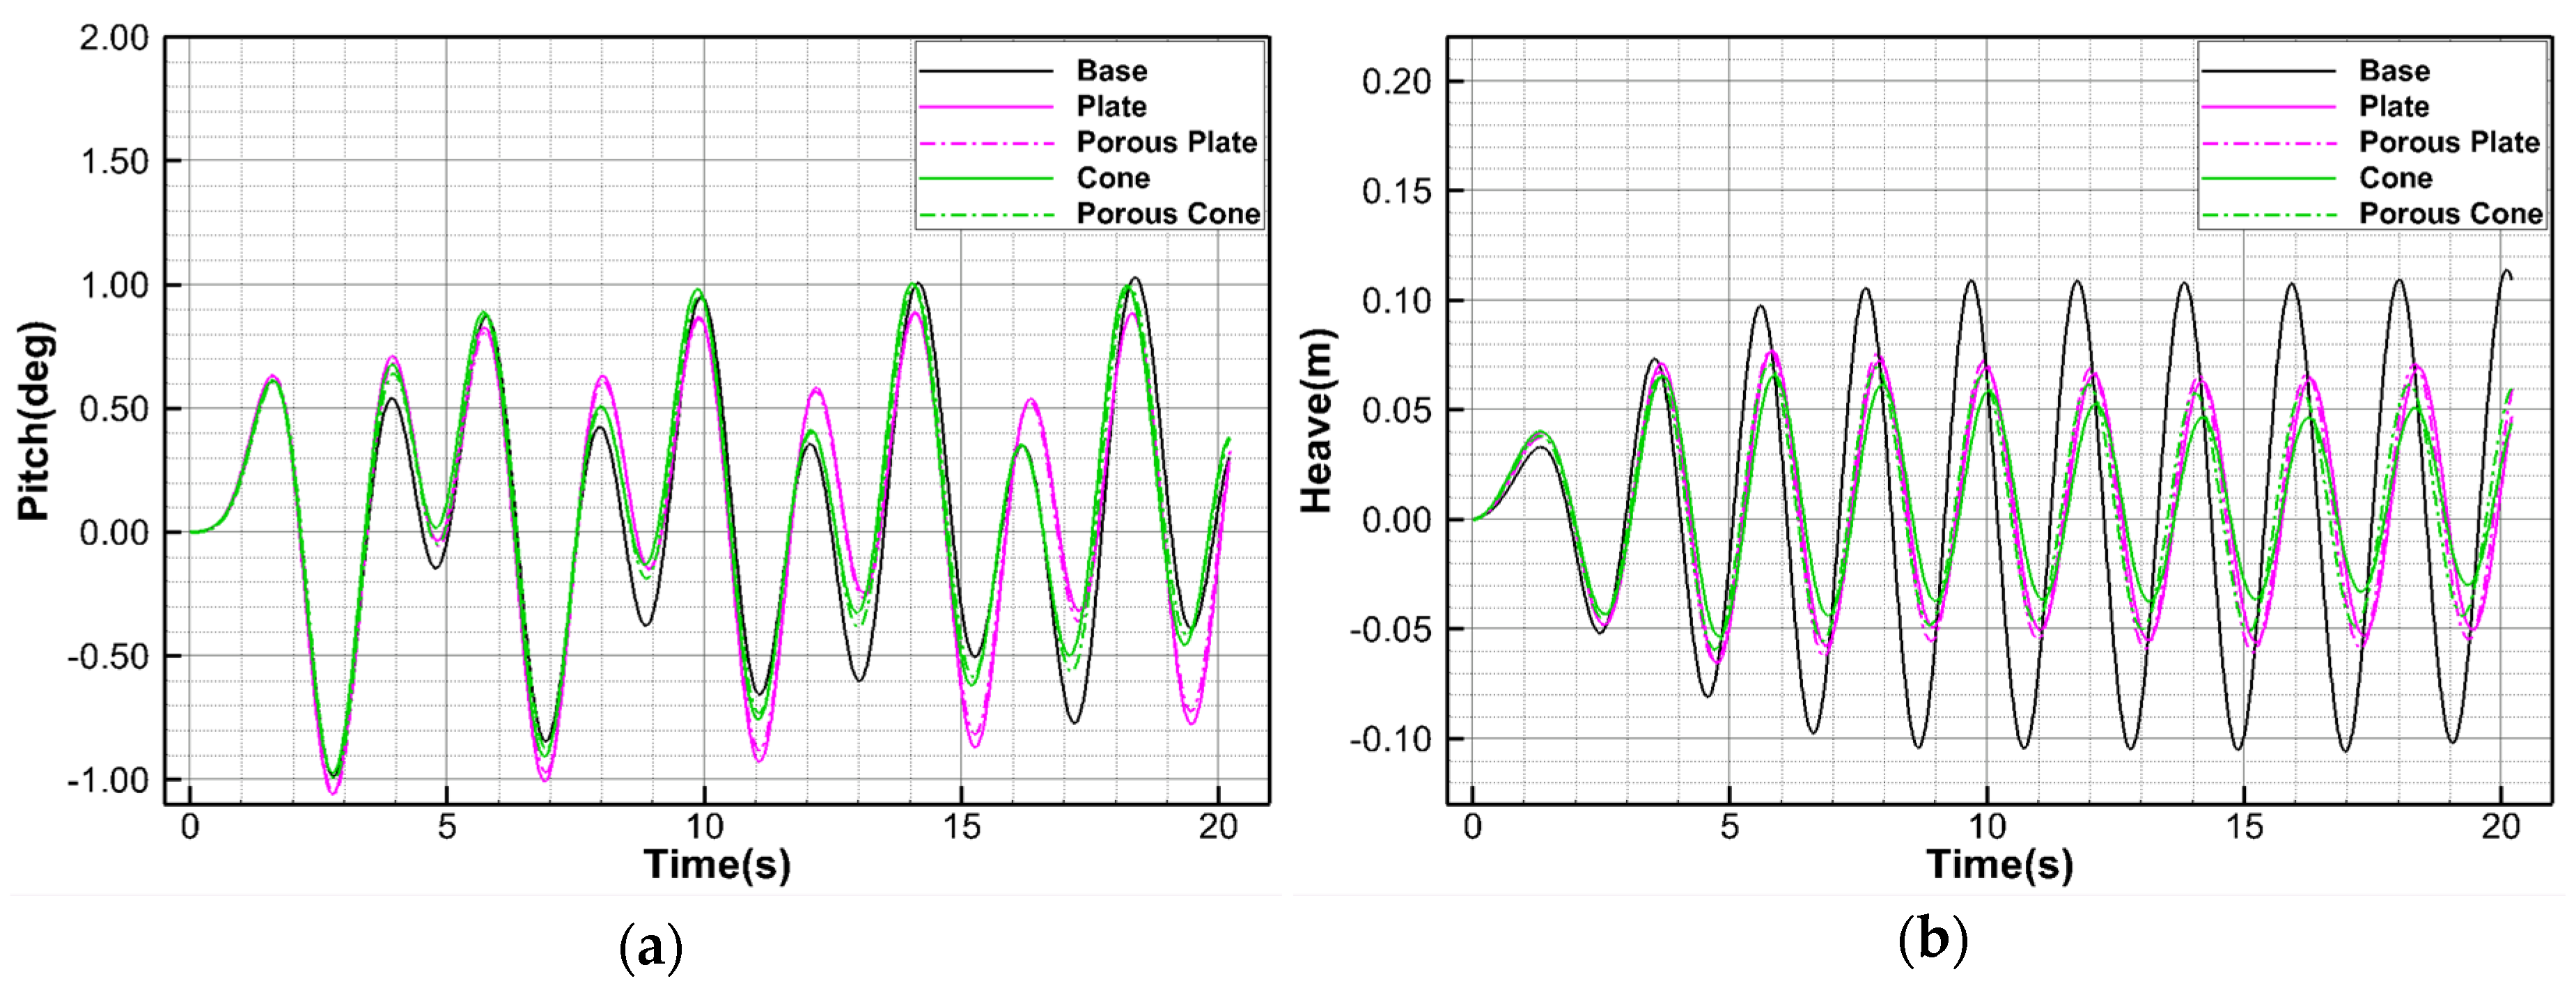
Figure 17 shows the time histories of the pitch and heave motions of a light buoy with and without appendages when the frequency of the heading wave was 1.397 rad/s, which is the same as that of the pitch natural frequency of the Base model. The corresponding wave height and length were 0.794 m and 31.583 m, respectively. The effectiveness of the appendages in terms of reducing both motions was confirmed, as shown in the potential-based simulations considering viscous damping. This can also be seen in Figure 18, which shows the snapshots of the free surface and the buoys when the 5th plus peak of the motion was observed. However, unlike the potential-based simulation results, the superiority of the effectiveness of each appendage is difficult to distinguish for the pitch motion, while the plate-type appendages seem to work better for heave motion.
Figure 19 shows the time histories of the pitch and heave motion of a light buoy with and without appendages when the frequency of the heading wave was 3.107 rad/s, which is the same as that of the heave natural frequency of the Base model. The corresponding wave height and length were 0.160 m and 6.385 m, respectively. The effectiveness of the appendages in reducing heave motions is clearly seen, while that of the cone-type appendages is trivial for the reduction of pitch motion.

3.6. Comparison of RAOs between the Potential-Based Motion Analysis and CFD Simulations

The comparison of pitch and heave RAOs, and the maximums of each motion between the potential-based motion analysis and CFD simulations are shown and listed in Figure 20 and Table 6, respectively. The pitch RAOs of both results near the natural frequencies of the buoys are expected to be reduced by adopting the appendages. Although the quantitative superiority of the appendages is different, the qualitative superiority is similar between the results of the potential-based and CFD simulations. In addition, if the frequency of the wave is far from that of the natural frequency of the buoys, there is not a large discrepancy in the RAO by both simulations. In the case of heave RAO, discrepancies exit in the low-frequency region, although the effectiveness of the appendages is confirmed near the heave natural frequencies of each model. There may be some reasons for these differences. First, the viscous damping coefficient was evaluated by subtracting the radiation damping coefficient at the natural frequency of the buoy from the total damping coefficient. Second, the wave heights in the low-frequency region are relatively high because the wave steepness is fixed, which may enhance the non-linearity of the motion. The complex interactions among the incoming wave, flows, and vortex around the buoy, and flows near the buoy, may also be causing these differences.

4. Conclusions

In this study, motion analyses for a newly developed lightweight light buoy in waves were performed to predict the buoy’s motion performance and check the effect of the developed appendages on the performance. First, free decay tests using CFD including benchmark cases for the validation were carried out to estimate the viscous damping coefficients, which cannot be obtained by potential-based simulations. The results for the validation were in good agreement with those of the reference. Second, potential-based simulations with and without considering the viscous damping coefficients were performed, and the results were compared. From the results, it was confirmed that viscous damping should be considered when the frequency of an incoming wave is close to the natural frequency of the buoy. Finally, motion simulations in regular waves using CFD were carried out to compare the RAOs and maximums of motions with those obtained from a potential-based simulation considering viscous damping. The RAOs of both results near the natural frequencies of the buoys were expected to be reduced by adopting the appendages. Although the quantitative superiority of the appendages was different, the qualitative superiority was similar for both results. The present methods and results would be useful not only for a buoy but for other cylindrical floating structures, such as spars and wave energy converters. Motion simulations in irregular waves using CFD will be carried out to compare its RAO and motion response with those by potential-based simulation.

Author Contributions

Conceptualization, B.-H.S. and S.-M.J.; methodology, S.-M.J. and C.-Y.L..; validation, B.-H.S.; formal analysis, B.-H.S.; investigation, S.-M.J. and C.-Y.L.; resources, S.-M.J.; writing—original draft preparation, S.-M.J.; writing—review and editing, S.-M.J. and C.-Y.L.; visualization, B.-H.S.; supervision, S.-M.J. and C.-Y.L.; funding acquisition, S.-M.J. All authors have read and agreed to the published version of the manuscript.

Funding

This study was supported by research fund from Chosun University (K207177002).

Conflicts of Interest

The authors declare no conflict of interest.

References

  1. Jeong, S.M.; Son, B.H.; Ko, S.W.; Park, S.H.; Jeong, D.S. Stability evaluation of light-buoys combined with 7 nautical mile self-contained lantern. In Proceedings of the Oceans-MTS/IEEE Kobe Techno-Oceans (OTO), Kobe, Japan, 28–31 May 2018. [Google Scholar]
  2. Son, B.H.; Ko, S.W.; Yang, J.H.; Jeong, S.M. Motion analysis of light buoys combined with 7 nautical mile self-contained lantern. J. Korean Soc. Mar. Environ. Saf. 2018, 24, 628–636. [Google Scholar] [CrossRef]
  3. Bhinder, M.A.; Murphy, J. Evaluation of the viscous drag for a domed cylindrical moored wave energy converter. J. Mar. Sci. Eng. 2019, 7, 120. [Google Scholar] [CrossRef] [Green Version]
  4. Kim, M.G.; Jung, K.H.; Park, S.B.; Suh, S.B.; Park, I.R.; Kim, J.; Kim, K.S. Experimental study on viscous effect in roll and heave motions of a rectangular structure. Ocean Eng. 2019, 171, 250–258. [Google Scholar] [CrossRef]
  5. Evans, D.V.; Jerey, D.C.; Salter, S.H.; Taylor, J.R.M. Submerged cylinder wave energy device: Theory and experiment. Appl. Ocean. Res. 1979, 1, 3–12. [Google Scholar] [CrossRef]
  6. Jung, K.H.; Chang, K.A.; Huang, E.T. Two-dimensional flow characteristics of wave interactions with a free-rolling rectangular structure. Ocean Eng. 2005, 32, 1–20. [Google Scholar] [CrossRef]
  7. Jung, K.H.; Chang, K.A.; Jo, H.J. Viscous effect on the roll motion of a rectangular structure. J. Eng. Mech. 2006, 132, 190–200. [Google Scholar] [CrossRef]
  8. Bhattacharyya, R. Dynamics of Marine Vehicles, 1st ed.; John Wiley & Sons Inc.: Hoboken, NJ, USA, 1978; pp. 75–80. [Google Scholar]
  9. Journée, J.M.J.; Massie, W.W. Offshore Hydromechanics; Lecture Notes; Delft University of Technology: Delft, The Netherlands, 2001. [Google Scholar]
  10. Wassermann, S.; Feder, D.F.; Abdel-Maksoud, M. Estimation of ship roll damping—A comparison of the decay and the harmonic excited roll motion technique for a post panamax container ship. Ocean Eng. 2016, 120, 371–382. [Google Scholar] [CrossRef]
  11. Wilson, R.V.; Carrica, P.M.; Stern, F. Unsteady rans method for ship motions with application to roll for a surface combatant. Comput. Fluids 2006, 35, 501–524. [Google Scholar] [CrossRef]
  12. Irkal, M.A.R.; Nallayarasu, S.; Bhattacharyya, S.K. Cfd approach to roll damping of ship with bilge keel with experimental validation. Appl. Ocean Res. 2016, 55, 1–17. [Google Scholar] [CrossRef]
  13. Song, S.S.; Kim, S.H.; Paik, K.J. Determination of linear and nonlinear roll damping coefficients of a ship section using CFD. Teorija i Praksa Brodogradnje i Pomorske Tehnike 2019, 70, 17–33. [Google Scholar] [CrossRef]
  14. Kianejad, S.S.; Lee, J.S.; Liu, Y.; Enshaei, H. Numerical assessment of roll motion characteristics and damping coefficient of a ship. J. Mar. Sci. Eng. 2018, 6, 101. [Google Scholar] [CrossRef] [Green Version]
  15. Zhang, X.; Zeng, Q.; Liu, Z. Hydrodynamic performance of rectangular heaving buoys for an integrated floating breakwater. J. Mar. Sci. Eng. 2019, 7, 239. [Google Scholar] [CrossRef] [Green Version]
  16. Luan, Z.; He, G.; Zhang, Z.; Jing, P.; Jin, R.; Geng, B.; Liu, C. Study on the optimal wave energy absorption power of a float in waves. J. Mar. Sci. Eng. 2019, 7, 269. [Google Scholar] [CrossRef] [Green Version]
  17. Mohapatra, S.C.; Islam, H.; Guedes Soares, C. Wave diffraction by a floating fixed truncated vertical cylinder based on Boussinesq equations. In Renewable Energy Offshore; Taylor & Francis: London, UK, 2019; pp. 281–289. [Google Scholar]
  18. Koh, H.J.; Cho, I.H. Heave motion response of a circular cylinder with the dual damping plates. Ocean Eng. 2016, 125, 95–102. [Google Scholar] [CrossRef]
  19. Tao, L.; Cai, S. Heave motion suppression of a spar with a heave plate. Ocean Eng. 2004, 31, 669–692. [Google Scholar] [CrossRef] [Green Version]
  20. Zhu, L.; Lim, H.C. Hydrodynamic characteristics of a separated heave plate mounted at a vertical circular cylinder. Ocean Eng. 2017, 131, 213–223. [Google Scholar] [CrossRef]
  21. Sudhakar, S.; Nallayarasu, S. Hydrodynamic responses of spar hull with single and double heave plates in random waves. Int. J. Ocean Syst. Eng. 2013, 4, 188–208. [Google Scholar] [CrossRef] [Green Version]
  22. Sudhakar, S.; Nallayarasu, S. Hydrodynamic response of spar with single and double heave plates in regular waves. Int. J. Ocean Syst. Eng. 2014, 4, 1–18. [Google Scholar] [CrossRef] [Green Version]
  23. Koh, H.J.; Kim, J.R.; Cho, I.H. Model test for heave motion reduction of a circular cylinder by a damping plate. J. Ocean. Eng. Tech. 2013, 27, 76–82. [Google Scholar] [CrossRef] [Green Version]
  24. Palm, J.; Eskilsson, C.; Paredes, G.M.; Bergdahl, L. Coupled mooring analysis for floating wave energy converters using cfd: Formulation and validation. Int. J. Mar. Energy 2016, 16, 83–99. [Google Scholar] [CrossRef] [Green Version]
  25. Lee, Y.G.; Kim, C.H.; Park, J.H.; Kim, H.; Lee, I.; Jin, B. Numerical simulations of added resistance in regular head waves on a container ship. Brodogradnja 2019, 70, 61–86. [Google Scholar] [CrossRef]
  26. Park, I.R.; Kim, J.I.; Suh, S.B.; Kim, J.; Kim, K.S.; Kim, Y.C. Numerical prediction of the powering performance of a car-Ferry in irregular waves for safe return to port (srtp). J. Ocean. Eng. Tech. 2019, 33, 1–9. [Google Scholar] [CrossRef] [Green Version]
  27. Kim, S.Y.; Kim, K.M.; Park, J.C.; Jeong, G.M.; Chun, H.H. Numerical simulation of wave and current interaction with a fixed offshore substructure. Int. J. Nav. Arch. Ocean 2016, 8, 187–197. [Google Scholar] [CrossRef] [Green Version]
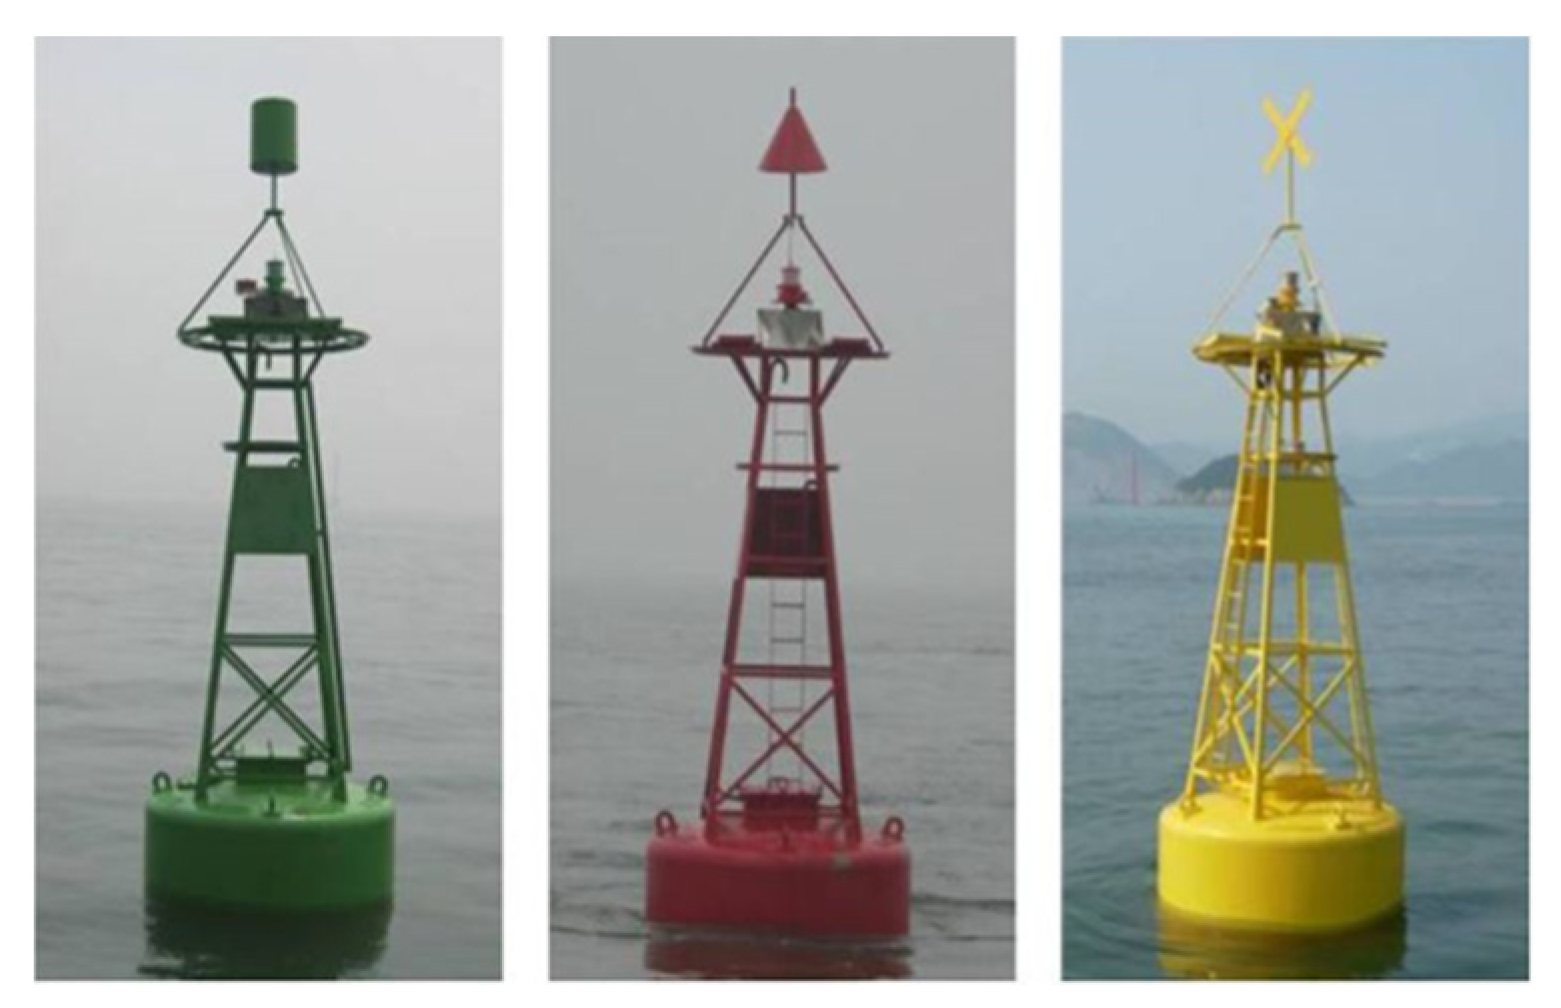
Figure 1. Light buoys.
Jmse 08 00139 g001
Figure 2. Comparison between a conventional light buoy and the lightweight one developed by Jeong et al. [1].
Jmse 08 00139 g002
Figure 3. Scope and process of present study.
Jmse 08 00139 g003
Figure 4. Free decay curve.
Jmse 08 00139 g004
Figure 5. Cross-section views of target lightweight light buoys.
Jmse 08 00139 g005
Figure 6. Geometries of lightweight light buoy with and without developed appendages.
Jmse 08 00139 g006
Figure 7. A comparison of the time histories of (a) free pitch and (b) heave decay curves of a circular cylinder between the present results and those of the reference.
Jmse 08 00139 g007
Figure 8. Computational domain and boundary conditions of the free decay test of lightweight light buoys using CFD.
Jmse 08 00139 g008
Figure 9. Grid system for the free decay test of lightweight light buoys using CFD.
Jmse 08 00139 g009
Figure 10. Free pitch (a) and (b) heave decay curves of the lightweight light buoys.
Jmse 08 00139 g010
Figure 11. Comparisons of vorticity (j) distributions around the lightweight light buoys during (a) free pitch and (b) heave decay tests when the first and second peaks of motion occur.
Jmse 08 00139 g011
Figure 12. Computational domain and panels of the lightweight light buoys for potential-based simulations.
Jmse 08 00139 g012
Figure 13. Pitch pitch response amplitude operators (RAOs) estimated from the potential-based motion analysis of the light buoys (a) without and (b) with the consideration of viscous damping.
Jmse 08 00139 g013
Figure 14. Heave RAOs estimated from the potential-based motion analysis of the light buoys (a) without and (b) with the consideration of viscous damping.
Jmse 08 00139 g014
Figure 15. Computational domain and boundary conditions for motion simulations of lightweight light buoys in regular waves using CFD.
Jmse 08 00139 g015
Figure 16. Grid system for motion simulations of lightweight light buoys in regular waves using CFD.
Jmse 08 00139 g016
Figure 17. Time histories of (a) pitch and (b) heave motions of the buoys in regular waves, for which the frequency is the same as the pitch natural frequency of the Base model, estimated by CFD simulation.
Jmse 08 00139 g017
Figure 18. Snapshots of CFD simulations of (a) Base, (b) Plate, (c) Porous Plate, (d) Cone and (e) Porous Plate models when the 5th plus peak of motion occurs in regular waves, for which the frequency is the same as the pitch natural frequency of the Base model.
Jmse 08 00139 g018aJmse 08 00139 g018b
Figure 19. Time histories of (a) pitch and (b) heave motions of the buoys in regular waves, for which the frequency is the same as the heave natural frequency of the Base model, estimated by CFD simulation.
Jmse 08 00139 g019
Figure 20. Comparison of (a) pitch and (b) RAOs between the CFD simulation and potential-based motion analysis.
Jmse 08 00139 g020
Table 1. Main particulars and hydrostatic properties of the lightweight light buoys.
ModelsMass [kg]Diameter
of Buoyant Body [m]
Draft [m]Center of
Gravity [m]
Metacentric
Height [m]
Mass Moment of Inertia [kg·m2]
Base24232.4003.0362.1361.05210,902
Plate25963.0732.0091.14411,490
Porous Plate25793.0692.0211.13711,435
Cone26173.0782.1501.01810,965
Porous Cone25973.0732.1491.02110,958
Table 2. Non-dimensional damping coefficients and natural frequencies of lightweight light buoys from free decay tests.
PitchHeave
ζ [-] ω o   [ rad / s ] ζ [-] ω o   [ rad / s ]
Base0.01351.3970.11073.107
Plate0.02091.4520.15502.748
Porous Plate0.02191.4470.16602.813
Cone0.01671.4250.13442.649
Porous Cone0.01721.4180.15872.795
Table 3. Added mass moment of inertia, total mass moment of inertia, coefficients of viscous and radiation damping, and ratio of viscous damping to total damping for a pitch motion at natural frequencies of the models from the potential-based motion analysis.
I a   [ kgm 2 ] I + I a   [ kgm 2 ] b 55 ,   v i s   [ kgm 2 / s ] ν ( ω o )   [ kgm 2 / s ] b 55 ,   v i s   b 55   [-]
Base1968 12,876 63.359 0.488 0.9924
Plate2435 13,936 109.952 0.884 0.9920
Porous Plate2556 14,002 114.261 0.842 0.9927
Cone2145 13,121 80.067 0.656 0.9919
Porous Cone2116 13,084 82.690 0.610 0.9927
Table 4. Added mass, total mass, coefficients of viscous and radiation damping, and ratio of viscous damping to total damping of a lightweight light buoy from the potential-based motion analysis.
m a   [ kg ] m + m a   [ kg ] b 33 ,   v i s   [ kg / s ] ν ( ω o )   [ kg / s ] b 33 ,   v i s   b 33   [-]
Base2254 4677 136 3107 0.0419
Plate2874 5470 2243 2890 0.4368
Porous Plate3166 5745 2387 2987 0.4441
Cone2549 5166 2907 1710 0.6295
Porous Cone2609 5206 2570 2600 0.4970
Table 5. Regular wave conditions.
Wave Steepness H /   λ [-]Wave Frequency,
ω
Wave Period,
T [s]
Wave Length,
λ [m]
Wave Height,
H [m]
Remark
1/401.2475.03939.6380.996
1.3974.49831.5830.794Pitch natural frequency (Base)
1.8433.40918.1470.456
2.0393.08214.8260.373
2.3952.62310.7460.270
2.7512.2848.1450.205
3.1072.0226.3850.160Heave natural frequency (Base)
3.5001.7955.0320.126
Table 6. Comparison of maximum RAOs estimated from the potential-based simulation with those from the CFD simulation.
ModelsMaximum of pitch RAO [deg/m]Maximum of Heave RAO [m/m]
PotentialCFDRemarkPotentialCFDRemark
Base54.84169.743 pitch
natural frequency
of Base model
1.3571.327heave natural frequency of Base model
Plate35.36653.441 0.7600.746
Porous
Plate
33.73655.230 0.7900.793
Cone45.21154.222 0.9200.549
Porous
Cone
43.38157.069 0.8150.688