Experimental Study on Mechanism of Wave-Induced Liquefaction of Sand-Clay Seabed


Abstract
:1. Introduction
2. Experimental Setup
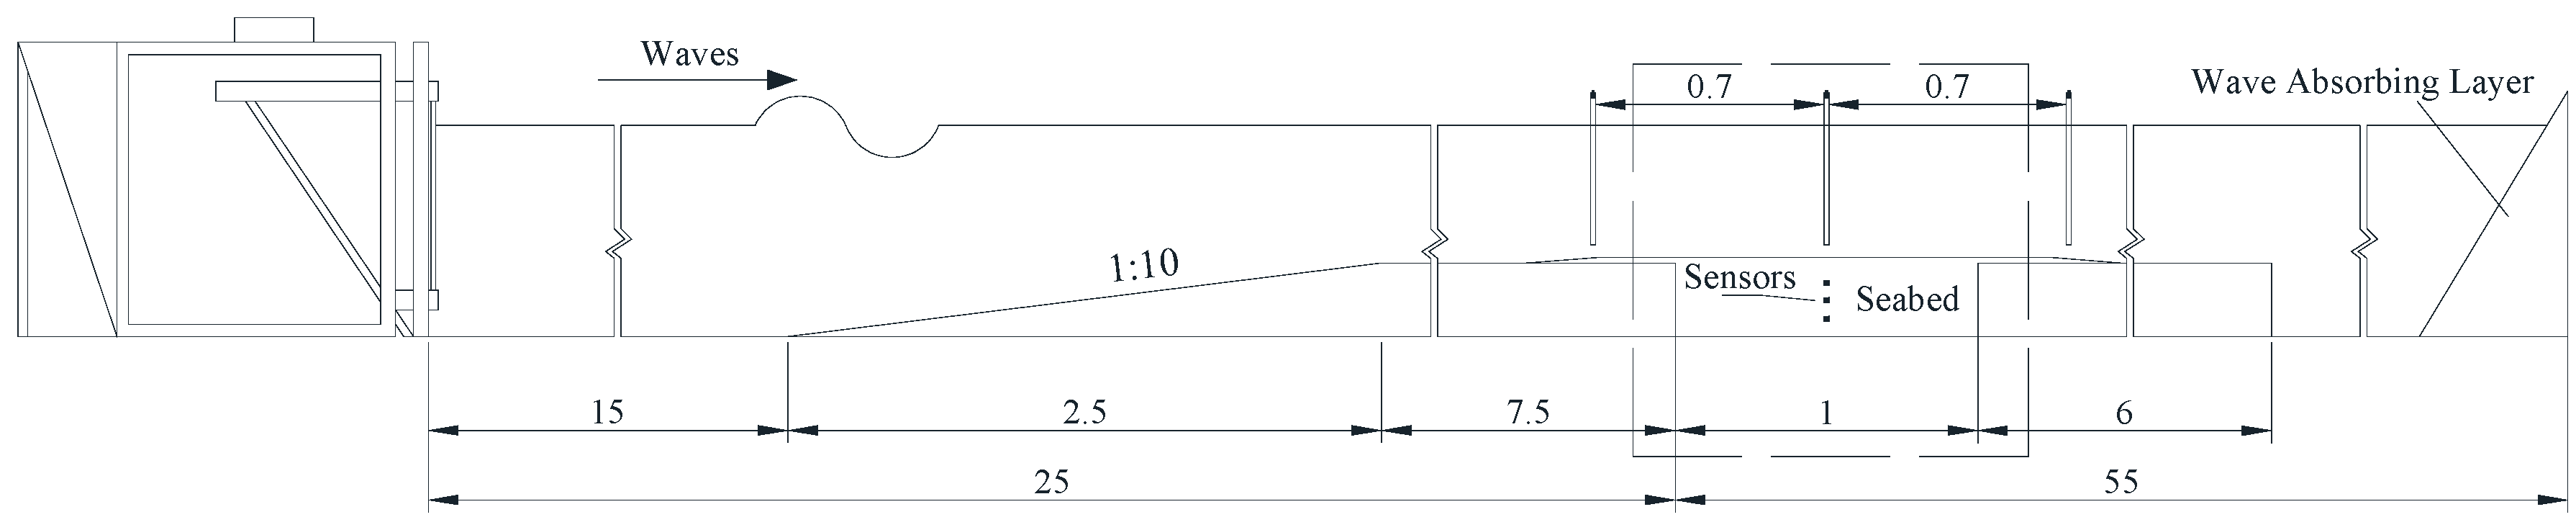
2.1. Wave Flume
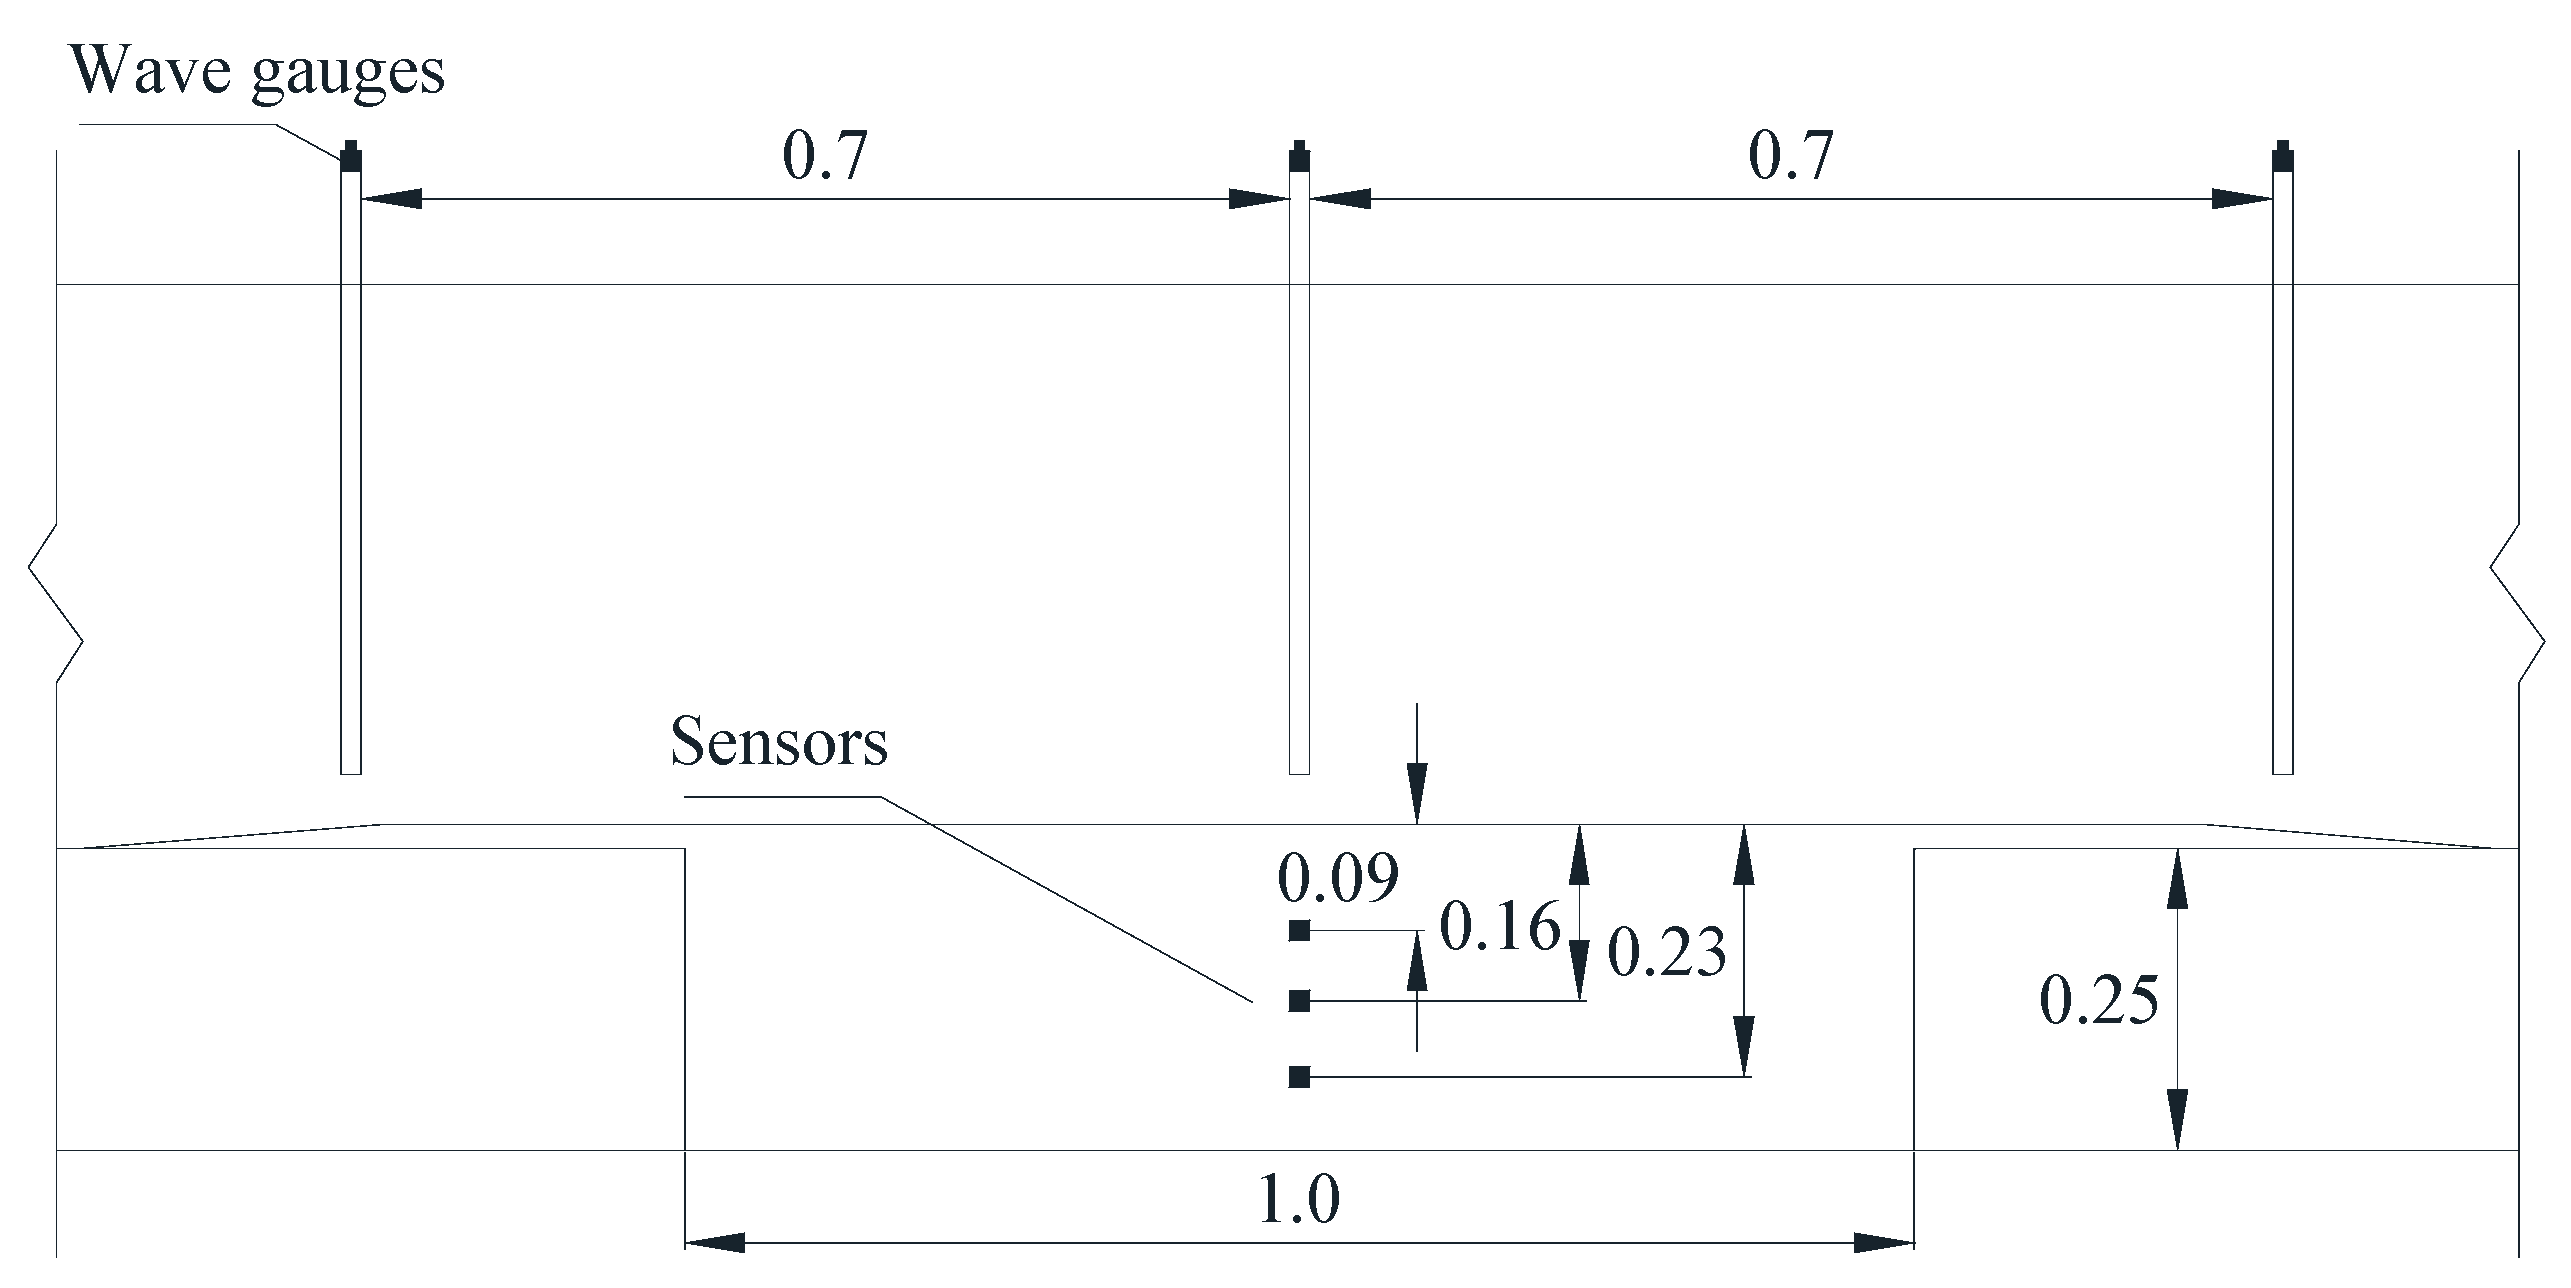
2.2. Soil Trench
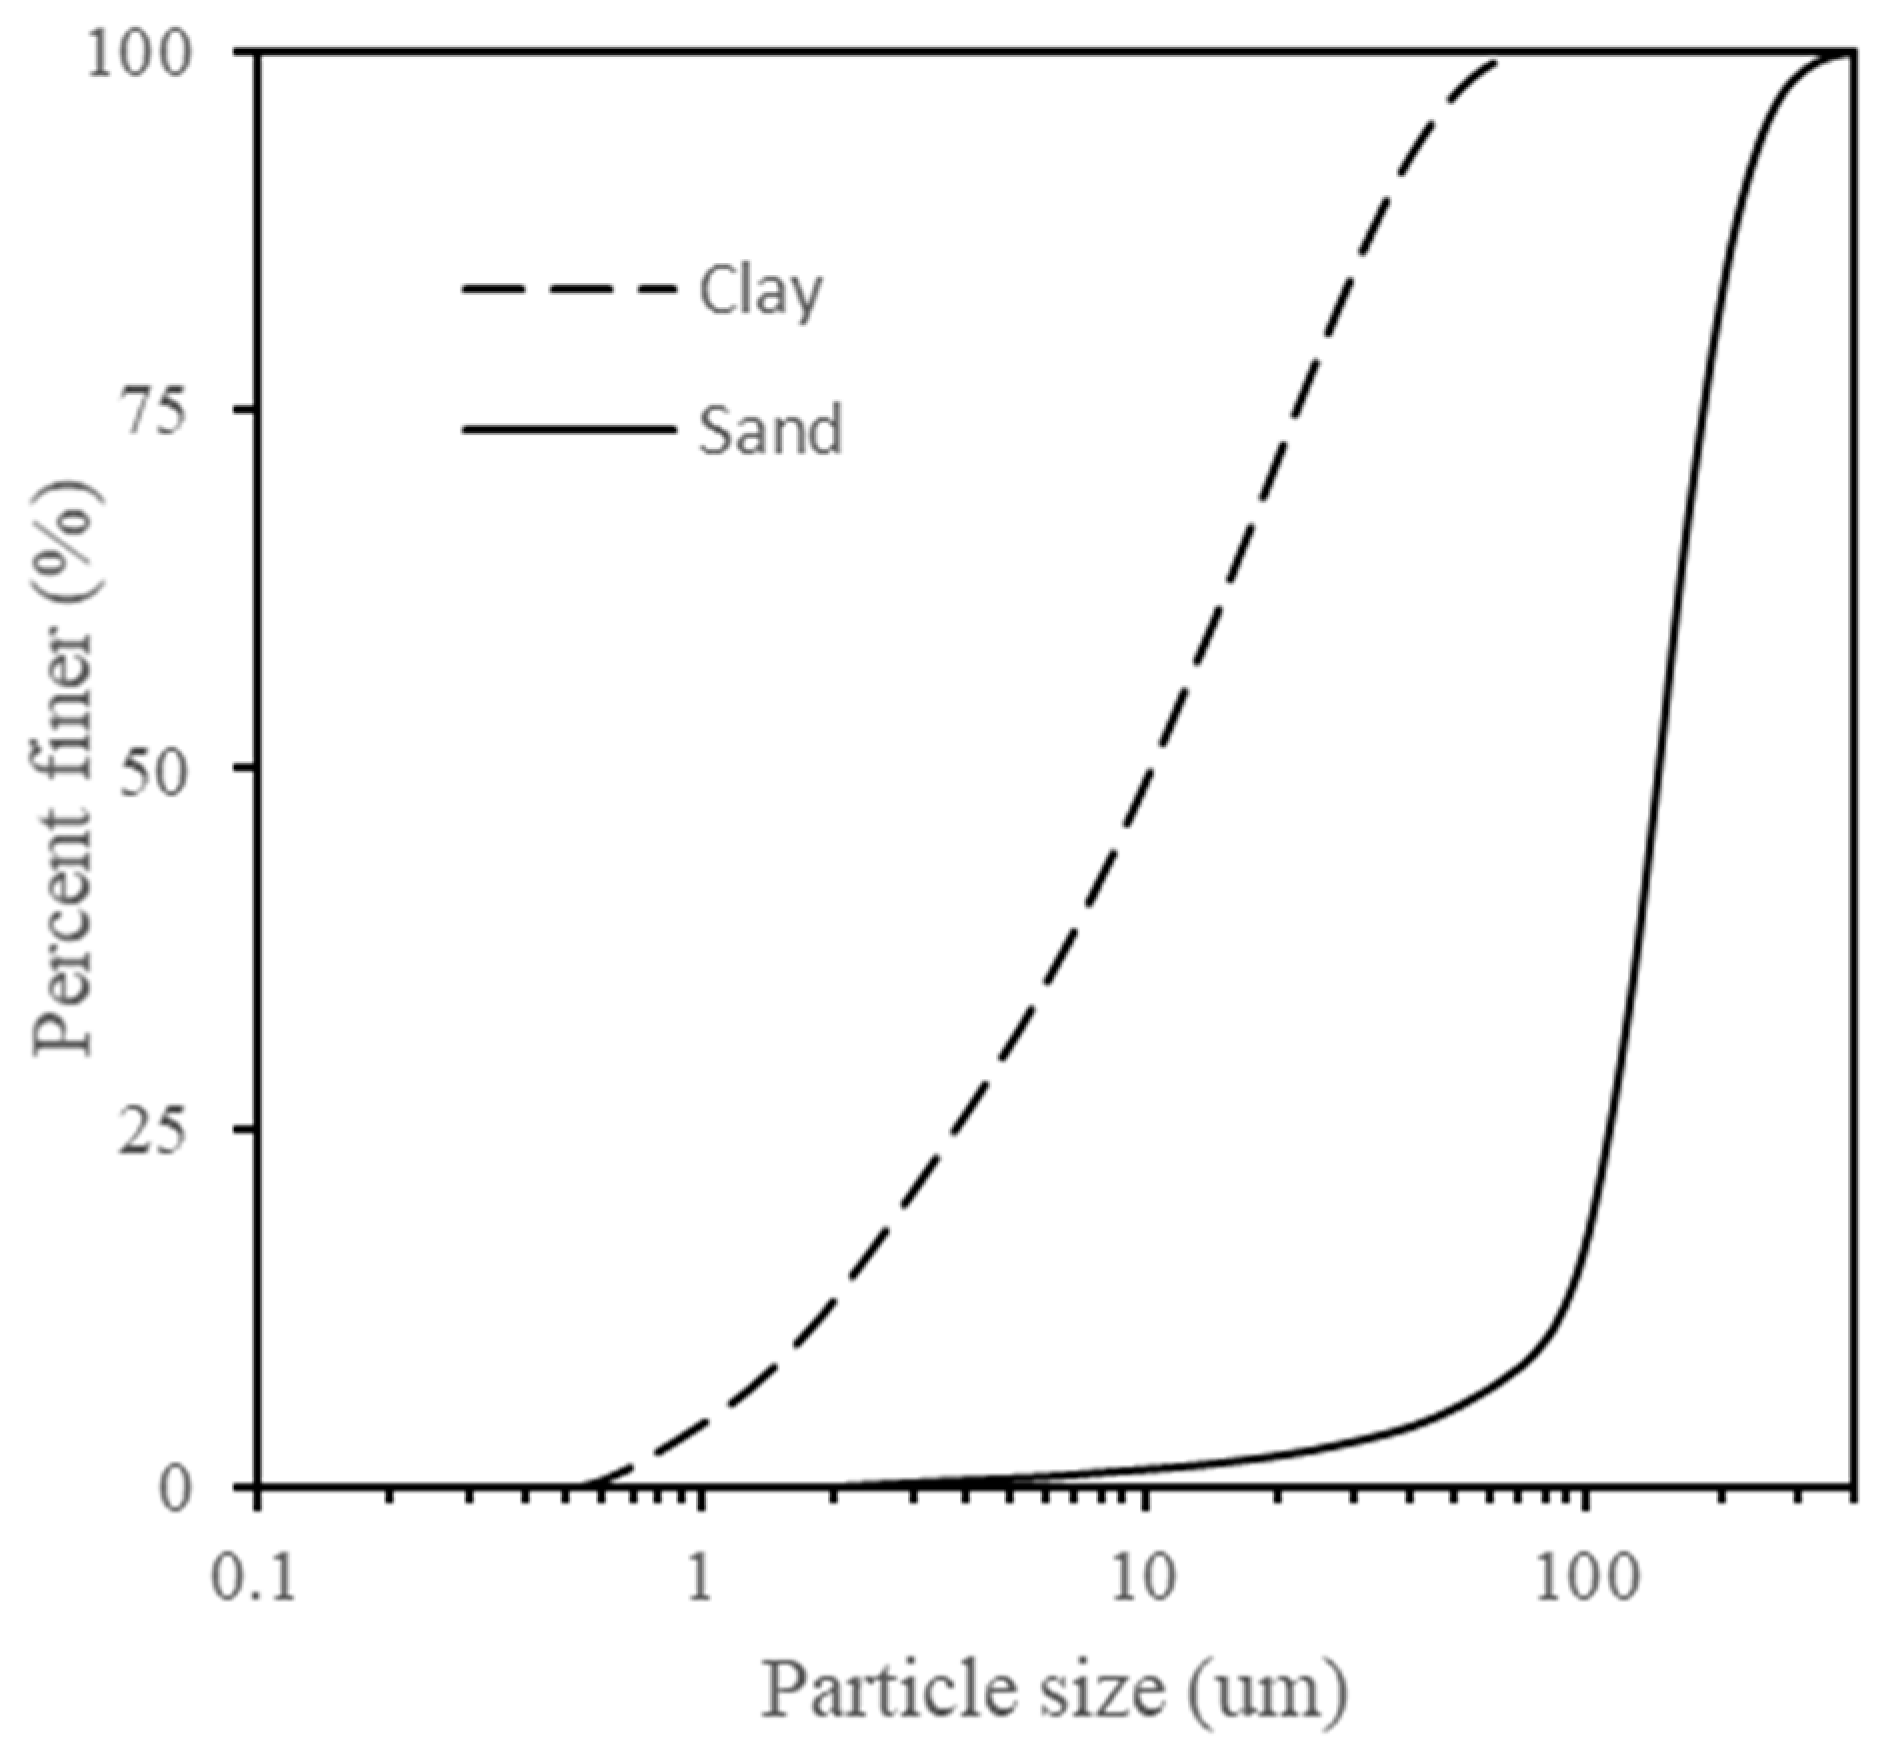
2.3. Soil Mechanics Test
2.4. Test Condition
2.5. Procedure
- (1)
- Place the well-mixed soil in the trench;
- (2)
- Fill up the flume with water gradually to a depth of 0.45 m;
- (3)
- Wait 20–22 hours to allow the soil to consolidate;
- (4)
- Calibrate water gauges and preheating pressure transmitters to record the pore pressure;
- (5)
- Switch on the waves 40 minutes;
- (6)
- Switch off the waves, and wait until the suspended sediment settles;
- (7)
- Empty the flume slowly;
- (8)
- Empty the sediment pit, and re mix soil sample if the next experiment is for the clay-sand soil with the same clay content. Prepare for the next test.
3. Results and Discussions
3.1. Pore Pressure Response of Seabed
3.2. Mechanism of Clayey Seabed Liquefaction
4. Conclusions
- (1)
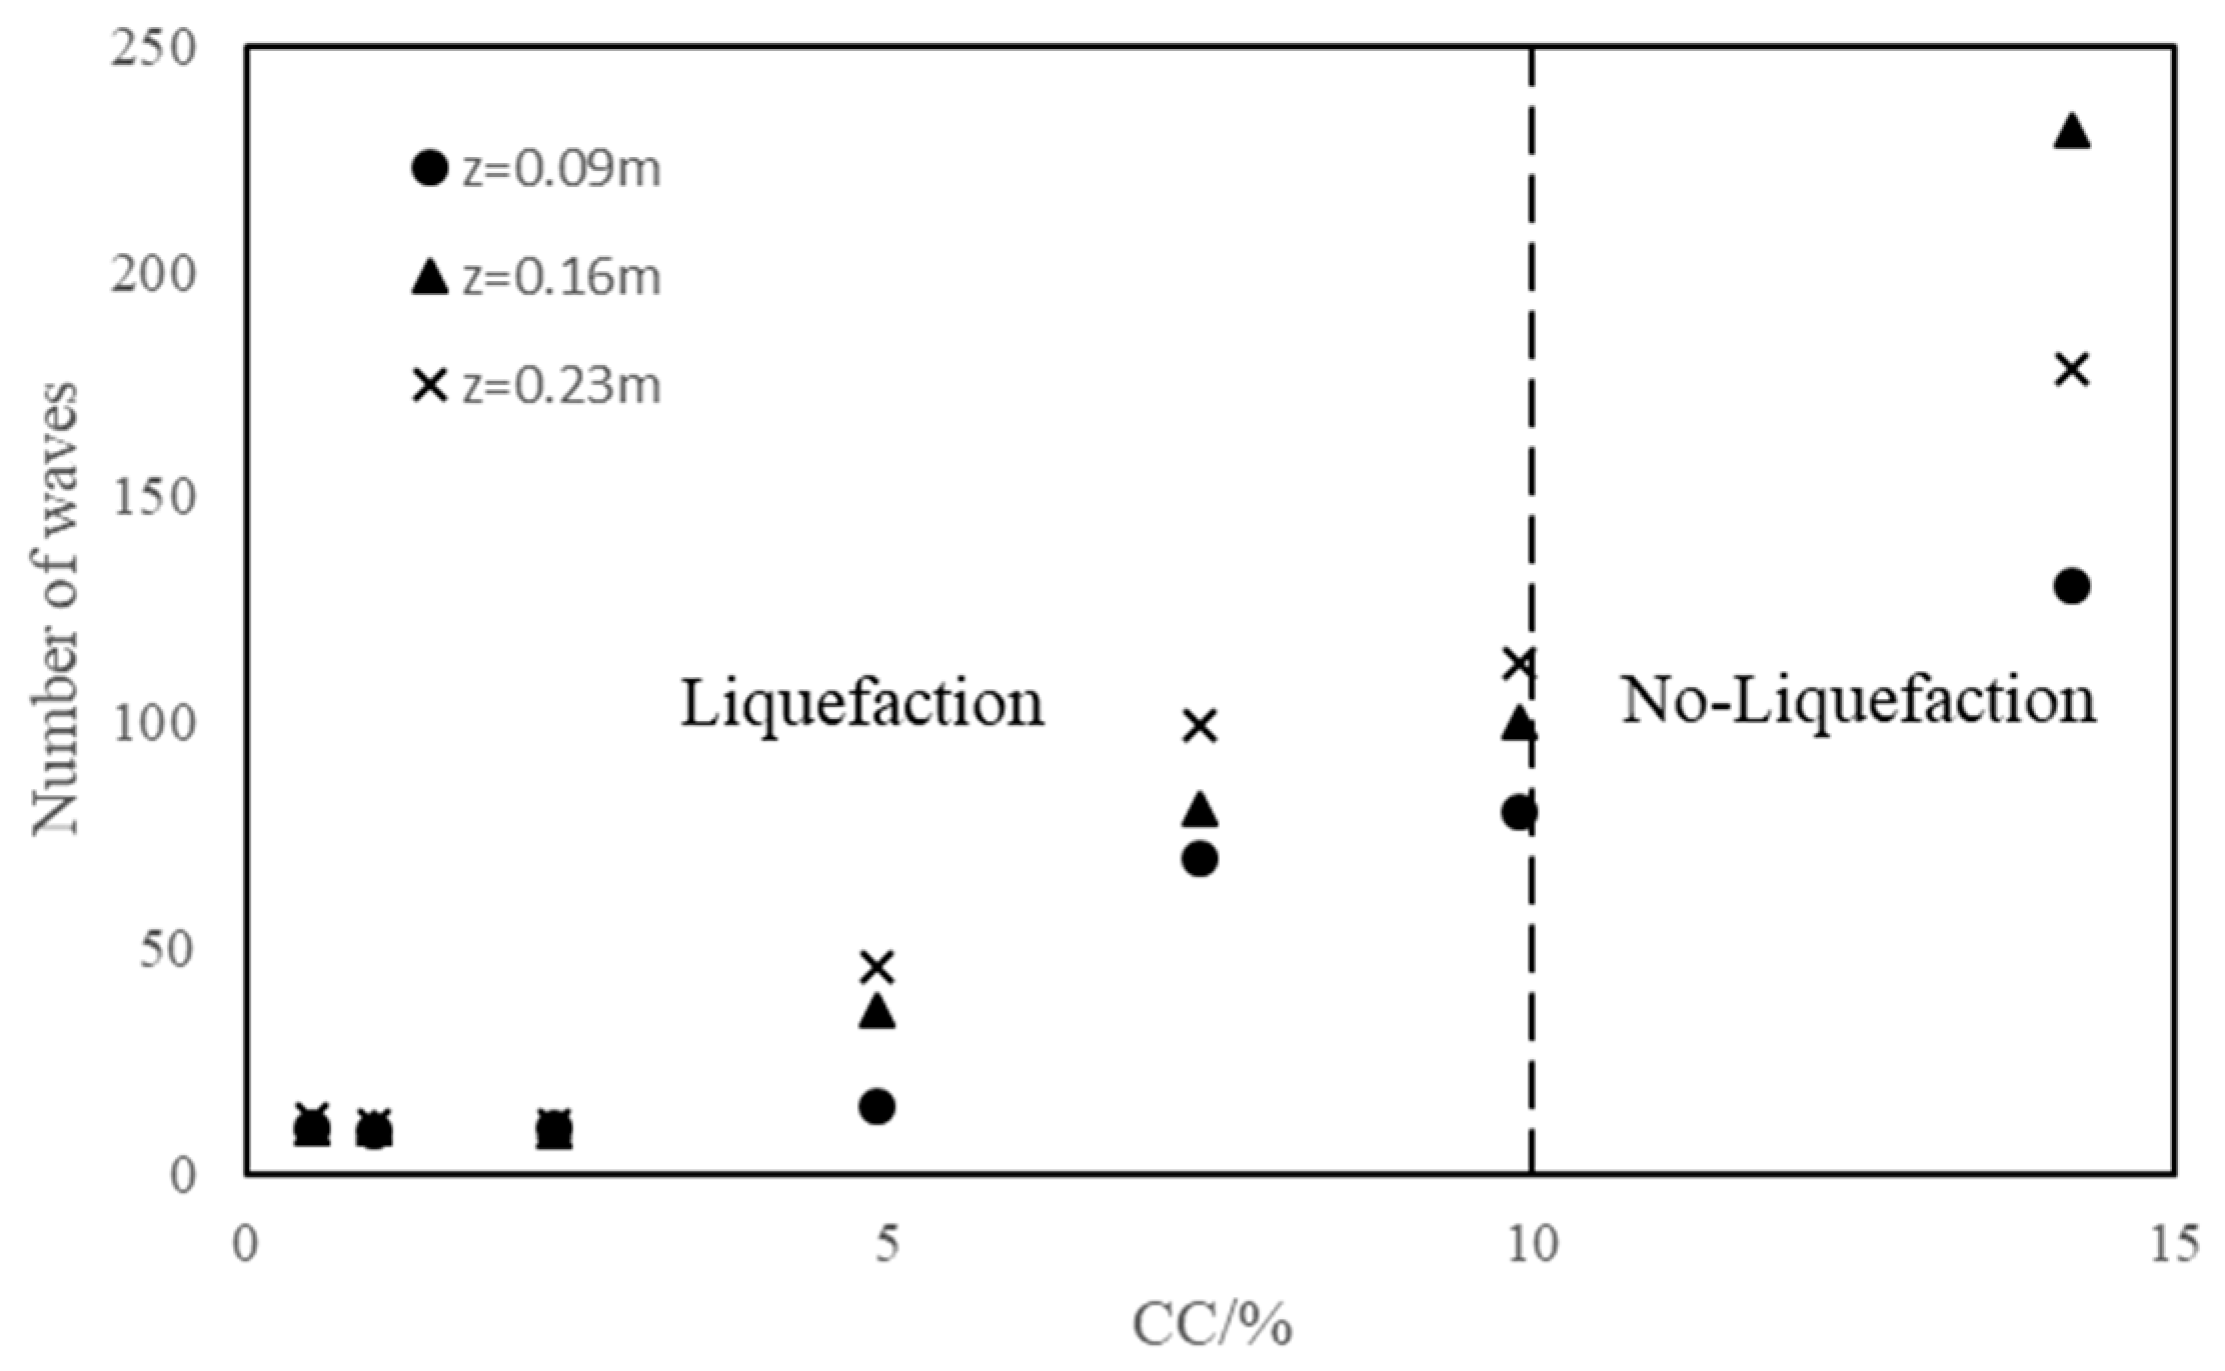
- With the introduction of CC, fine sand will have more susceptibility to liquefy until the clay content exceed a certain value so that the mixed bed will not be liquefied. In this study, the value is 10%. the lower limit critical value was not observed in these experiments that even the seabed with 0.5% CC could liquefy under laboratory wave conditions.
- (2)
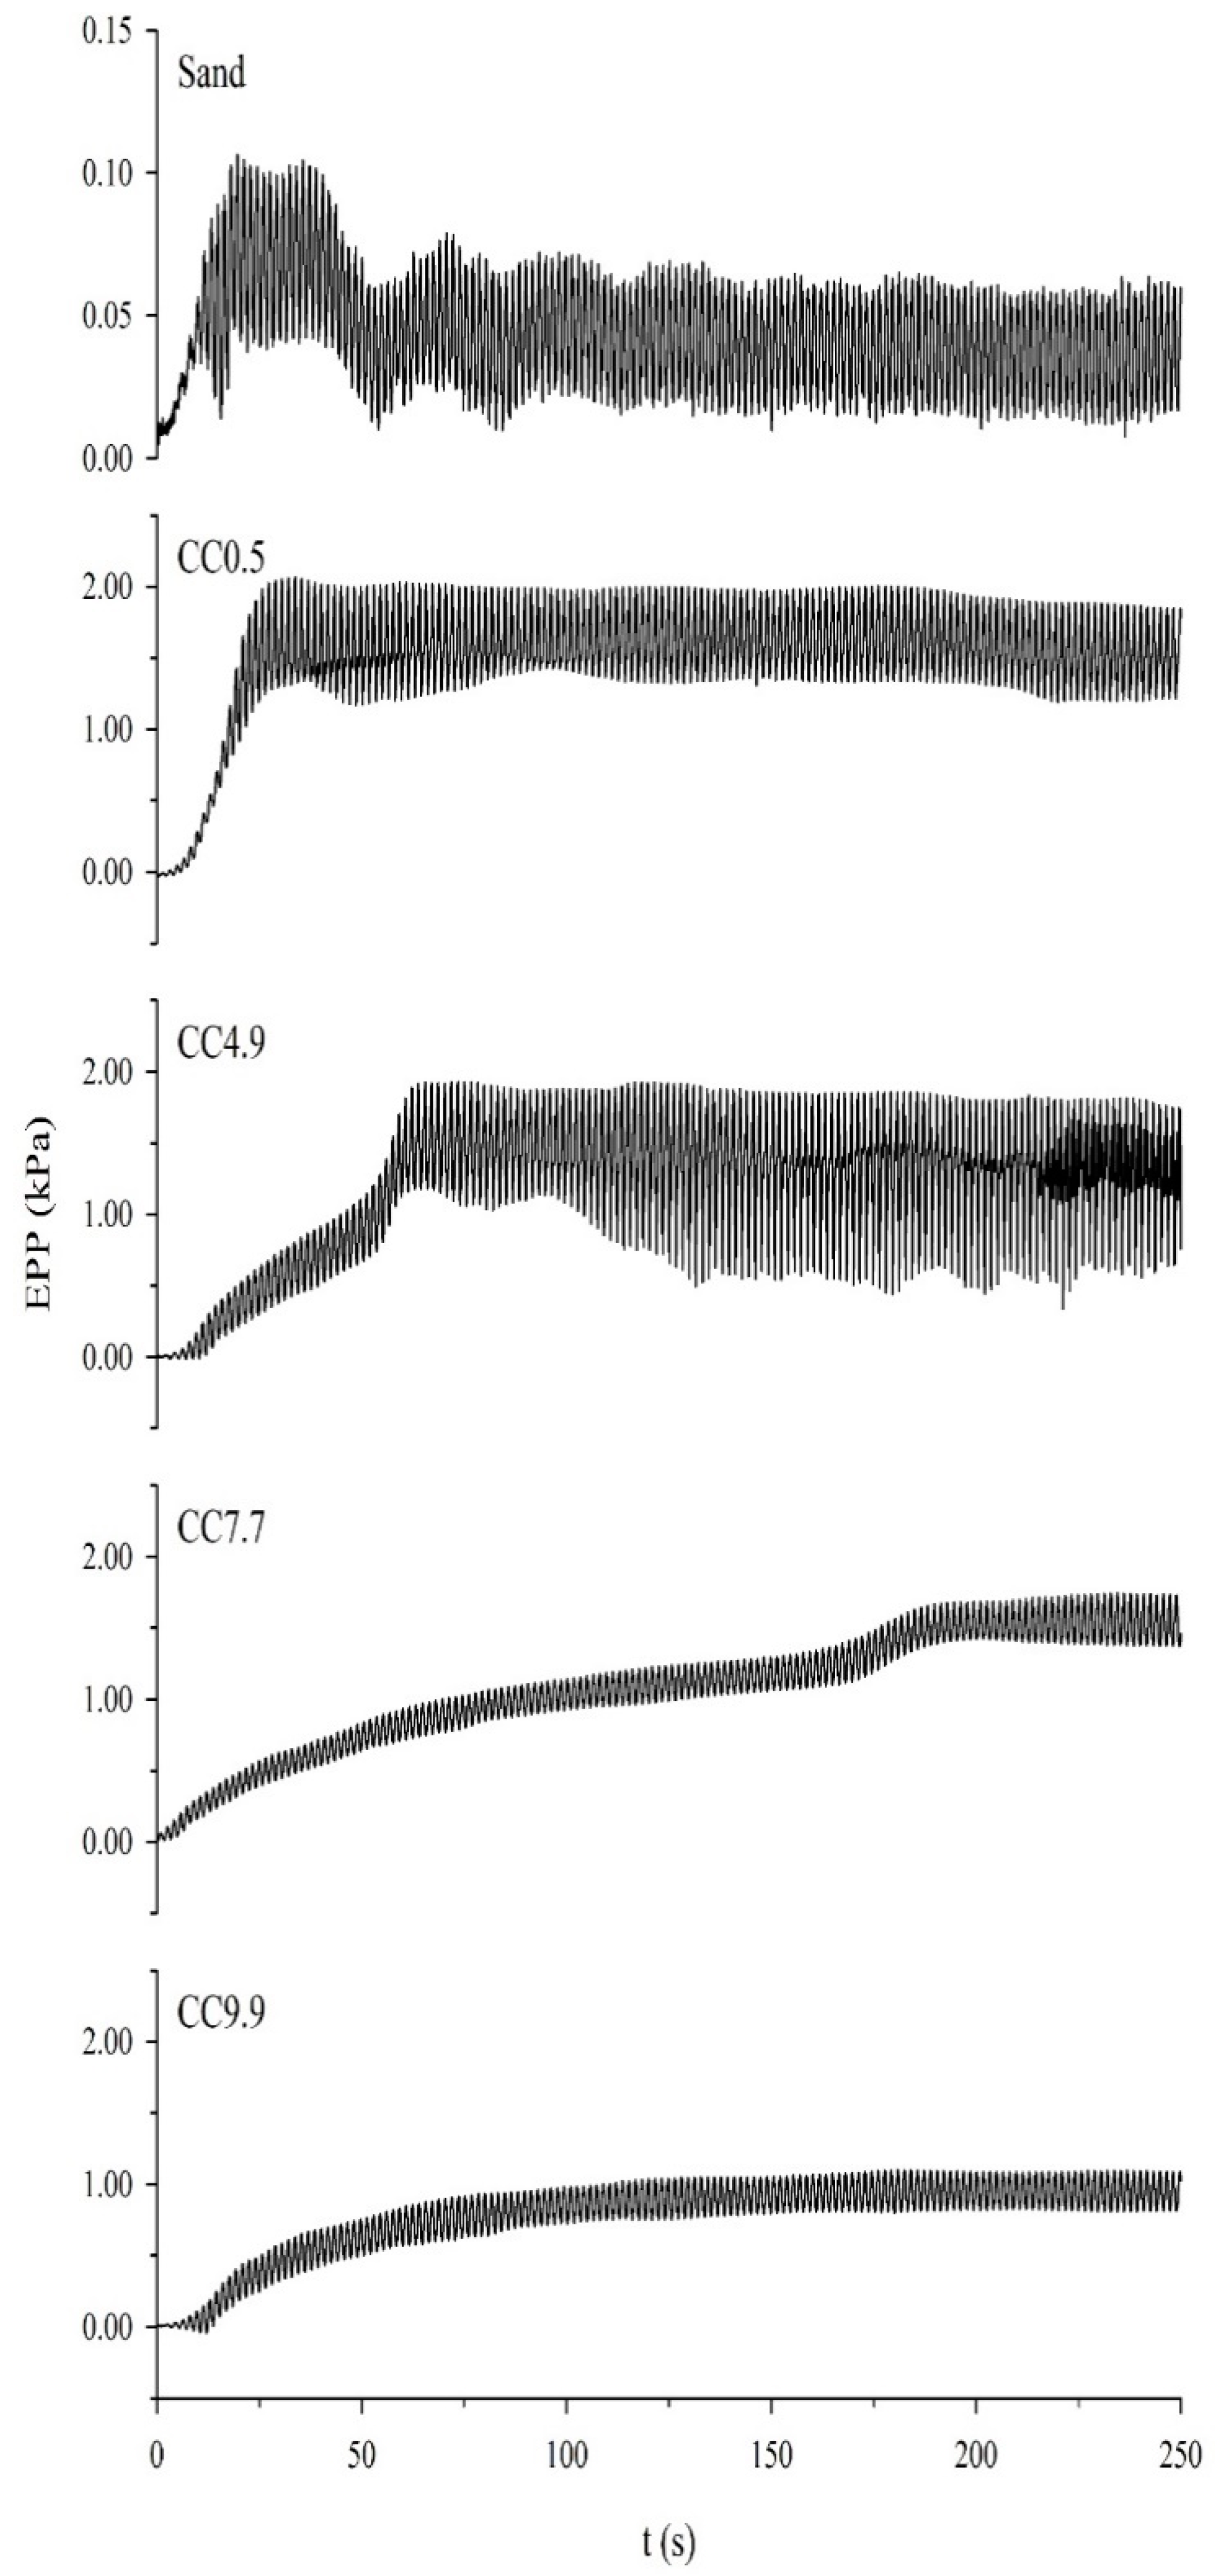
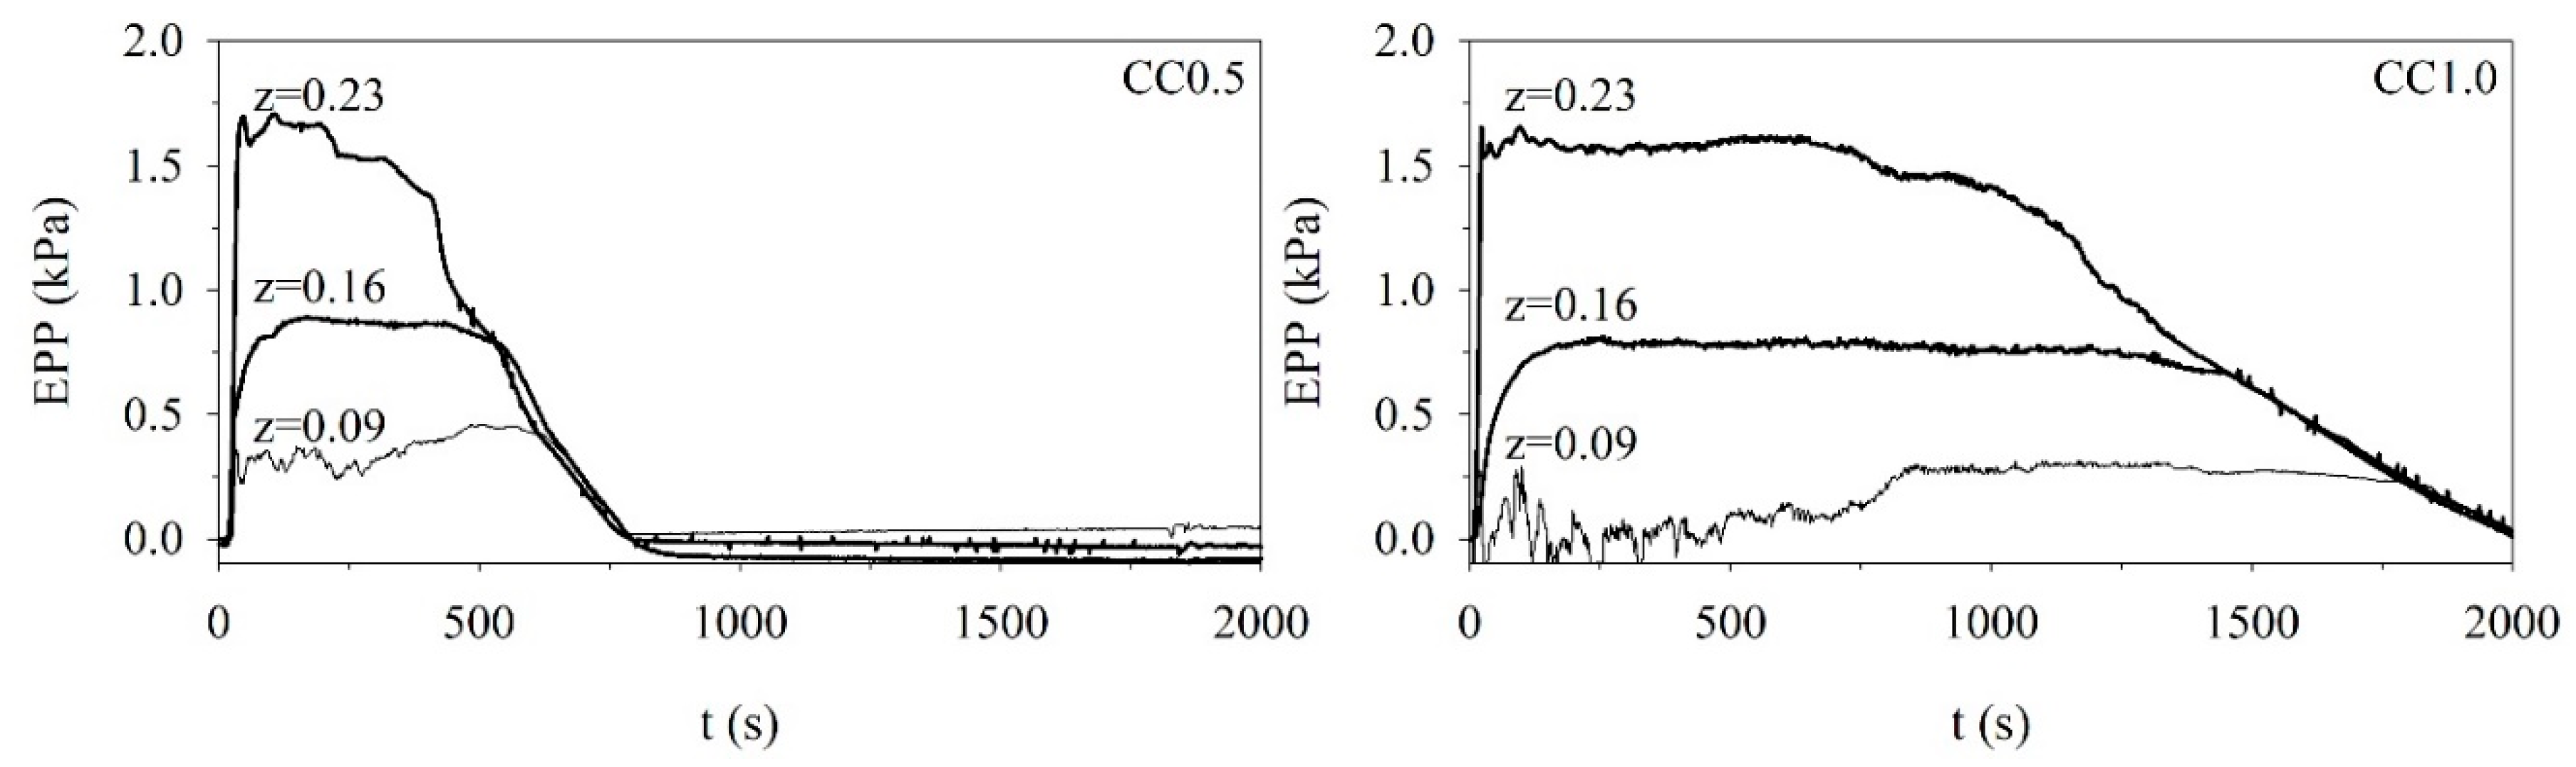
- When CC is small, 0.5–4.9, the amplitude of pore pressure is large and the change of EPP is irregular. When CC is large, 7.7–9.9, the amplitude of pore pressure is smaller and the EPP is regular. Accumulation and amplitude of EPP both decreased with the increase of CC when the clay content is more than 5%.
- (3)
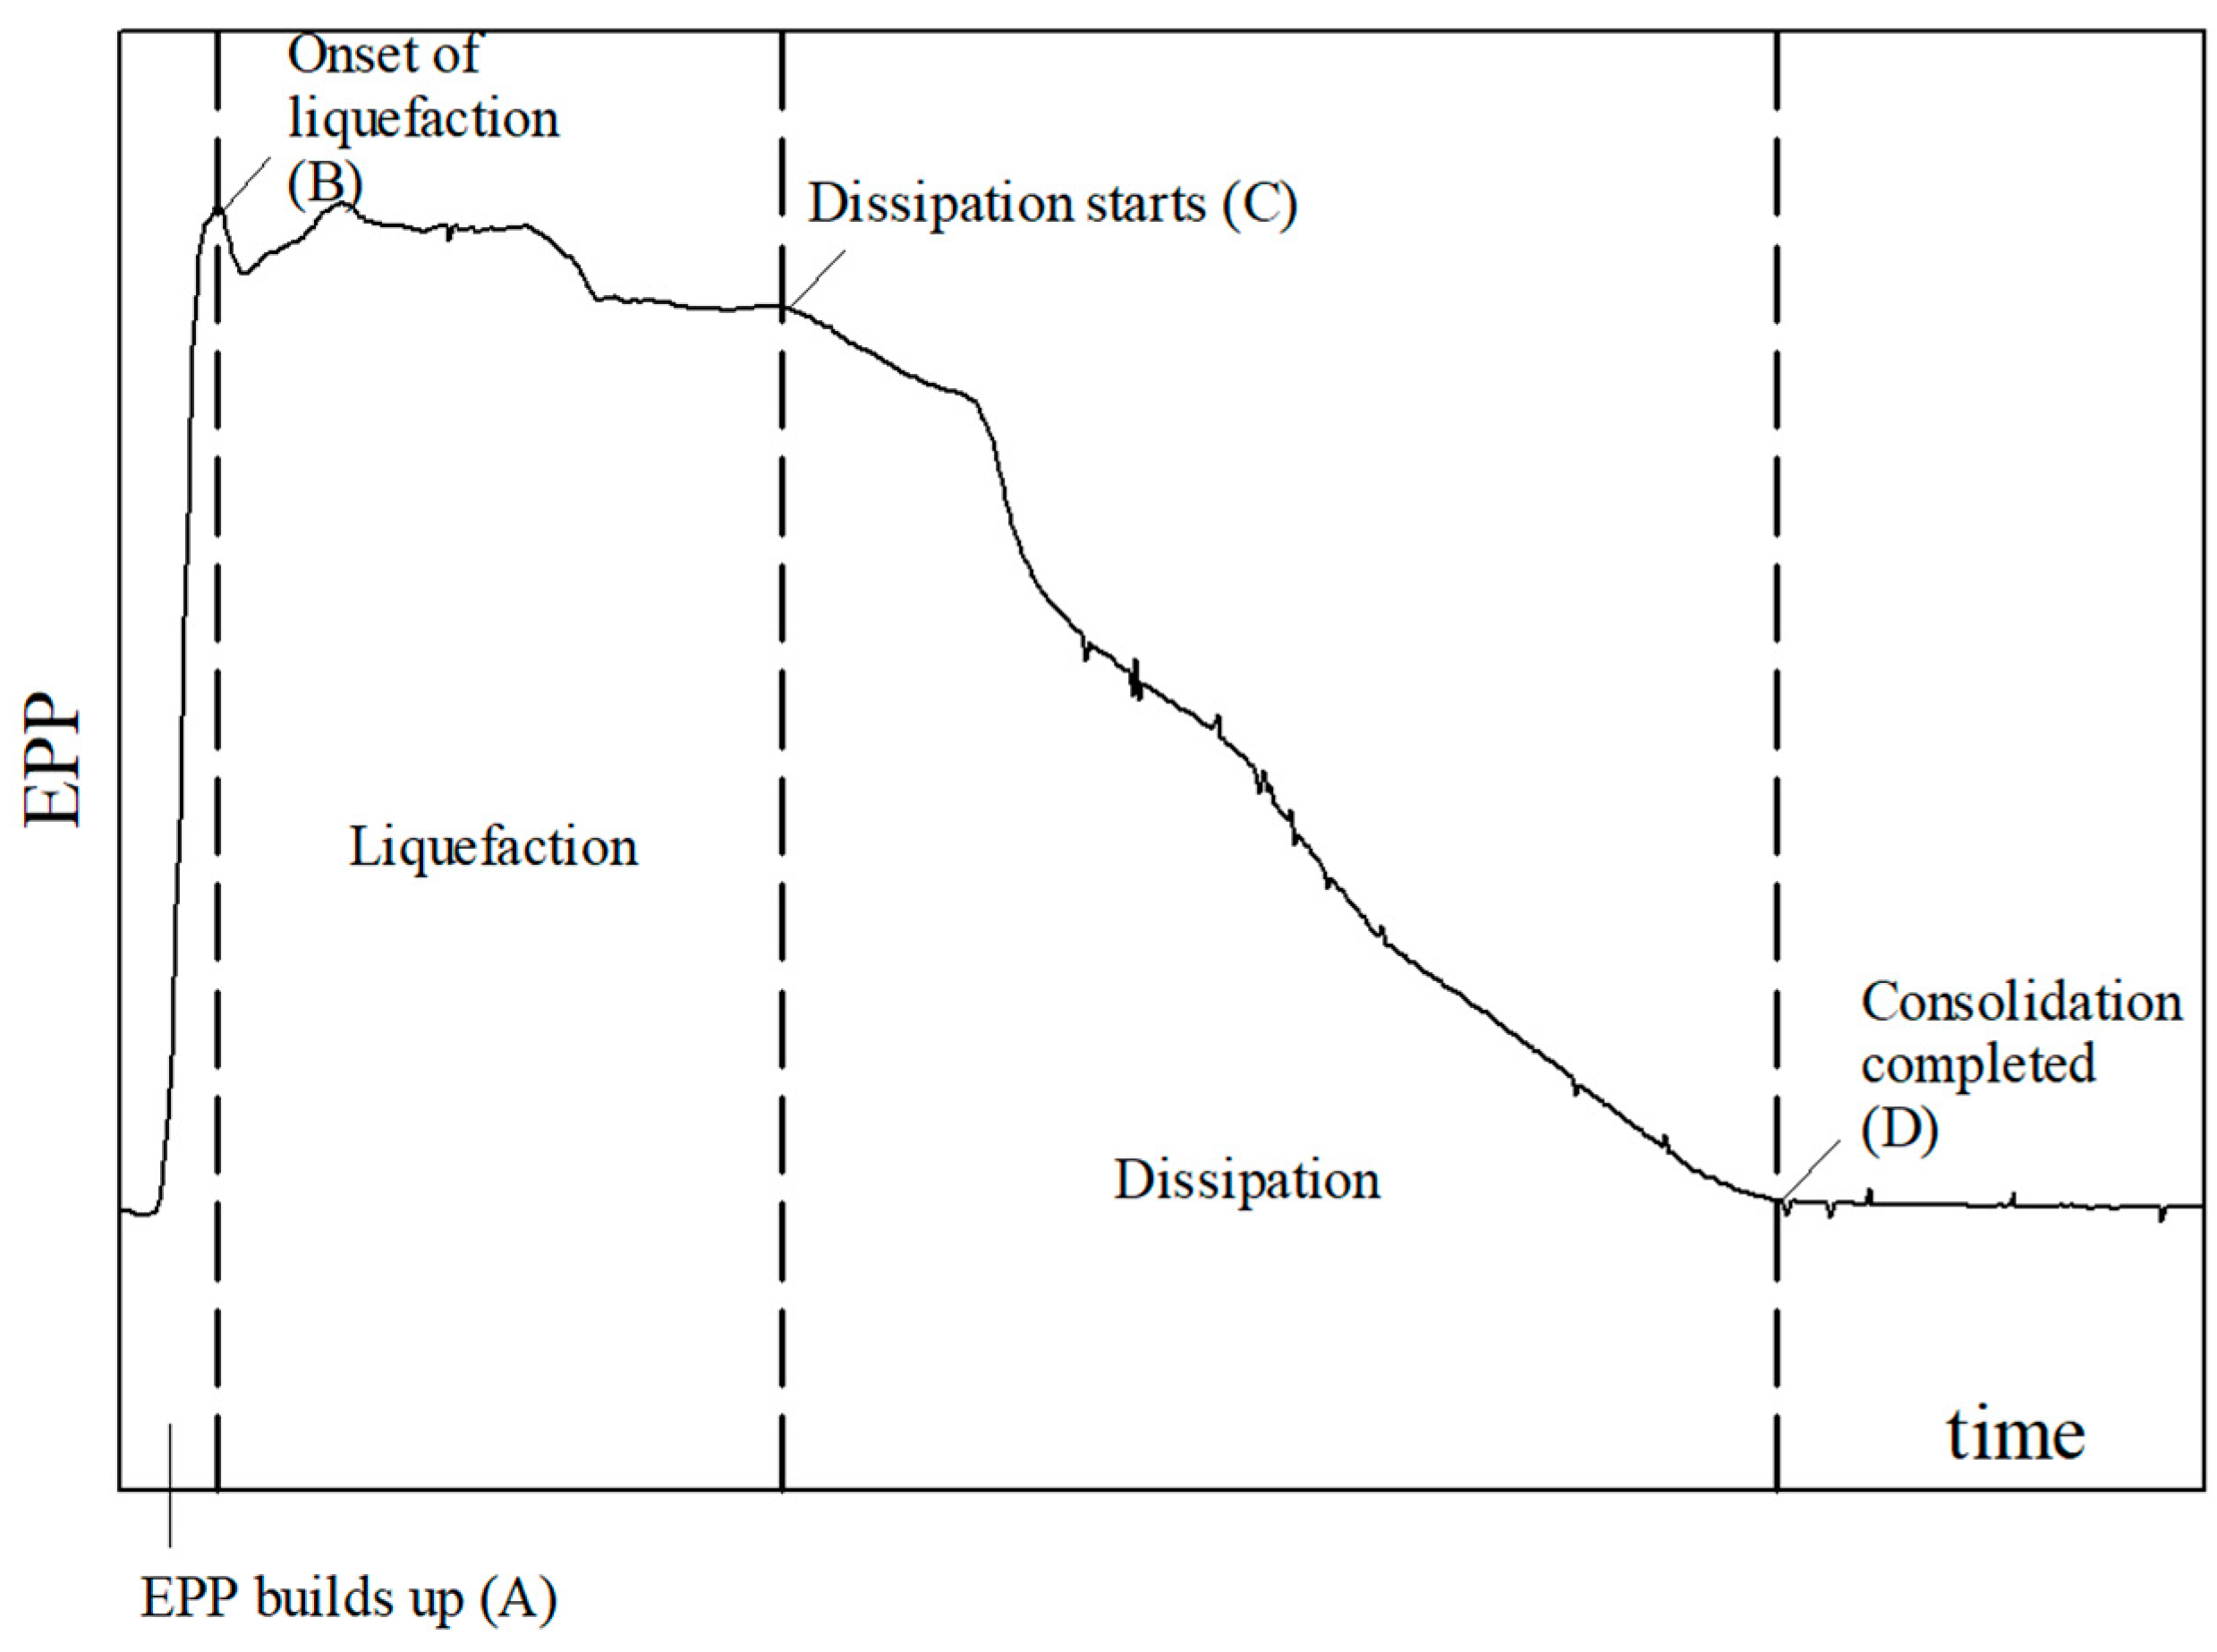
- Wave-induced compaction occurred only in CC0.5 and CC1.0. With the increase of CC, duration of liquefaction increases, time point of compaction-start delays, and duration of dissipation increases.
- (4)
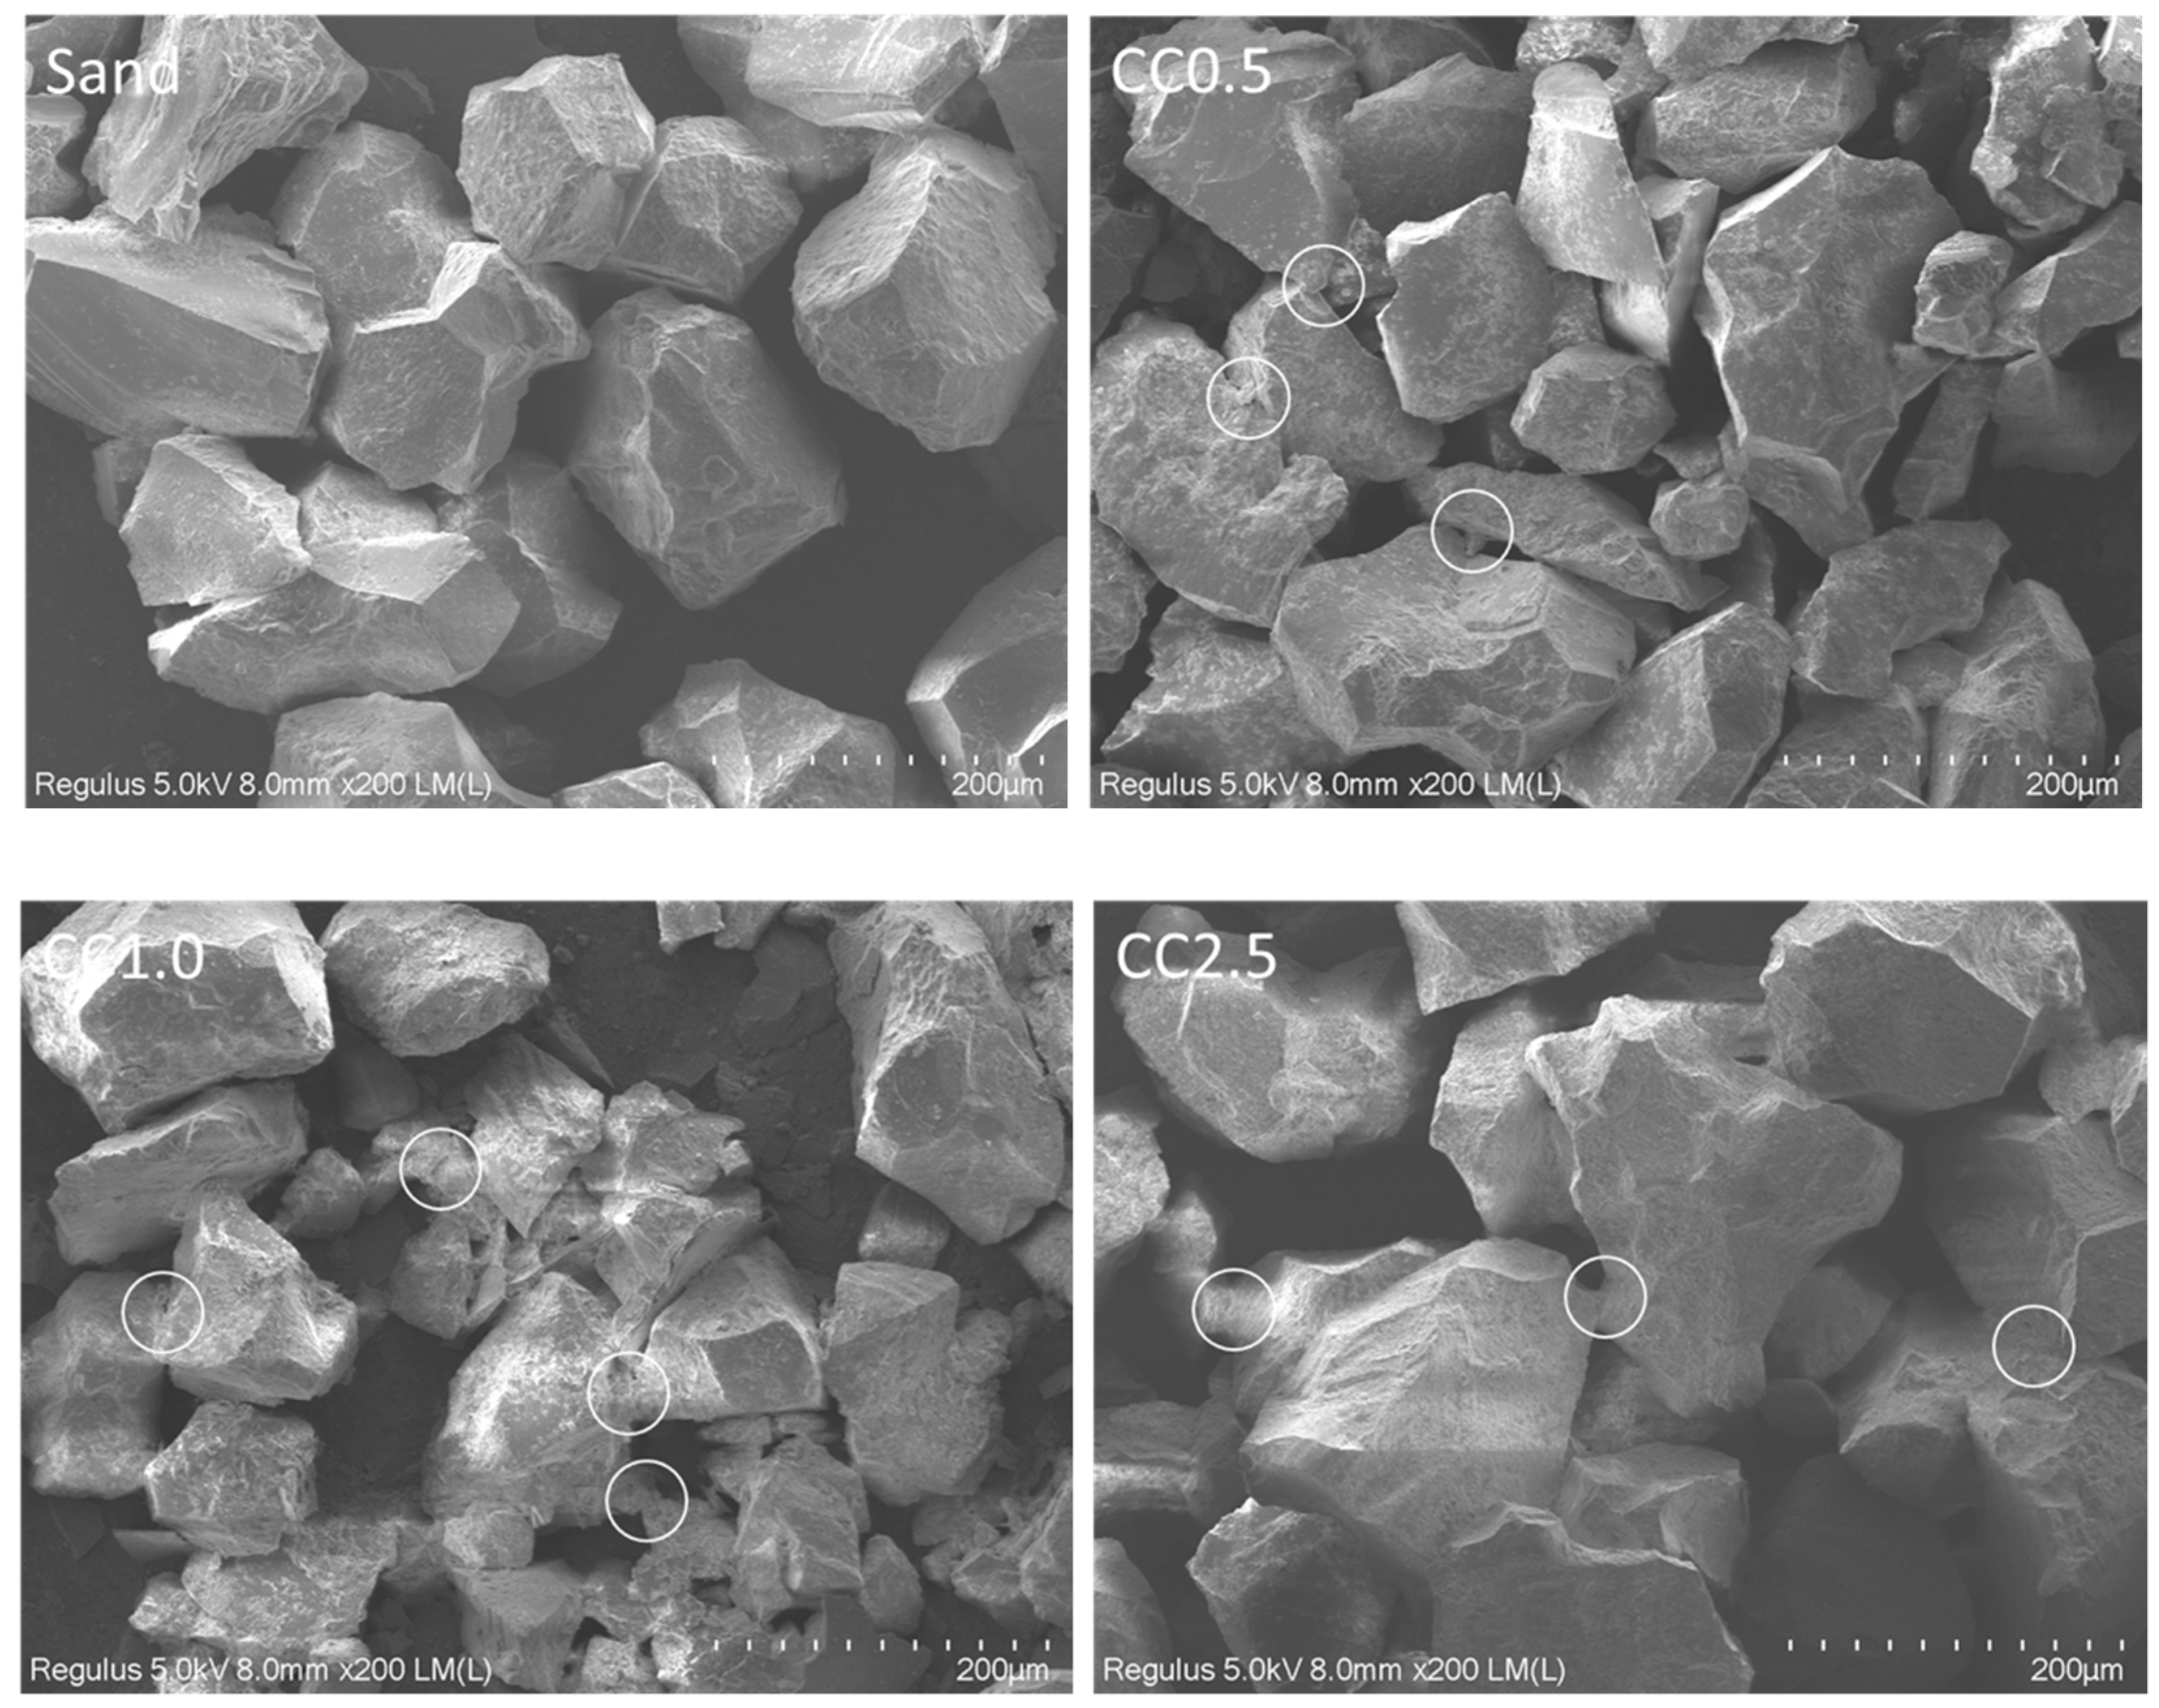
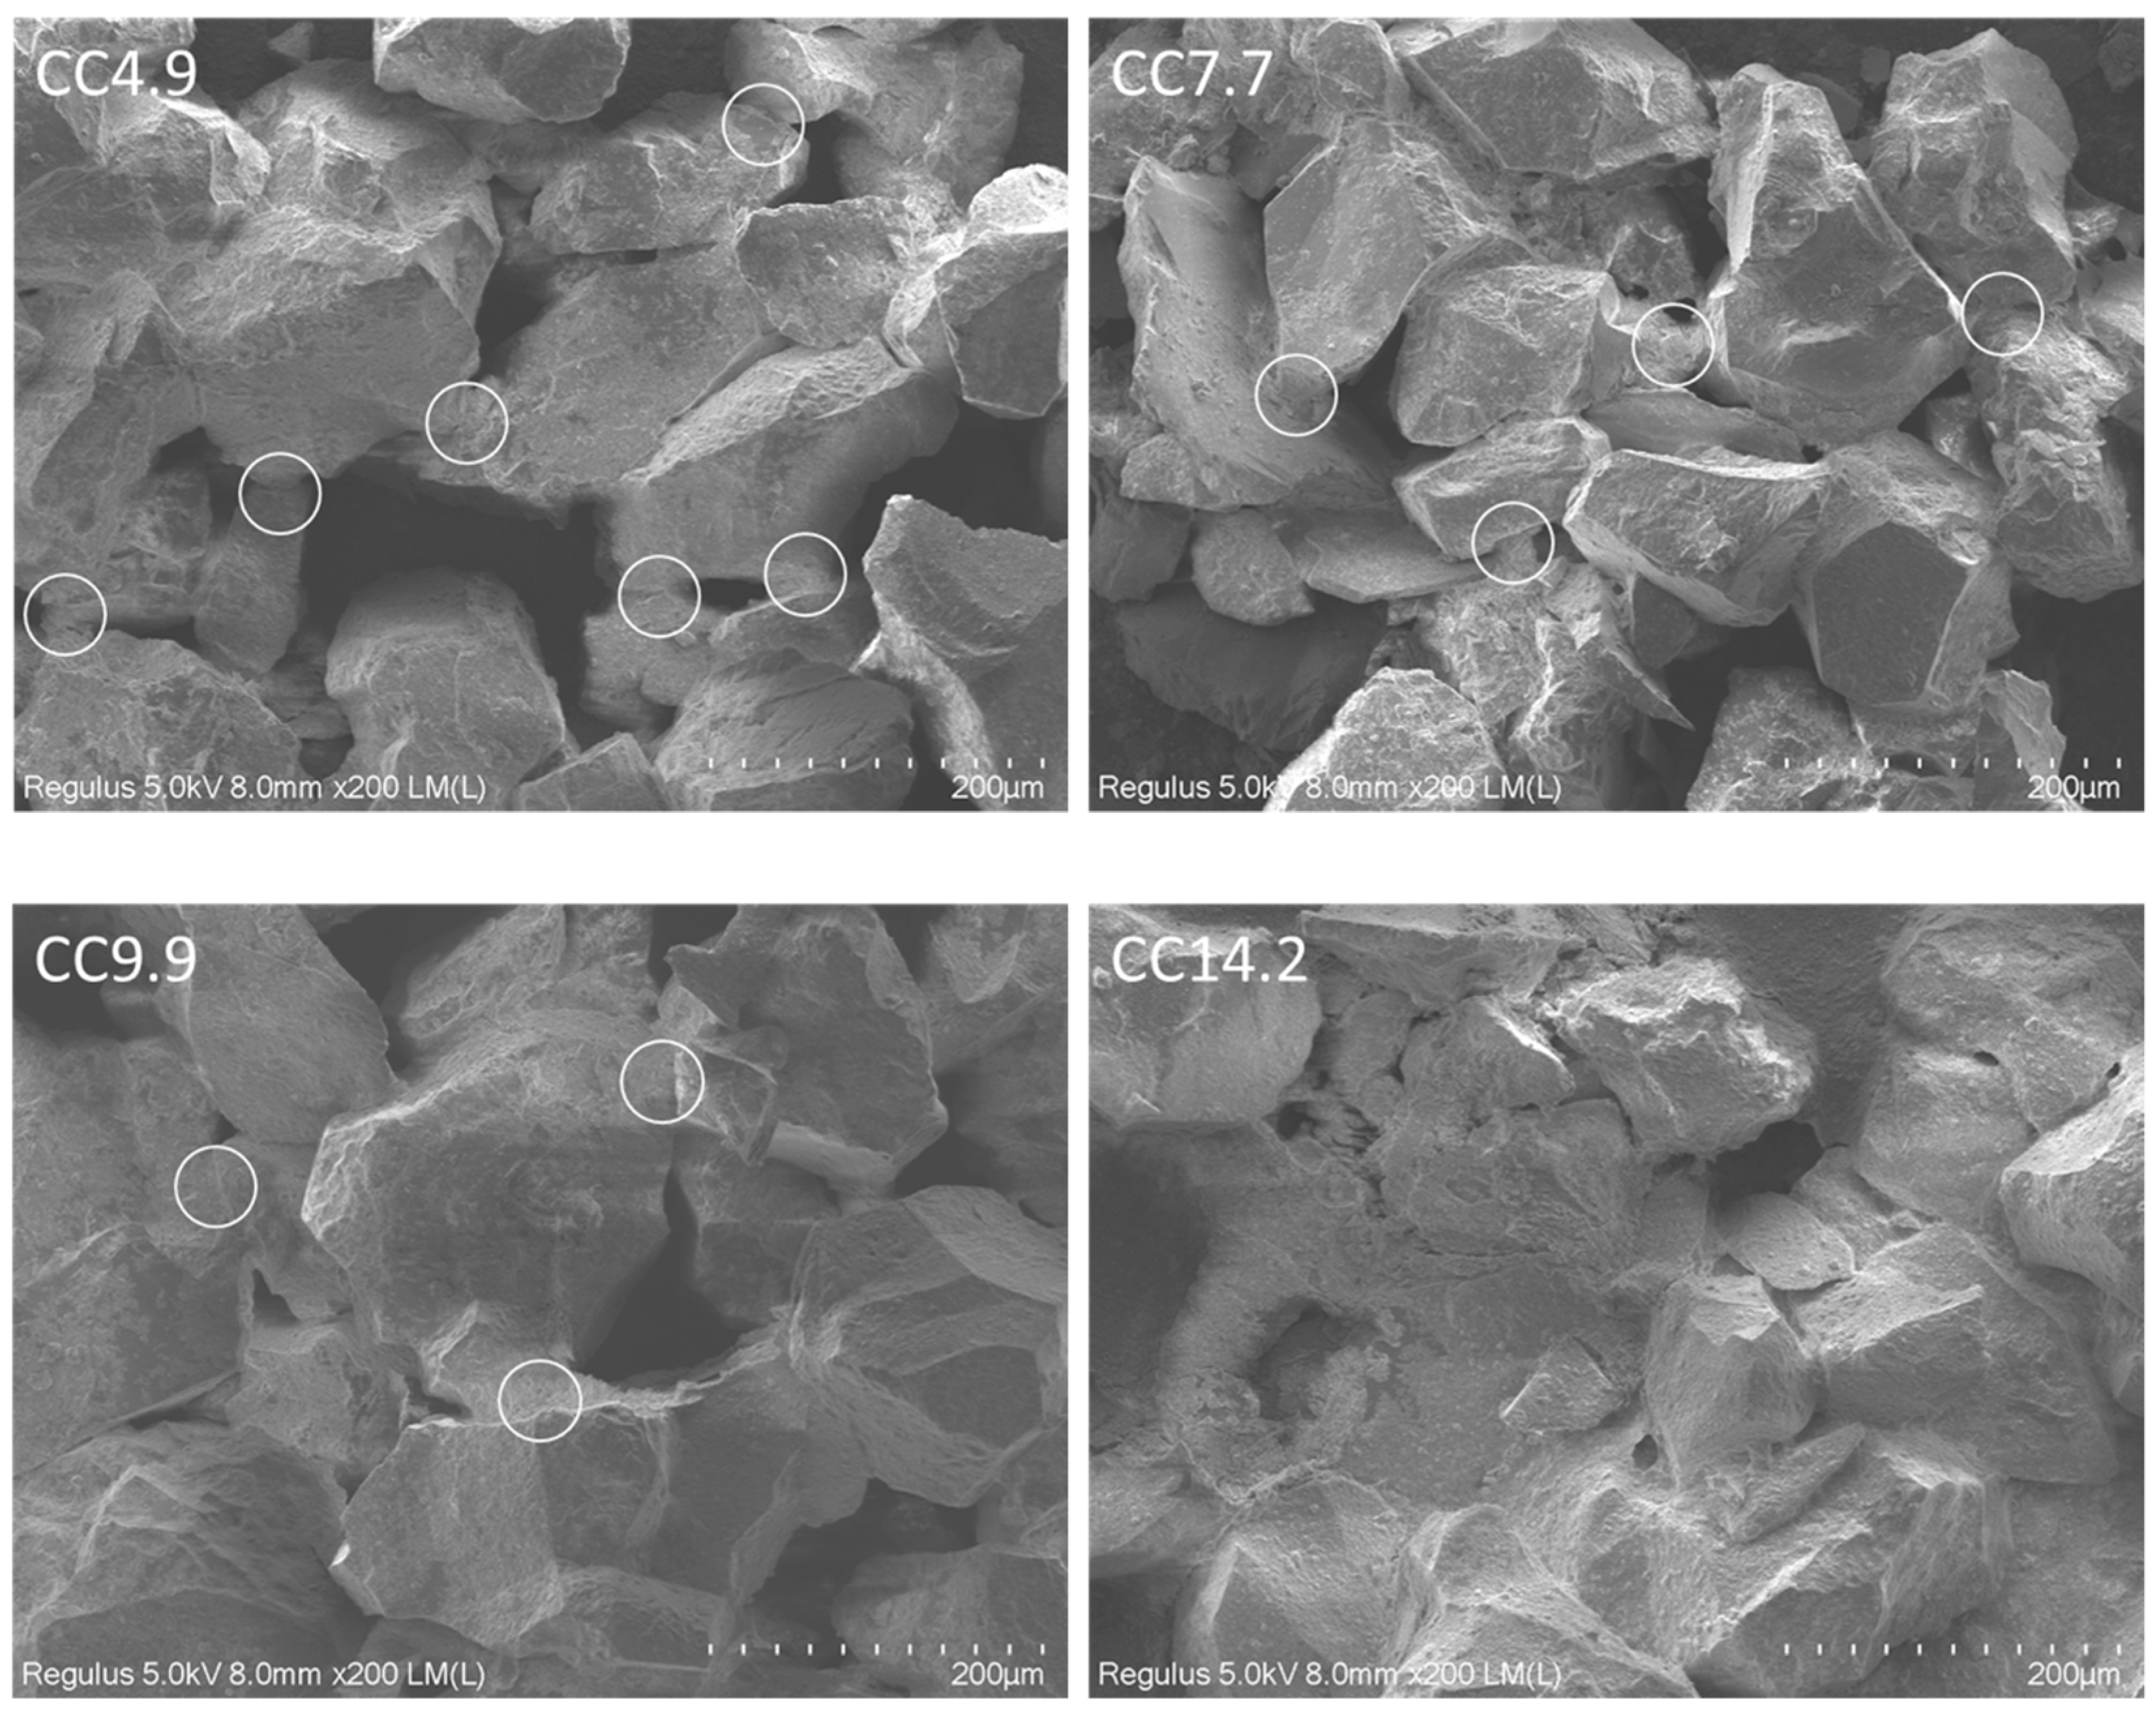
- The relationship between CC and the wave-induced liquefaction of clayey seabed was established. It was found that CC significantly affects the microfabric of seabed. Clay aggregations and matrix not only influences the permeability but also the compressibility of the seabed. Under the influence of permeability and compressibility, the seabed is in different states with different condition, from non-liquefiable (pure sand) to liquefiable (CC0.5–7.7), and to non-liquefiable (CC9.9–14.2) again.
- (5)
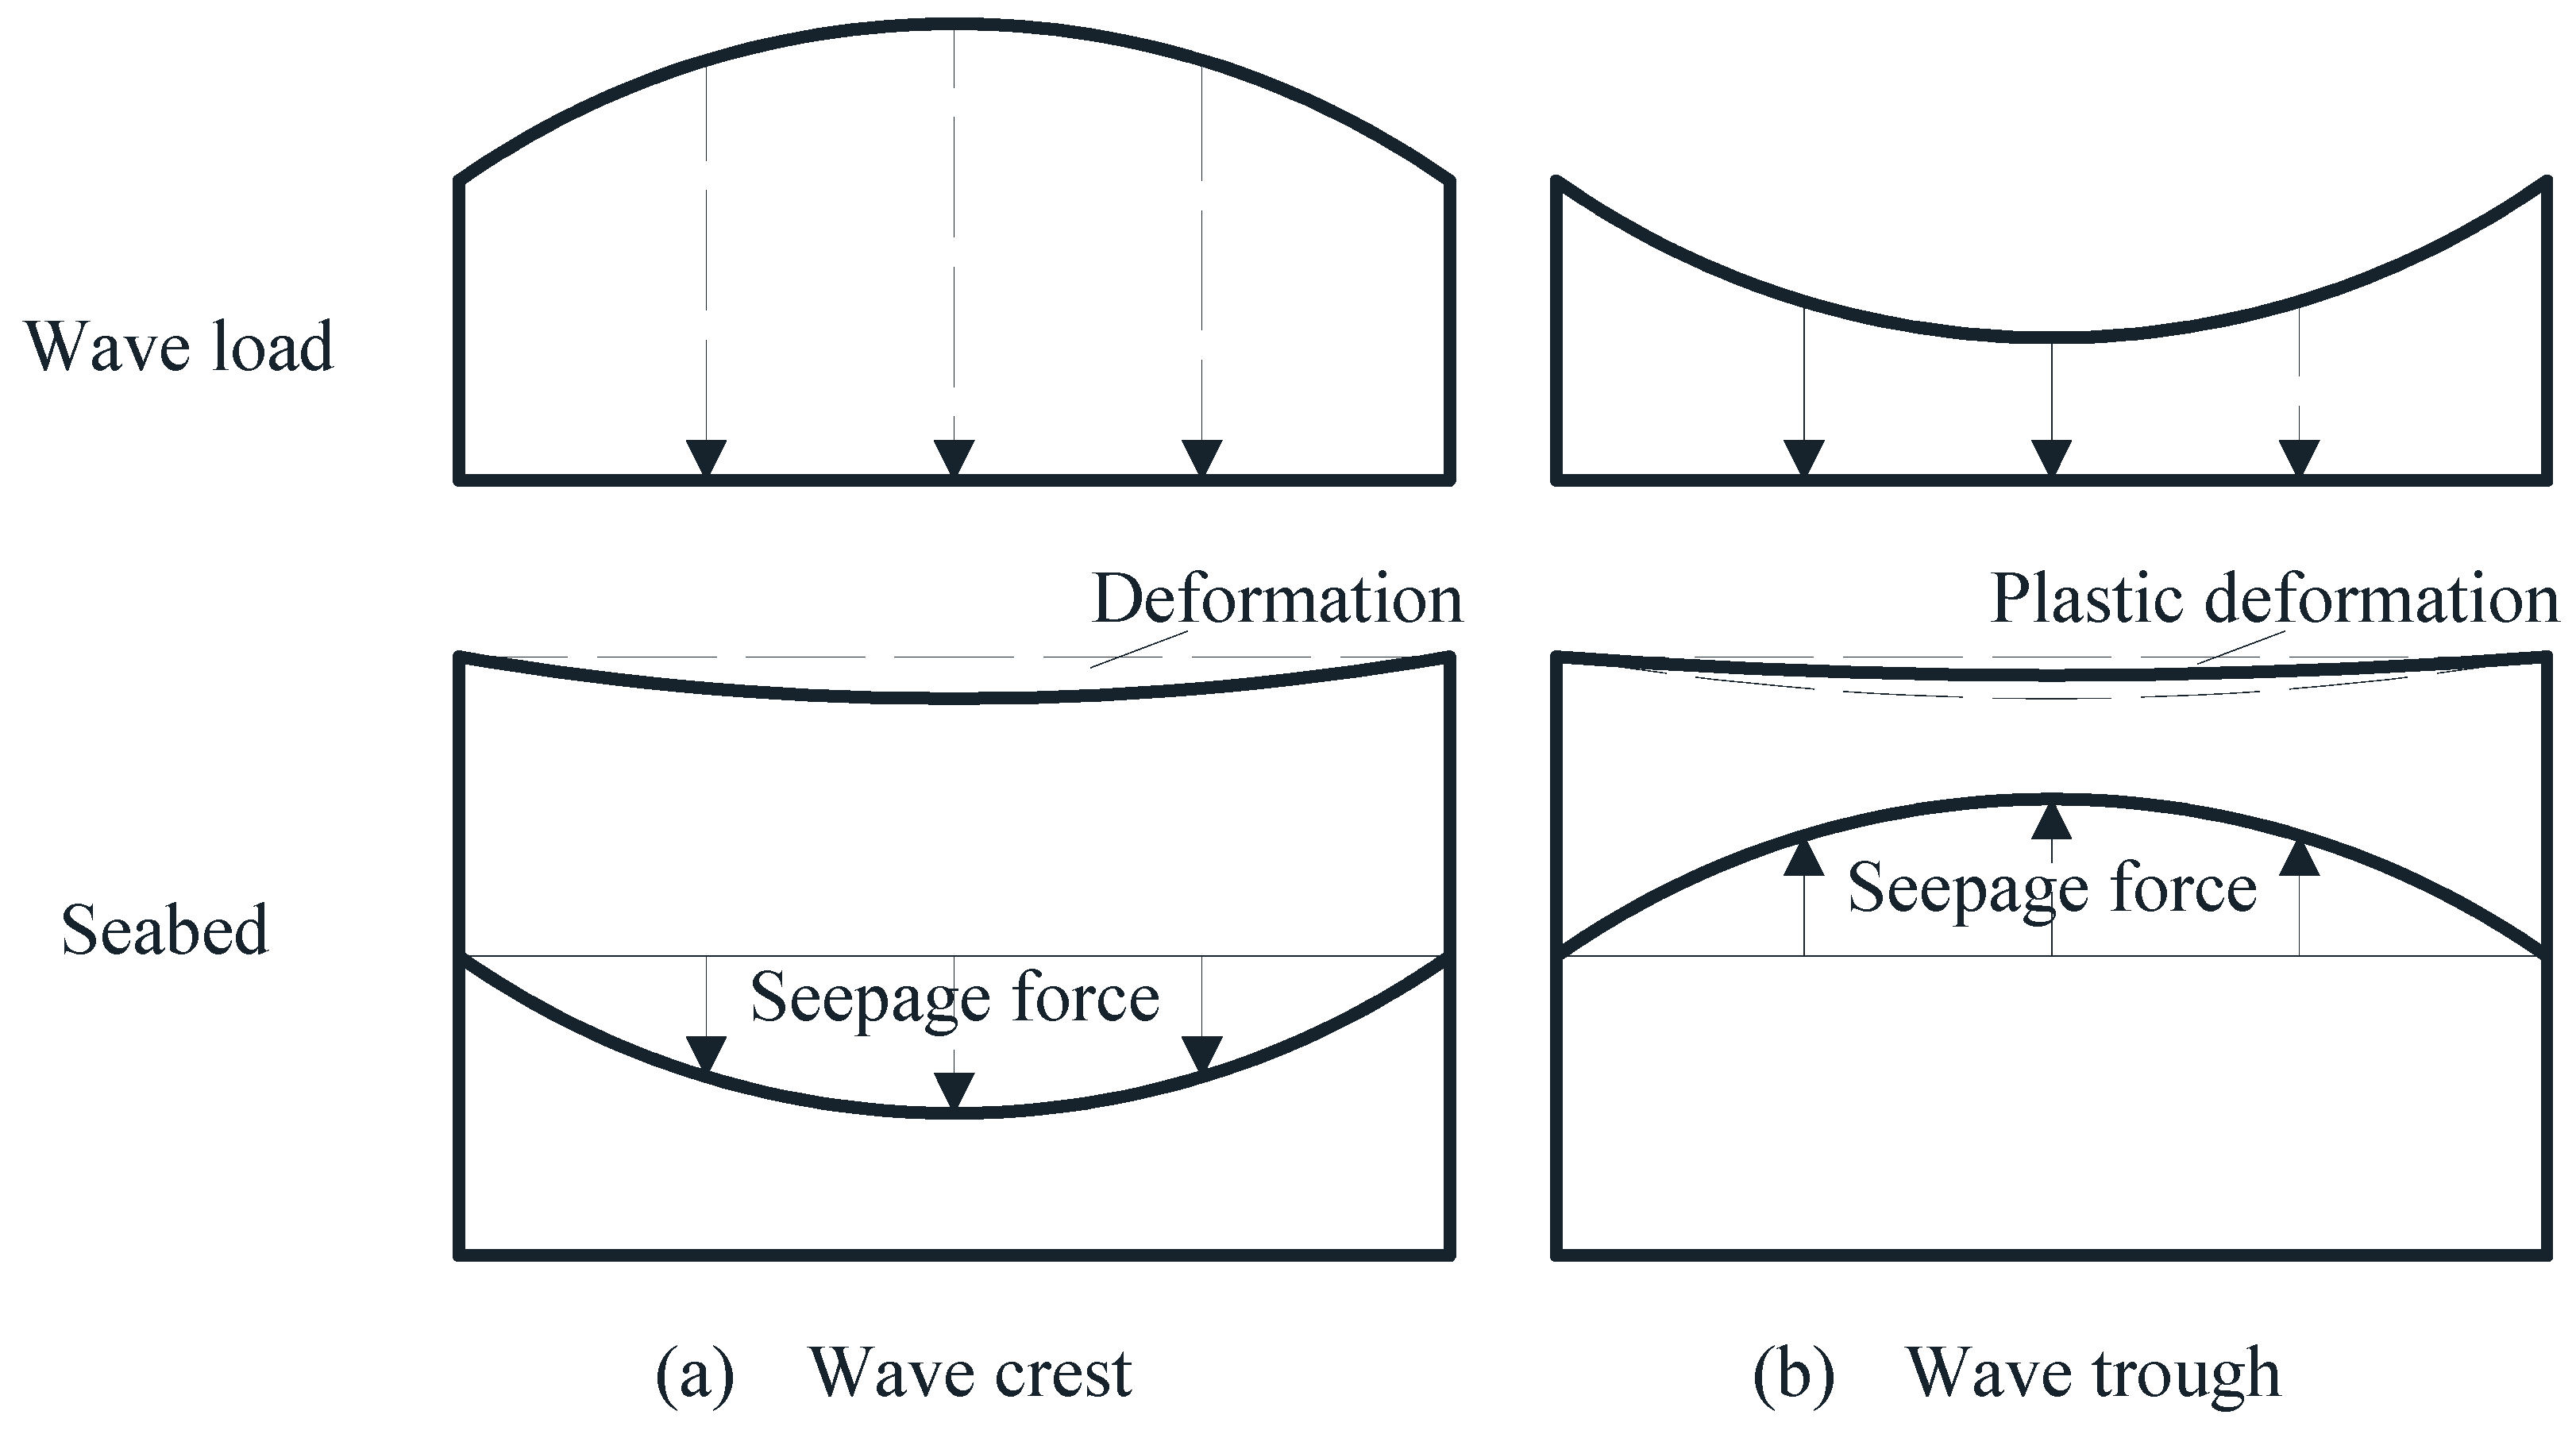
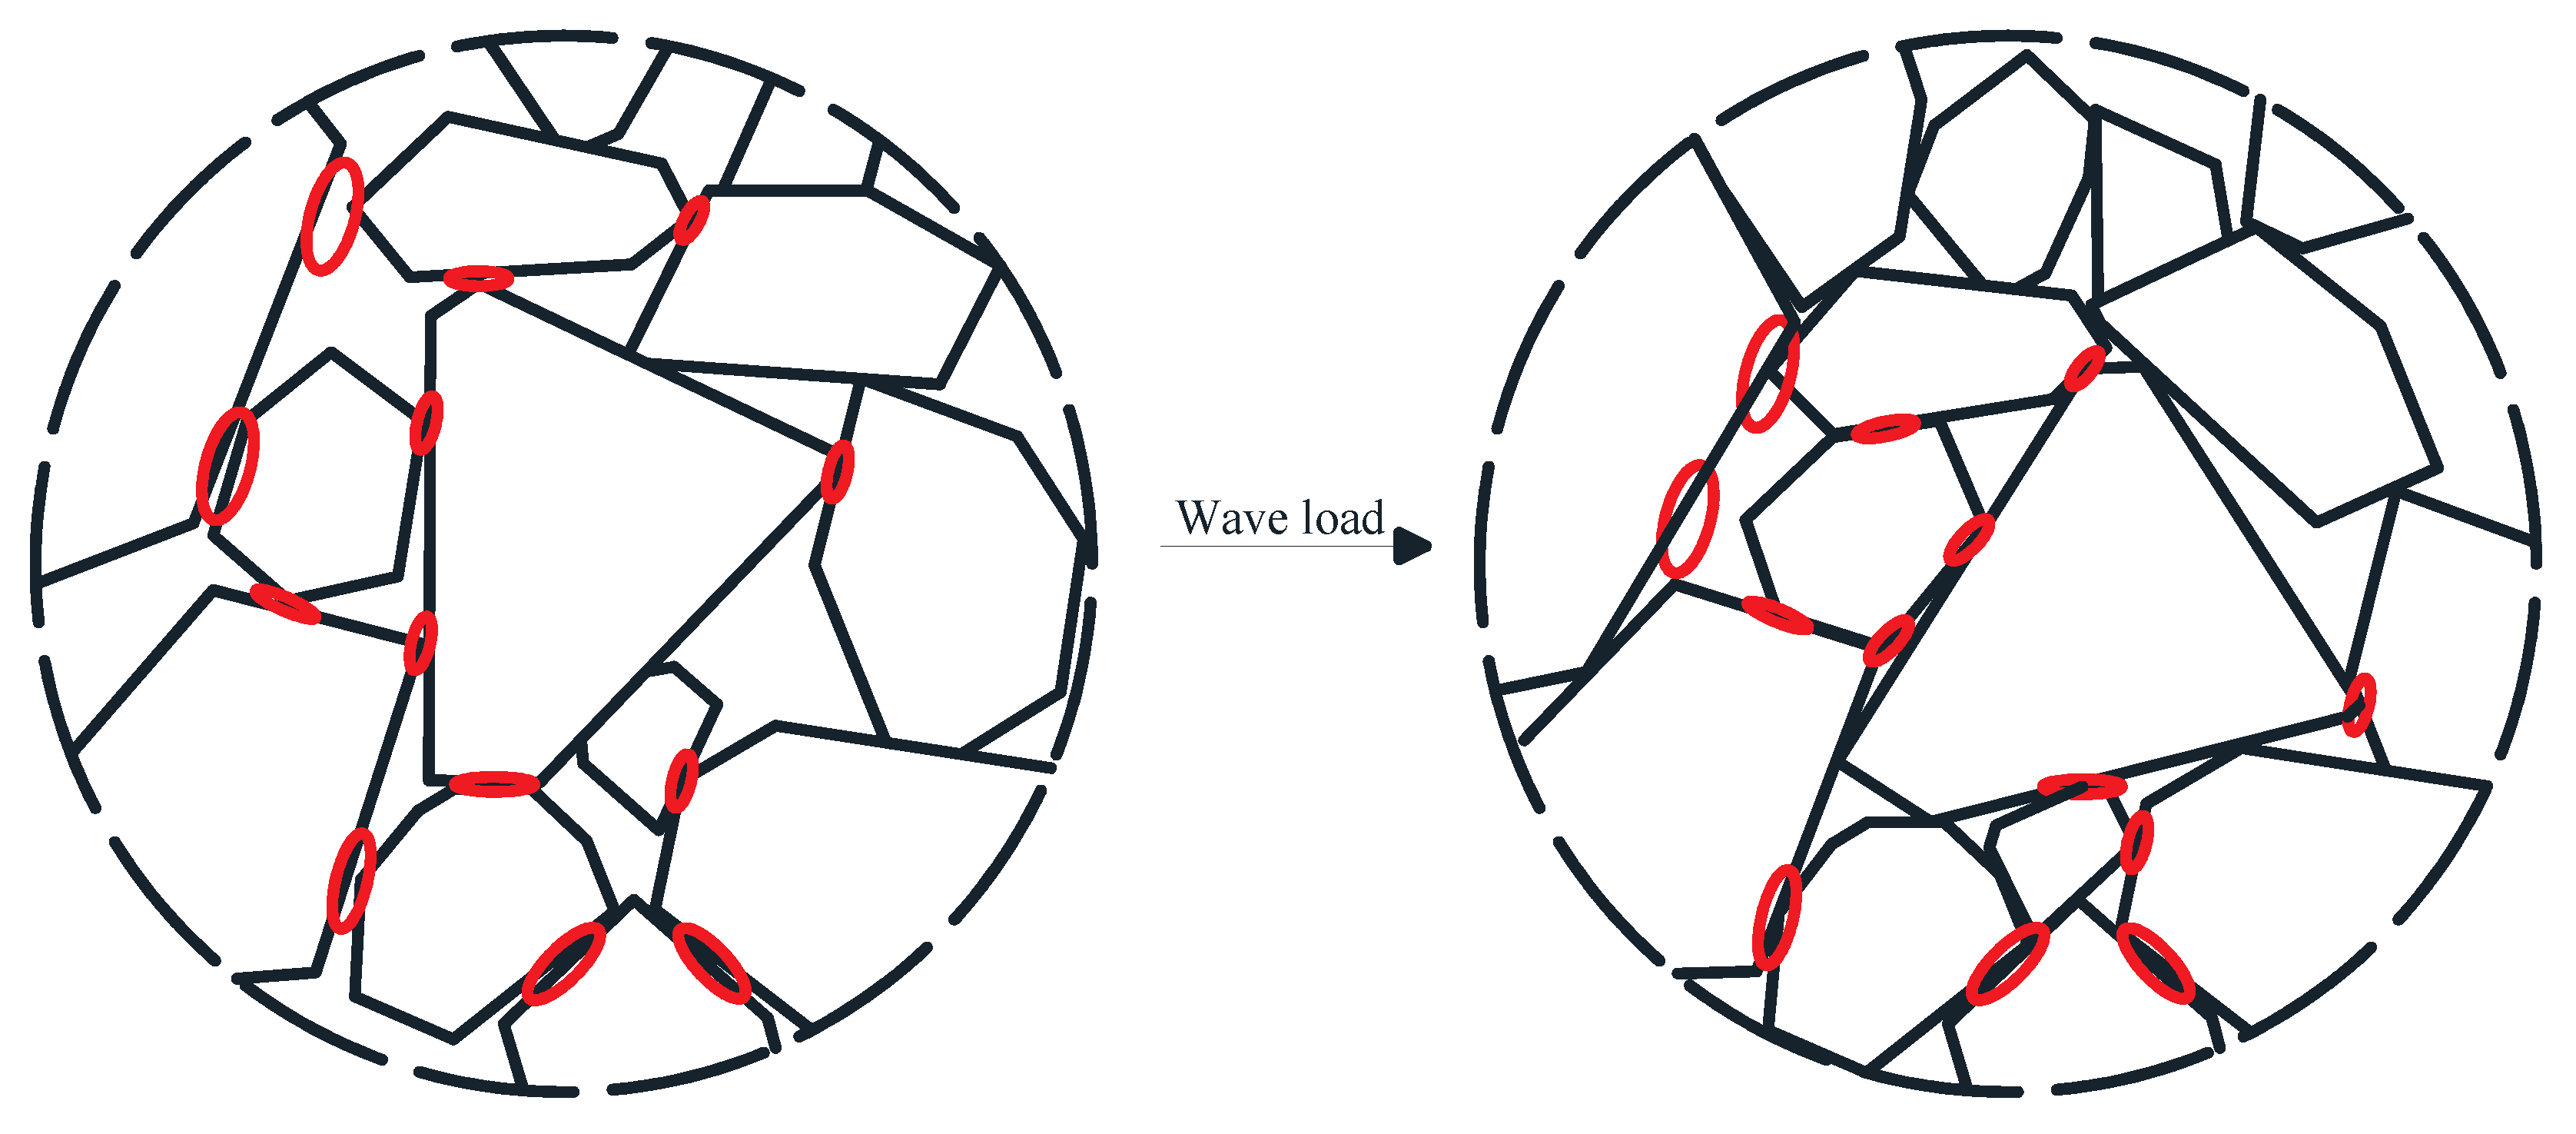
- On the basis of the obtained results, an attempt to explain the mechanism of wave-induced liquefaction of clayey seabed was made.
Author Contributions
Funding
Conflicts of Interest
References
- Sumer, B.M. Advances in Seabed Liquefaction and Its Implications for Marine Structures. Geotech. Eng. 2014, 45, 1–14. [Google Scholar]
- Seed, H.B.; Rahman, M.S. Wave-induced pore pressure in relation to ocean floor stability of cohesionless soil. Mar. Geotech. 1978, 3, 123–150. [Google Scholar] [CrossRef]
- Barends, F.B.J.; Calle, E.O.F. A Method to Evaluate the Geotechnical Stability of Off-Shore Structure Founded on a Loosely Packed Seabed Sand in a Wave-Loading Environment. Behavior of Offshore Structures. In Proceedings of the 4th International Conference, Delft, The Netherlands, 1–5 July 1985; pp. 643–652. [Google Scholar]
- Sumer, B.M.; Fredsoe, J. The Mechanics of Scour in the Marine Environment; World Scientific: Singapore, 2002; pp. 445–519. [Google Scholar]
- Tzang, S.Y.; Ou, S.H. Laboratory flume studies on monochromatic wave-fine sandy bed interactions Part 1. Soil fluidization. Coast. Eng. 2006, 53, 965–982. [Google Scholar] [CrossRef]
- Sumer, B.M.; Hatipoglu, F.; Fredsoe, J.; Sumer, S. The sequence of sediment behavior during wave-induced liquefaction. Sedimentology 2006, 53, 611–629. [Google Scholar] [CrossRef]
- Gratchev, I.B.; Sassa, K.; Osipov, V.I.; Sokolov, V.N. The liquefaction of clayey soils under cyclic loading. Eng. Geol. 2006, 86, 70–84. [Google Scholar] [CrossRef]
- Ishihara, K.; Okusa, S.; Oyagi, N.; Ischuk, A. Liquefaction induced flow slide in the collapsible loess deposit in Soviet Tadjik. Soils Found. 1990, 30, 73–89. [Google Scholar] [CrossRef] [Green Version]
- Miura, S.; Kawamura, S.; Yagi, K. Liquefaction damage of sandy and volcanic grounds in the 1993 Hokkaido Nansei—Oki earthquake. In Proceedings of the 3rd International Conference on Recent Advances in Geotechnical Earthquake, Engineering and Soil Dynamics, St. Louis, MO, USA, 2–7 April 1995; Volume 1, pp. 193–196. [Google Scholar]
- Perlea, V.G.; Koester, J.P.; Prakash, S. How liquefiable are cohesive soils. In Proceedings of the Earthquake Geotechnical Engineering, Lisboa, Portugal, 21–25 June 1999; Volume 2, pp. 611–618. [Google Scholar]
- Ansal, A.; Erken, A. Undrained behavior of clay under cyclic shear stresses. J. Geotech. Eng. ASCE 1989, 115, 968–983. [Google Scholar] [CrossRef]
- Zergoun, M.; Vaid, Y.P. Effective stress response of clay to undrained cyclic loading. Can. Geotech. J. 1994, 31, 714–727. [Google Scholar] [CrossRef]
- Lefebvre, G.; Pfendler, P. Strain rate and preshear effects in cyclic resistance of soft clay. J. Geotech. Geoenviron. Eng. ASCE 1996, 122, 21–26. [Google Scholar] [CrossRef]
- Azzouz, A.; Malek, A.; Baligh, M. Cyclic behavior of clays in undrained simple shear. J. Geotech. Eng. ASCE 1989, 115, 637–657. [Google Scholar] [CrossRef]
- Yan, S.; Xiong, Z.; Fan, Q.; Xie, S. Summarization of dynamic triaxial Experimental research on foundation soil for Yangtze Estuary deepwater channel regulation project. Port Water Eng. 2006, 397, 148–158. [Google Scholar]
- Chou, H.T.; Foda, M.A.; Hunt, J.R. Rheological Response of Cohesive Sediments to Oscillatory Forcing. Ph.D. Thesis, University of California, Berkeley, CA, USA, 1989. [Google Scholar]
- Maa, P.Y.; Metha, A.J. Mud erosion by waves: A laboratory study. Cont. Shelf Res. 1987, 7, 1269–1284. [Google Scholar] [CrossRef]
- De Wit, P.J.; Kraneburg, C. Liquefaction and erosion of China Clay due to waves and current. In Proceedings of the 23rd International Conference on Coastal Engineering ASCE, Venice, Italy, 4–9 October 1992; Volume 3, pp. 2937–2948. [Google Scholar]
- Linderburg, J.; Van Rijn, L.C.; Witerwerp, J.C. Some experiments on wave-induced liquefaction of soft cohesive soils. J. Coast. Res. 1989, 5, 127–137. [Google Scholar]
- Kirca, V.S.O.; Sumer, B.M.; Fredsoe, J. Influence of clay content on wave-induced liquefaction. J. Waterw. Port Coast. Ocean Eng. 2014, 140, 04014024. [Google Scholar] [CrossRef]
- Liu, B.; Jeng, D.S. Laboratory study for influence of clayey soils on wave-induced liquefaction. In Proceedings of the 11th Pacific/Asia Offshore Mechanics Symposium, Shanghai, China, 12–14 October 2014. [Google Scholar]
- Liu, B.; Jeng, D.S. Laboratory study for influence of clay content (CC) on wave-induced liquefaction in marine sediments. Marin. Georesour. Geotechn. 2016, 34, 280–292. [Google Scholar] [CrossRef]
- Chavez, V.; Mendoza, E.; Silva, R.; Silva, A.; Losada, M.A. An experimental method to verify the failure of coastal structures by wave induced liquefaction of clayey soils. Coast. Eng. 2017, 123, 1–10. [Google Scholar] [CrossRef]
- Osipov, V.; Nilolaeva, S.; Sokolov, V. Microstructural changes associated with thixotropic phenomena in clay soils. Geotechnique 1984, 34, 293–303. [Google Scholar] [CrossRef]
- Georgiannou, V.; Burland, J.; Hight, D. The undrained behavior of clayey sands in triaxial compression and extension. Geotechnique 1990, 40, 431–449. [Google Scholar] [CrossRef]
- Ovando-Shelley, E.; Perez, G. Undrained behavior of clayey sands in load controlled triaxial test. Geotechnique 1997, 47, 97–111. [Google Scholar] [CrossRef]
- Boulanger, R.W.; Idriss, I.M. CPT and SPT Based Liquefaction Triggering Procedures; Report No. UCD/CGM-14/01 (2014); Center for Geotechnical Modelling, Department of Civil and Environmental Engineering, University of California: Davis, CA, USA, 2014. [Google Scholar]
- Sumer, B.M.; Hatioglu, F.; Fredsøe, J. The cycle of soil behaviour during wave liquefaction. In Proceedings of the 29th International Conference on Coastal Engineering, National Civil Engineering Laboratory (LNEC), Lisbon, Portugal, 19–24 September 2004. [Google Scholar]
- Miyamoto, J.; Sassa, S.; Sekiguchi, H. Progressive solidification of a liquefied sand layer during continued wave loading. Géotechnique 2004, 54, 617–629. [Google Scholar] [CrossRef]
- Jeng, D.-S. Mechanics of Wave-Seabed-Structure Interactions; Springer: Heidelberg, Germany, 2013. [Google Scholar]
- Prakash, S.; Sandoval, J. Liquefaction of low plasticity silts. Soil Dyn. Earthq. Eng. 1992, 11, 373–379. [Google Scholar] [CrossRef]
- Wiebicke, M.; Ando, E.; Salvatore, E.; Viggiani, G.; Herle, I. Experimental measurement of granular fabric and its evolution under shearing. EPJ Web Conf. 2017, 140, 02020. [Google Scholar] [CrossRef] [Green Version]
- Li, G.X. Static pore water pressure and excess pore water pressure-A discussion with Mr. CHEN Yu-jiong. Chin. J. Geotech. Eng. 2012, 34, 957–960. [Google Scholar]

| Soil Type | CC (%) | (g/cm3) | k (cm/s) | (%) | e | (g/cm3) | (g/cm3) | (g/cm3) | |
|---|---|---|---|---|---|---|---|---|---|
| Sand | 0 | 1.785 | 0.000615 | 25 | 0.856 | 1.387 | 1.760 | 1.311 | 0.215 |
| CC0.5 | 0.5 | 1.775 | 0.000613 | 29.5 | 0.933 | 1.372 | 1.756 | 1.307 | 0.218 |
| CC1.0 | 1 | 1.771 | 0.000604 | 29.1 | 0.932 | 1.365 | 1.752 | 1.257 | 0.281 |
| CC2.4 | 2.4 | 1.714 | 0.000541 | 29.5 | 1.002 | 1.352 | 1.745 | 1.244 | 0.279 |
| CC4.9 | 4.9 | 1.698 | 0.000417 | 33.3 | 1.080 | 1.326 | 1.740 | 1.134 | 0.407 |
| CC7.7 | 7.7 | 1.673 | 0.000363 | 31.6 | 1.085 | 1.288 | 1.734 | 1.095 | 0.416 |
| CC9.9 | 9.9 | 1.676 | 0.000348 | 34.0 | 1.119 | 1.271 | 1.727 | 1.015 | 0.488 |
| CC14.2 | 14.2 | 1.601 | 0.000080 | 30.1 | 1.153 | 1.192 | 1.704 | 0.976 | 0.425 |
| Soil Type | (g/cm3) | (%) | e | (MPa) | (MPa) |
|---|---|---|---|---|---|
| Sand | 1.785 | 25 | 0.856 | 0.16 | 11.70 |
| CC0.5 | 1.775 | 29.5 | 0.933 | 0.18 | 10.53 |
| CC1.0 | 1.771 | 29.1 | 0.932 | 0.19 | 10.47 |
| CC2.4 | 1.714 | 29.5 | 1.002 | 0.23 | 8.47 |
| CC4.9 | 1.698 | 33.3 | 1.080 | 0.25 | 7.97 |
| CC7.7 | 1.673 | 31.6 | 1.085 | 0.27 | 7.60 |
| CC9.9 | 1.676 | 34.0 | 1.119 | 0.34 | 6.06 |
| CC14.2 | 1.601 | 30.1 | 1.153 | 0.39 | 5.63 |
| CC/% | D/m | |||||||
|---|---|---|---|---|---|---|---|---|
| 0 | 0.09 | 0.0284 | 0.3288 | 10 | 0.4528 | 0.3734 | ||
| 0.16 | 0.0275 | 0.1520 | 10 | 0.8050 | 0.6639 | |||
| 0.23 | 0.0671 | 0.0547 | 10 | 1.1571 | 0.9543 | |||
| 0.5 | 0.09 | 0.6133 | 0.7043 | 10 | 0.4470 | 0.3540 | 689 | 805 |
| 0.16 | 1.1557 | 0.7180 | 10 | 0.7947 | 0.6293 | 551 | 818 | |
| 0.23 | 1.6245 | 0.7377 | 12 | 1.1424 | 0.9046 | 465 | 855 | |
| 1.0 | 0.09 | 0.5303 | 0.5898 | 9 | 0.4447 | 0.3523 | 1901 | 2107 |
| 0.16 | 0.9589 | 0.6815 | 10 | 0.7906 | 0.6264 | 1450 | 2114 | |
| 0.23 | 1.5704 | 0.9363 | 11 | 1.1365 | 0.9004 | 1090 | 2153 | |
| 2.4 | 0.09 | 0.5676 | 0.7452 | 10 | 0.4119 | 0.3149 | ||
| 0.16 | 1.2606 | 1.2816 | 9 | 0.7322 | 0.5598 | |||
| 0.23 | 1.7048 | 0.6950 | 11 | 1.0525 | 0.8047 | |||
| 4.9 | 0.09 | 1.1134 | 1.2807 | 15 | 0.4026 | 0.2963 | ||
| 0.16 | 1.1605 | 0.9768 | 36 | 0.7158 | 0.5267 | |||
| 0.23 | 1.5187 | 0.5735 | 46 | 1.0289 | 0.7572 | |||
| 7.4 | 0.09 | 0.6207 | 0.5003 | 70 | 0.3882 | 0.2850 | ||
| 0.16 | 0.9852 | 0.5488 | 81 | 0.6901 | 0.5066 | |||
| 0.23 | 1.5443 | 0.2373 | 99 | 0.9921 | 0.7283 | |||
| 9.9 | 0.09 | 0.3481 | 0.1825 | 80 | 0.3899 | 0.2817 | ||
| 0.16 | 0.5829 | 0.1258 | 100 | 0.6932 | 0.5007 | |||
| 0.23 | 0.9277 | 0.2290 | 113 | 0.9965 | 0.7198 | |||
| 14.2 | 0.09 | 0.1941 | 0.0750 | 130 | 0.3467 | 0.2465 | ||
| 0.16 | 0.4392 | 0.1230 | 231 | 0.6163 | 0.4381 | |||
| 0.23 | 0.6221 | 0.2210 | 178 | 0.8859 | 0.6298 |
© 2020 by the authors. Licensee MDPI, Basel, Switzerland. This article is an open access article distributed under the terms and conditions of the Creative Commons Attribution (CC BY) license (http://creativecommons.org/licenses/by/4.0/).
Share and Cite
Zhang, J.; Jiang, Q.; Jeng, D.; Zhang, C.; Chen, X.; Wang, L. Experimental Study on Mechanism of Wave-Induced Liquefaction of Sand-Clay Seabed. J. Mar. Sci. Eng. 2020, 8, 66. https://doi.org/10.3390/jmse8020066
Zhang J, Jiang Q, Jeng D, Zhang C, Chen X, Wang L. Experimental Study on Mechanism of Wave-Induced Liquefaction of Sand-Clay Seabed. Journal of Marine Science and Engineering. 2020; 8(2):66. https://doi.org/10.3390/jmse8020066
Chicago/Turabian StyleZhang, Jun, Qin Jiang, Dongsheng Jeng, Changkuan Zhang, Xindi Chen, and Lizhu Wang. 2020. "Experimental Study on Mechanism of Wave-Induced Liquefaction of Sand-Clay Seabed" Journal of Marine Science and Engineering 8, no. 2: 66. https://doi.org/10.3390/jmse8020066