Article

Influence of Time and Frequency Domain Wave Forcing on the Power Estimation of a Wave Energy Converter Array

by
Fadia Ticona Rollano
1,
Thanh Toan Tran
2,
Yi-Hsiang Yu
2,*,
Gabriel García-Medina
1 and
Zhaoqing Yang
1,*
1
Pacific Northwest National Laboratory, 1100 Dexter Ave. North, Suite 500, Seattle, WA 98109, USA
2
National Renewable Energy Laboratory, Golden, CO 80401, USA
*
Authors to whom correspondence should be addressed.
J. Mar. Sci. Eng. 2020, 8(3), 171; https://doi.org/10.3390/jmse8030171
Submission received: 23 January 2020 / Revised: 28 February 2020 / Accepted: 28 February 2020 / Published: 4 March 2020

Abstract

:
Industry-specific tools for analyzing and optimizing the design of wave energy converters (WECs) and associated power systems are essential to advancing marine renewable energy. This study aims to quantify the influence of phase information on the device power output of a virtual WEC array. We run the phase-resolving wave model FUNWAVE-TVD (Total Variation Diminishing) to generate directional waves at the PacWave South site offshore from Newport, Oregon, where future WECs are expected to be installed for testing. The two broad cases presented correspond to mean wave climates during warm months (March–August) and cold months (September–February). FUNWAVE-TVD time series of sea-surface elevation are then used in WEC-Sim, a time domain numerical model, to simulate the hydrodynamic response of each device in the array and estimate their power output. For comparison, WEC-Sim is also run with wave energy spectra calculated from the FUNWAVE-TVD simulations, which do not retain phase information, and with wave spectra computed using the phase-averaged model Simulating WAves Nearshore (SWAN). The use of spectral data in WEC-Sim requires a conversion from frequency to time domain by means of random superposition of wave components, which are not necessarily consistent because of the linear assumption implicit in this method. Thus, power response is characterized by multiple realizations of the wave climates.

1. Introduction

Across the world there is growing interest in moving away from fossil fuel energy production to using “clean” renewable energy. In the United States, the market share of solar and wind energy has steadily increased in the past two decades, while marine renewable energy resources remain largely untapped. Conventional and well-established renewable energy power plants (e.g., solar and wind) are generally well understood electrically and have clear power signatures that are now well modeled and controlled. This is not yet the case for at-sea power technologies, especially when array dynamics are included, largely because of the fundamentally fluctuating nature of this resource. Improving our ability to characterize wave-generated power is essential to making gravity waves a more commercially viable energy source.
As has been demonstrated through the development of isolated and weak grid deployment of variable renewable technologies, specifically wind and solar photovoltaic technologies, the variations in power output, such as voltage, frequency, and rate of change, can be a problem [1], and they drive additional design considerations for wider power system development. In the case of waves, their oscillating energy often leads to large peak-to-average load ratios (e.g., torques, forces, and powers) that present challenges in the design of each wave energy converter (WEC) component. The large fluctuation in wave power output may also require additional energy storage for grid integration (e.g., batteries, supercapacitors, or a hybrid system [2,3]). This may result in an additional cost to the already costly system, considering the steep price of the WEC structure itself. Reducing wave power variability will instead reduce the cost of the system, minimize the electric losses, and improve the overall power capture efficiency—all of which are essential for the success of grid integration of WEC plants in both utility-scale and microgrid power systems. Studies have shown that the power fluctuation impact of a wave farm can be reduced for a sufficiently large wave farm [4], or when an energy storage system is introduced [2,4]. In addition, arraigning WEC devices in a geometrical array layout that is optimized for design wave conditions, can help smooth the power output [5].
To investigate the hydrodynamics of WEC arrays, researchers have used various numerical models including potential flow models; computational fluid dynamics (CFD) models; and Boussinesq, mild-slope, and spectral wave models. Each numerical model has its own advantages and disadvantages. Details of their application with respect to WEC arrays were presented and discussed in [6], taking into account the influences of Power-Take-Off (PTO) control, the array of line absorbers, WEC distancing in a wave farm, WEC layout optimizations, and mooring layout. The study also presented experimental work for different types of WECs.
Numerical wave models used for WEC array design can be categorized as phase-averaging and phase-resolving models. The power output from a wave farm has often been analyzed using a phase-averaged wave environment model (e.g., Simulating WAves Nearshore (SWAN) [7,8], WaveFarmer [9], and Telemac-Based Operational Model Addressing Wave Action Computation (TOMAWAC) [10]). The power stability of an array increases with an increasing number of devices, which is why, in general, the collective power output of a WEC array that has a sufficiently large number of devices can be resolved in the spectral domain using a phase-averaging model. This is because, with WECs placed at numerous locations, there are many opportunities to sample different parts of the waves, reducing the variability of aggregated power for the array. However, phase-averaging forcing produces low-reliability power estimates when considering individual WECs or small wave farms. In addition, all WEC farms, regardless of the number of devices in them, require a suitable size of undersea cables and transmission lines to handle the power fluctuation between the WECs and the interconnection stations. Phase-averaging models, unlike phase-resolving models, lack the capacity to simulate realistic (time domain) wave climates and operational conditions, which are critical to the design of undersea systems. Further limitations on modeling WEC farms using phase-averaging wave models are discussed in [6,11].
Phase-resolving wave propagation models have also been adopted to capture the power performance of WEC arrays. In [12], a CFD/Boussinesq coupled system was implemented to model the interaction of waves with bottom-hinged oscillating wave surge converters as an alternative to purely CFD-based models, which are rather computationally expensive. MILDwave, a time-dependent mild-slope model, has been used to calculate the energy absorption and wake effects of individual and multiple WECs, considering unidirectional and multidirectional waves [13]. In related work, a modified mild-slope model, executed in 1D and 2D modes, was used to simulate infinitely high porous boxes, representative of WECs and exposed to semi-enclosed and open beach conditions, with the intent of determining whether WECs could be used as shore protection measures [14]. Most recently, MILDwave was coupled with the potential flow solver NEMOH to investigate the placement of devices in an array [15]. Another study employed two wave models from the suite MIKE21 to model a farm of bottom-mounted devices, namely a spectral wave model used for calibration and validation, and a Boussinesq model used to simulate wave and device array interactions [16]. This research was effective in characterizing the effects of wave diffraction and refraction on the power generated by the array, with the caveat that the outlined approach cannot be used for floating devices.
In this study, we make a direct comparison between the application of a phase-resolving wave model, FUNWAVE-TVD [17] (hereafter FUNWAVE), and a phase-averaging model, SWAN, to simulate the wave environment associated with a hypothetical WEC array and evaluate their influence on power output estimation. Both models were identified in a survey of promising tools for advancing the renewable energy sector [18]. Specifically, we implement these wave models to simulate the wave climate of a virtual WEC array located at the PacWave South site off the coast of Oregon. FUNWAVE time series of sea-surface elevation and SWAN wave spectra are collected at the location of each device in the wave farm, and are then used in individual-device WEC-Sim simulations. WEC-Sim is an open-source, time domain numerical model that can simulate the hydrodynamic response of WECs and be used to analyze their power production [19]. To distinguish the influence of phase information from that of different physical considerations implemented in each model, we also execute WEC-Sim with a spectral representation of the FUNWAVE results.
This paper is organized as follows. Materials and Methods applied in the study are presented in Section 2, providing descriptions of the study site and configurations of the wave and WEC models. Model results of the power output of the devices, generated both individually and as an array, are presented in Section 3. Finally, in Section 4, we summarize and discuss the WEC-Sim model results obtained from simulations driven by FUNWAVE and SWAN forcing, highlighting the key points of this study.

2. Materials and Methods

2.1. Study Site

We selected PacWave South (hereafter PWS), formerly known as the Pacific Marine Energy Center–South Energy Test Site (PMEC-SETS), off the coast of Oregon as our study site because it is a recognizable place of interest for the wave energy community where utility-scale WECs are expected to be tested in the future. PWS is operated by Oregon State University and is located approximately six nautical miles offshore from Newport, Oregon. It will be the first grid-connected test facility of its kind in the United States, and because it is also fully permitted it is expected to promote the commercial growth of marine energy.
The general location of PWS is shown in Figure 1a. Figure 1b, shows the parcels that make up the PWS project site, which are leased from the Bureau of Ocean Energy Management; the domain extents of the SWAN and FUNWAVE wave models; and the layout of the virtual WEC array. The bathymetry for the study site was obtained from the National Oceanic and Atmospheric Administration (NOAA) National Centers for Environmental Information [20] and its extents align with the SWAN model domain. The source bathymetry has a space resolution of 1 m in each direction, but coarser resolutions of 20 m and 2 m are used in the SWAN and FUNWAVE models, respectively. These resolutions were determined by convergence tests (not shown). As a time domain model executed with fine temporal resolution, FUNWAVE is computationally more expensive than SWAN, for which we subsampled the source bathymetry down to a smaller region of 8 km in the cross-shore direction by 4 km in the longshore direction.
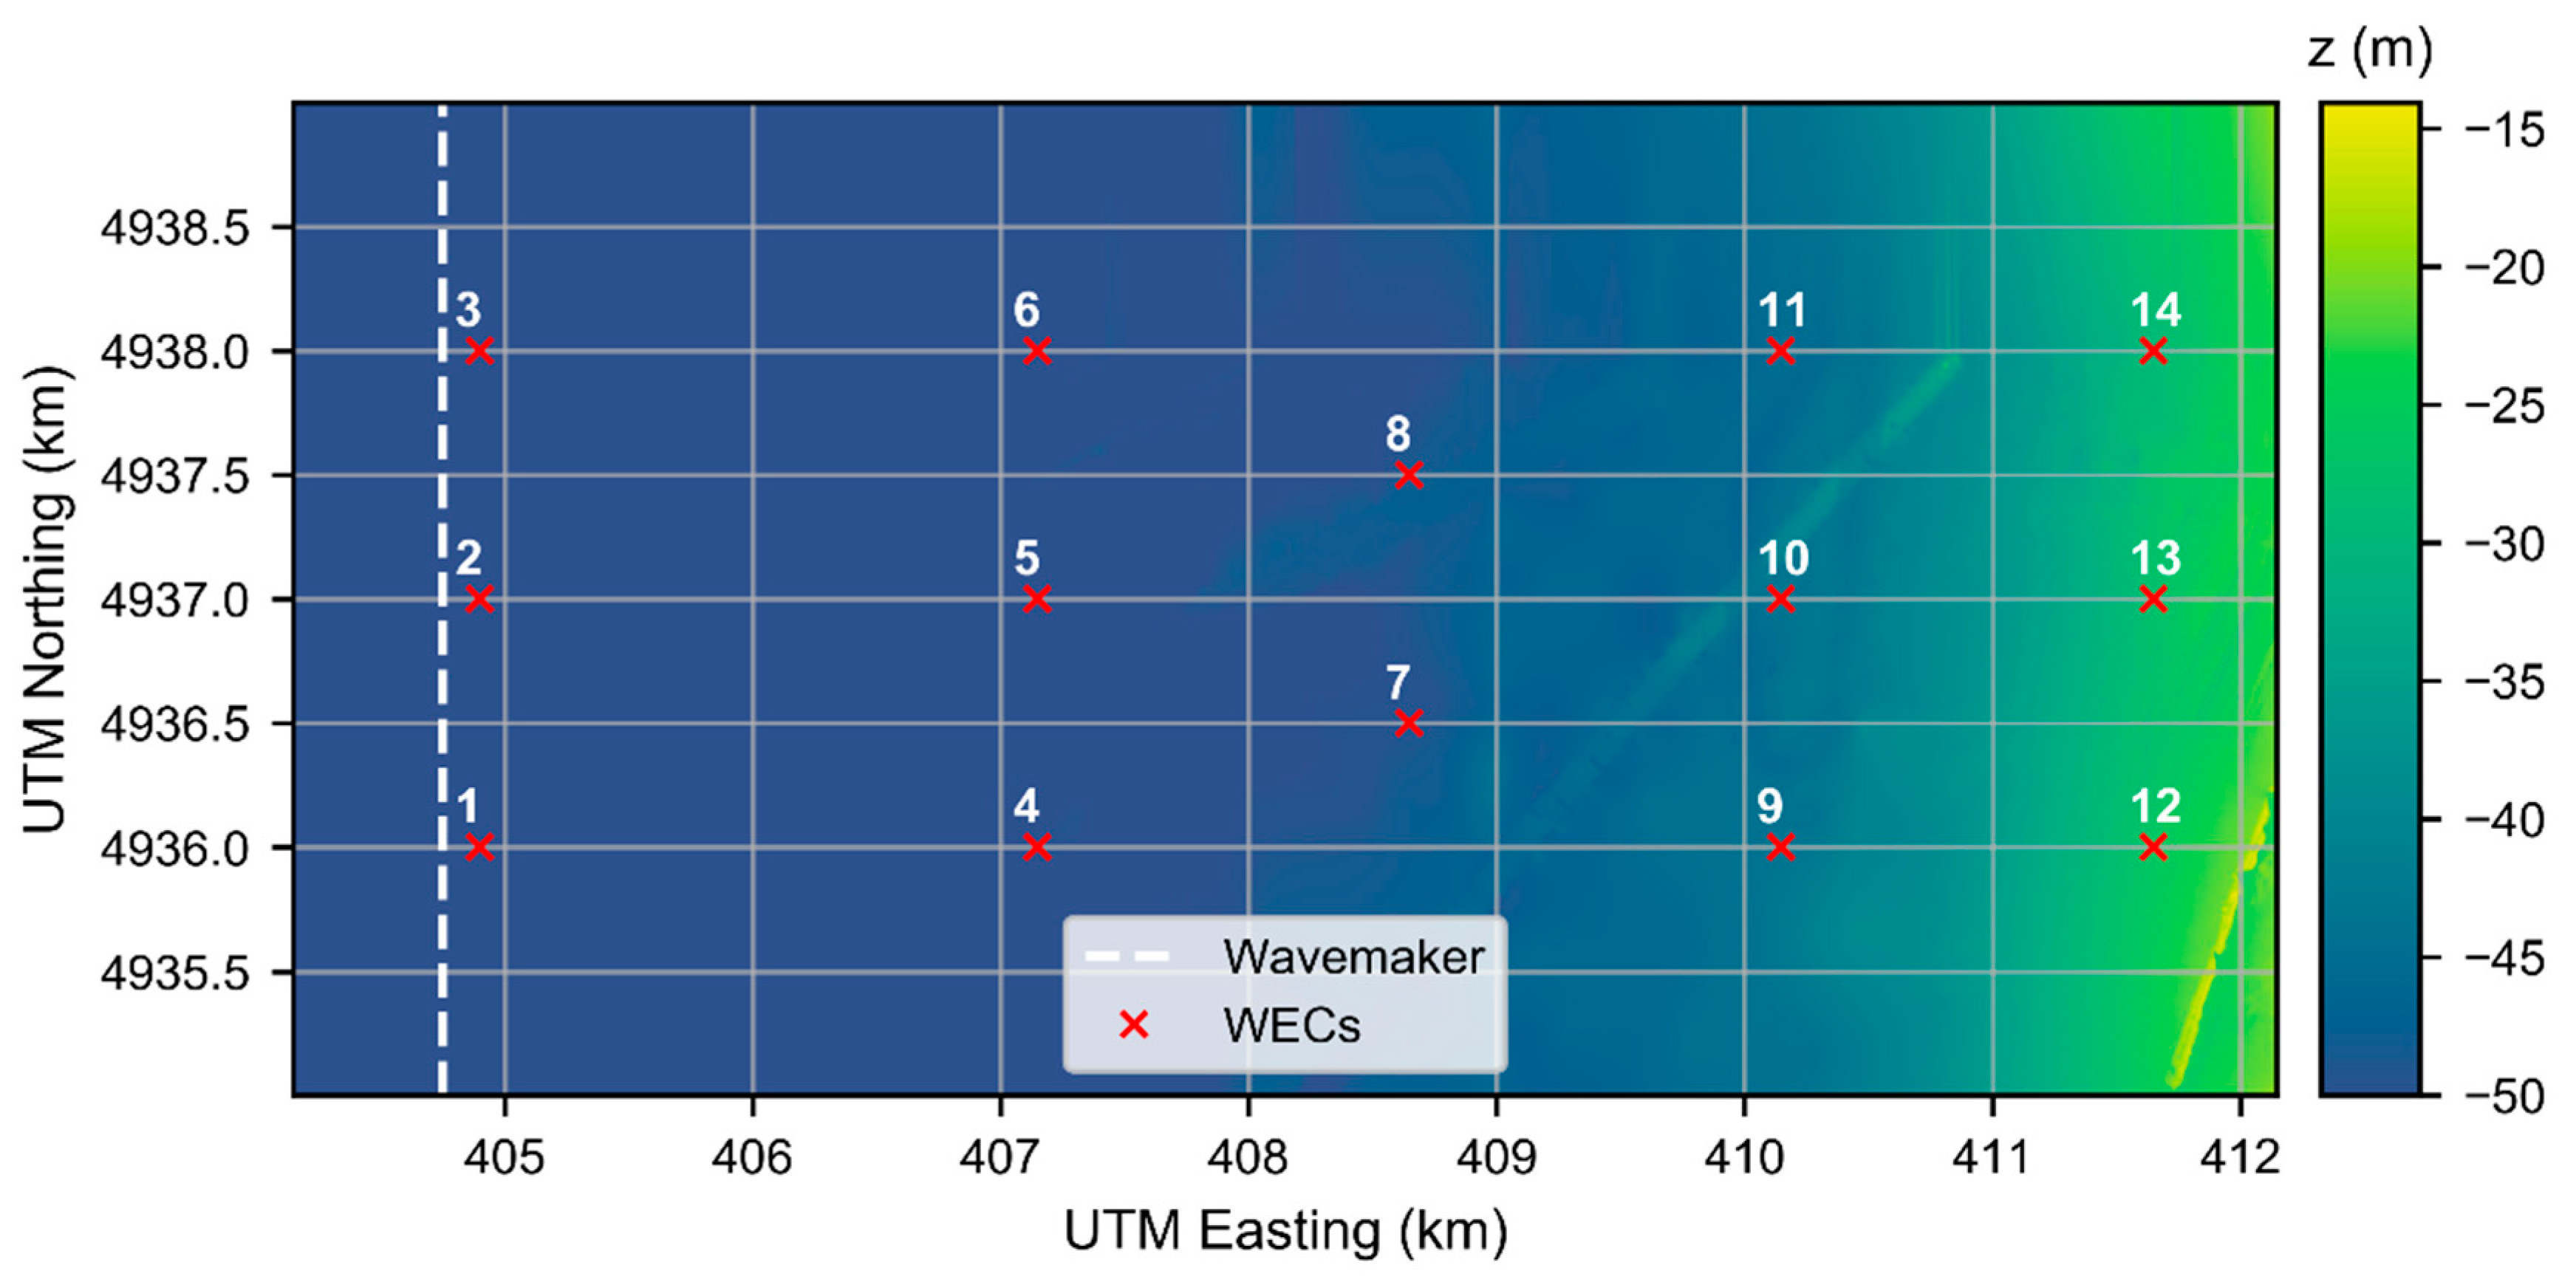
While several studies focused on the optimal placement of devices in a wave farm (see [21] for a detailed survey of such), we determined that a simplistic design would be most appropriate for this study. Here, a virtual WEC farm spans approximately a quarter of the PWS parcels and extends about 3 km farther on the shoreward end, thus capturing depths in the 15 to 50 m range, which is the operational range of depths of the model WEC used in this study (described in Section 2.3). Our main layout consideration was to ensure that WECs in the array were placed far enough apart from one another such that any interference between them could be considered negligible. For validation purposes, we placed WECs 1–3 close to the offshore boundary of the FUNWAVE model domain, near where waves are generated in that model and their energy most closely matches their source.
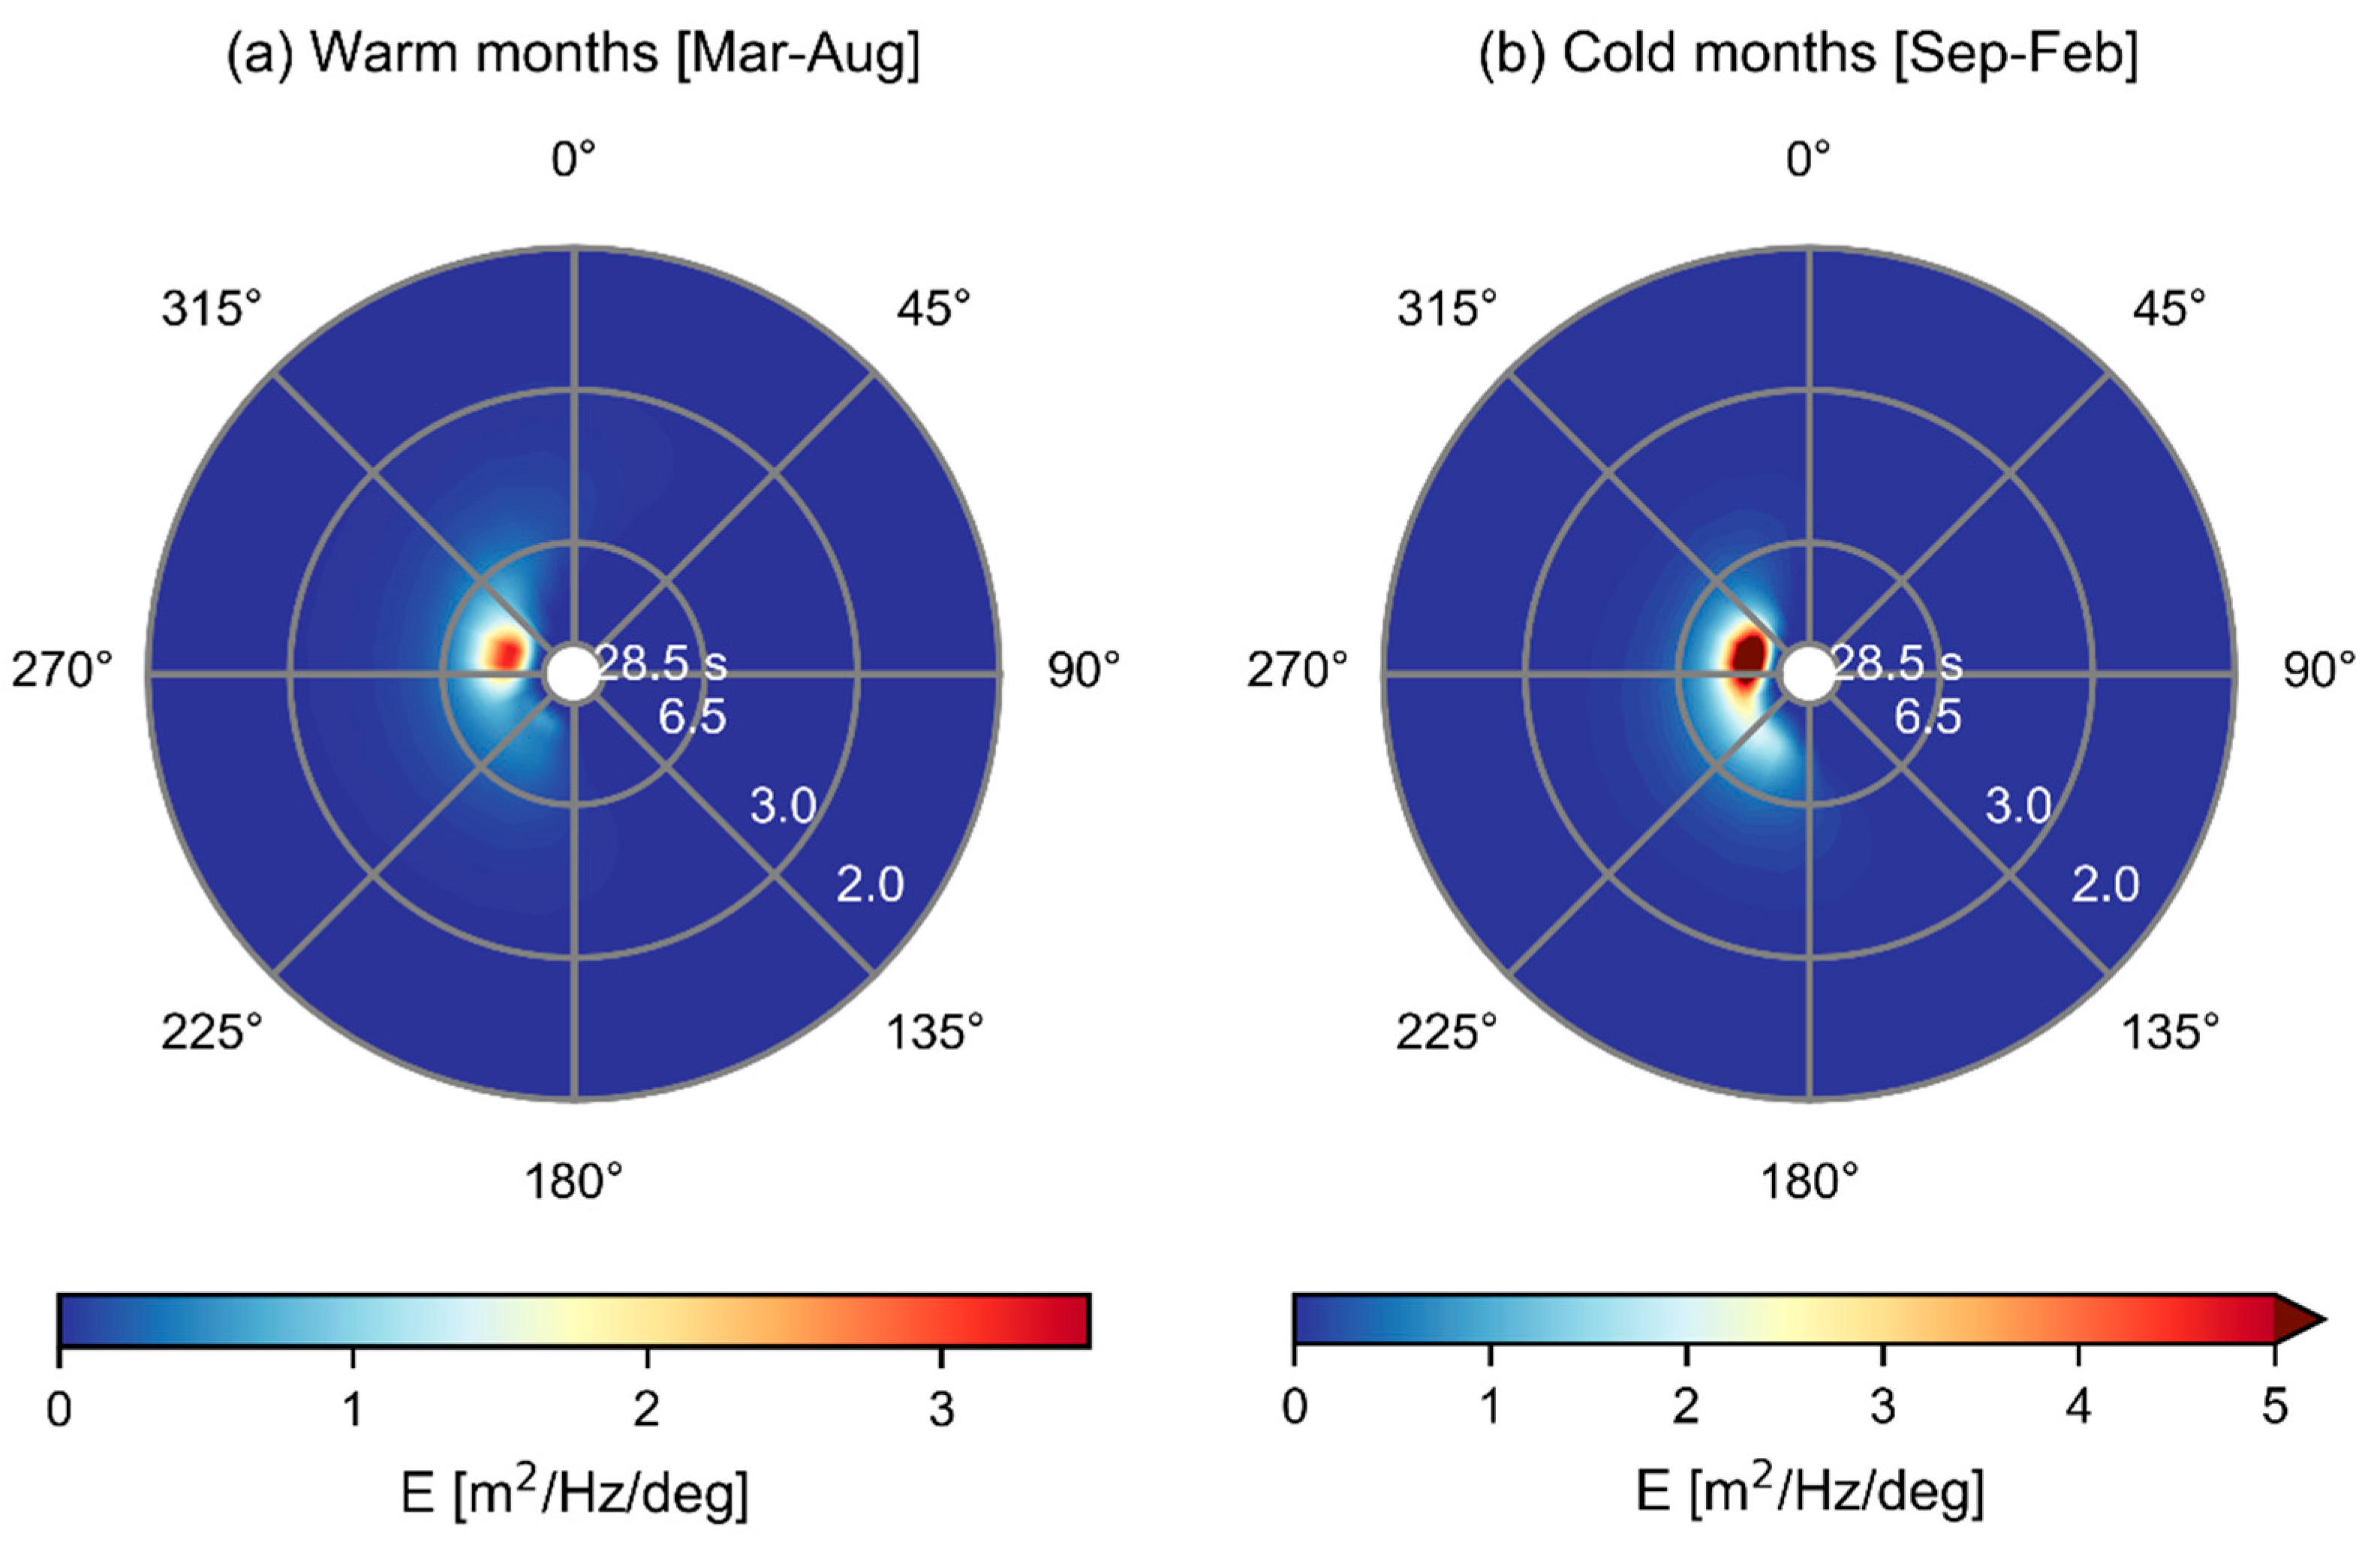
The wave climate in Oregon is characterized by two very distinct seasons: calm summers and energetic winters (e.g., [22,23]). The offshore boundary conditions were obtained from a regional 32-year wave climate hindcast study [24]. Wave spectra were collected every hour near the study site between January 1, 1979 and December 31, 2010. The wave spectrum was discretized with 24 directions and 29 frequencies from 0.035 Hz to 0.505 Hz. Results from Wu et al. [24] show good agreement with observations and replicate the wave seasonality very well. Figure 2 shows the wave climate at the PWS site obtained by averaging the spectra over the 32 years for the warm months (March–August) and cold months (September–February) separately. The warm months are characterized by a significant wave height ( H s ) of 2.1 m, an energy period ( T e ) of 9.9 s, a mean wave direction ( D p ) of 292°, and a directional spread of ( σ θ ) 5.8°. For the cold months H s is 3.0 m, T e is 11.1 s, D p is 278°, and σ θ is 4.3°.

2.2. Configuration of Wave Models

2.2.1. SWAN

For a phase-averaged wave simulation at the PWS site we implement the third-generation spectral model SWAN [25]. This open-source model has been widely used in wave resource assessments because of its accuracy and computational efficiency (e.g., [22,24,26,27,28,29]). It is likely that when estimating the wave climate at a study location a third-generation wave model will be implemented given that these types of models meet international standards for conducting wave resource assessments [30]. For these reasons, we select SWAN as one of the representative models.
SWAN solves the wave action balance equation:
N t + c g x N x + c g y N y + c θ N θ + c σ N σ = 1 σ ( S i n + S d s + S n l + S t r i + S b o t + S b r k )
where N ( t , x , y , θ , σ ) = E / σ is the wave action, E is the wave energy density, t is time, x and y are the spatial dimensions, θ is the wave direction, σ is the wave frequency, and c is the velocity of propagation. The wave action is balanced by wave growth due to wind ( S i n ), wave dissipation due to whitecapping ( S d s ), nonlinear quadruplet interactions ( S n l ), triad interactions in shallow water ( S t r i ), losses due to bottom friction ( S b o t ), and losses due to depth-induced wave breaking ( S b r k ). To simulate the climatological conditions at the study site, SWAN is executed in stationary mode with default parameters for the source terms forced by the seasonal spectra shown in Figure 2. Frequency-dependent spectra are collected at the virtual WEC sites.

2.2.2. FUNWAVE

We use FUNWAVE version 3.3 [31] to simulate the phase-resolved wave climate in the time domain at PWS. FUNWAVE is a fully nonlinear wave model that operates with a hybrid finite-volume and finite-difference TVD-type scheme. The model’s formulation is based on Boussinesq-type equations first derived by Nwogu [32] and later modified by Chen et al. [33] and Chen [34] to improve the representation of higher-order advection terms. The governing equations also incorporate a time-varying reference level for z -dependent terms [35]. FUNWAVE solves the following equations:
η t + · M = 0
and
u α , t + ( u α · ) u α + g η + V 1 + V 2 + V 3 + R = 0
where Equations (2) and (3), respectively, are statements of depth-integrated mass conservation and depth-averaged horizontal momentum. In Equation (2), M is the horizontal flux and can be further expressed as:
M = ( h + η ) [ u α + μ 2 { ( z α 2 2 1 6 ( h 2 h η + η 2 ) ) ( · u α ) + ( z α + 1 2 ( h η ) ) ( · ( h u α ) ) } ]
Here, η is the sea-surface elevation and η t is its time derivative; h is the water depth; u α is the horizontal velocity at the adaptive reference elevation, z α ; and μ is a dimensionless measure of dispersion given by the ratio of a characteristic water depth to a horizontal length. In Equation (3), g is the gravitational acceleration, V 1 and V 2 are the dispersive Boussinesq terms, V 3 accounts for the second-order effect of vertical vorticity, and R represents diffusive and dispersive terms including bottom friction and subgrid lateral mixing.
Wave generation in FUNWAVE is done using the source function method [36,37]. Through the application of the governing equations in a source region inside the model domain, FUNWAVE can generate regular and irregular waves from a two-way internal wavemaker. In this study, we run the model with a 2D wavemaker that takes user-defined spectral data in the form of wave amplitudes, a ( f , θ ) , paired with random phases, to generate irregular directional waves. This type of wavemaker has been shown to accurately represent complex sea states [38].
To ensure the numerical stability of the wave model, it is a best practice to discretize each frequency-direction spectrum into energetically equalized components along both of its dimensions, before computing the wave amplitudes needed to use a 2D wavemaker. In the frequency domain, this is accomplished by resampling the frequency spectra (direction-integrated frequency-direction spectra) into equal-energy bins. In the direction domain, we compute a discretized wrapped-normal directional-spreading function:
G ( θ ) = 1 2 π + 1 π n = 1 N e [ ( n σ θ ) 2 2 ] cos n θ
where σ θ is the directional spread and N = 20 . The wave directions, θ , span the range [ θ p π 3 ,   θ p + π 3 ] , where θ p is the peak direction. Then, following Grassa [39], we calculate the wave amplitude components associated with each PWS seasonal spectrum such that:
a ( f , θ ) = 2 m 0 N f N θ
where m 0 is the zeroth moment of the spectrum, and N f = 144 and N θ = 50 are the number of equal-energy frequency and direction components, respectively. Please note that with this approach, every frequency-direction pairing corresponds to a single wave amplitude value per spectrum.
For a more robust statistical analysis of the random sea states, we run three realizations per seasonal climate for a total of six model runs. Each realization is obtained by executing the model using a different random phase seed every time. Sea-surface elevation is computed throughout the entire domain and collected at the 14 WEC stations shown in Figure 3. The model is executed for 2,100 s and the output is stored with a time resolution of 0.1 s. The Courant number used in the time-stepping scheme in the model is lowered from a default value of 0.5 to 0.2 to achieve numerical stability. The model is otherwise run with default-value parameters.
Also shown in Figure 3, is the bathymetry within the FUNWAVE domain, which was subsampled from that shown in Figure 1 and modified to have a flat bottom near the internal wavemaker. The north and south bathymetric profiles were interpolated bilinearly over a 1-km band that is appended to the north of the domain, making the domain bottom periodic. The resulting bathymetry ranges from ~15 m to 50 m, and WECs of equal easting coordinates are at roughly the same depth. The internal wavemaker is located 500 m from the west boundary at a 50-m water depth. We avoid reflection and discontinuity problems by applying periodic north-south boundary conditions and placing sponge layers of 500 m and 100 m in width along the west and east boundaries, respectively. Table 1 summarizes the setup of the FUNWAVE runs, including some details previously mentioned in Section 2.1.

2.3. WEC-Sim Model Configuration

In this study, the linear-based, time domain model WEC-Sim is used to calculate the WEC hydrodynamics, the linear damping PTO, and the restoring mooring force. WEC-Sim solves the dynamic equation of motion for each body based on Cummins’s equation [40]. The dynamic equation of motion for a floating-body system, in which each body’s position is defined relative to its center of gravity, is given as:
( m + A ) X ¨ = t K ( t τ ) X ˙ ( τ ) d τ + F e x t + F v i s + F r e s + F P T O + F m o
where m is the mass matrix; A is the added-mass matrix at infinite frequency; X is the body displacement, including translational and rotational modes; K is a matrix of the impulse response function; F e x t is the wave-excitation force; F v i s is the quadratic viscous drag force, calculated using Morison’s equation; F r e s is the net buoyancy restoring force; F P T O is the PTO force; and F m o is the mooring force. Herein, the hydrodynamic coefficients, including added mass, wave excitation, impulse response function, and restoring stiffness, were obtained from the potential flow program WAMIT. The PTO force is calculated using a simple linear damping algorithm. In addition, the mooring force is computed using a mooring matrix that represents the restoring force of the mooring line connected between the device and the seabed.
Each hypothetical WEC is modeled in WEC-Sim as a two-body floating-point absorber (FPA). This WEC device was developed as part of the U.S. Department of Energy’s Reference Model Project [41]. The FPA model, as shown in Figure 4a, consists of a float and a spar/plate that are connected to a central column, and it transforms energy from the relative motion in the axial direction between these components induced by ocean waves. Additional specifications for the full-scale WEC device are presented in Table 2. The masses of the float and spar/plate are located at their equilibrium positions in which each body mass equates to its mass of displaced water. Figure 4b illustrates the two-body FPA in the WEC-Sim model and block modules for calculating the wave radiation, excitation, net buoyancy restoring, viscous damping, and PTO force. More details about the model settings and validation of the hydrodynamic response are described in [42].
In this study, WEC-Sim is executed using wave information provided by either a wave time-history or a wave spectrum. In the case of the latter, the WEC-Sim code internally generates a random-phase wave process. Using the hydrodynamic coefficients obtained from WAMIT, the viscous damping coefficient, the PTO mechanism, and the time domain forces are calculated by the WEC-Sim code. Bulk parameters (average power and peak-average power) to characterize the power potential of the individual WECs and of the array as a whole are calculated in post-processing. The average power time-histories of the WEC farm are calculated by averaging the power time-histories of all WEC devices. The peak-average power is the maximum observation in a given average power time-history of the WEC farm.

3. Results

3.1. FUNWAVE Model Performance

For the six FUNWAVE simulations (3 realizations for each seasonal climate), it took an average of 5.1 days of running the model in parallel to obtain 35 min (2100 s) of record length. For illustration purposes, time series subsections at the 14 WEC locations are shown in Figure 5 for the first realizaton of each seasonal case. As expected, there is variability in the wave amplitudes and phases at the device locations at any given time-step. Animations of sea-surface elevation over the model domain (not shown) reveal good agreement with the hindcast wave conditions. The wave climate in the simulation of warm months is appreciably calmer (lower wave heights and longer periods) and features waves coming from a more northerly direction than in the simulation of cold months. For the given domain extents, it takes 600 s for waves to propagate from the wavemaker to the shoreward boundary. WEC-Sim is run with the complete length of the FUNWAVE time series as input, but the first 600 s of recorded data are removed in the forthcoming model performance assessment.
As a proxy for model validation, we compute the frequency energy spectra associated with the three virtual WECs closest to the wavemaker (1, 2, and 3) and compare them to the input 32-year hindcast spectrum of each seasonal climate (see Figure 6). These three stations are close to the wavemaker and thus are expected to follow the target spectrum closely. FUNWAVE captures nonlinear processes that phase-averaged models do not, so at all WEC locations we observe high-frequency harmonics in addition to the peak. We also once again notice spatial variability between WECs and between realizations (k1, k2, and k3), which reflects the phase-resolved nature of the random waves modeled.
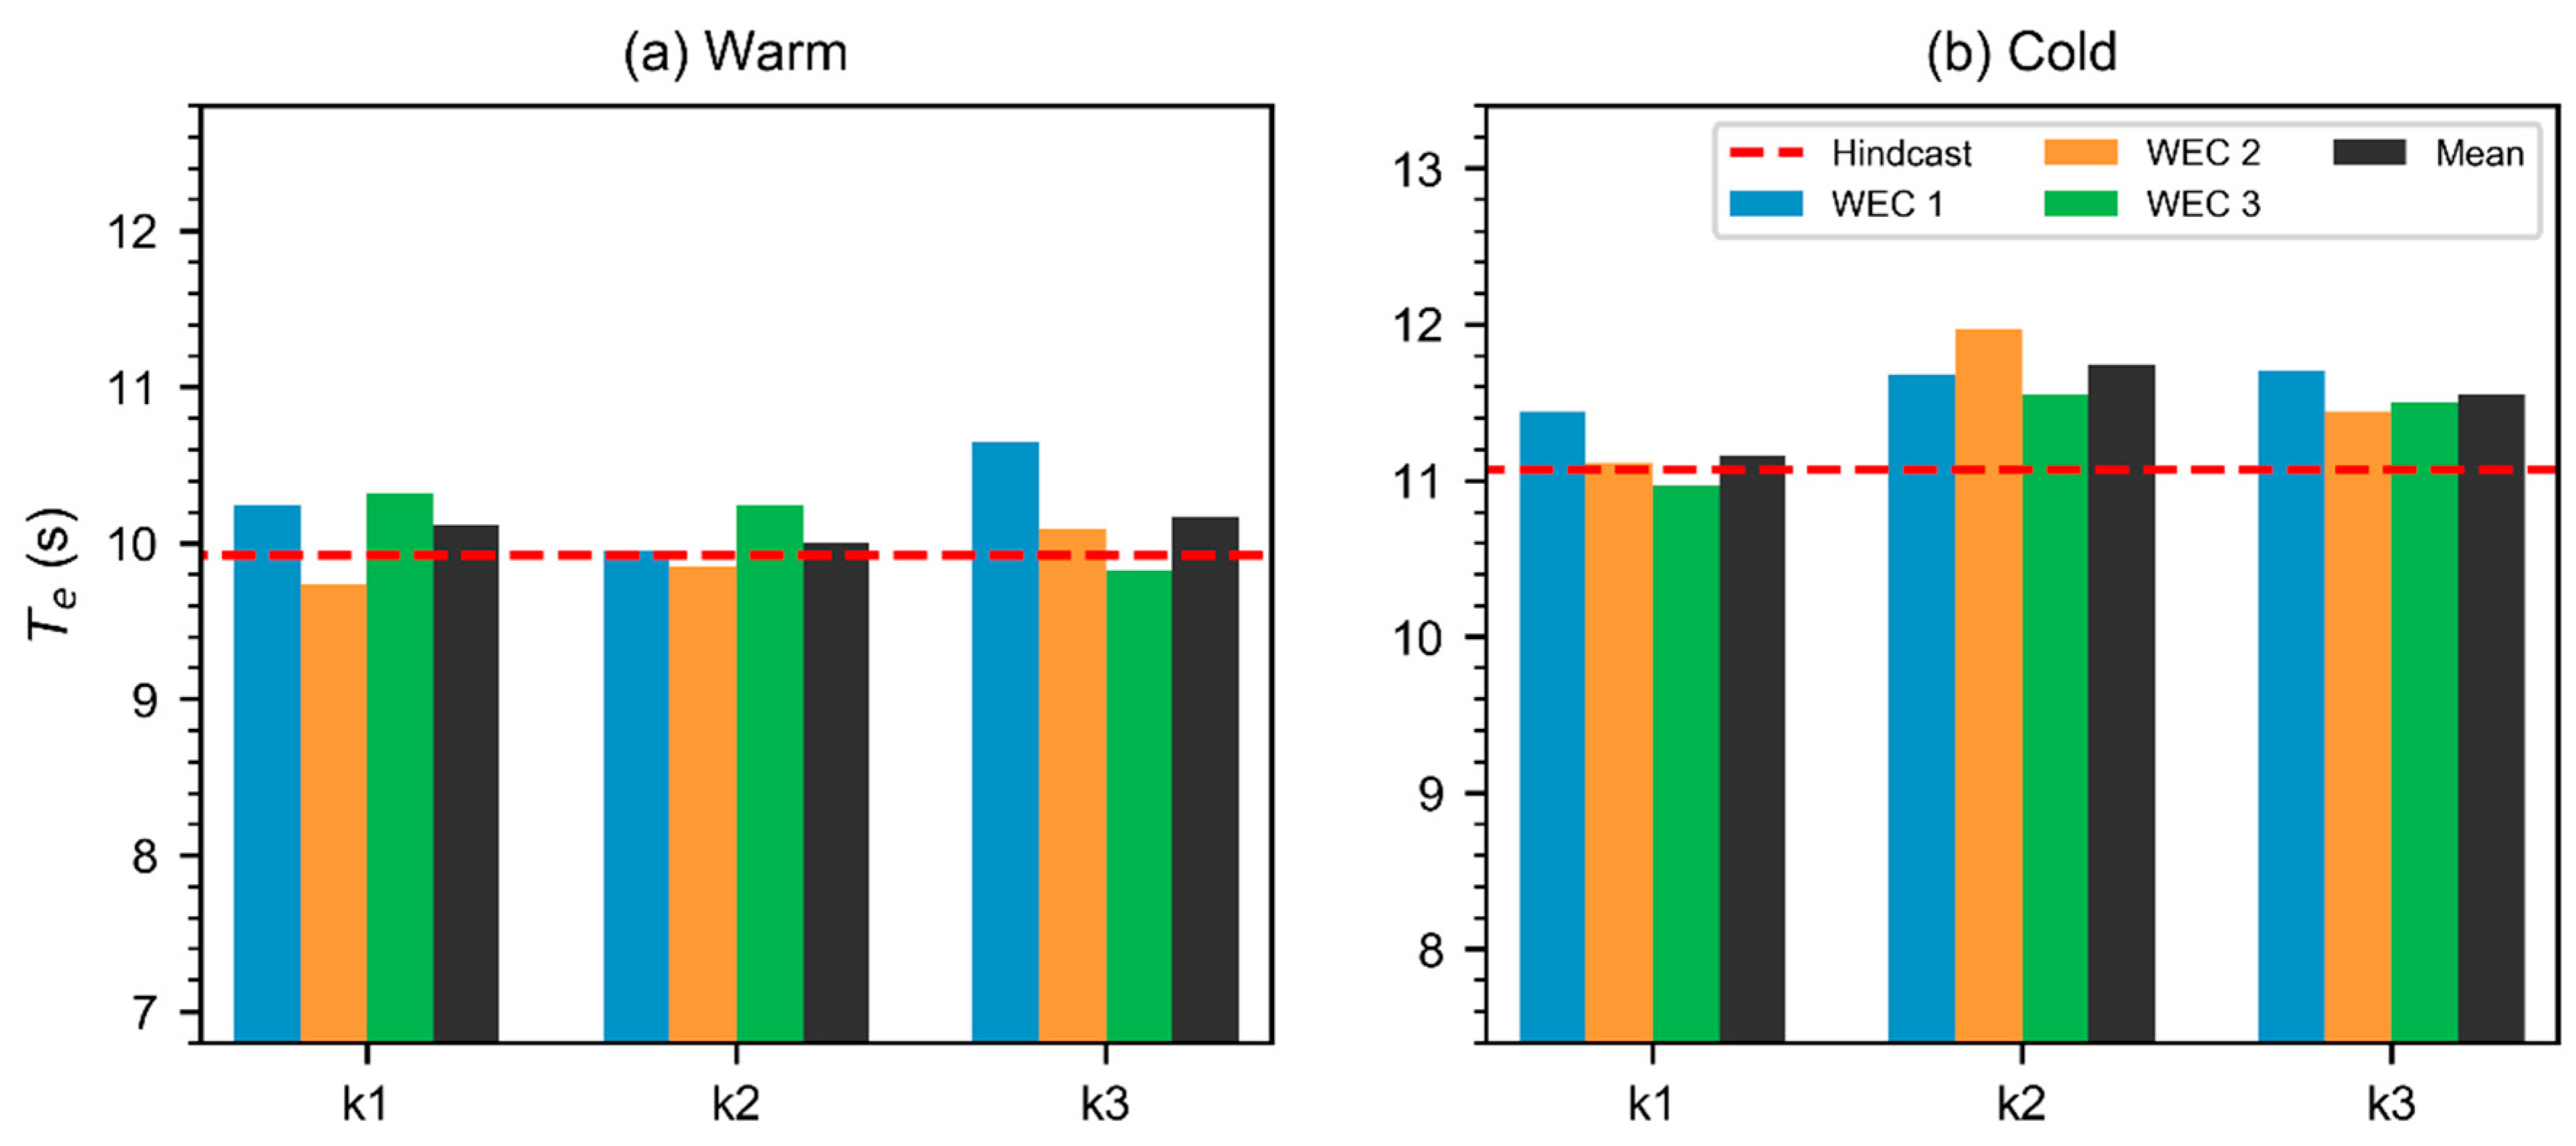
Overall, there is good agreement between the input target spectra and the spectra at WECs 1–3, particularly when calculating the mean for each realization, which smooths the effects of spatial variability. This is further supported when comparing the values of significant wave height and energy period derived from the hindcast spectra (Figure 7 and Figure 8). For warm climate runs, the absolute mean differences in FUNWAVE predictions compared to the hindcast are 0.1 m in significant wave height and 0.2 s in energy period. For cold climate runs, absolute mean differences are 0.1 m in significant wave height and 0.4 s in energy period.

3.2. WEC Dynamics and Power Output

In this section, we present the simulation results acquired using WEC-Sim to estimate the power output of the virtual WEC array. Three wave generation approaches were used in conjunction with WEC-Sim: FUNWAVE time series, FUNWAVE-derived wave spectra, and SWAN wave spectra. Every WEC in the array is modeled individually. The total time length of every WEC-Sim simulation is 2100 s.
When WEC-Sim is executed with spectral wave data, it internally generates a time-history of wave elevation with random phases to use as wave forcing in the time domain. To determine an optimal number of realizations needed to estimate wave power with confidence, we first run 20 different realizations of a JONSWAP spectrum with a significant wave height of H s = 2.5   m and a peak wave period of T p = 8   s . Figure 9 displays the average and maximum power generated by a single WEC with a 95% confidence interval (CI) for different numbers of realizations. The average and maximum power do not change much with respect to different realizations, but a low realization count results in the higher uncertainty of both power measures. Generally, the CIs associated with both power measures decrease as the number of realizations increase to 12, after which they become effectively constant. Thus, to fully characterize the incident wave conditions, we henceforth run 12 realizations for every WEC-Sim simulation using a wave spectrum, i.e., for each weather condition, each WEC is characterized by 36 WEC-Sim simulations using FUNWAVE-derived spectra (12 WEC-Sim realizations for each of the 3 FUNWAVE realizations) and by 12 WEC-SIM realizations using SWAN spectra, in addition to the WEC-Sim simulations using each of the 3 time series generated directly with FUNWAVE.
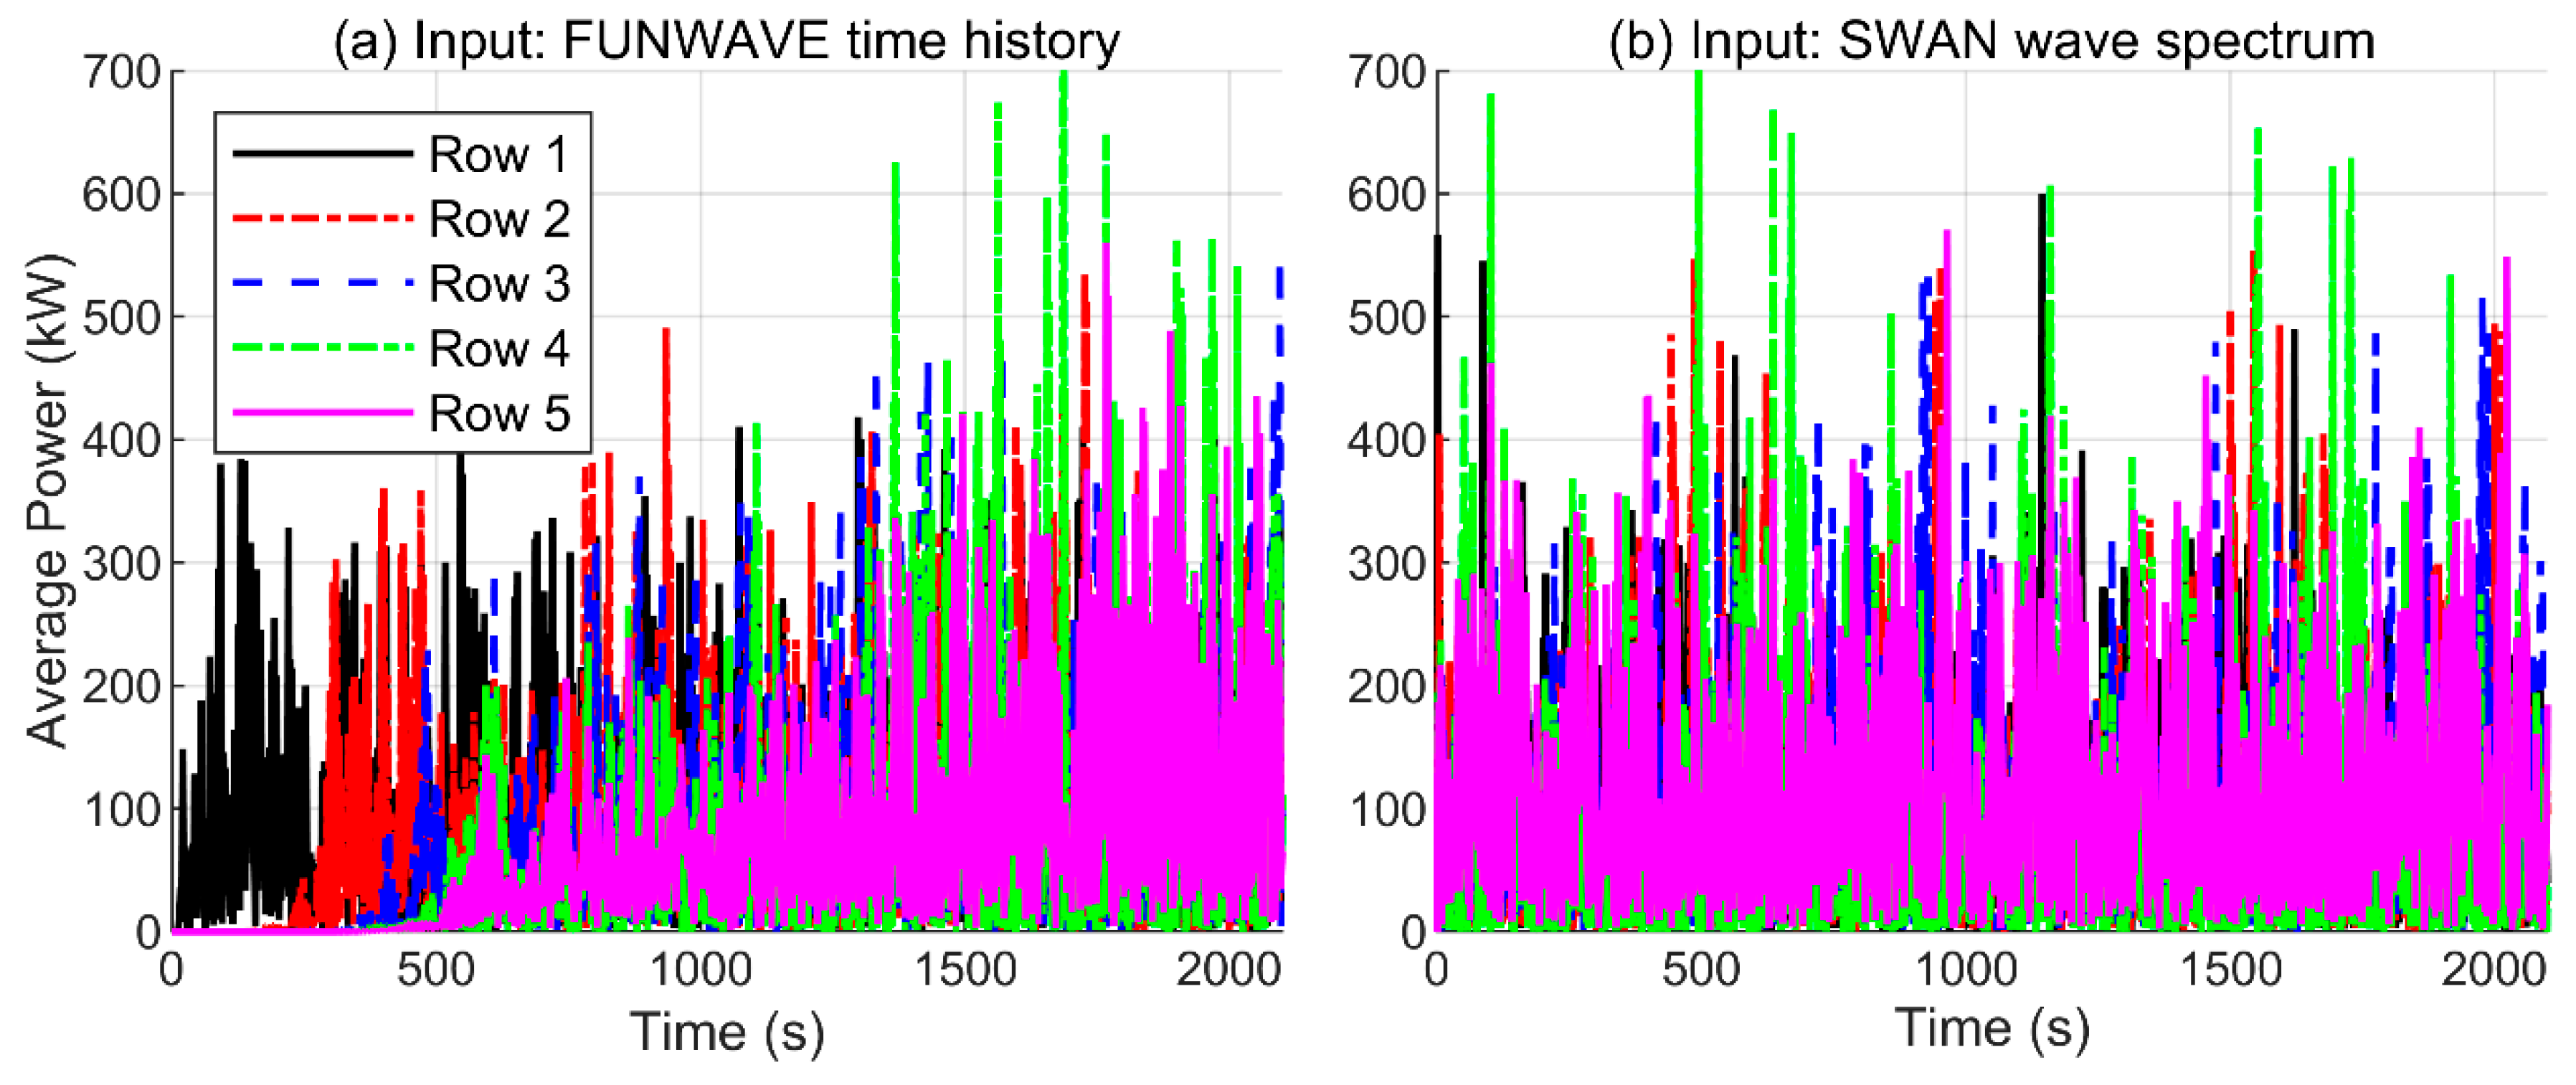
Figure 10 shows time series of average power calculated with WEC-Sim using FUNWAVE time series of sea-surface elevation and SWAN spectra. Each colored line represents the average power of a row of WECs each at an equal distance from the offshore boundary (as shown in Figure 3; e.g., row 1 includes WECs 1–3, row 2 includes WECs 4–6, and so on). As mentioned in Section 3.1., waves modeled with FUNWAVE take approximately 600 s to travel from the wavemaker to the shoreline boundary. Because of this transient effect, we observe a similar behavior in the time-history of average power for every device in the WEC farm modeled with FUNWAVE time series (Figure 10a). In contrast, the wave power computed with SWAN wave spectra is fully captured at the beginning of the simulation, as shown in Figure 10b (the same can be observed in power time-histories of runs using FUNWAVE spectra as input [not shown]). Because of this, we remove the first 700 s of all recorded power time series to compute quantities of interest (i.e., average power and peak-average power).
Figure 11 displays the average power of individual devices in the wave farm generated under the weather conditions of the two study cases considered. Each color group of the column bars is associated with one of the three wave forcing approaches implemented in WEC-Sim. Overall, there is a large variation in average power prediction for different WECs, especially for the warm months. In the first three rows (WECs 1–8), the average power computed with FUNWAVE wave spectra is mostly higher than that computed with FUNWAVE time-histories. As waves propagate toward the shoreline, their associated energy decreases because of water depth, so WECs in the last row (12–14) tend to harvest less energy than the others. Estimates of power using SWAN are be the most energetically consistent along rows compared to the other methods.
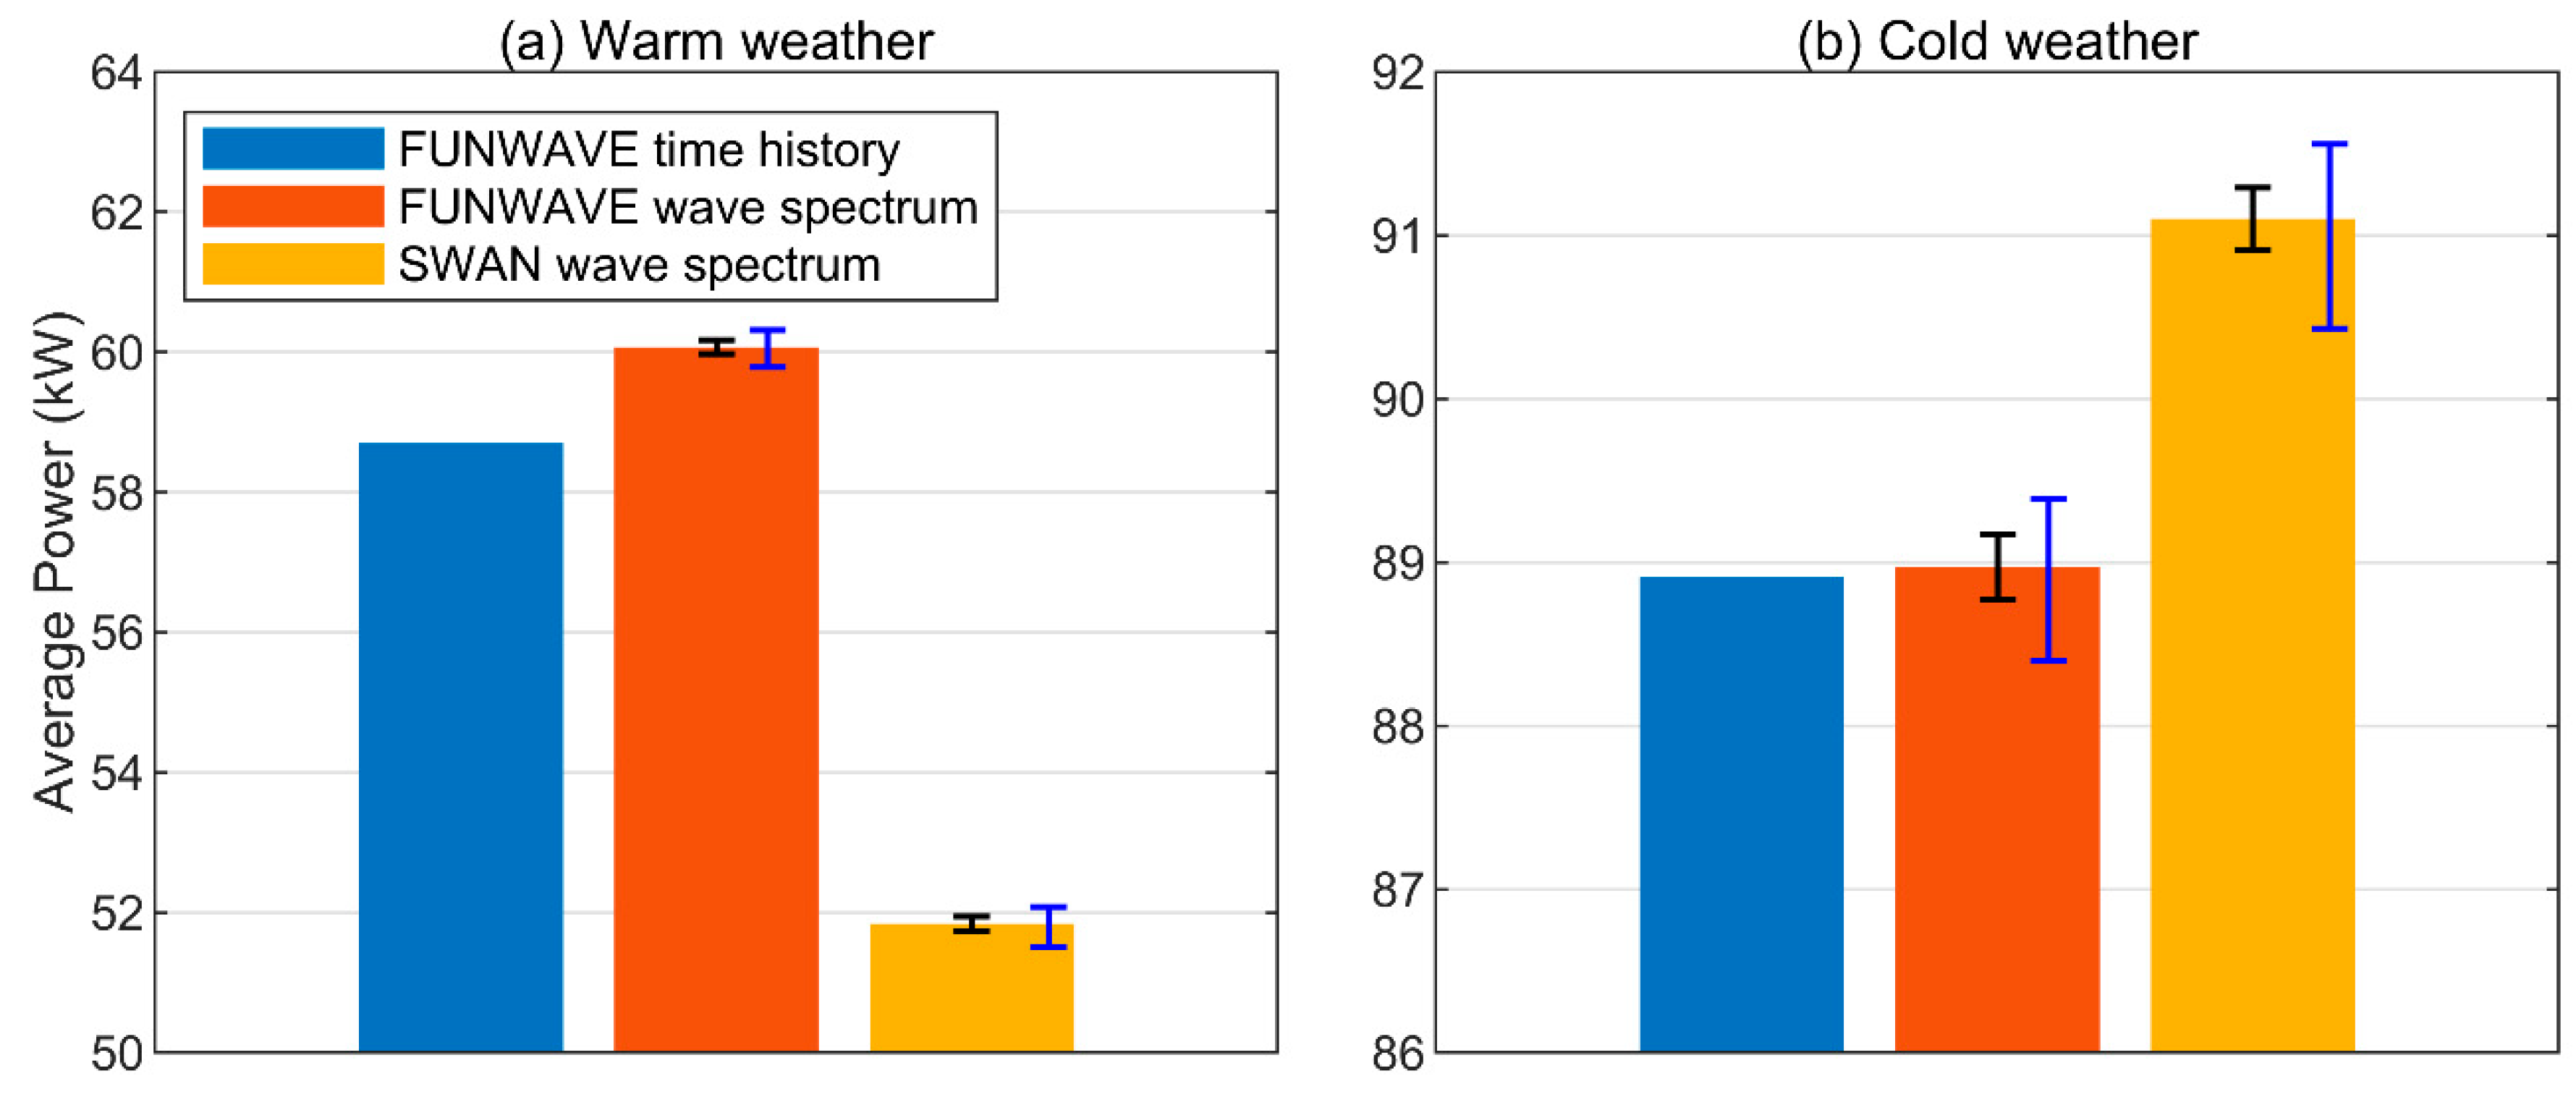
Figure 12 shows the comparison of power averaged over all realizations and devices in the WEC farm. There is little difference in average power estimates using FUNWAVE time-histories and FUNWAVE spectra for either wave climate, suggesting that phase information had little influence in the prediction of this power metric. Using SWAN spectra results in lower estimates during warm weather months (by 11%–14%) and slightly higher estimates in cold weather months (by about 2%). A deeper discussion of these results is presented in Section 4.
Figure 13 shows the comparison of peak-average power estimated for the WEC farm considering all devices and realizations. The largest peak-average power estimates are observed when using the FUNWAVE time-histories. During warm weather months, FUNWAVE and SWAN spectra result in 30% and 18% lower peak-average power estimates, respectively. During cold weather months, FUNWAVE and SWAN spectra result in 30% and 9% lower estimates, respectively. Despite the large CIs and minimum–maximum ranges, it appears that the simultaneous phase information available at all WEC locations when using FUNWAVE time series, lead to consistently larger estimates of peak-average power than are obtained when using random-phase forcing.

4. Summary and Discussion

A phase-resolving wave model, FUNWAVE, and a phase-averaging wave model, SWAN, were used to simulate the wave environment experienced by a WEC array virtually situated at the PWS site offshore from Newport, Oregon. Two climate conditions were modeled: warm weather months and cold weather months. The numerical model WEC-Sim was then coupled with either FUNWAVE time series of sea-surface elevation, FUNWAVE-derived energy spectra, or SWAN energy spectra to simulate the power response of each of the 14 devices in the WEC farm. Use of the FUNWAVE-derived energy spectra as wave forcing in WEC-Sim was to use it as a control case that would flag differences between the models regarding phase and nonlinearity. For example, if a FUNWAVE time series and corresponding spectrum lead to similar power results, then the differences between FUNWAVE and SWAN-driven results can be attributed to nonlinearity; if the results differ, then the difference between FUNWAVE and SWAN-driven results can be attributed to phase information. However, because we average our results over many realizations, the comparison cannot be binary. Furthermore, we cannot claim that both properties are completely uncorrelated.
An important element of this discussion is the influence of phase information in estimating power production. Figure 13 indicates that using FUNWAVE time-histories as an input to WEC-Sim, as opposed to FUNWAVE or SWAN spectra, results in the largest estimates of peak-average power for the farm when considering either wave climate. For a wave farm to operate successfully and efficiently, it must be designed to reduce the variability in wave-energy-generated power, which requires good estimates of the expected power production. Modeling the array with random phase processes at each WEC location means that statistically there is only a small chance that several WECs will be exposed to near peak energy waves at the same time, whereas in reality it is likely that multiple WECs will be simultaneously exposed to large waves, depending on the array layout. While nothing conclusive can be said about the relative accuracy of WEC-Sim simulations using any of the three types of wave products to estimate power production, because of the lack of in situ observations, the results of this study suggest there may be large wave events that are underpredicted when phase is not resolved. Power systems are particularly vulnerable to sufficiently large waves, and that is why it is important to conduct further research that explores the influence of phase information in modeling WEC farms complemented by field measurements to use for validation.
To further examine the influence of phase information on the estimation of power production, we analyze how FUNWAVE sea-surface elevation relates to power in the time domain. The maximum power generated when using time-history forcing for the cold weather climate occurs at WEC 10, as shown in Figure 14a. The power spike is related to the large wave that acts on the device, at a height of 5.8 m and a period of 13 s obtained from a zero-upcrossing analysis (Figure 14b). The neighboring WEC number 9 is shown to illustrate that its power time-history is visibly different than that of WEC 10. In fact, a cross-correlation analysis shows that the power time series of these adjacent WEC stations are not correlated with a linear correlation coefficient of −0.02. This indicates that the alongshore correlation scale of the waves is shorter than the distance of the waves evaluated, which is not unrealistic considering the irregular nature of the waves modeled. Similar results are found when comparing WECs 10 and 11 (not shown). This would be one of the reasons why adjacent WECs do not show similar peak-average power. Future studies might investigate the length scales of alongshore correlation following the methodology presented in this paper.
Another difference between the FUNWAVE and SWAN wave models is that the former incorporates nonlinear wave theory and the latter does not. For example, Figure 15 shows the wave spectra associated with WEC 13, a location at which the nonlinear nature of FUNWAVE is shown by the energy shift from the main lobe to higher frequency harmonics. This difference between the models seems to influence the estimation of average power computed from the WEC-Sim output. Greater variability between FUNWAVE-driven (whether retaining phase information or not) and SWAN-driven WEC-Sim estimates of average power is observed for the individual WECs closest to the shoreward boundary than for those farther away from it, in particular in the cold climate case (see Figure 11). This may explain why, when considering the average power generated by the array (see Figure 12), the results using SWAN spectra differ from either type of FUNWAVE forcing, while both FUNWAVE data types are more consistent with each other. Because both wave models solve different equations, the variance in the resulting spectra in the model domain is not the same. This study did not account for the difference in energy at the WEC locations between models. This might have also contributed to discrepancies in wave power production between the models.
A limitation of the one-way coupled system described in this study (the output of a given wave model used as an input in WEC-Sim), is that any dynamic interactions between devices in an array cannot be resolved. The virtual WEC farm in this study is modeled under the assumption that the devices are located at a distance far enough from one another such that the effects of their interactions are negligible. In addition, the water depth is assumed to be constant in the current WEC-Sim model. Tools to enable full coupling of WEC-Sim with a wave model or a sediment transport model have not yet been developed and would be required to conduct further research concerning these limitations. Finally, intra-seasonal variability has not been explored in this paper and is suggested as an area of future research.
Ultimately, we feel confident that modeling a WEC array with the forcing from a phase-resolving wave model, such as FUNWAVE, is important to reliably characterize its potential power production, particularly in the early stages of commercial adoption of wave energy when wave farms are likely to be small. While the benefit of using a phase-resolving model are diminished with increasing numbers of devices in the array, because of increased power stability, additional physical considerations favor the use of a time domain model. FUNWAVE can accurately simulate diffraction, while models such as SWAN can only approximate it, and as this work has shown, there may be power fluctuations that can only be identified when phase information is considered and that could pose a significant threat to the power systems.

Author Contributions

Conceptualization, Y.-H.Y. and Z.Y.; methodology, Y.-H.Y. and Z.Y.; validation, F.T.R., T.T.T.; formal analysis, F.T.R., T.T.T., and Y.-H.Y.; investigation, F.T.R., T.T.T., Y.-H.Y., G.G.-M., and Z.Y.; resources, Y.-H.Y. and Z.Y.; data curation, F.T.R., T.T.T., and G.G.-M.; writing—original draft preparation, F.T.R., T.T.T., and G.G.-M.; writing—review and editing, Y.-H.Y. and Z.Y.; visualization, F.T.R. and T.T.T.; supervision, Z.Y.; project administration, Y.-H.Y.; funding acquisition, Y.-H.Y. All authors have read and agreed to the published version of the manuscript.

Funding

This research was funded by the U.S. Department of Energy, Office of Energy Efficiency and Renewable Energy, Water Power Technologies Office under Contract DE-AC05-76RL01830 to Pacific Northwest National Laboratory. This work was also authored (in part) by the National Renewable Energy Laboratory, operated by Alliance for Sustainable Energy, LLC, for the U.S. Department of Energy (DOE) under Contract DE-AC36-08GO28308. Funding was provided by the U.S. Department of Energy Office of Energy Efficiency and Renewable Energy Water Power Technologies Office. The views expressed in this article do not necessarily represent the views of the DOE or the U.S. Government. The publisher, by accepting the article for publication, acknowledges that the U.S. Government retains a non-exclusive, paid-up, irrevocable, worldwide license to publish or reproduce the published form of this work, or allow others to do so, for U.S. Government purposes.

Acknowledgments

Wave model computations were performed using resources available through Research Computing at Pacific Northwest National Laboratory.

Conflicts of Interest

The authors declare no conflict of interest.

References

  1. Muljadi, E.; McKenna, H.E. Power quality issues in a hybrid power system. IEEE Trans. Ind. Appl. 2002, 38, 803–809. [Google Scholar] [CrossRef]
  2. Stefek, J.; Bain, D.; Yu, Y.-H.; Jenne, D.; Stark, G. Analysis on the Influence of an Energy Storage System and Its Impact to the Grid for a Wave Energy Converter. In Proceedings of the 38th International Conference on Ocean, Offshore and Arctic Engineering (OMAE 2019), Glasgow, Scotland, UK, 9–14 June 2019. [Google Scholar]
  3. Parwal, A.; Fregelius, M.; Temiz, I.; Göteman, M.G.; De Oliveira, J.; Boström, C.; Leijon, M. Energy management for a grid-connected wave energy park through a hybrid energy storage system. Appl. Energy 2018, 231, 399–411. [Google Scholar] [CrossRef]
  4. Blavette, A.; O’Sullivan, D.L.; Lewis, A.W.; Egan, M.G. Impact of a wave farm on its local grid: Voltage limits, flicker level and power fluctuations. In Proceedings of the 2012 Oceans—Yeosu, Yeosu, Korea, 21–24 May 2012; pp. 1–9. [Google Scholar]
  5. Sjolte, J.; Tjensvoll, G.; Molinas, M. Power Collection from Wave Energy Farms. Appl. Sci. 2013, 3, 420–436. [Google Scholar] [CrossRef]
  6. Folley, M.; Babarit, A.; Child, B.; Forehand, D.; O’Boyle, L.; Silverthorne, K.; Spinneken, J.; Stratigaki, V.; Troch, P. A Review of Numerical Modelling of Wave Energy Converter Arrays. In Proceedings of the 31st International Conference on Offshore Mechanics and Arctic Engineering (OMAE 2012), Rio de Janeiro, Brazil, 1–6 July 2012; Volume 7, pp. 535–545. [Google Scholar]
  7. Chang, G.; Ruehl, K.; Jones, C.A.; Roberts, J.; Chartrand, C. Numerical modeling of the effects of wave energy converter characteristics on nearshore wave conditions. Renew. Energy 2016, 89, 636–648. [Google Scholar] [CrossRef] [Green Version]
  8. Atan, R.; Finnegan, W.; Nash, S.; Goggins, J. The effect of arrays of wave energy converters on the nearshore wave climate. Ocean Eng. 2019, 172, 373–384. [Google Scholar] [CrossRef]
  9. Cruz, J.; Mackay, E.; Livingstone, M.; Child, B. Validation of design and planning tools for wave energy converters (WECs). In Proceedings of the 1st Marine Energy Technology Symposium, Washington, DC, USA, 10–11 April 2013. [Google Scholar]
  10. Folley, M.; Whittaker, T.J.T. The effect of sub-optimal control and the spectral wave climate on the performance of wave energy converter arrays. Appl. Ocean Res. 2009, 31, 260–266. [Google Scholar] [CrossRef]
  11. Folley, M. Numerical Modelling of Wave Energy Converters: State-of-the-Art Techniques for Single Devices and Arrays; 2016; ISBN 978-0-12-803210-7. [Google Scholar] [CrossRef] [Green Version]
  12. Wei, Y.; Abadie, T.; Dias, F. A Cost-Effective Method for Modelling Wave-OWSC Interaction. Int. J. Offshore Polar Eng. 2017, 27, 366–373. [Google Scholar] [CrossRef]
  13. Beels, C.; Troch, P.; De Backer, G.; Vantorre, M.; De Rouck, J. Numerical implementation and sensitivity analysis of a wave energy converter in a time-dependent mild-slope equation model. Coast. Eng. 2010, 57, 471–492. [Google Scholar] [CrossRef]
  14. Mendoza, E.; Silva, R.; Zanuttigh, B.; Angelelli, E.; Lykke Andersen, T.; Martinelli, L.; Nørgaard, J.Q.H.; Ruol, P. Beach response to wave energy converter farms acting as coastal defence. Coast. Eng. 2014, 87, 97–111. [Google Scholar] [CrossRef]
  15. Balitsky, P.; Verao Fernandez, G.; Stratigaki, V.; Troch, P. Assessment of the Power Output of a Two-Array Clustered WEC Farm Using a BEM Solver Coupling and a Wave-Propagation Model. Energies 2018, 11, 2907. [Google Scholar] [CrossRef] [Green Version]
  16. Venugopal, V.; Smith, G.H. Wave Climate Investigation for an Array of Wave Power Devices. In Proceedings of the 7th European Wave and Tidal Energy Conference, Porto, Portugal, 11–14 September 2007; p. 10. Available online: https://tethys.pnnl.gov/publications/wave-climate-investigation-array-wave-power-devices (accessed on 15 September 2019).
  17. Shi, F.; Kirby, J.T.; Harris, J.C.; Geiman, J.D.; Grilli, S.T. A high-order adaptive time-stepping TVD solver for Boussinesq modeling of breaking waves and coastal inundation. Ocean Model. 2012, 43–44, 36–51. [Google Scholar] [CrossRef]
  18. Angelis-Dimakis, A.; Biberacher, M.; Dominguez, J.; Fiorese, G.; Gadocha, S.; Gnansounou, E.; Guariso, G.; Kartalidis, A.; Panichelli, L.; Pinedo, I.; et al. Methods and tools to evaluate the availability of renewable energy sources. Renew. Sustain. Energy Rev. 2011, 15, 1182–1200. [Google Scholar] [CrossRef]
  19. Yu, Y.-H.; Lawson, M.; Ruehl, K.; Michelen, C. Development and Demonstration of the WEC-Sim Wave Energy Converter Simulation Tool. In Proceedings of the 2nd Marine Energy Technology Symposium, Seattle, WA, USA, 15–18 April 2014. [Google Scholar]
  20. NOAA National Centers for Environmental Information; NOAA Center for Tsunami Research Central Oregon Coastal Digital Elevation Model NAVD 88. Natl. Cent. Environ. Inf. NESDIS NOAA US Dep. Commer. 2015. Available online: https://data.nodc.noaa.gov/cgi-bin/iso?id=gov.noaa.ngdc.mgg.dem:11500 (accessed on 15 September 2019).
  21. Babarit, A. On the park effect in arrays of oscillating wave energy converters. Renew. Energy 2013, 58, 68–78. [Google Scholar] [CrossRef] [Green Version]
  22. García-Medina, G.; Özkan-Haller, H.T.; Ruggiero, P. Wave resource assessment in Oregon and southwest Washington, USA. Renew. Energy 2014, 64, 203–214. [Google Scholar] [CrossRef]
  23. Ruggiero, P.; Komar, P.D.; Allan, J.C. Increasing wave heights and extreme value projections: The wave climate of the U.S. Pacific Northwest. Coast. Eng. 2010, 57, 539–552. [Google Scholar] [CrossRef]
  24. Wu, W.-C.; Wang, T.; Yang, Z.; García-Medina, G. Development and validation of a high-resolution regional wave hindcast model for U.S. West Coast wave resource characterization. Renew. Energy 2020, 152, 736–753. [Google Scholar] [CrossRef]
  25. Booij, N.; Ris, R.C.; Holthuijsen, L.H. A third-generation wave model for coastal regions: 1. Model description and validation. J. Geophys. Res. Oceans 1999, 104, 7649–7666. [Google Scholar] [CrossRef] [Green Version]
  26. Allahdadi, M.N.; Gunawan, B.; Lai, J.; He, R.; Neary, V.S. Development and validation of a regional-scale high-resolution unstructured model for wave energy resource characterization along the US East Coast. Renew. Energy 2019, 136, 500–511. [Google Scholar] [CrossRef]
  27. Li, N.; Cheung, K.F.; Stopa, J.E.; Hsiao, F.; Chen, Y.-L.; Vega, L.; Cross, P. Thirty-four years of Hawaii wave hindcast from downscaling of climate forecast system reanalysis. Ocean Model. 2016, 100, 78–95. [Google Scholar] [CrossRef] [Green Version]
  28. Robertson, B.R.D.; Hiles, C.E.; Buckham, B.J. Characterizing the near shore wave energy resource on the west coast of Vancouver Island, Canada. Renew. Energy 2014, 71, 665–678. [Google Scholar] [CrossRef]
  29. Yang, Z.; Neary, V.S.; Wang, T.; Gunawan, B.; Dallman, A.R.; Wu, W.-C. A wave model test bed study for wave energy resource characterization. Renew. Energy 2017, 114, 132–144. [Google Scholar] [CrossRef]
  30. Marine Energy—Wave, Tidal and Other Water Current Converters—Part 101: Wave Energy Resource Assessment and Characterization; International Electrotechnical Commission: Geneva, Switzerland, 2015; pp. 1–53.
  31. Shi, F.; Kirby, J.T.; Tehranirad, B.; Harris, J.C.; Choi, Y.-K.; Malej, M. FUNWAVE-TVD, Fully Nonlinear Boussinesq Wave Model with TVD Solver, Documentation and User’s Manual (Version 3.0); Center for Applied Coastal Research, University of Delaware: Newark, DE, USA, 2016. [Google Scholar]
  32. Nwogu, O. Alternative Form of Boussinesq Equations for Nearshore Wave Propagation. J. Waterw. Port Coast. Ocean Eng. 1993, 119, 618–638. [Google Scholar] [CrossRef] [Green Version]
  33. Chen, Q.; Kirby, J.T.; Dalrymple, R.A.; Shi, F.; Thornton, E.B. Boussinesq modeling of longshore currents. J. Geophys. Res. Oceans 2003, 108. [Google Scholar] [CrossRef]
  34. Chen, Q. Fully Nonlinear Boussinesq-Type Equations for Waves and Currents over Porous Beds. J. Eng. Mech. 2006, 132, 220–230. [Google Scholar] [CrossRef]
  35. Kennedy, A.B.; Kirby, J.T.; Chen, Q.; Dalrymple, R.A. Boussinesq-type equations with improved nonlinear performance. Wave Motion 2001, 33, 225–243. [Google Scholar] [CrossRef]
  36. Wei, G.; Kirby, J.T.; Sinha, A. Generation of waves in Boussinesq models using a source function method. Coast. Eng. 1999, 36, 271–299. [Google Scholar] [CrossRef]
  37. Chawla, A.; Kirby, J.T. A source function method for generation of waves on currents in Boussinesq models. Appl. Ocean Res. 2000, 22, 75–83. [Google Scholar] [CrossRef]
  38. Suanda, S.H.; Perez, S.; Feddersen, F. Evaluation of a source-function wavemaker for generating random directionally spread waves in the sea-swell band. Coast. Eng. 2016, 114, 220–232. [Google Scholar] [CrossRef] [Green Version]
  39. Grassa, J.M. Directional random waves propagation on beaches. Coast. Eng. Proc. 1990, 1. [Google Scholar]
  40. Cummins, W.E. The Impulse Response Function and Ship Motions. In Proceedings of the Symposium on Ship Theory, Hamburg, Germany, 25–27 January 1962; pp. 1–9. [Google Scholar]
  41. Neary, V.S.; Previsic, M.; Jepsen, R.A.; Michael, J.L.; Yu, Y.-H.; Copping, A.E.; Fontaine, A.A.; Hallett, K.C.; Murray, D.K. Methodology for Design and Economic Analysis of Marine Energy Conversion (MEC) Technologies; Sandia National Laboratories: Albuquerque, NM, USA; Livermore, CA, USA, 2004. [Google Scholar]
  42. Yu, Y.-H.; Tom, N.; Jenne, D. Numerical Analysis on Hydraulic Power Take-Off for Wave Energy Converter and Power Smoothing Methods. In Proceedings of the 37th International Conference on Ocean, Offshore and Arctic Engineering (OMAE 2018), Madrid, Spain, 17–22 June 2018; p. V010T09A043. [Google Scholar]
Figure 1. (a) Location map and (b) detailed view of the study site. PacWave South parcels are shown in red in the inset. SWAN and FUNWAVE model domain extents are shown in cyan and blue, respectively, with a colormap of bathymetry distribution. The layout of the virtual WEC array is represented by the black squares.
Jmse 08 00171 g001
Figure 2. PWS spectra during (a) warm (March through August) and (b) cold (September through February) months averaged from January 1979 to December 2010.
Jmse 08 00171 g002
Figure 3. Wavemaker and WEC locations in the FUNWAVE domain, and colormap of PacWave South bathymetry.
Jmse 08 00171 g003
Figure 4. A representation of (a) the two-body FPA WEC device and (b) the WEC-Sim model.
Jmse 08 00171 g004
Figure 5. Sample time series of sea-surface elevation at all virtual WEC stations, color-grouped by distance from shore. (a) Warm months, first realization, and (b) cold months, first realization.
Jmse 08 00171 g005
Figure 6. Spectra derived from FUNWAVE time series at select WEC locations, corresponding to all three realizations of (ac) warm months and (df) cold months. The mean spectra of WECs 1–3 are also shown in each panel, as well as the hindcast spectra for each climate.
Jmse 08 00171 g006
Figure 7. Significant wave height values computed from FUNWAVE post-processed spectra for the case of (a) warm weather and (b) cold weather months, compared to hindcast benchmarks.
Jmse 08 00171 g007
Figure 8. Energy period values computed from FUNWAVE post-processed spectra for the case of (a) warm weather and (b) cold weather months, compared to hindcast benchmarks.
Jmse 08 00171 g008
Figure 9. Uncertainty in simulation results due to the number of wave spectrum realizations for (a) maximum and (b) average power. Black error bars indicate the 95% confidence interval.
Jmse 08 00171 g009
Figure 10. The transient average power of different rows of the WEC farm using (a) FUNWAVE time-histories and (b) SWAN wave spectra.
Jmse 08 00171 g010
Figure 11. Average power of individual devices in the WEC farm under (a) warm and (b) cold weather conditions. The column bars are colored by the type of input used in the WEC-Sim simulations. The red error bars indicate the 95% CIs.
Jmse 08 00171 g011
Figure 12. The average power of the WEC farm including all 14 devices in (a) warm weather and (b) cold weather months. The column bars are colored by the type of input used in the WEC-Sim simulations. Black error bar: 95% CI; blue error bar: minimum to maximum value range.
Jmse 08 00171 g012
Figure 13. The peak-average power of the WEC farm including all 14 WECs in (a) warm weather and (b) cold weather months. The column bars are colored by the type of input used in the WEC-Sim simulations. Black error bar: 95% CI; blue error bar: minimum to maximum value range.
Jmse 08 00171 g013
Figure 14. (a) Power production and (b) water surface elevation at WEC stations 9 and 10 for the third realization (k3) of the cold weather case.
Jmse 08 00171 g014
Figure 15. Comparison of FUNWAVE (k1, k2, k3) and SWAN wave spectra corresponding to WEC 13 for the case of (a) warm and (b) cold wave climates.
Jmse 08 00171 g015
Table 1. Design of FUNWAVE model simulations.
Input Wave ProductRealizations (Per Season)Data PointsTemporal SetupSpatial Coverage
2D seasonal spectra for warm & cold months k1
k2
k3
WECs 1
thru 14
2100 s record length
0.1-s resolution
4 km N-S, 8 km W-E
2.0-m resolution
Table 2. General properties of the two-body floating-point absorber WEC model.
BodyCenter of Gravity (m)Mass (103 kg)Moment of Inertia (103 kg m2)
IxxIyyIzz
Float[0, 0, −0.72]727.0120,90021,30037,000
Spar/Plate[0, 0, −21.29]878.30137,000137,00028,500