Recent Developments on the Unified Fatigue Life Prediction Method Based on Fracture Mechanics and its Applications


Abstract
:1. Introduction
2. The Unified Fatigue Life Prediction Method and Its Further Developments
2.1. The General Procedure of UFLP
2.2. The Original Modified McEvily Model
- A is a material- and environmentally-sensitive constant of dimensions (MPa)−2;
- m is a constant representing the slope of the corresponding fatigue crack growth rate curve;
- n is the index indicating the unstable fracture;
- Kmax is the maximum stress intensity factor;
- fop is the coefficient for the stress intensity factor at the opening level;
- Φ is the coefficient for overload/underload condition;
- ∆Keff is the effective range of the stress intensity factor, which can be equal to Kmax(1 − Φfop);
- ∆Keffth is the effective range of the stress intensity factor at the threshold level;
- KCf is the fracture toughness of the material under fatigue loading;
- re is an empirical material constant of the inherent flaw length of the order of 1 µm;
- σmax is the maximum applied stress;
- σv is an assumed “virtual strength” defined by the condition that the maximum stress of the completely uncracked (i.e., a = re) plain specimen;
- Y(a) is a geometrical factor;
- a is the modified crack length which is equal to re plus the actual crack length;
- R is the stress ratio (=σmin/σmax);
- ai is the crack length in the current ith cycle;
- aOL is the crack length when the overload cycle occurs;
- ryi is the plastic zone in the current ith cycle;
- rOL is the plastic zone size when the overload cycle occurs;
- rUL is the plastic zone size when the underload cycle occurs.
- γ is a shaping exponent determined by fitting the recovering period of the experimental data;
- KIc is the plane strain fracture toughness of the material;
- ν is Poisson’s ratio of the material;
- λ is the coefficient to consider stress/strain state;
- ∆Kth (R) is the threshold value of stress intensity factor range under stress ratio of R;
- ∆Kth0 is the threshold value of stress intensity factor range under stress ratio of zero;
- α’ is the crack tip stress/strain constraint ratio, which is 1 for the plane stress state and 1/(1 − 2v) for the plane strain state.
- α is the parameter used to calculate “virtual strength”;
- σy is the yield strength of the material;
- σb is the ultimate tensile strength of the material;
- σfl is the flow stress of the material which can be calculated by (σy + σb)/2;
- t’ is thickness of the cracked body;
- ∆K is stress intensity factor range;
- n’ is material hardening index.
2.3. The Extension to the Creep-fatigue Situation
- A2 is a material- and environmentally-sensitive constant of dimensions for load-maintaining phase (MPa)−2;
- m2 is a constant representing the slope of the corresponding fatigue crack growth rate curve or load-maintaining phase;
- thold is the load-maintaining time;
- k is the material parameter for the influence level of the maximum stress;
- σR is the plain fatigue limit under stress ratio R.
- θ is the crack tip opening angle (CTOA) and θmax is its maximum value;
- Ac and nc are the secondary creep constant and exponent respectively;
- t is the maintaining time.
2.4. Determination of Model Parameters by Basic Data
2.5. Standardized Load-time History
3. Application Examples of UFLP
3.1. Ship and Offshore Structures
3.1.1. Ship Structures
3.1.2. Offshore Structures
3.2. Pressure Hulls
3.2.1. Fatigue Analysis of UHPC
3.2.2. Fatigue Analysis of Deep-Sea Pressure Cabin
4. Summary
Author Contributions
Funding
Acknowledgments
Conflicts of Interest
References
- Cui, W.C. On a systematic identification of key factors on safety of marine structures and their potential treatment methods. In Proceedings of the ASME 2017, 36th International Conference on Ocean, Offshore and Arctic Engineering (OMAE 2017), Trondheim, Norway, 25–30 June 2017. [Google Scholar]
- Meng, D.B.; Hu, Z.G.; Wu, P.; Zhu, S.P.; Correia, J.A.F.O.; De Jesus, A.M.P. Reliability-based optimisation for offshore structures using saddlepoint approximation. Inst. Civ. Eng. Proc. Marit. Eng. 2020. [Google Scholar] [CrossRef]
- Fricke, W.; Cui, W.C.; Kierkegaard, H.; Kihl, D.; Koval, M.; Mikkola, T.; Parmentier, G.; Toyosada, M.; Yoon, J.H. Comparative fatigue strength assessment of a structural detail in a containership using various approaches of classification societies. Mar. Struct. 2002, 15, 1–13. [Google Scholar] [CrossRef]
- Lanning, D.; Shen, M.-H.H. Reliability of welded structures containing fatigue cracks. J. Offshore Mech. Arct. 1996, 118, 300–306. [Google Scholar] [CrossRef]
- Micone, N.; De Waele, W. Experimental evaluation of block loading effects on fatigue crack growth in offshore structural steels. Mar. Struct. 2019, 64, 463–480. [Google Scholar] [CrossRef]
- Yan, X.S.; Huang, X.P.; Huang, Y.; Cui, W.C. Prediction of fatigue crack growth in a ship detail under wave-induced loading. Ocean Eng. 2016, 113, 246–254. [Google Scholar] [CrossRef]
- Yan, X.S.; Huang, X.P. A method to predict stress intensity factor of surface crack at weld toe of offshore structures under wave loads. Adv. Mater. Res. 2014, 978, 118–122. [Google Scholar] [CrossRef]
- An, G.B. Unstable fracture preventive design in large vessels and offshore structures. Int. J. Offshore Polar 2015, 25, 221–226. [Google Scholar] [CrossRef] [Green Version]
- Paris, P.C.; Erdogan, F. A critical analysis of crack propagation laws. J. Basic Eng. 1963, 85, 528–534. [Google Scholar] [CrossRef]
- Cui, W.C. A state-of-the-art review on fatigue life prediction methods for metal structures. J. Mar. Sci. Tech. 2002, 7, 43–56. [Google Scholar] [CrossRef]
- Wang, Y.; Cui, W.C.; Wu, X.Y.; Wang, F.; Huang, X.P. The extended McEvily model for fatigue crack growth analysis of metal structures. Int. J. Fatigue 2008, 30, 1851–1860. [Google Scholar] [CrossRef]
- Wang, F.; Cui, W.C. Approximate method to determine the model parameters in a new crack growth rate model. Mar. Struct. 2009, 22, 744–757. [Google Scholar] [CrossRef]
- Xu, X.D.; Cui, W.C.; Huang, X.P. A comparison between two models of fatigue crack growth under overload. J. Ship. Mech. 2010, 14, 263–271. [Google Scholar]
- Cui, W.C.; Wang, F.; Huang, X.P. A Unified Fatigue Life Prediction (UFLP) Method for Marine Structures. Mar Struct 2011, 24, 153–181. [Google Scholar] [CrossRef]
- Chen, F.L.; Wang, F.; Cui, W.C. An Improved Constitutive Model to Predict Fatigue Crack Growth Rate under Variable Amplitude Loading with Single and Multiple Overload. J. Eng. Marit. Environ. 2011, 225, 271–281. [Google Scholar]
- Chen, F.L.; Wang, F.; Cui, W.C. Fatigue life prediction of engineering structures subjected to variable amplitude loading using the improved crack growth rate model. Fatigue. Fract. Eng. Mater. Struct. 2012, 35, 278–290. [Google Scholar] [CrossRef]
- Li, S.S.; Cui, W.C. Generation and application of a standardised load-time history to critical ship structural details. Ships Offshore Struct. 2014, 9, 365–379. [Google Scholar] [CrossRef]
- Li, S.S.; Cui, W.C. Generation and application of a standardized load-time history to tubular t-joints in offshore platforms. China Ocean Eng. 2015, 29, 633–648. [Google Scholar] [CrossRef]
- Wang, K.; Wang, F.; Cui, W.C.; Hayat, T.; Ahmad, B. Prediction of short fatigue crack growth of Ti-6Al-4V. Fatigue Fract. Eng. Mater. Struct. 2014, 37, 1075–1086. [Google Scholar] [CrossRef]
- Wang, K.; Wang, F.; Cui, W.C.; Li, D.Q. Prediction of Short Fatigue Crack Life by Unified Fatigue Life Prediction Method. J. Ship Mech. 2014, 18, 678–689. [Google Scholar]
- Wang, K.; Wang, F.; Cui, W.C. Comments and replies on the paper ‘Prediction of short fatigue crack growth of Ti–6Al–4V’. Fatigue Fract Eng. Mater Struct. 2016, 39, 1173–1176. [Google Scholar]
- Wang, K.; Wang, F.; Cui, W.C.; Tian, A.L. Prediction of cold dwell-fatigue crack growth of titanium alloys. Acta Metal. Sin. 2015, 28, 619–627. [Google Scholar] [CrossRef] [Green Version]
- Wang, F.; Cui, W.C.; Huang, X.P. Evaluation of surface crack shape evolution using the improved fatigue crack growth rate model. J. Ship Mech. 2011, 15, 660–668. [Google Scholar]
- Cui, W.C.; Wang, F. The unified fatigue crack growth rate model. In Fatigue Crack Growth: Mechanisms, Behavior and Analysis; Tang, P., Zhang, J.L., Eds.; Nova Science Publishers Inc.: New York, NY, USA, 2012. [Google Scholar]
- Cui, W.C.; Huang, X.P.; Wang, F. Towards a Unified Fatigue Life Prediction Method for Marine Structures; Zhejiang University Press: Hangzhou, China; Springer: London, UK, 2013. [Google Scholar]
- Wang, F.; Cui, W.C. Effect of plastic zone size induced by a single dwell overload on the fatigue crack growth rate under cyclic loading. J. Ship Mech. 2014, 18, 1117–1128. [Google Scholar]
- Wang, F.; Cui, W.C. Recent Development of Fatigue Crack Growth Rate Models. In Recent Trends of Fatigue Design; Branco, R., Ed.; Nova Science Publishers Inc.: New York, NY, USA, 2014. [Google Scholar]
- Wang, Y.Y.; Wang, F.; Cui, W.C. Fatigue Reliability Analyses considering short crack and dwell time effects. J. Ship Mech. 2016, 20, 710–721. [Google Scholar]
- Luo, G.; Liu, Y. Two simplified methods for fatigue crack growth prediction under compression-compression cyclic loading. Mar. Struct. 2018, 58, 367–381. [Google Scholar] [CrossRef]
- Rege, K.; Grønsund, J.; Pavlou, D.G. Mixed-mode I and II fatigue crack growth retardation due to overload: An experimental study. Int. J. Fatigue 2019, 129, 105227. [Google Scholar] [CrossRef]
- Wang, Y.Y.; Wang, F.; Cui, W.C. Fatigue Reliability Analysis for the manned cabin of deep manned submersibles Based on the Unified Fatigue Life Prediction Method. J. Ship Mech. 2016, 20, 335–347. [Google Scholar]
- Sharp, J.V.; Billingham, J.; Robinson, M.J. The risk management of high-strength steels in jack-ups in seawater. Mar. Struct. 2001, 14, 537–551. [Google Scholar] [CrossRef]
- Grenier, D.; Das, S.; Hamdoon, M. Effect of fatigue strain range on properties of high-strength structural steel. Mar. Struct. 2010, 23, 88–102. [Google Scholar] [CrossRef]
- Dong, Y.; Yue, J.; Yi, Q.; Zhou, H.; Huang, H. Investigation on the Abnormal Crack Front in Fatigue Crack Growth Rate Test for Thick High Tensile Steel Plate. In Proceedings of the ASME 32nd International Conference on Ocean, Offshore and Arctic Engineering, Nantes, France, 9–14 June 2013. [Google Scholar]
- Feng, L.Y.; Qian, X.D. Low cycle fatigue test and enhanced lifetime estimation of high-strength steel s550 under different strain ratios. Mar. Struct. 2018, 61, 343–360. [Google Scholar] [CrossRef]
- McEvily, A.J. On Constitutive Relationships for Fatigue Crack Growth. In Constitutive Laws of Plastic Deformation and Fracture; Springer: Berlin, Germany, 1990. [Google Scholar]
- McEvily, A.J.; Bao, H.; Ishihara, S. A modified constitutive relation for fatigue crack growth. In Fatigue’99: Proceedings of the Seventh International Fatigue Congress; Higher Education Press: Beijing, China, 1999. [Google Scholar]
- Cui, W.C.; Liu, F.; Hu, Z.; Zhu, M.; Guo, W.; Liu, C. On 7000 m sea trials of the manned submersibles. Mar. Technol. Soc. J. 2013, 47, 67–82. [Google Scholar] [CrossRef]
- Cui, W.C.; Wang, F.; Pan, B.B.; Hu, Y.; Du, Q.H. Issues to be Solved in the Design, Manufacture and Maintenance of a Full Ocean Depth Manned Cabin. In Advances in Engineering Research; Petrova, V.M., Ed.; Nova Science Publishers Inc.: New York, NY, USA, 2015. [Google Scholar]
- Lu, Z.; Liu, Y. Small time scale fatigue crack growth analysis. Int. J. Fatigue 2010, 32, 1306–1321. [Google Scholar] [CrossRef]
- Zhang, W.; Liu, Y. Investigation of incremental fatigue crack growth mechanisms using in situ sem testing. Int. J. Fatigue 2012, 42, 14–23. [Google Scholar] [CrossRef]
- Piard, A.; Gamby, D.; Carbou, C.; Mendez, J. A numerical simulation of creep-fatigue crack growth in nickel-base superalloys. Eng. Fract. Mech. 2004, 71, 2299–2317. [Google Scholar] [CrossRef]
- Riedel, H. A dugdale model for crack opening and crack growth under creep conditions. Mat. Sci. Eng. 1977, 30, 187–196. [Google Scholar] [CrossRef]
- Wang, F.; Zhang, X.Z.; Jiang, Z.; Cui, W.C. On calculating the crack growth within a single load-dwell-unload cycle for metal structures. In Proceedings of the 38th International Conference on Ocean, Offshore and Arctic Engineering OMAE 2019, Glasgow, UK, 9–14 June 2019. [Google Scholar]
- Wang, F.; Cui, W.C.; Pan, B.B.; Shen, Y.S.; Huang, X.P. Normalised fatigue and fracture properties of candidate titanium alloys used in the pressure hull of deep manned submersibles. Ships Offshore Struct. 2014, 9, 297–310. [Google Scholar] [CrossRef]
- Zhang, S.J.; Wang, F.; Cui, W.C. Fatigue Crack Growth Properties of 18Ni(250) and 18Ni(350) Used for Full-Ocean-Depth Pressure Hull. J. Ship Mech. 2018, 22, 1540–1548. [Google Scholar]
- Wu, M.; Wang, F.; Cui, W.C. Crack Evaluation of an Ultra-High-Pressure Chamber Used for Deep-Sea Environment Simulation. J. Ship Mech. 2019, accepted. [Google Scholar]
- Wang, F.; Cui, W.C.; Shen, Y.S.; Pan, B.B. Analysis on fracture toughness test results of candidate titanium alloys used in deep manned submersibles. J. Ship Mech. 2012, 16, 1056–1063. [Google Scholar]
- Wang, F.; Pan, B.B.; Shen, Y.S.; Cui, W.C. On fracture resistance parameter from non-standard fracture test specimens of titanium alloy. Ships Offshore Struct. 2014, 9, 177–185. [Google Scholar] [CrossRef]
- Wang, F.; Wang, K.; Cui, W.C. A simplified life estimation method for the spherical hull of deep manned submersibles. Mar. Struct. 2015, 44, 159–170. [Google Scholar] [CrossRef]
- Wang, F.; Cui, W.C. Experimental investigation on dwell-fatigue property of ti-6al-4v ELI used in deep-sea manned cabin. Mat. Sci. Eng. A 2015, 642, 136–141. [Google Scholar] [CrossRef]
- Wang, F.; Cui, W.C.; Wang, Y.Y.; Shen, Y.S. Overload and dwell time effects on crack growth property of high strength titanium alloy TC4 ELI used in submersibles. In Analysis and Design of Marine Structures V; CRC Press: Southampton, UK, 25–27 March 2015. [Google Scholar]
- Wang, F.; Yong, H.U.; Cui, W.C. Preliminary evaluation of maraging steels on its application to full ocean depth manned cabin. J. Ship Mech. 2016, 20, 1557–1572. [Google Scholar]
- Wang, F.; Wang, Y.Y.; Cui, W.C. Prediction of crack growth rates of a high strength titanium alloy for deep sea pressure hull under three loading patterns. J. Ship Mech. 2016, 20, 699–709. [Google Scholar]
- Wang, F.; Wang, W.W.; Cui, W.C. Influential factors to be considered for a tentative long-term service life assessment method of the deep-sea manned cabins. In Proceedings of the TEAM 2018, Wuhan, China, 15–18 October 2018. [Google Scholar]
- Wang, F.; Cui, W.C.; Huang, X.P.; Pan, B.B.; Shen, Y.S. On damage-tolerant properties test and predictions of titanium alloys used in the pressure hull of manned submersibles. In Proceedings of the ICTAM 2012, Beijing, China, 19–24 August 2012. [Google Scholar]
- Zhu, Y.M.; Yao, X.; Yang, L.F.; Wang, F.; Zhang, J. Effect of stress intensity factor on surface crack of deep-sea spherical shell. J. Ship Mech. 2020, 24, 371379. [Google Scholar]
- ABAQUS Theory Manual, Version 6.4; Hibbit, Karlsson & Sorensen, Inc.: Pawtucket, RI, USA, 2002.
- FRANC3D Reference Manual, Version 7.4; Fracture Analysis Consultants, Inc.: New York, NY, USA, 2019.


| Material | A | m |
|---|---|---|
| 2324-T39 Aluminum alloy [14] | 2.4357 × 10⁻⁶ | 2.2143 |
| 6013-T651 Aluminum alloy [14] | 7.6399 × 10⁻⁶ | 1.5997 |
| 7055-T7511 Aluminum alloy [14] | 5.2495 × 10⁻⁶ | 1.8772 |
| 7075-T6 Aluminum alloy [14] | 6.2510 × 10⁻⁶ | 1.9249 |
| 7075-T651 Aluminum alloy [14] | 4.5774 × 10⁻⁵ | 1.0520 |
| Ti-10V-Fe-3 Titanium alloy [14] | 3.5880 × 10⁻⁶ | 1.3069 |
| HTS-A steel [14] | 1.3900 × 10⁻¹⁰ | 2.3668 |
| 300 M steel [14] | 1.5770 × 10⁻¹⁰ | 2.3031 |
| 350 WT steel [14] | 7.3784 × 10⁻¹⁰ | 2.0628 |
| CrMoV [14] | 3.2097 × 10⁻¹⁰ | 1.9858 |
| Ti-6Al-4V ELI [45] | 5.0000 × 10⁻⁸ | 3.0000 |
| 18N(250) [46] | 1.5160 × 10⁻⁹ | 1.5400 |
| 18N(350) [46] | 1.5700 × 10⁻⁹ | 1.4800 |
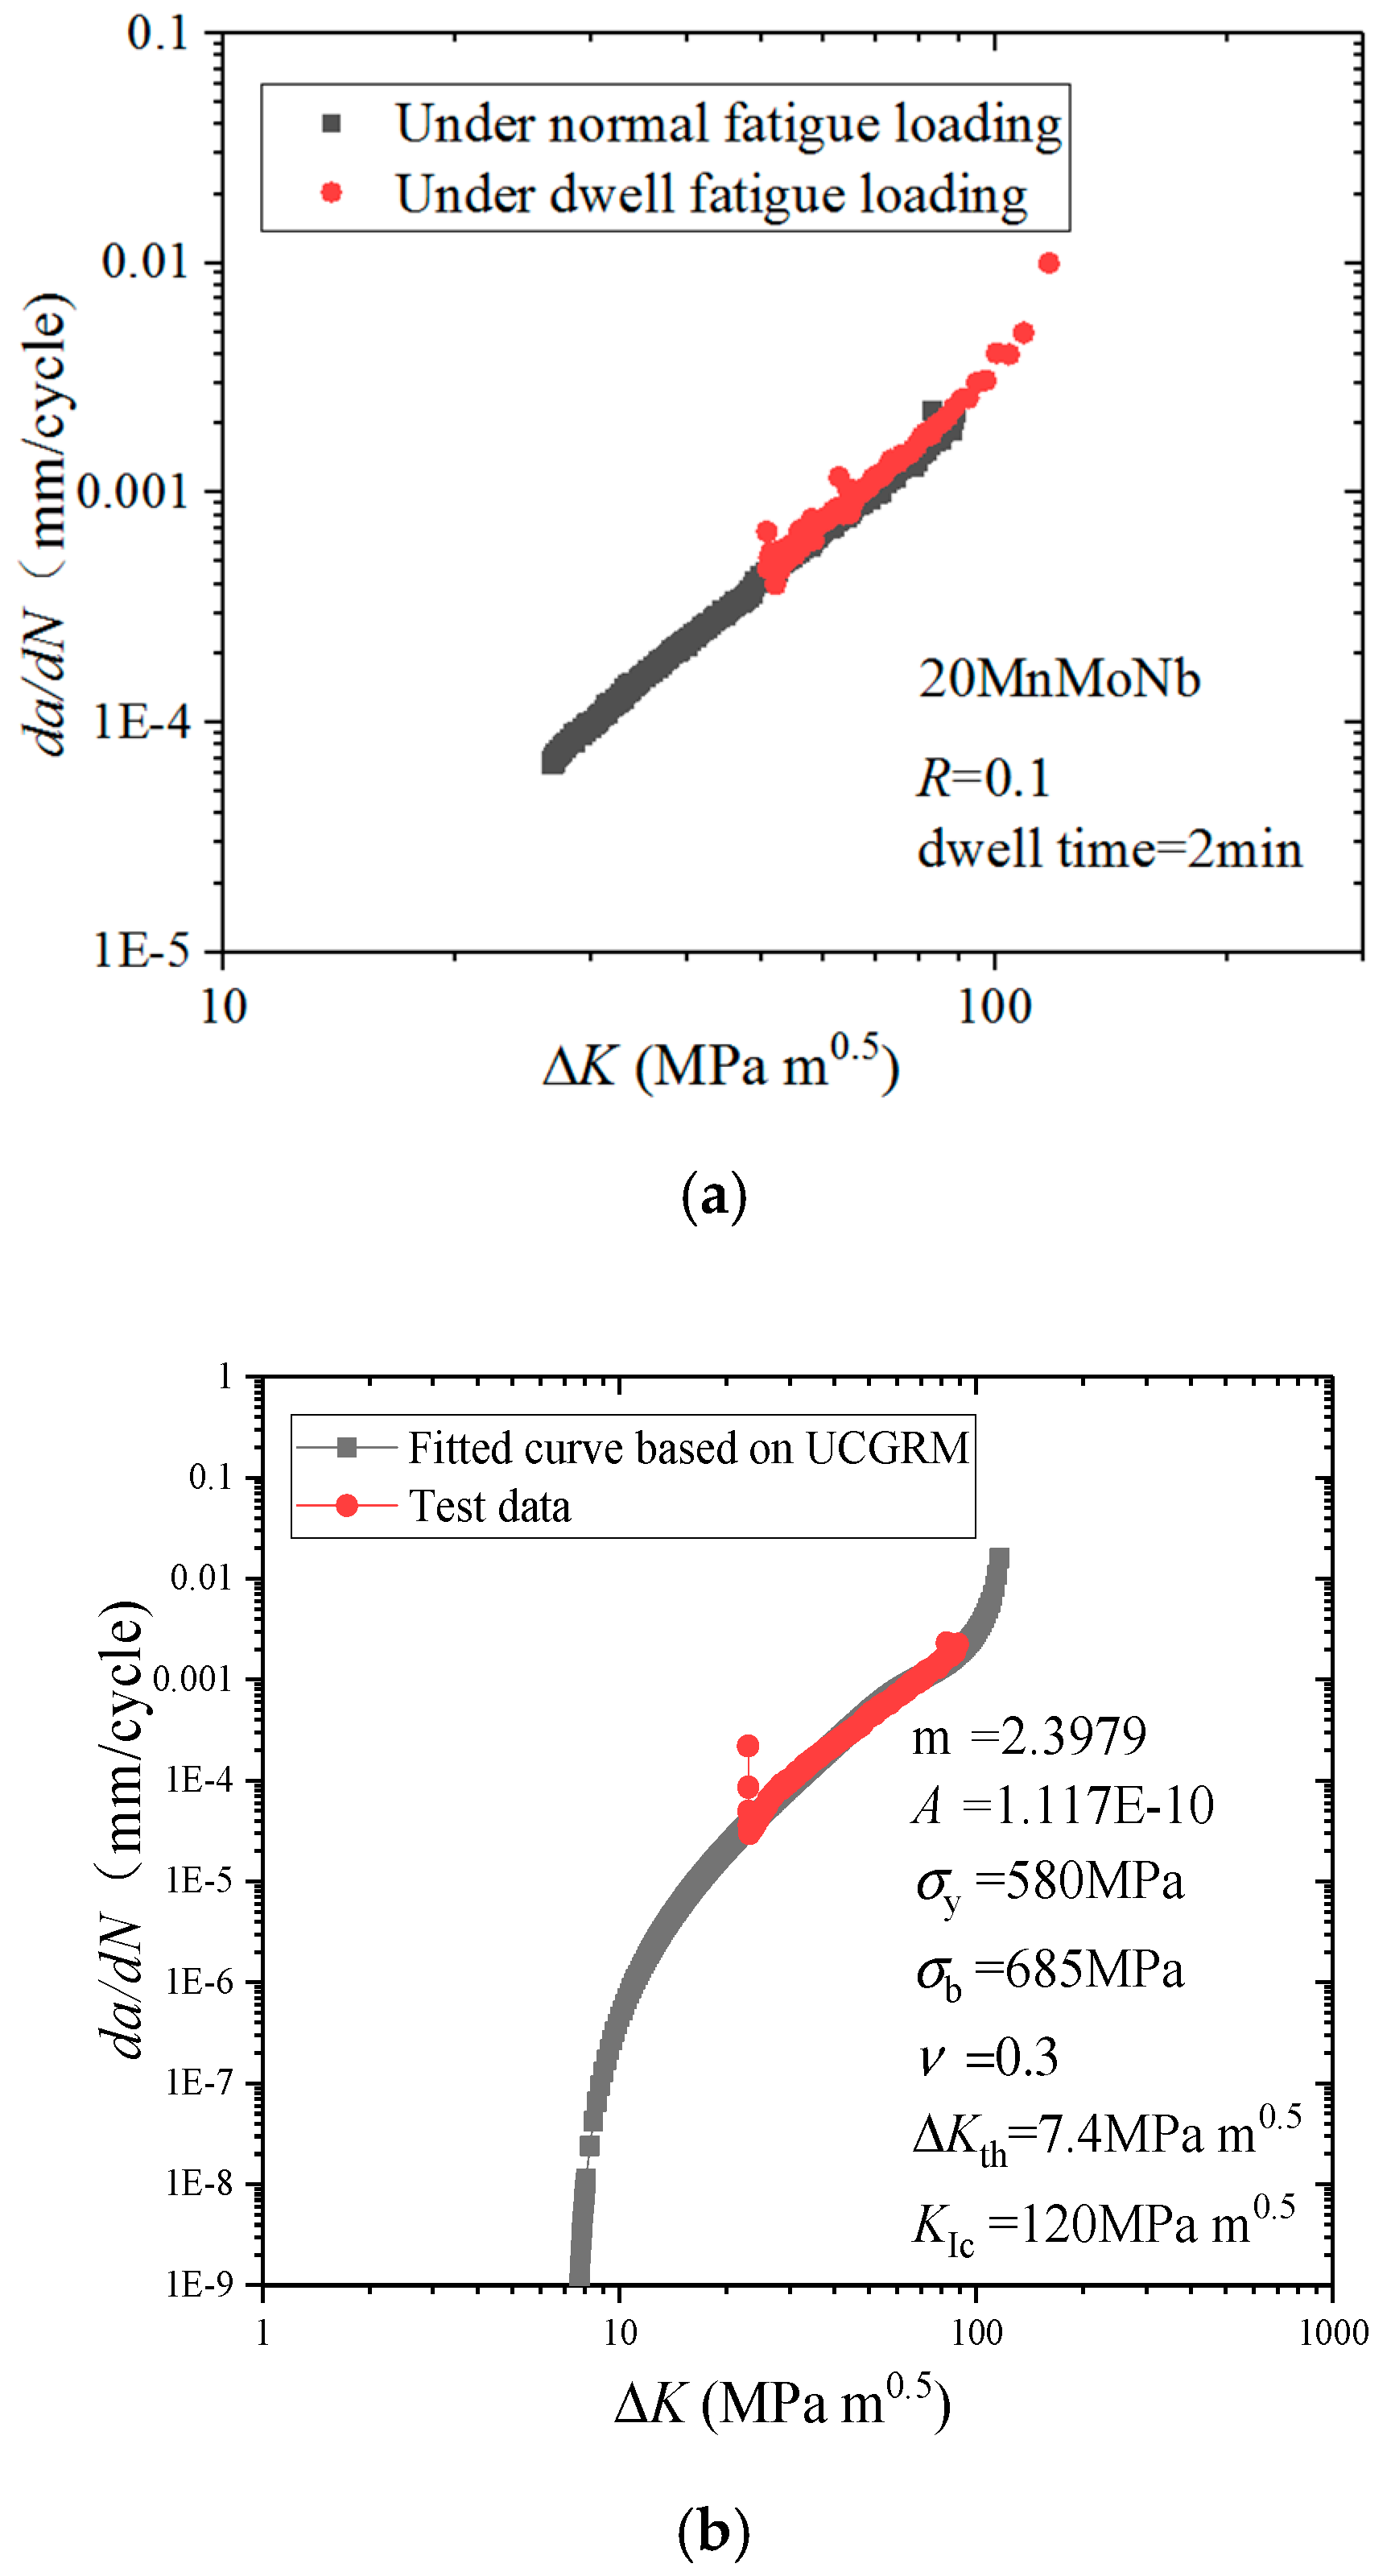
| 20MnMoNb [47] | 1.1170 × 10⁻¹⁰ | 2.3979 |
| Parameter | D | d | T | t | L | a0 | c0 |
|---|---|---|---|---|---|---|---|
| Value (mm) | 914.56 | 457.28 | 32 | 16 | 5486.4 | 3.5 | 10 |
© 2020 by the authors. Licensee MDPI, Basel, Switzerland. This article is an open access article distributed under the terms and conditions of the Creative Commons Attribution (CC BY) license (http://creativecommons.org/licenses/by/4.0/).
Share and Cite
Wang, F.; Cui, W. Recent Developments on the Unified Fatigue Life Prediction Method Based on Fracture Mechanics and its Applications. J. Mar. Sci. Eng. 2020, 8, 427. https://doi.org/10.3390/jmse8060427
Wang F, Cui W. Recent Developments on the Unified Fatigue Life Prediction Method Based on Fracture Mechanics and its Applications. Journal of Marine Science and Engineering. 2020; 8(6):427. https://doi.org/10.3390/jmse8060427
Chicago/Turabian StyleWang, Fang, and Weicheng Cui. 2020. "Recent Developments on the Unified Fatigue Life Prediction Method Based on Fracture Mechanics and its Applications" Journal of Marine Science and Engineering 8, no. 6: 427. https://doi.org/10.3390/jmse8060427