Article

Evolution and Structure of the Kuroshio Extension Front in Spring 2019

1
College of Meteorology and Oceanography, National University of Defense Technology, Nanjing 211101, China
2
NO. 61741 Army of PLA, Beijing 100094, China
*
Author to whom correspondence should be addressed.
These authors contributed equally to this work. They are the co-first authors.
J. Mar. Sci. Eng. 2020, 8(7), 502; https://doi.org/10.3390/jmse8070502
Submission received: 2 June 2020 / Revised: 5 July 2020 / Accepted: 6 July 2020 / Published: 8 July 2020
(This article belongs to the Section Physical Oceanography)

Abstract

:
Satellite data products and high-resolution in situ observations were combined to investigate the evolution and structure of the Kuroshio Extension Front in Spring 2019. The former reveals the variation of the front is influenced by the northward movement of the Kuroshio Extension through transporting warm and saline water to a cold and brackish water region. The latter indicates steep upward slopes of the isopycnals, tilting northward in the frontal zone, as well as several ~300 m thick blobs of North Pacific Intermediate Water between 26.25 and 26.75 kg/m3, where conspicuous thermohaline intrusions occur. Further analysis indicates these thermohaline intrusions prefer to alternate salt fingering and diffusive convection interfaces, and are affected by strong shears.

1. Introduction

The Kuroshio Extension (KE) is a variable eastward inertial jet separating from the coast of Japan near 35° N in the North Pacific Ocean [1,2,3]. Without the constraint of coastal boundaries, it is rich in large-amplitude meanders and energetic pinched-off eddies, which are often associated with the sharp subsurface front named the Kuroshio Extension Front (KEF) [2,3,4,5,6,7]. As a boundary of different water masses, the oceanic fronts could be characterized by across-front contrasts in temperature, salinity and density [4,8,9]. The KEF is formed by a steep upward slope of the main pycnocline tilting northward [5,10]. It is strong in winter and weak in summer, and has important impacts on the regional ecosystem, fishery, and atmosphere [5,11,12].
The fine-scale structure named the thermohaline intrusion is often observed in the frontal zone and has an important role as the indicator of lateral exchange [13]. It is indicated by changes in the sign of vertical temperature or salinity gradients, and can be attributed to double diffusion, either by salt fingering or diffusive convection through heat/salt fluxes as well as advection through cross-front velocity perturbation [4,6,13,14,15,16,17,18,19,20].
The KEF has been investigated widely by recognizing sea surface temperature by remote sensing measurements [8,11,21,22,23,24] and using model outputs [10,11,23,25]. Field observations could offer more reliable data, but they are still rare to date. In addition, the common observations are based on Conductivity–Temperature–Depth (CTD), but the spacing of their stations (~20 km) is too coarse to provide a refined structure of the front [14].
In this work, we investigated the KEF’s evolution and structure based on the high-resolution in situ observations from a Moving Vessel Profiler (MVP), a shipboard Acoustic Doppler Current Profiler (ADCP), and satellite measurements in Spring 2019. This paper is organized as follows: Section 2 describes the materials and methods used; Section 3 discusses the evolution of the surface thermal KEF during the end of April to the end of June in 2019, thermohaline and velocity structure across the KEF measured by MVP and ADCP, as well as the characteristics and mechanism of thermohaline intrusions in the frontal zone; Section 4 offers a summary and discussion.

2. Materials and Methods

2.1. Satellite Remote Sensing Data and In Situ Observations

The daily satellite data sets with 1/4° × 1/4° resolution including sea surface temperature (SST), absolute dynamic topography (ADT), sea level anomaly (SLA), and sea surface geostrophic velocities from the end of April to the end of June in 2019 were used in this study. SST came from the Optimum Interpolation Sea Surface Temperature (OISST) product distributed by National Oceanic and Atmospheric Administration (NOAA) (http://www.ncei.noaa.gov/data/sea-surface-temperature-optimum-interpolation/acess/avhrr-only/), and the other data were from Archiving, Validation, and Interpretation of Satellite Oceanographic (AVISO) product (http://marine.copernicus.eu/services-portfolio/access-to-products/).
A hydrographic survey with four observation sections for the frontal zone was carried out from 28 to 30 May 2019. The details of the stations can be found in Table 1 and Figure 1, and the spacing was less than 10 km. The temperature, conductivity, and pressure were measured by the MVP equipped with Temperature•Xchange™, Conductivity•Xchange™ and Pressure•Xchange™. The row profiles were processed following [26] to deal with the errors caused by the response times of temperature and conductivity sensors, and thermal mass of the conductivity cell. After that, we interpolated the data to 1-m interval and used a 7-point median filter to reduce salinity spikes [27]. The velocity profiles along the ship track were obtained by an Ocean Surveyor 38 kHz ADCP (16 m-bin size). The research vessel was sailed in a straight line at a constant speed around 10 knots during the section observation period. Ordinarily, the quality control of ADCP data are processed as follows: setting quality control parameters and corresponding threshold value to detect suspect data; using a water/bottom-track to correct system errors [28,29,30]. However, in deep oceans, bottom tracking is invalid. Instead, we chose reference layers and used a lowpass filter to calculate accurate current velocity; more details can be found in [31].

2.2. Methods

In this study, a gradient-based algorithm was utilized for the SST fields [32]. The surface thermal front could be identified by the horizontal SST gradient in each geo-referenced grid. The SST gradient magnitude (GMT) is defined by the following formula:
G M T = | H T | = ( T x ) 2 + ( T y ) 2
We calculated several parameters based on the in situ data as follows:
A potential spicity function whose contours are (in the least square sense) orthogonal to those of potential density is a new approach in oceanography. By using practically an orthogonal potential density-potential spicity (σ-π) coordinate system, water mass analysis can be carried out accurately and water masses can be traced by their σ-π properties; in addition, the isopycnal layer analysis can be carried out accurately. We calculated potential spicity by the least square method. More details including definition, computational procedure, application, and advantages can be found in [33]. And the newly defined potential spicity functions in forms of standard Matlab codes are available in the Supplemental Information of [33]. After that, when we completed the thermohaline analysis, we converted the potential temperature-salinity (θ-S) coordinate system to a σ-π coordinate system.
We characterized thermohaline intrusions through two methods. One was the isopycnal anomaly method: using the isopycnal salinity anomaly S’ (interpolating salinity into 0.01 kg/m3-interval isopycnal) as an indicator of the intrusion strength, where the anomaly was computed relative to some “mean background state” of the ocean (in this paper, it was calculated through a 13-point (0.13 kg/m3) running mean) [13,34]. The other was the diapycnal spiciness curvature method: using the second derivative of potential spiciness with respect to potential density τσσ as an indicator of water mass interleaving [13].
In order to analyze two types of double diffusion (salt finger and diffusive convection), the Turner angle Tu was calculated from the profiles of potential temperature θ and salinity S as:
T u = tan 1 ( α θ z + β S Z α θ z β S Z )
where α and β are thermal expansion and haline contraction coefficients, respectively [35]. When 45° (72°) < Tu < 90°, thermohaline stratification is favorable for (strong) salt fingers, when −90° < Tu < −45° (−72°), it is favorable for (strong) diffusive convection. The stratification is stable when Tu is between −45° and 45° and gravitationally unstable when Tu is beyond ±90° [35].

3. Results

3.1. Evolution of Surface Thermal Kuroshio Extension Front from Satellite Measurements

The frontal activities east of Japan presented significant variations during the end of April to the end of June in 2019, both temporally and spatially (Figure 2). The KEF band (>0.025 °C/km) had meandering characteristics in the upstream KE. Generally, it was always strong (about 0.05 °C/km) from the east coast of Japan to 146° E, corresponding to the first meander of the KE jet, polytropic at the second meander, and always weak (about 0.025–0.03 °C/km) east of the second mender. Undoubtedly, the KE jet affected the distribution of the KEF to a large extent.
Due to the variability of the second meander, the KEF experiences a strong variation there. Satellite measurements indicate the second meander gradually moves northward during the end of April to the end of May. It transports the warm and saline water masses, and mixes them with the cold and brackish water masses in the Kuroshio-Oyashio Confluence Region (KOCR). This process caused the convoluted KEF’s northward movement and enhancement (from 0.025 °C/km to >0.035 °C/km) as well as generated the pinched-off eddies (e.g., A2-3-6) and merged eddies (e.g., A7) at the region from 148° E to 154° E. During the end of May to early June, the second meander reverted to a southward movement and became flat; the KEF gradually became stable.
The crest of the second meander moved from 37° N on 24 April northest to 38.5° N on 22 May, which generated the strongest part of the KEF (about 0.05 °C/km), located in the black boxes of Figure 1 and Figure 2. Undoubtedly, seawater in the more northern areas was colder (Figure 2j); therefore, the temperature gradient between the northern KOCR and the KE water masses became higher. After that, an anticyclone eddy named A7 detached from the crest. It locked and carried the KE water mass, whose SST was >20 °C (Figure 2j), to maintain the intensity in the black box on 29 May. Thereafter, the anticyclone eddy A7 moved westward and the north cyclone eddy C3 moved eastward. The SST gradient between them became lower and reduced to approximately 0.025 °C/km on 19 June.

3.2. Thermohaline and Velocity Structure across the Kuroshio Extension Front

The in-situ observations of Zone A were made from 28 to 30 May 2019. Satellite measurements indicated that the A1–A3 sections could capture the front, the anticyclone eddy A7, and the cyclone eddy C3; the A4 section could capture a small anticyclone eddy near 39° N else (Figure 1). The tight-station settings and high-resolution instruments depicted their thermohaline and velocity structure clearly.
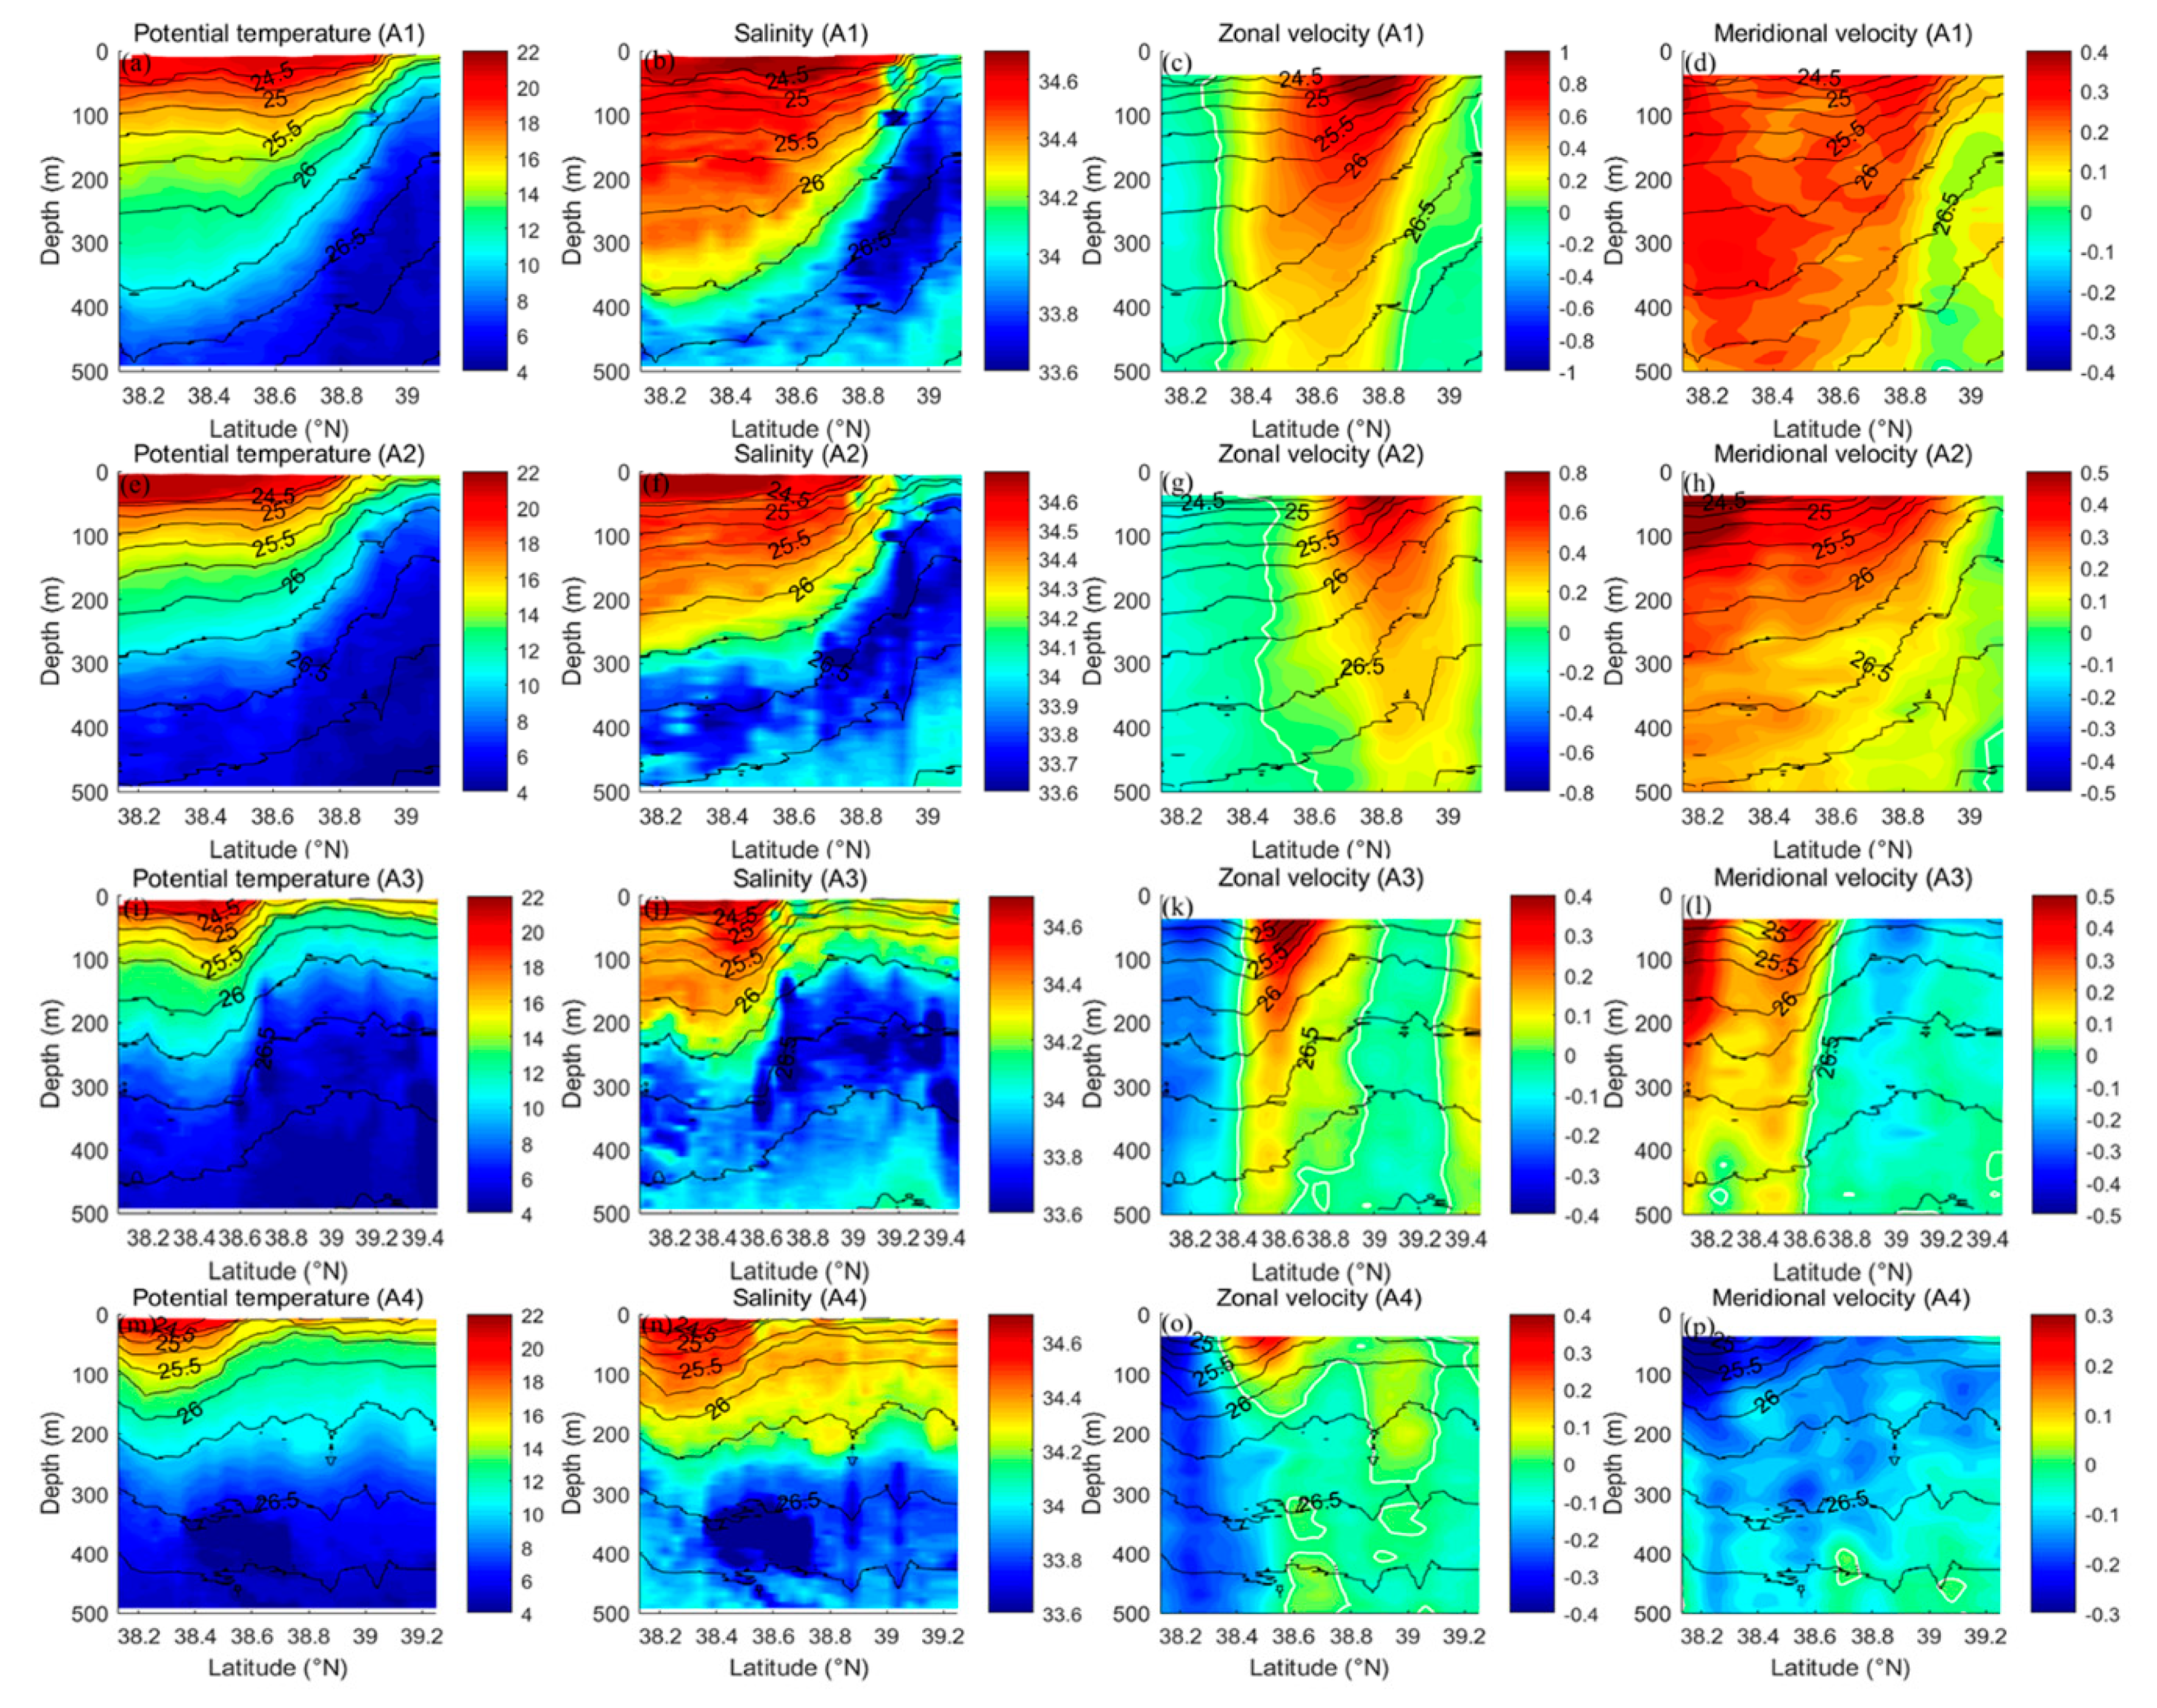
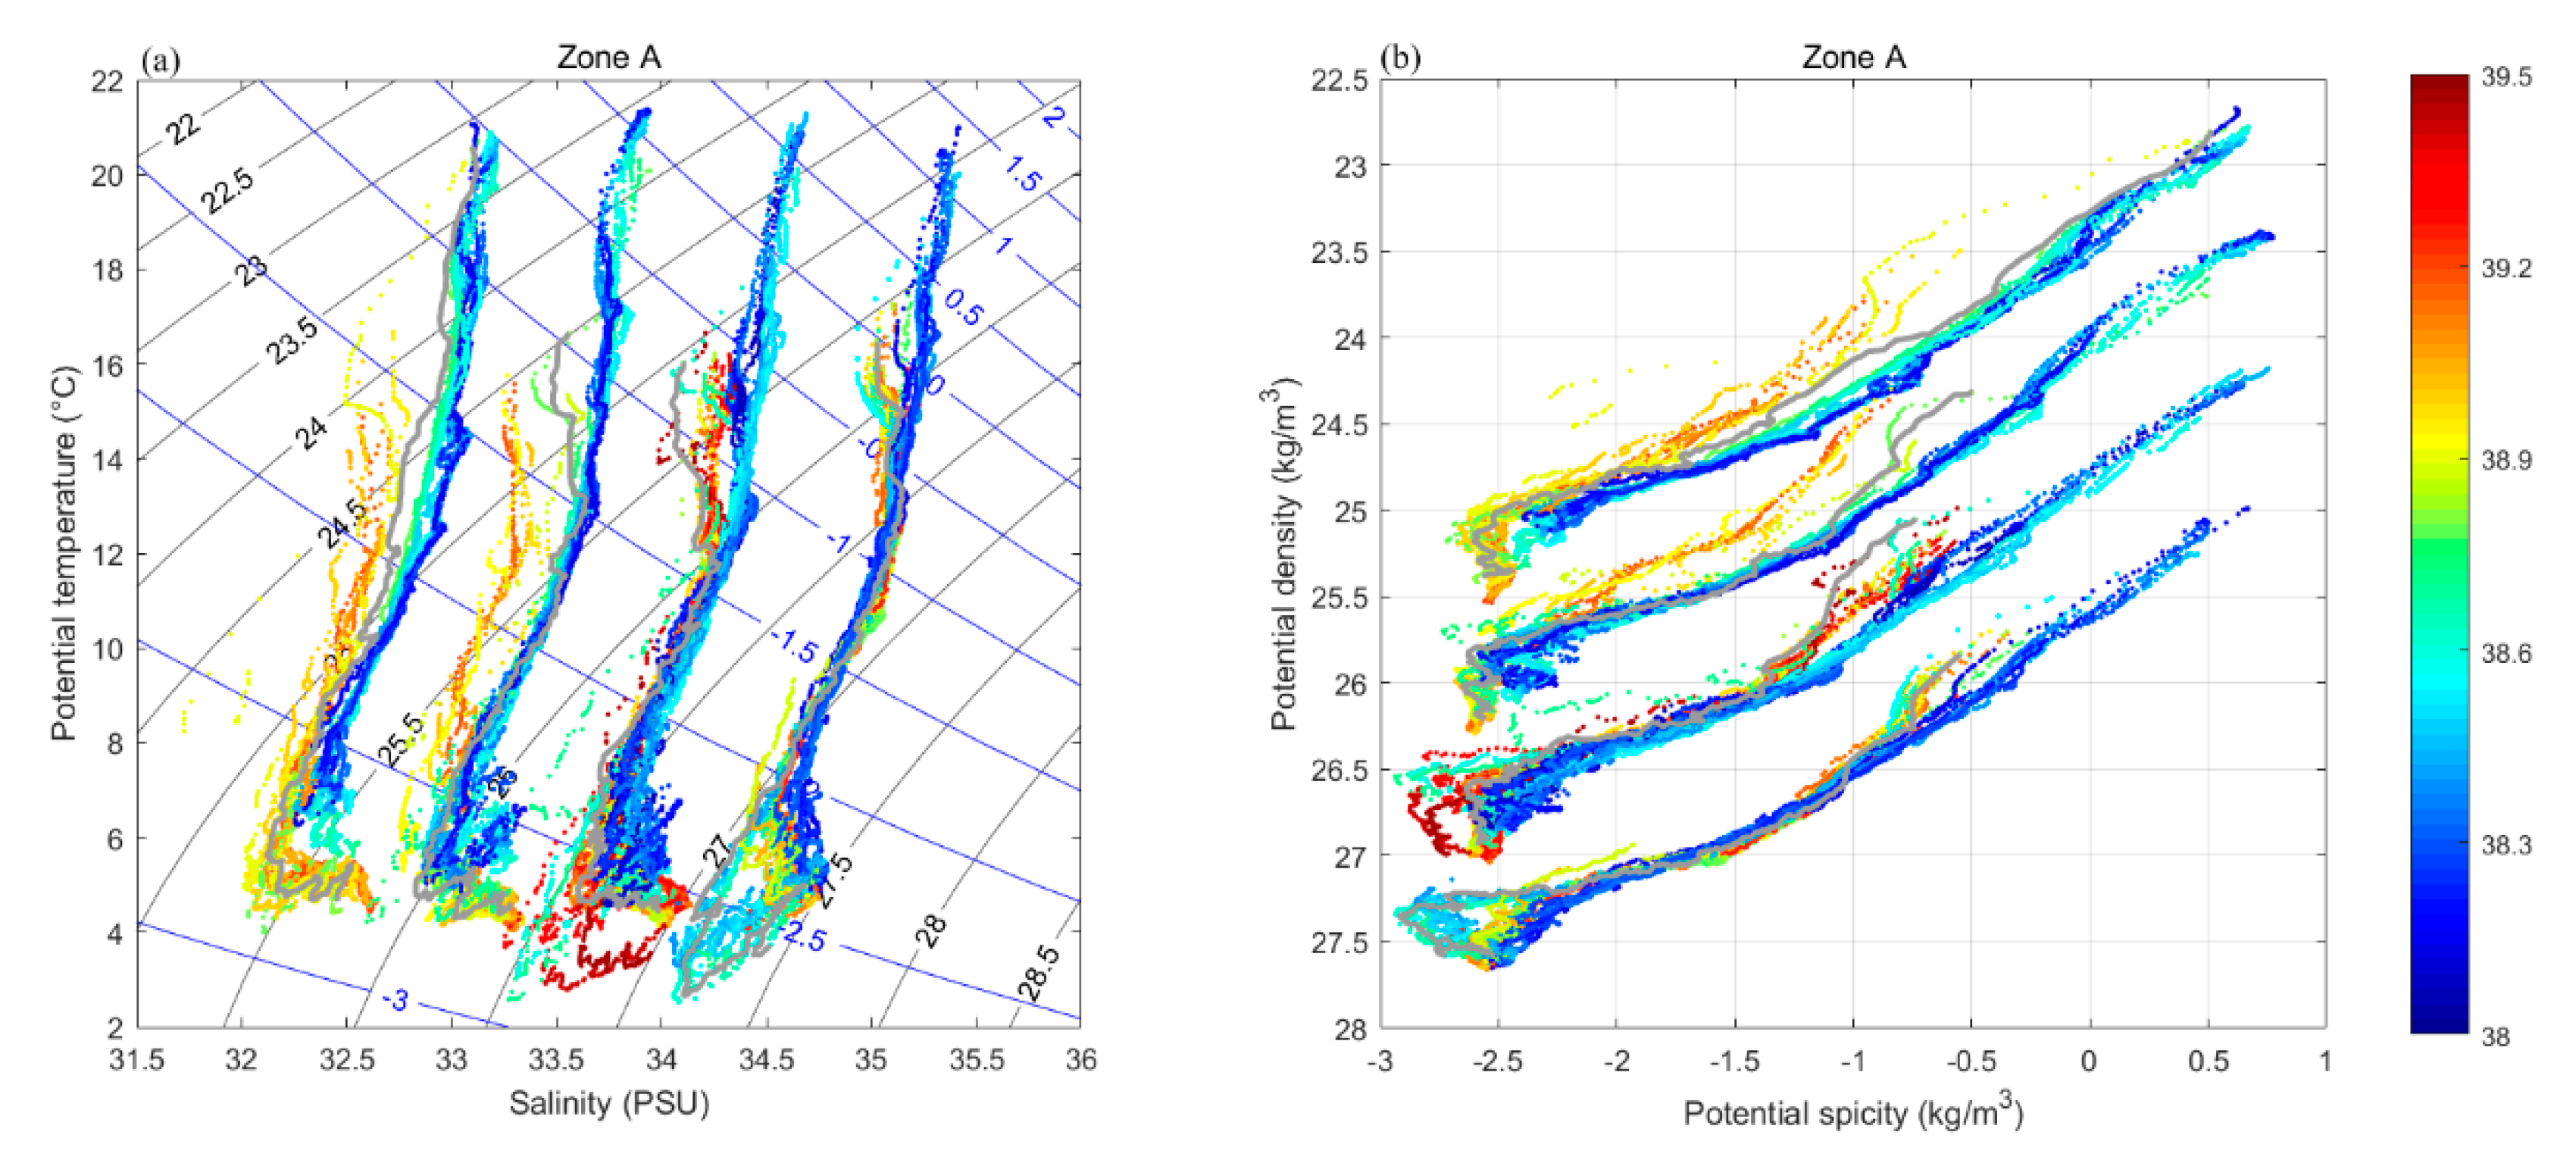
The potential temperature and salinity across the front observed by the MVP showed clear contrasts between the warm and saline water and the cold and fresh water (Figure 3 and Figure 4). In the interior of eddy A7, steep upward slopes of the isotherms, isohalines, and isopycnals were found from its center to boundaries. Apparently, A7 had warmer and more saline water than that of the surrounding water, which indicates the source of A7 is the KE as well. In contrast, downward slopes were found from eddy C3’s center to its boundaries, which means C3 had colder and fresher water. When the eddies of different thermohaline properties meet, their boundary can be named a “front”. In the last section, we analyzed this front’s evolution. Although the observed front was maintained by eddies, we still call it “KEF” since the front and eddy A7 come from KE. Furthermore, characteristics of the slopes reflect the eddies’ and front’s traits. The isolines’ throughs represent the locations nearest to the warm eddy A7’s center of the four sections. They are gradual towards the south from A1 to A4 sections, which indicates A7’s distribution is southwest-northeast by 500 m. Similarly, the crests represent the locations nearest the cold eddy C3’s center, but only in the A3 section could they be displayed. In the A4 section, the isolines rose from 38.83° N to 39° N, signifying the A4 section captures the small warm eddy mentioned before near 39° N. These results are consistent with the satellite measurements.
The currents measured by 38 kHz ADCP can reflect the eddies’ and front’s dynamic properties. The cores of the positive zonal velocities occurred in the upper layers in 38.4–39° N of the A1 section, in 38.6–39° N of the A2 section, in 38.4–38.8° N of the A3 section, and in 38.4–38.6° N of the A4 section, which corresponds to the ranges of prominently rising isolines and represents the locations of the front. The zonal velocities decreased with depth near the front, indicating the strong shear that creates density slope tilting. Although the meridional velocities were weaker than the zonal velocities in general, they still cannot be left out as the approximative cross-frontal velocities. The sloping layers of meridional velocities appeared to cross isopycnal surfaces, affecting the variabilities of the isopycnals. Moreover, the eddies were surface intensified in temperature and salinity, down to a 250–350 m depth, but their dynamical influence reached deeper.
Another prominent feature is the blobs of low salinity between σθ = 26.25–26.75 kg/m3 of ~300 m thickness (Figure 3), which is the North Pacific Intermediate Water (NPIW) formed in the KOCR [36]. The zonal velocities suggest that NPIW was under the primary velocity core and the meridional velocities suggest it could be extended/obstructed by cross-frontal velocities. Large variations in potential spiciness across the KEF seen in the θ-S plot and σ-π plot (Figure 4) illustrate that interleaving layers may arise when along-isopycnal transports occur in intermediate layers [4,37]. We chose four single representative profiles near the front, as shown by the gray curves in Figure 4; these gray θ-S and σ-π curves are zigzags deeper than σθ = 26.5 kg/m3, which are necessary anatomies of interleaving layers, and can be seen in many other profiles.

3.3. Thermohaline Intrusions in the Frontal Zone

In the last section, we discussed the thermohaline and velocity structure across the front, and found intrusions occurred in the intermediate layer. Next, we will provide further analysis of the fine-scale structure: thermohaline intrusions.
In order to detect the thermohaline intrusions across the KEF objectively, we used both the isopycnal salinity anomaly method and diapycnal potential spiciness curvature method in an isopycnal coordinate system to reduce the distortion of interleaving features by internal waves, as shown in Figure 5. High absolute values of S’ and τσσ represent strong diapycnal interleaving layers between two different water masses, while low absolute values represent the curvature of the vertical profile is diminished by diapycnal mixing [13,14]. These two methods detect the nearly unanimous interleaving layers. It is easily seen that the S’ and τσσ were small shallower than σθ = 26 kg/m3, as expected for a stable water mass. Thermohaline intrusions were primarily in the layers deeper than σθ = 26.25 kg/m3, which correspond to the NPIW layer. Besides, in the vicinity of the front, the S and τσσ were less coherent laterally but had higher values and showed stronger vertical coherence (more full oscillations from minimum negative to maximum positive values).
Double diffusive processes were attributed by previous studies as the driving mechanism for the growth of intrusions through changing potential density [36,38,39]. Turner angle (Tu) computed for MVP data is shown in Figure 6a–d. The value of Tu indicates that the (strong) salt fingering regime mainly appeared (σθ = 26.25–26.5 kg/m3) shallower than σθ = 26.5 kg/m3 and the diffusive convection regime mostly appeared deeper than σθ = 26.5 kg/m3. Therefore, strong salt fingering interfaces occurred at the top and diffusive interfaces at the bottom of the intruded fresh, cold NPIW layers; the interleaving layers preferred the alternate salt fingering and diffusive convection interfaces. Furthermore, we calculated the correlation coefficients between the salinity anomaly and density anomaly of the four representative profiles deeper than σθ = 26.25 kg/m3. They were 0.63/0.60/0.63/0.80 for A1/A2/A3/A4, respectively (beyond 95% significance test). High positive coefficients imply diffusive convection has important effects on the development of thermohaline intrusions according to linear theory [17,19].
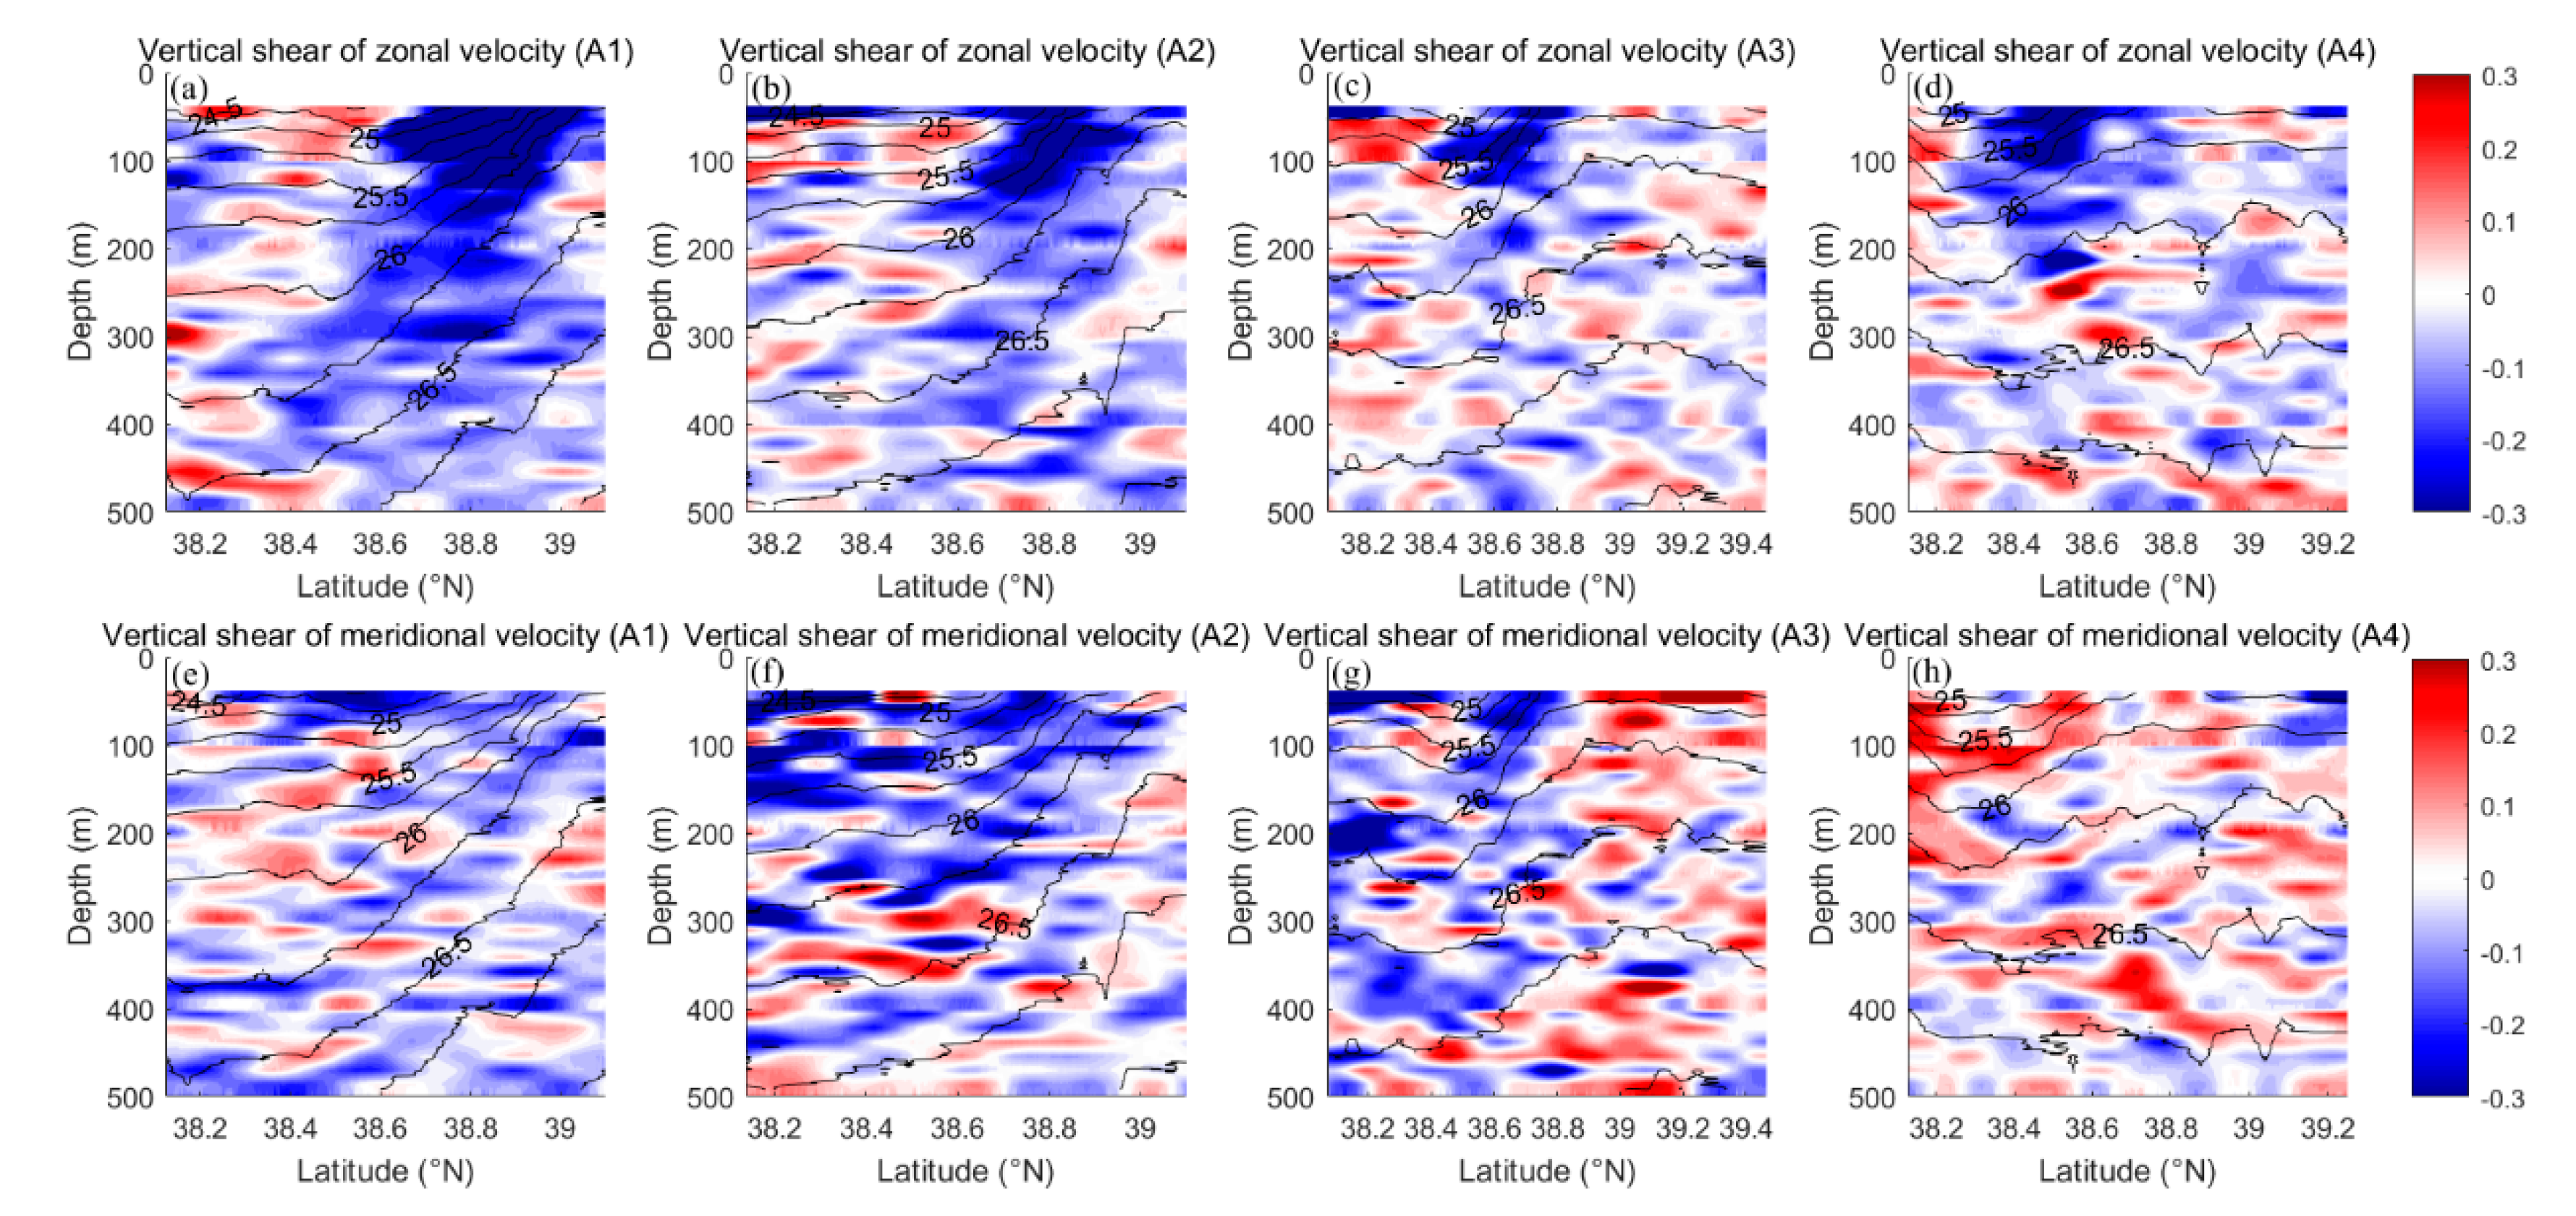
In addition to double diffusive convection, background shear in a highly dynamic environment conceivably affects thermohaline intrusions. The strong negative vertical shear of along-frontal horizontal current in the upper frontal zone restricted the thermohaline intrusions’ development shallower than σθ = 26.25 kg/m3 while relatively weak shears deeper than σθ = 26.25 kg/m3 did not have a big impact, therefore, thermohaline intrusions were primarily in the intermediate layers (Figure 7a–d). The vertical shear of cross-frontal horizontal current presents an intense and spatially coherent fine-scale shear layer, which is influenced mostly from high vertical wavenumber shear, presumably caused by internal waves, and may drive intrusions [15,40,41]. We calculated the correlation coefficients between the salinity anomaly and velocity anomaly as well, but did not find a high correlation. The lack of linear correlation is similar to that of the North Pacific subtropical frontal zone and the Agulhas Current [13,41].

4. Summary and Discussion

In this study, satellite sea surface temperature and sea surface height data products as well as in situ observations of temperature, salinity, and currents in the upper 500 m were used to analyze the evolution and structure of the Kuroshio Extension Front.
The KEF was variable during the end of April to the end of June in 2019, linking with the movement of the KE’s second meander. The second meander transported warm and saline water to the north, mixed them with the cold and brackish water masses in the KOCR, and caused the strong KEF. After that, the KEF reverted to the south and became flat, in the meantime, an anticyclone eddy detached from its crest. The eddy locked and carried the KE water mass to maintain the intensity of the front locally. Thereafter, the eddy moved westward and the front became weak gradually.
During the period of eddy maintaining front, across-front surveys including four sections were carried out. The measured thermohaline structures showed steep upward slopes of the isopycnals, tilting northward in the frontal zone. The along-front eastward velocities decreased rapidly with depth near the front, corresponding to strong vertical shears. In the layer between σθ = 26.25–26.75 kg/m3, we observed several ~300 m thick blobs of cold and fresh water, which is the salinity minimum zone of the NPIW. Using the isopycnal anomaly method and diapycnal spiciness curvature method, characteristic thermohaline intrusions were presented primarily in the intermediate layers deeper than 26.25 kg/m3. They preferred to the alternate salt fingering and diffusive convection interfaces by analyzing Turner angle, and were affected by strong shears.
Although lacking time-varying in situ observations, the impacts of eddies on interleaving layers can be speculated. Anticyclonic/cyclonic eddies can enhance/weaken the density slopes and next provide extra horizontal density gradients that are positive/negative to enhance/suppress the growth of interleaving layers in the cross-front direction [14]. Therefore, anticyclonic eddy A7 potentially increases density slopes, which has a positive effect on the growth of the observed interleaving layers. Cyclonic eddy C3 may have a converse influence. The inference merits further comprehensive field observations to verify.

Author Contributions

X.C. and K.M. collected the in situ observational data. J.W. treated and analyzed the data. J.W., X.C., and K.M. interpreted the results. J.W., X.C., K.M., and K.Z. discussed the results and wrote the paper. All authors have read and agreed to the published version of the manuscript.

Funding

This research was funded by the National Natural Science Foundation of China (11572351).

Acknowledgments

The authors thank NOAA and AVISO for providing satellite remote sensing data for free on their websites, and also thank all the crew members who participated in the ship cruising observation.

Conflicts of Interest

The authors declare no conflict of interest.

References

  1. Kawai, H. Hydrography of the Kuroshio Extension; University of Tokyo Press: Tokyo, Japan, 1972. [Google Scholar]
  2. Qiu, B.; Chen, S. Variability of the Kuroshio Extension Jet, Recirculation Gyre, and Mesoscale Eddies on Decadal Time Scales. J. Phys. Oceanogr. 2005, 35, 2090–2103. [Google Scholar] [CrossRef]
  3. Delman, A.S.; Mcclean, J.L.; Sprintall, J.; Talley, L.D.; Yulaeva, E. Effects of Eddy Vorticity Forcing on the Mean State of the Kuroshio Extension. J. Phys. Oceanogr. 2015, 45, 1356–1375. [Google Scholar] [CrossRef]
  4. Nagai, T.; Inoue, R.; Tandon, A.; Yamazaki, H. Evidence of enhanced double-diffusive convection below the main stream of the Kuroshio Extension. J. Geophys. Res. Oceans 2015, 120, 8402–8421. [Google Scholar] [CrossRef] [Green Version]
  5. Kida, S.; Mitsudera, H.; Aoki, S.; Guo, X.; Ito, S.I.; Kobashi, F.; Komori, N.; Kubokawa, A.; Miyama, T.; Morie, R.; et al. Oceanic fronts and jets around Japan: A review. J. Oceanogr. 2015, 71, 469–497. [Google Scholar] [CrossRef]
  6. Nagai, T.; Tandon, A.; Yamazaki, H.; Doubell, M.J.; Gallager, S. Direct observations of microscale turbulence and thermohaline structure in the Kuroshio Front. J. Geophys. Res. Oceans 2012, 117, C08013. [Google Scholar] [CrossRef] [Green Version]
  7. Ji, J.; Dong, C.; Zhang, B.; Liu, Y.; Zou, B.; King, G.P.; Xu, G.; Chen, D. Oceanic Eddy Characteristics and Generation Mechanisms in the Kuroshio Extension Region. J. Geophys. Res. Oceans 2018, 123, 8548–8567. [Google Scholar] [CrossRef]
  8. Wang, Y.; Yang, X.; Hu, J. Position variability of the Kuroshio Extension sea surface temperature front. Acta Oceanol. Sin. 2016, 35, 30–35. [Google Scholar] [CrossRef]
  9. Zhu, K.; Chen, X.; Mao, K.; Hu, D.; Hong, S.; Li, Y. Mixing Characteristics of the Subarctic Front in Kuroshio-Oyashio Confluence Region. Oceanologia 2019, 61, 103–113. [Google Scholar] [CrossRef]
  10. Nonaka, M.; Nakamura, H.; Tanimoto, Y.; Kagimoto, T.; Sasaki, H. Decadal variability in the Kuroshio–Oyashio Extension simulated in an eddy-resolving OGCM. J. Clim. 2006, 19, 1970–1989. [Google Scholar] [CrossRef] [Green Version]
  11. Nagai, T.; Clayton, S. Nutrient interleaving below the mixed layer of the Kuroshio Extension Front. Ocean Dyn. 2017, 67, 1027–1046. [Google Scholar] [CrossRef]
  12. Pauly, D.; Christensen, V. Primary production required to sustain global fisheries. Nature 1995, 374, 255–257. [Google Scholar] [CrossRef]
  13. Shcherbina, A.Y.; Gregg, M.C.; Alford, M.H.; Harcourt, R.R. Characterizing Thermohaline Intrusions in the North Pacific Subtropical Frontal Zone. J. Phys. Oceanogr. 2009, 39, 2735–2756. [Google Scholar] [CrossRef]
  14. Jan, S.; Wang, S.-H.; Yang, K.-C.; Yang, Y.J.; Chang, M.-H. Glider observations of interleaving layers beneath the Kuroshio primary velocity core east of taiwan and analyses of underlying dynamics. Sci. Rep. 2019, 9, 1–11. [Google Scholar]
  15. Itoh, S.; Kaneko, H.; Ishizu, M.; Yanagimoto, D.; Okunishi, T.; Nishigaki, H.; Tanaka, K. Fine-scale structure and mixing across the front between the Tsugaru Warm and Oyashio Currents in summer along the Sanriku Coast, east of Japan. J. Oceanogr. 2016, 72, 23–37. [Google Scholar] [CrossRef]
  16. Richards, K.; Banks, H. Characteristics of interleaving in the western equatorial Pacific. J. Geophys. Res. Oceans 2002, 107, 24-1–24-12. [Google Scholar] [CrossRef]
  17. Ruddick, B.; Kerr, O. Oceanic thermohaline intrusions: Theory. Progr. Oceanogr. 2003, 56, 483–497. [Google Scholar] [CrossRef]
  18. Ruddick, B.; Richards, K. Oceanic thermohaline intrusions: Observations. Prog. Oceanogr. 2003, 56, 499–527. [Google Scholar] [CrossRef]
  19. Stern, M.E. Lateral mixing of water masses. Deep Sea Res. Oceanogr. Abstr. 1967, 14, 747–753. [Google Scholar] [CrossRef]
  20. Ruddick, B.; Gargett, A.E. Oceanic double-infusion: Introduction. Prog. Oceanogr. 2003, 56, 381–393. [Google Scholar] [CrossRef]
  21. Nakano, H.; Tsujino, H.; Sakamoto, K.; Urakawa, S.; Toyoda, T.; Yamanaka, G. Identification of the fronts from the Kuroshio Extension to the Subarctic Current using absolute dynamic topographies in satellite altimetry products. J. Oceanogr. 2018, 74, 393–420. [Google Scholar] [CrossRef]
  22. Peilong, Y.; Lifeng, Z.; Yongchui, Z.; Bing, D. Interdecadal change of winter SST variability in the Kuroshio Extension region and its linkage with Aleutian atmospheric low pressure system. Acta Oceanol. Sin. 2016, 35, 24–37. [Google Scholar]
  23. Jing, Z.; Chang, P.; Shan, X.; Wang, S.; Wu, L.; Kurian, J. Mesoscale SST Dynamics in the Kuroshio–Oyashio Extension Region. J. Phys. Oceanogr. 2019, 49, 1339–1352. [Google Scholar] [CrossRef]
  24. Wang, Y.; Liu, W.T. Observational Evidence of Frontal-Scale Atmospheric Responses to Kuroshio Extension Variability. J. Clim. 2015, 28, 9459–9472. [Google Scholar] [CrossRef]
  25. Taguchi, B.; Nakamura, H.; Nonaka, M.; Xie, S.-P. Influences of the Kuroshio/Oyashio Extensions on Air–Sea Heat Exchanges and Storm-Track Activity as Revealed in Regional Atmospheric Model Simulations for the 2003/04 Cold Season. J. Clim. 2009, 22, 6536–6560. [Google Scholar] [CrossRef] [Green Version]
  26. Ullman, D.S.; Hebert, D. Processing of Underway CTD Data. J. Atmos. Ocean. Technol. 2014, 31, 984–998. [Google Scholar] [CrossRef] [Green Version]
  27. Liu, Y.; Weisberg, R.H.; Lembke, C. Glider Salinity Correction for Unpumped CTD Sensors across a Sharp Thermocline; Academic: Boston, MA, USA, 2015. [Google Scholar]
  28. Shen, J. Application of CODAS system in ship-mounted ADCP data quality control in Xiamen Bay. J. Appl. Oceanogr. 2014, 33, 472–480. (In Chinese) [Google Scholar]
  29. Xiang, W.; Wei, G.; Ji, F. Research of data processing and quality control for vessel mounted ADCP. Mar. Sci. Bull. 2014, 6, 101–105. (In Chinese) [Google Scholar]
  30. Mohn, C.; Denda, A.; Christiansen, S.; Kaufmann, M.; Peine, F.; Springer, B.; Turnewitsch, R.; Christiansen, B. Ocean currents and acoustic backscatter data from shipboard ADCP measurements at three North Atlantic seamounts between 2004 and 2015. Data Br. 2018, 17, 237–245. [Google Scholar] [CrossRef]
  31. Wu, Y.; Wu, Z.; Li, Z. Shipborne ADCP Data Processing. Hydroaphic Surv. Charting 2014, 34, 36–39. (In Chinese) [Google Scholar]
  32. Yuan, X.; Talley, L.D. The subarctic frontal zone in the North Pacific: Characteristics of frontal structure from climatological data and synoptic surveys. J. Geophys. Res. Oceans 1996, 101, 16491–16508. [Google Scholar] [CrossRef]
  33. Huang, R.X.; Yu, L.-S.; Zhou, S.-Q. New definition of potential spicity by the least square method. J. Geophys. Res. Oceans 2018, 123, 7351–7365. [Google Scholar] [CrossRef] [Green Version]
  34. McDougall, T.J.; Giles, A.B. Migration of intrusions across isopycnals, with examples from the Tasman Sea. Deep Sea Res. Part A Oceanogr. Res. Pap. 1987, 34, 1851–1866. [Google Scholar] [CrossRef]
  35. Ruddick, B. A practical indicator of the stability of the water column to double-diffusive activity. Deep Sea Res. Part A Oceanogr. Res. Pap. 1983, 30, 1105–1107. [Google Scholar] [CrossRef]
  36. Talley, L.D.; Yun, J.-Y. The Role of Cabbeling and Double Diffusion in Setting the Density of the North Pacific Intermediate Water Salinity Minimum. J. Phys. Oceanogr. 2001, 31, 1538–1549. [Google Scholar] [CrossRef]
  37. Smith, K.S.; Ferrari, R. The Production and Dissipation of Compensated Thermohaline Variance by Mesoscale Stirring. J. Phys. Oceanogr. 2009, 39, 2477–2501. [Google Scholar] [CrossRef]
  38. Toole, J.M.; Georgi, D.T. On the dynamics and effects of double-diffusively driven intrusions. Prog. Oceanogr. 1981, 10, 123–145. [Google Scholar] [CrossRef]
  39. McDougall, T.J. Double-diffusive interleaving. Part I: Linear stability analysis. J. Phys. Oceanogr. 1985, 15, 1532–1541. [Google Scholar] [CrossRef] [Green Version]
  40. Rainville, L.; Pinkel, R. Observations of Energetic High-Wavenumber Internal Waves in the Kuroshio. J. Phys. Oceanogr. 2004, 34, 1495–1505. [Google Scholar] [CrossRef]
  41. Beal, L.M. Is Interleaving in the Agulhas Current Driven by Near-Inertial Velocity Perturbations? J. Phys. Oceanogr. 2007, 37, 932–945. [Google Scholar] [CrossRef]
Figure 1. (a,b) Daily and (c) mean Sea Surface Temperature (SST) gradients (shading in °C/km), Sea Level Anomaly (SLA) (contours in m), and geostrophic currents (vectors in m/s) in the Zone A during the section observation period. Intervals for contour lines are 0.05 m. Black dots are the corresponding observation stations labeled in black. Gray dots are the other stations.
Jmse 08 00502 g001
Figure 2. (ai) Daily SST gradients (shading in °C/km) and SLA (contours in m) east of Japan are shown every seven days from the end of April to the end of June in 2019. Intervals for contour lines are 0.1 m. Black boxes indicate the observation area. Some eddies are labeled as follows: anticyclone eddies (A) in white and cyclone eddies (C) in black; if two eddies merged, we named them “Ax-xx” or “Cx-xx”. (j) Mean SST (shading in °C) and ADT (contours in m) east of Japan during the observation period. Intervals for contour lines are 0.05 m. Black box is the observation area named Zone A. Black dots are the observation stations.
Jmse 08 00502 g002
Figure 3. (a,e,i,m) Potential temperature (shading in °C), (b,f,j,n) salinity (shading in psu), (c,g,k,o) zonal velocity (shading in m/s) and (d,h,l,p) meridional velocity (shading in m/s) of the four sections. Black contours indicate the potential density (kg/m3) with 0.25 kg/m3 intervals. White contours indicate zero velocity.
Jmse 08 00502 g003
Figure 4. (a) Potential temperature–salinity (θ-S) diagram of the four sections. The A1/A2/A3/A4 sections’ results are shifted along the x axis: Δx = −1.5/−0.75/0/0.75. The gray curves indicate the representative profiles of the A1–A4 sections obtained at 38.84° N, 38.83° N, 38.76° N and 38.60° N, respectively, to show the thermohaline intrusions. Potential density (black contours in kg/m3) and potential spicity (blue contours in kg/m3) in θ-S space are also shown. (b) Potential density-potential spicity (σ-π) diagram of the four sections. The A1/A2/A3/A4 sections’ results are shifted along the y axis: Δσ = −1.5/−0.75/0/0.75. The gray curves are the same representative profiles as that of (a).
Jmse 08 00502 g004
Figure 5. (ad) Salinity anomaly (shading in psu) and (eh) diapycnal spiciness curvature (shading in m3/kg) of the four sections.
Jmse 08 00502 g005
Figure 6. (ad) Turner angle (Tu) (shading in °) of the four sections. Contours indicate the potential density (kg/m3) with 0.25 kg/m3 intervals.
Jmse 08 00502 g006
Figure 7. (ad) Vertical shear of zonal velocity (shading in ×10−2/s) and (eh) vertical shear of meridional velocity (shading in ×10−2/s) of the four sections. Contours indicate the potential density (kg/m3) with 0.25 kg/m3 intervals.
Jmse 08 00502 g007
Table 1. Details of Section A1–A4, the number of stations means the number of Moving Vessel Profiler (MVP) stations set for each section.
SectionLocationTimeHeading DirectionNumber of Stations
A1151.74°–151.53° E,
38.11°–39.19° N
28 May 2019Southeast to Northwest21
A2151.06°–151.32° E,
39.17°–38.14° N
28 May 2019Northwest to Southeast21
A3151.17°–150.61° E,
38.12°–39.46° N
29 May 2019Southeast to Northwest27
A4149.73°–150.50° E,
39.26°–38.13° N
29 May 2019–
30 May 2019
Northwest to Southeast28