Article

A Simplified Method for an Evaluation of the Effect of Submerged Breakwaters on Wave Damping: The Case Study of Calabaia Beach

Department of Environmental Engineering, Capo Tirone Experimental Marine Station, University of Calabria, 87036 Rende (CS), Italy
*
Author to whom correspondence should be addressed.
J. Mar. Sci. Eng. 2020, 8(7), 510; https://doi.org/10.3390/jmse8070510
Submission received: 4 June 2020 / Revised: 29 June 2020 / Accepted: 8 July 2020 / Published: 12 July 2020
(This article belongs to the Special Issue Wave Interactions with Coastal Structures)

Abstract

:
Erosion processes threaten the economy, the environment and the ecosystem of coastal areas. In addition, human action can significantly affect the characteristics of the soil and the landscape of the shoreline. In this context, pursuing environmental sustainability is of paramount importance in solving environmental degradation of coastal areas worldwide, with particular reference to the design of complex engineering structures. Among all the measures conceived to protect the shoreline, environmentally friendly interventions should be supported by the stakeholders and tested by means of mathematical models, in order to evaluate their effectiveness in coastal protection through the evaluation of wave damping and bedload. This study focuses on protected nourishments, as strategic interventions aimed to counteract coastal erosion without affecting the environment. Here, we develop a simplified method to provide a preliminary assessment of the efficiency of submerged breakwaters in reducing wave energy at a relatively low computational cost, if compared to the standard 2D or full 3D mathematical models. The methodology is applied at Calabaia Beach, located in the southern Tyrrhenian Sea (Italy), in the area of the Marine Experimental Station of Capo Tirone. The results show that the simplified method is proven to be an essential tool in assisting researchers and institutions to address the effects of submerged breakwaters on nourishment protection.

1. Introduction

The erosion process threatens urban settlements, the environment and the ecosystem located in the Mediterranean Sea [1,2]. Coastal areas involve strong relationships between the needs of human communities and the environment [3]. The increasing demand of coastal use should aim to conserve the resilience of the environment, allowing the ecosystem to absorb the unavoidable human impacts, keep functioning, and provide goods and services to the population [4,5,6]. However, coastal areas regularly deal with complex environmental and ecosystem challenges, which are worsened by mean sea level rises driven by climate change, subjecting these fragile lands to large economic and environmental losses and damage produced by flooding and erosion processes [7,8,9,10,11,12,13,14]. Increasing urban pressure will further exacerbate these damages, requiring an integrated approach to conserve the land and the environment [15,16], evolving from sea defence interventions only aimed at protecting human and goods, to coastal protection measures focused on the overall needs of the land [17].
The effectiveness of sea defence interventions depends on the designer’s ability to identify the correct strategy to pursue in the area of concern, and to assess their short-term and long-term impacts, which can produce further alterations and new and more complex issues in the coastal environment, ecosystem and landscape [18,19].
A correct evaluation of the causes of the coastal erosion requires a deep knowledge of the land, which should be achieved through a morphometric and granulometric characterization of the soil and specific climate analysis [20]. Although the most important coastal erosion events occur during the major storms, the ordinary action of the waves and anthropic activities can significantly affect the shoreline [21]. Human actions trigger the erosion process, mostly due to an incorrect understanding of long-term effects of their actions on the shoreline, with particular reference to the impact of coastal buildings on the environment.
The main natural causes of the net retreat of the coastline are: sea level rise; the effect of climate change on the reduction in the sediment supply from water courses; the negative balance of offshore sediment transport due to storm waves and surge overwash; wind erosion; longshore sediment transport; loss of fine material moved from the shoreline in a seaward direction [21,22,23].
The main anthropogenic causes of the net retreat of the coastline are: land subsidence from the suppression of the subsurface resources; interruption of the sediment transport due to buildings and sea defence structures located in the active beach; river works reducing the sediment input from the water courses; changes of the natural configuration of the beach profile; removal or displacement of the material from the active beach [21,22,23].
A global analysis of these phenomena allows us to provide a realistic assessment of the erosion process and the identification of the most effective sea defence measures [21]. The modeling of these phenomena shows multiple constraints, including a paucity of meteorological and oceanographic gauged data and large computational times. In addition, there is an increasing need to restore the environment avoiding the use of sea defences that, while effective against the erosion process, threaten the ecosystem and the landscape, affecting tourism, fisheries and the overall economy of coastal communities [24,25,26]. Natural-based and environmentally friendly measures, such as the use of mangroves and Posidonia oceanica meadows [27,28,29], are increasingly supported by the scientific community, due to their positive impact on the land.
The effectiveness of sea defences is often constrained by the local characteristics of the land. In this context, artificial nourishments can support the restoration of the shoreline without affecting the environment and the use of the sea. However, beach nourishments are threatened by erosion and the degradation of the environment. Here, we describe the protection of beach nourishments through submerged breakwaters, and herein we refer to this intervention as “protected nourishment”.
Despite the fact that several mathematical models can properly evaluate the long-term effectiveness of sea defence structures, they are often constrained to three-dimensional schemes for simulating processes related to benthic suspensions, flocculation, entrainment, erosion, sedimentation and bed consolidation. Moreover, two (2D) and three-dimensional (3D) coastal modeling usually requires a significant computational cost, limiting most of the analysis to the use of one-dimensional systems or statistic models [30,31,32,33,34].
In this work, we first address the characteristics of protected nourishments on wave damping [35,36] by means of Mike 21/3 Coupled Model FM 2020, an integrated 2D model (hereinafter denoted as MIKE), which computes wave climate, hydrodynamic processes, and bedload (Section 2). We then develop a simplified methodology to assess the effectiveness of the submerged breakwaters on wave damping, reducing the computational cost (Section 3). This approach has been applied at Calabaia Beach (Belvedere Marittimo municipality, Italy, Section 4) to evaluate the long-term shoreline evolution. Our conclusions bring the paper to a close.

2. Materials and Methods

The design of submerged breakwaters as a support for protected nourishments first requires the evaluation of the effect of the barrier on the reduction in the wave height from offshore to the shore by means of the wave transmission coefficient Kt [37].
K t = H o u t H i n       with   0 <   Kt   < 1
where H o u t and H i n stand for the wave height upstream and downstream of the barrier, respectively [38]. Although this simplified approach does not describe the variability of the wave climate and the possible effect of the anthropic structures, it is consistent with the aim of this study.

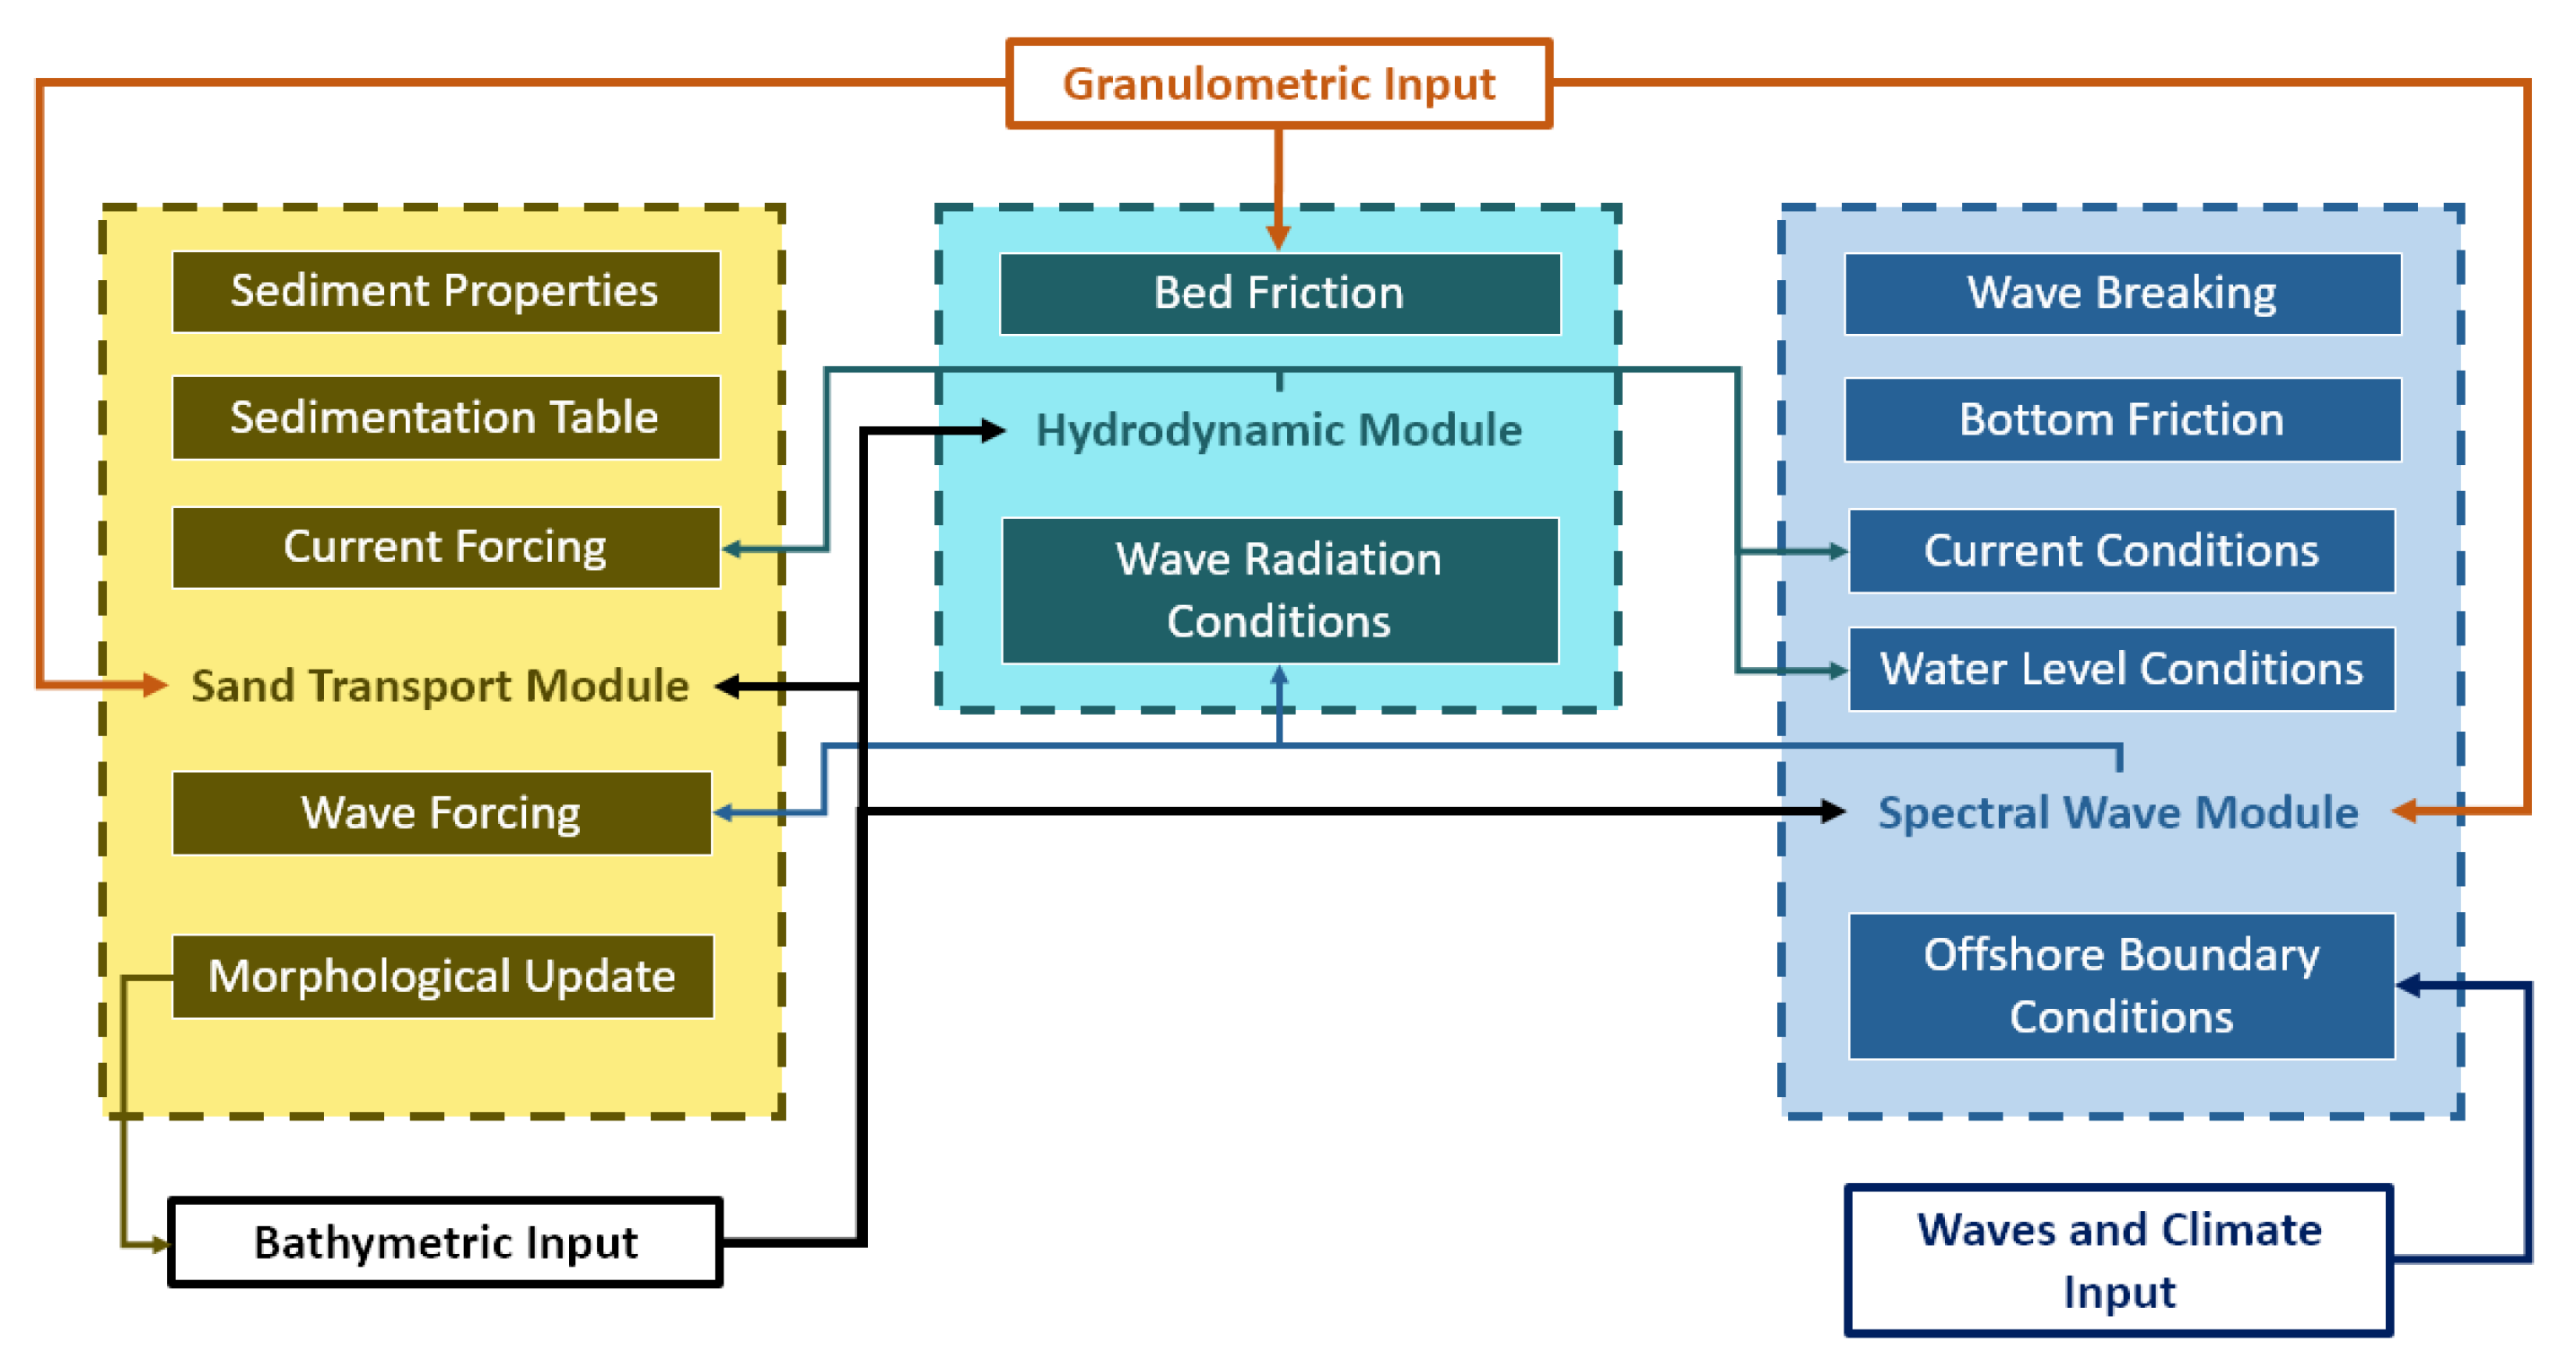
2.1. The Mathematical Model

In recent decades, several models have been developed to compute the morphodynamic evolution of coastal environments, characterized by several computational schemes, scales, levels of detail and computational costs [39,40,41,42,43,44]. The spatial scale of these models ranges from meters to kilometres. The temporal scale typically ranges from hours to decades. Most of the existing large-scale models are limited to an assessment of the evolution of the shoreline, while the smaller space and time scale models are mainly used to reproduce specific forcing events, involving explicitly reductionist methodologies where the conservation of momentum forms the explicit means for the evolution of the system. [45,46,47].
Here, we use MIKE 21-3 Coupled Model FM, based on an unstructured grid which consists of an integrated system capable of reproducing the coastal processes and dynamics of the shoreline at all scales. MIKE evaluates the effectiveness of the sea defence interventions, such as the optimisation of the beach nourishments and costal protection structures, and the impact of the buildings located in the active beach.
The Hydrodynamic (HD) module of MIKE solves the 2D Navier–Stokes equations of incompressible fluids, under the hypothesis of hydrostatic pressure [48]. The numerical solution of shallow water equations is achieved through the approximate Riemann solver [49], which calculates the convective flows at the interface of the element of the grid. Second-order precision is achieved through the use of a linear gradient reconstruction technique. The average gradient is computed by means of the Jawahar and Kamath [50] approach.
The Spectral Wave (SW) module describes the wave phenomena by means of the wave action conservation equations [39,40], which can be written by using the Cartesian system as:
N t + · ( v N ) = S σ
where N (θ, σ) is the density of the wave, which is function of θ, wave direction and wave frequency σ. S is the source term accounting for different processes:
S = S i n + S n 1 + S d s + S b o t + S s u r f
where
  • Sin is the wind action;
  • Snl is the waves non-linear interaction;
  • Sds is the white capping effect;
  • Sbot is the bottom dissipative action;
  • Ssurf is the dissipation due to wave breaking phenomena.
Among all these parameters, Ssurf is essential in representing the wave breaking, which occurs when the waves propagate in shallow water and can no longer be supported by the depth. This process is described following the formulation of Battjes and Janssen [51].
If the shoreline is characterized by shallow waters surrounding the shoreline, the maximum wave height can be calculated as:
H m a x = γ d
where d is the water depth and γ a coefficient which ranges between 0.5 and one, depending on the slope of the bottom and the wave characteristics [52].
The formulation of γ can be chosen according to Nelson’s formulations [53,54], or by means of the more recent Ruessink approach [55], valid both for steep seabeds without bars and flat bottoms. The Ruessink approach calculates γ at each cell of the domain as:
γ = 0.76 k d + 0.29
where k is the local wave number and d the local depth.
The bedload is solved by means of the Sand TransPort Quasi-3-Dimensional module (STPQ3D) [56], which computes the transport of the sediments along two horizontal directions by processing the input data provided by the hydrodynamic model by time-averaging the results.
Waves affect the motion of sediments in shallow waters due to wave breaking, with particular reference to the transport of sediments transversal to the coast, which is mostly involved in the erosion process [57,58]. Morphological changes due to erosion and deposition are accounted in terms of bed elevation, expressed with respect to the centre of each triangular element of the grid as δ z δ t . This parameter can be computed by means of the continuity equation of the sediment proposed by Exner [59], where n is the porosity:
z n e w = z o l d + 1 1 n   δ z δ t   t   H D
The bedload is computed as the divergence of the sediment flow with respect to the boundary of the elements and it is equal to the sum of all the flows that cross the boundaries, identifying whether the element is receiving or losing sediment.
δ S x δ x + δ S y δ y = i = 1 m S i n d s i
where
  • S i n is the sediment flux normalized to the face of the element;
  • d s i is the lenght of the face of the element;
  • m is the index of the element;
The continuity equation of sediments affects the bed elevation of each element, based on the total sediment flux crossing the boundaries of each element.
The coupling of the models is based on the establishment of an overall time step of the system, which is necessary to match the instant in which the models exchange the information. Each model has its own time step, which is a multiple of the overall time step. The exchange of information occurs when the time of each model match with an overall time step (e.g., the HD module acquires a radiation stress field from the SW module).
Since the information sharing between each module of MIKE is very complex, we refer to the manuals for a more detailed description [48,56,60]. A summary of the main steps is provided in Figure 1.

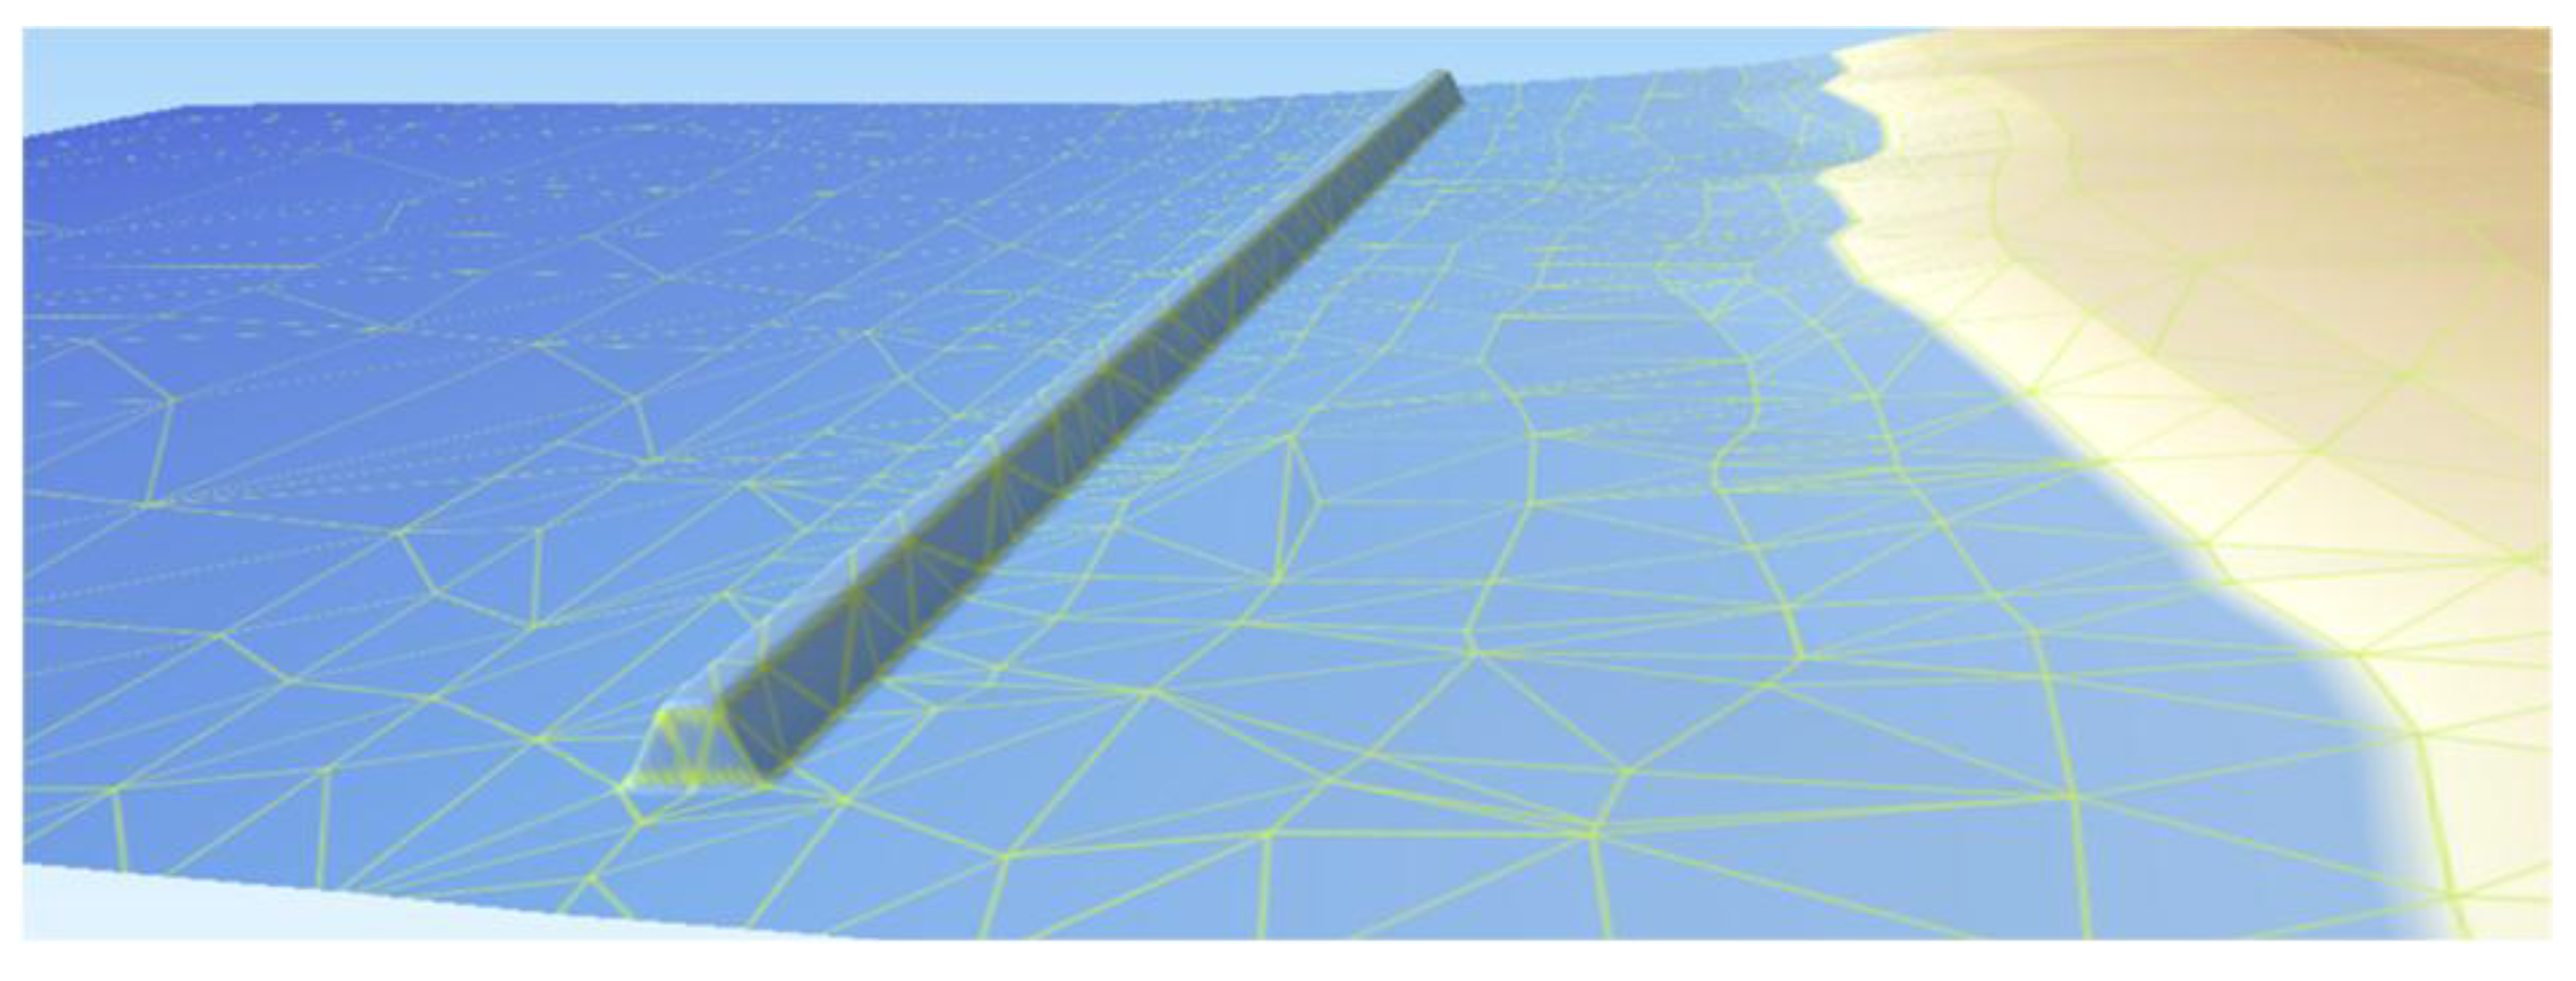
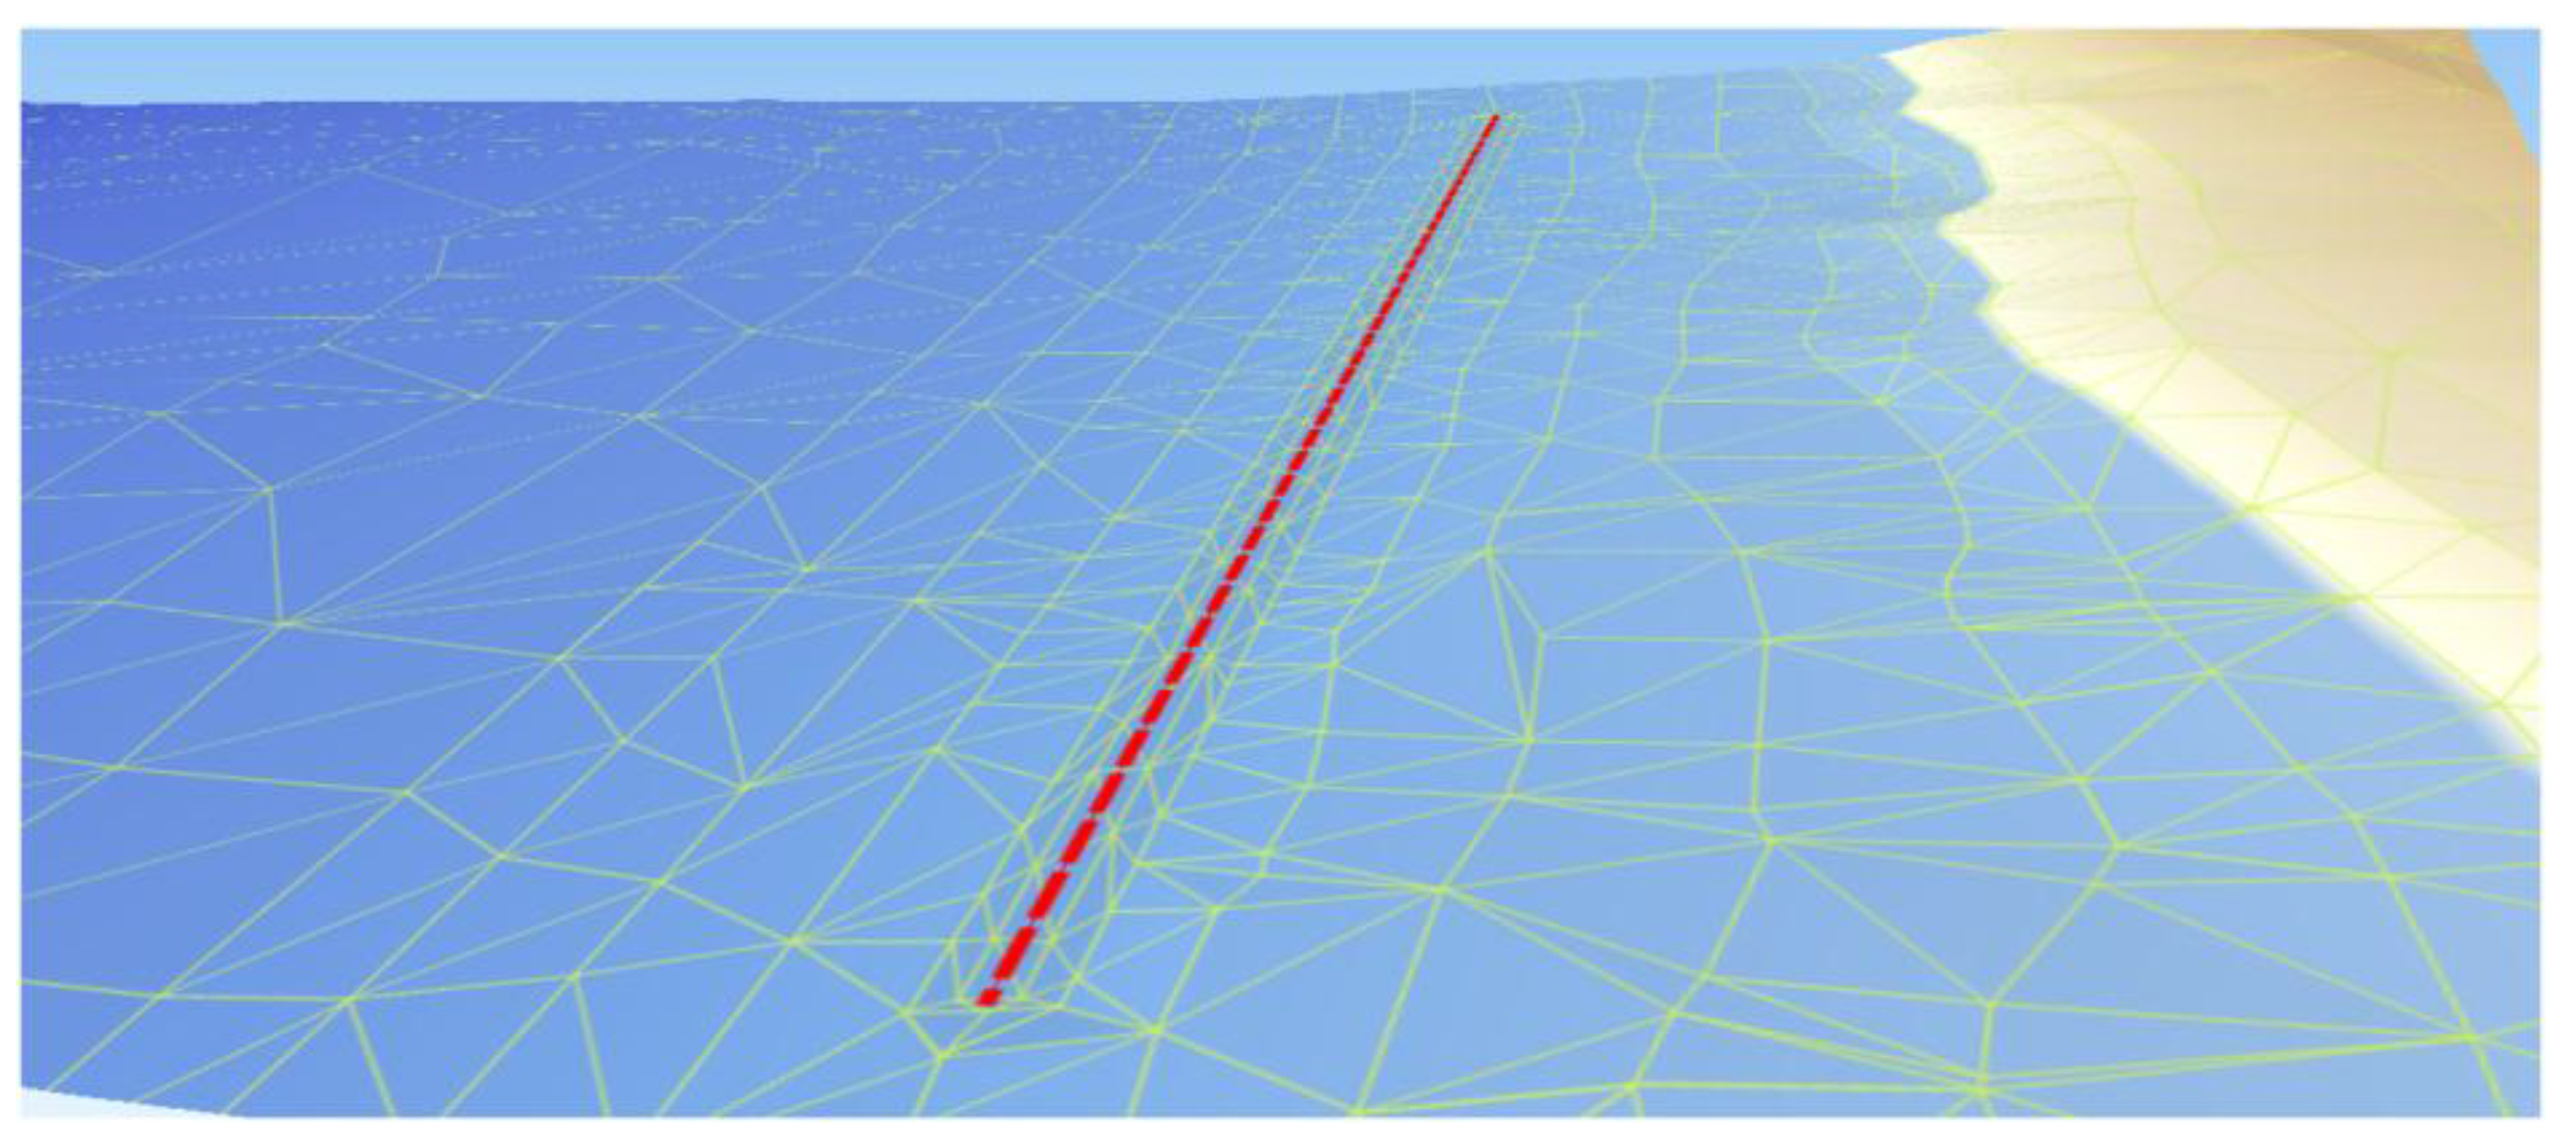
2.2. Submerged Breakwaters

The effects of submerged breakwaters on wave damping is typically evaluated through the formulation of Goda [61,62], which computes the transmission coefficient K t (1) as:
K t = K t ,   m a x   if   f H i < ( f H i ) m i n   with   K t ,   m a x   < 1
K t = 1 2 ( 1 s i n ( π 2 · f H i + β α ) ) i f   ( f H i ) m i n < f H i < ( f H i ) m a x
K t = K t ,   m i n   if   f H i < ( f H i ) m a x   with   K t ,   m i n > 0
The values of K t ,   m a x and K t ,   m i n are set according to the boundary conditions; the parameter f (i.e., the free board) represents the height of the breakwater crest minus the surface level; H i the value of the incoming wave height, i.e., the input wave height. If the breakwater is submerged, the wave damping effect is negligible when the wave height is equal to or smaller than the depth of the crest, computed with respect to the mean sea level. For parameter α , Goda proposed a value equal to 2.2, while for parameter β , which depends on the inclination of the breakwater, a value ranging between 0.15 and 0.8 [61,62]. Goda’s formula allows to evaluate the performance of the breakwater at different water levels, and it is not affected by the angle of attack of the waves with respect to the breakwater.
2D and 3D modeling of long and narrow structures such as the submerged barriers significantly increases the computational effort to avoid model instability. In this study, we propose a simplified method based on the implementation of Goda’s formula directly on the domain, avoiding the 2D modeling of the barrier but keeping the high accuracy of the results. Similar approaches are widely implemented into mathematical models available in the literature by developing a set of specific links to reproduce the presence of long and narrow structures, such as sills and levees [63,64,65,66].
Here, we link the nodes of the elements located upstream and downstream of the submerged barrier by implementing Goda’s formula. We calibrated parameter β of Goda’s formula, by comparing the results computed by means of the full 2D model, using different depths of its ridge (z) and different wave climates (Hm0).
In the simulations performed by means of the full 2D model, we reproduced the rigid submerged breakwater by means of 2D elements (Figure 2). The hydrodynamic of the barrier is solved by the HD and SW modules, without any change in bottom elevation, by disabling the use of the sedimentological model.
The simplified approach we develop allows us to evaluate the effect of the submerged breakwater by reproducing the structure by linking the elements of the grid located before and after the barrier, which works as a weir on whose edges we apply Goda’s equation (Figure 3).
The comparison between the simulations performed by means of full 2D modeling and the simplified scheme allows us to identify the optimum value of β of Goda’s formula that better reproduces the effects of the breakwaters on the wave damping. The results of the simplified methodology will be synthetized in two different formulations, which aim to relate the wave damping only to the ridge depth of the barrier and to the wave climate, without performing any simulation by means of the models.

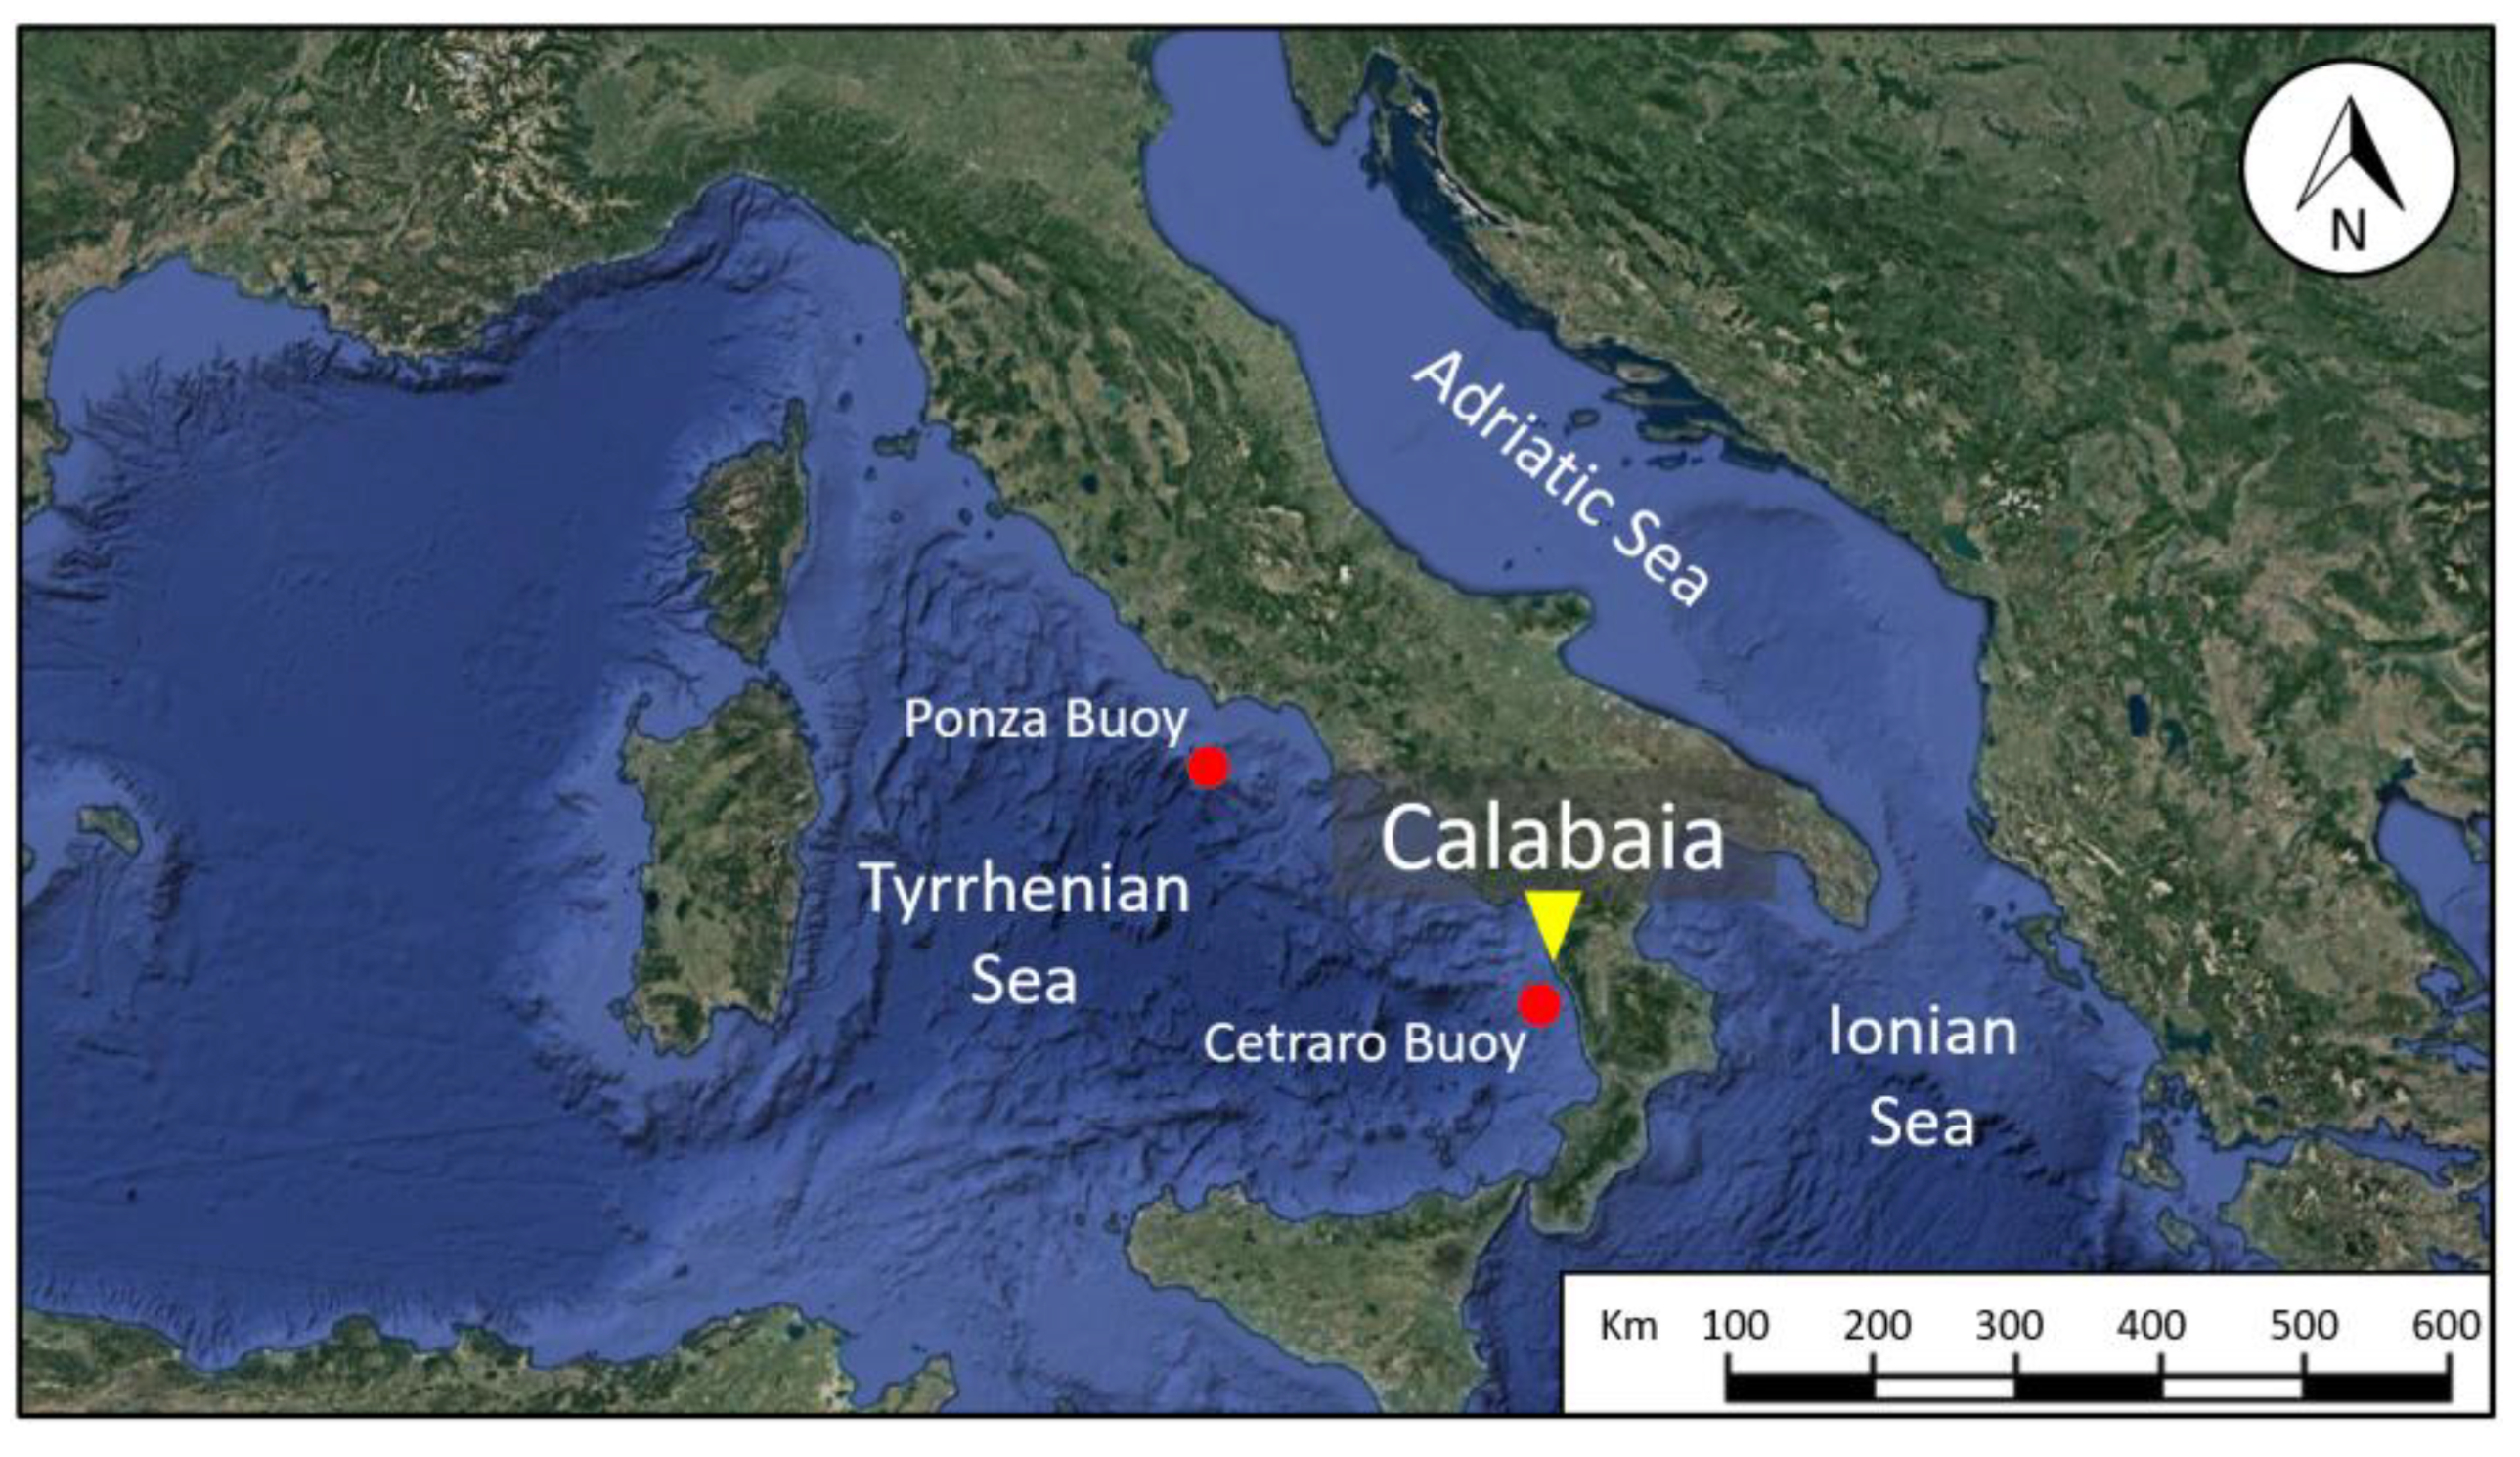
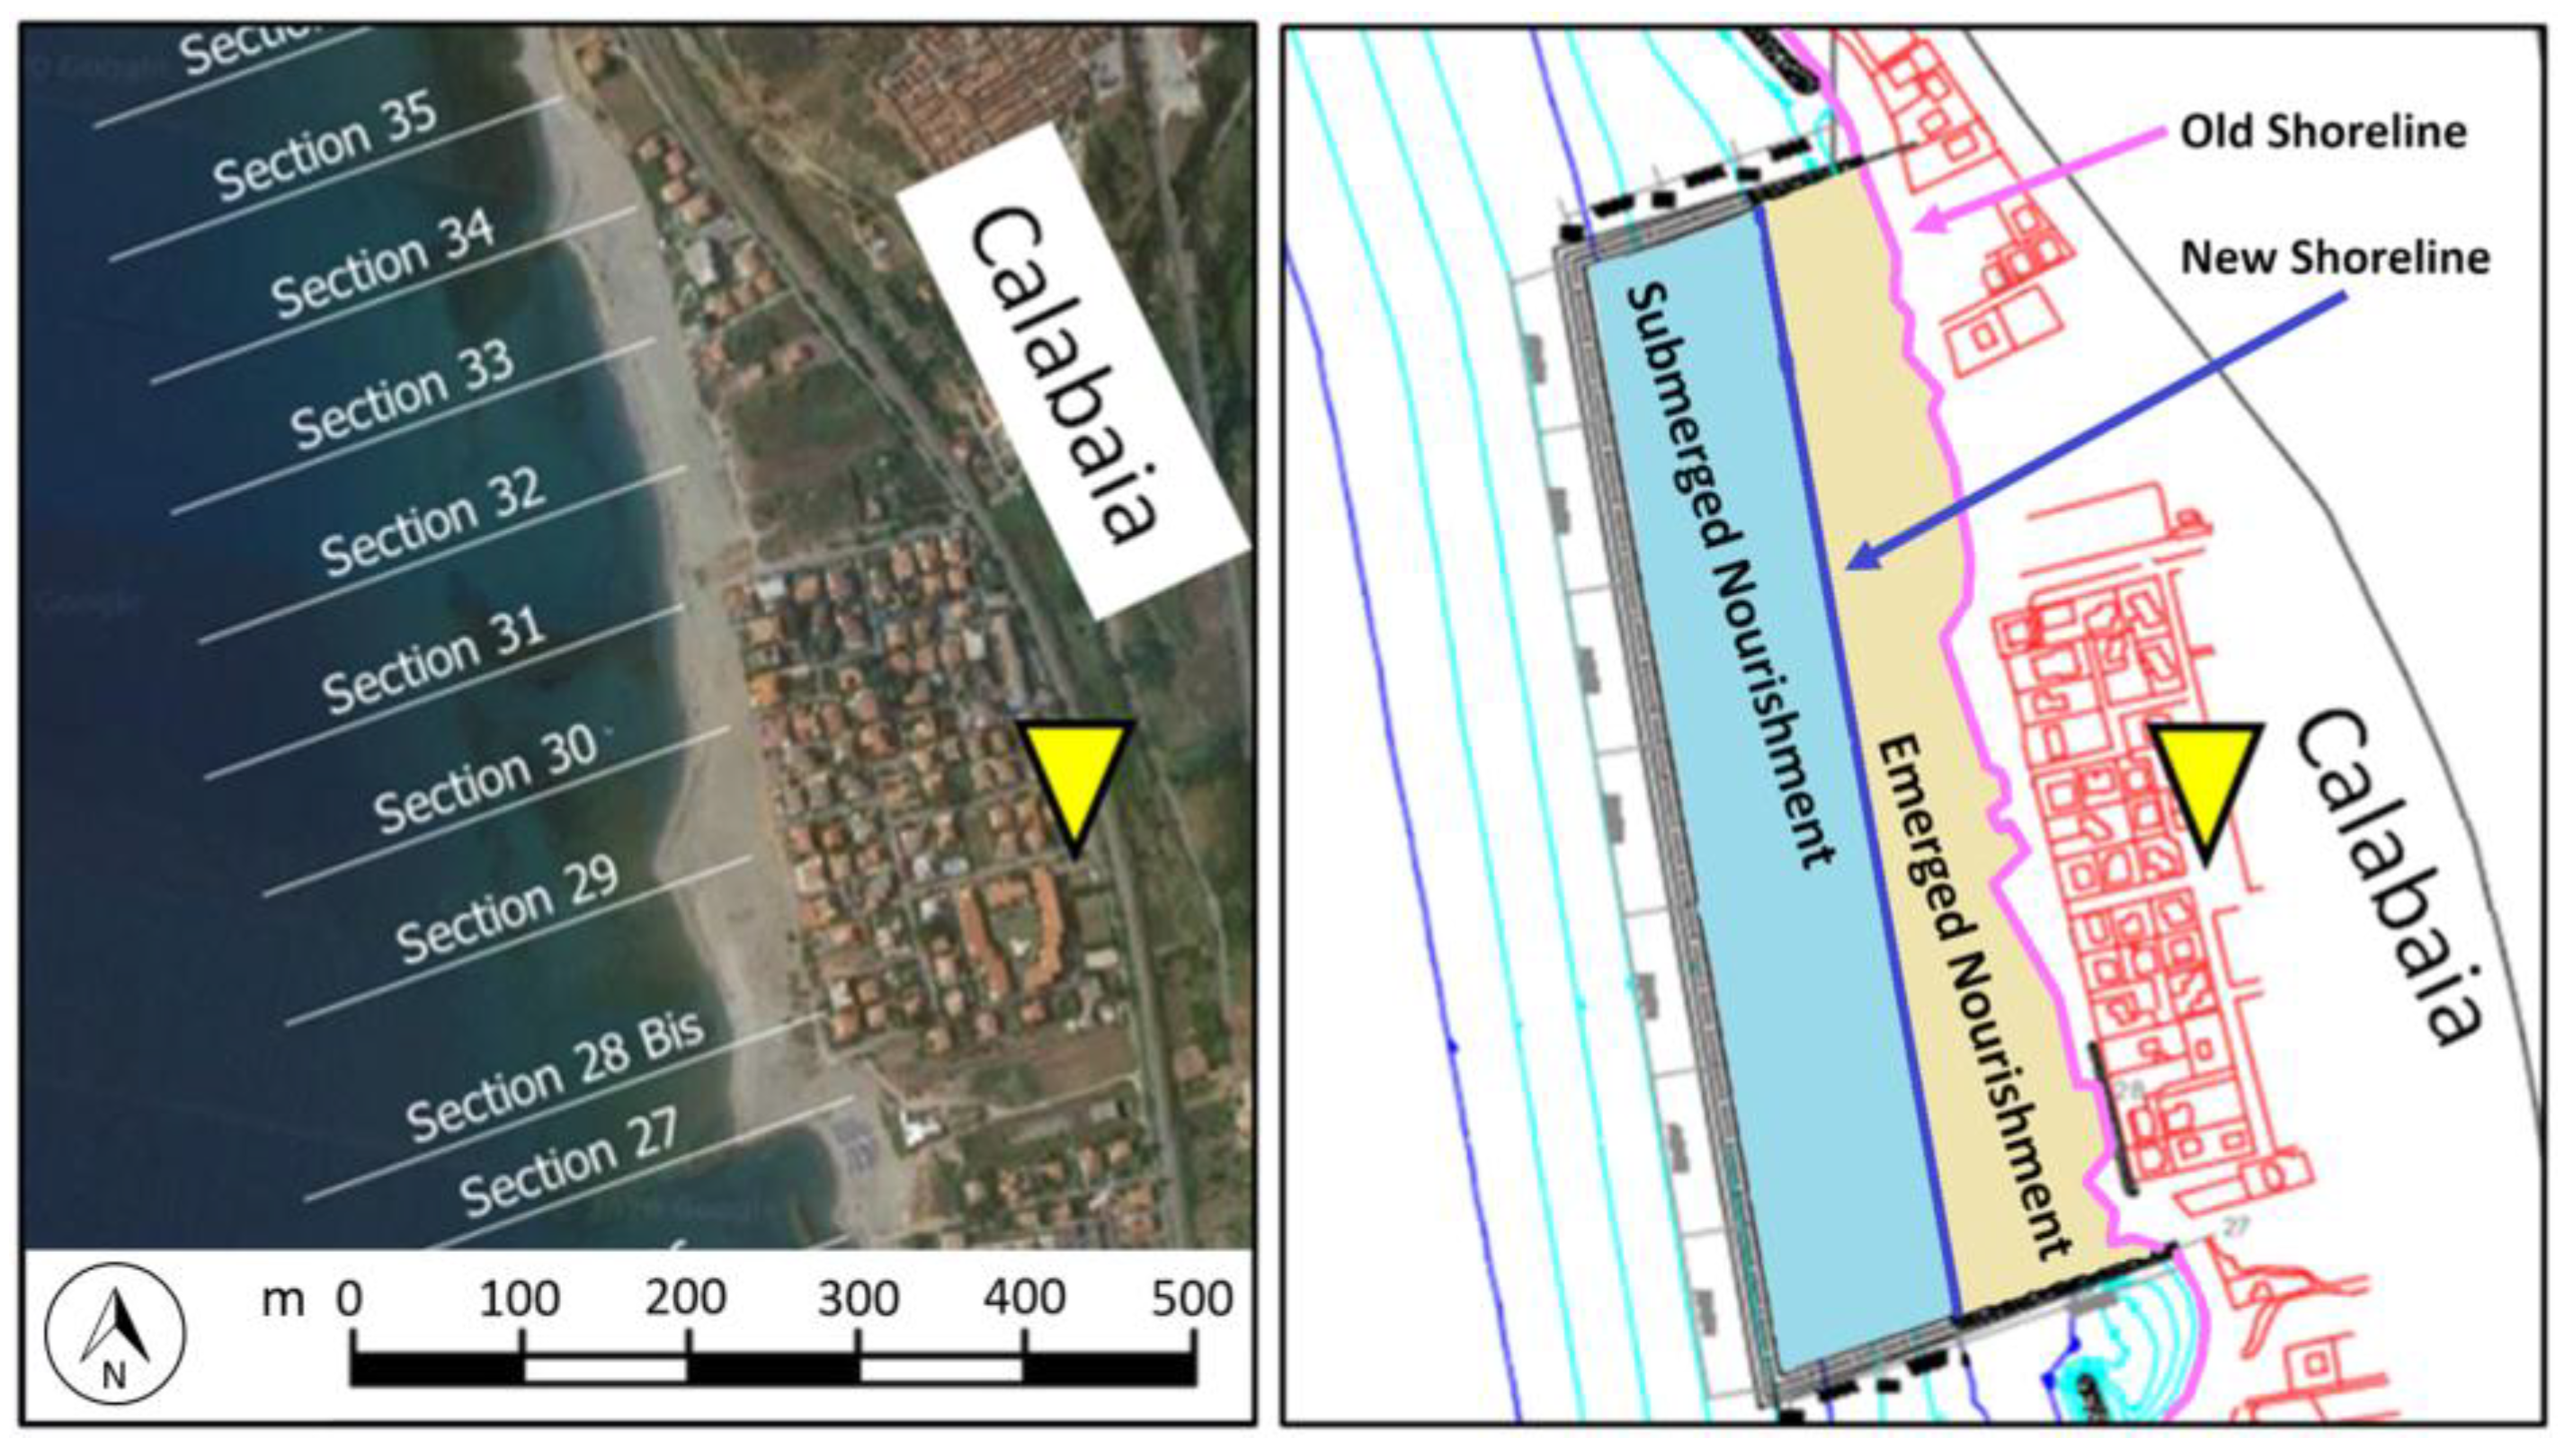
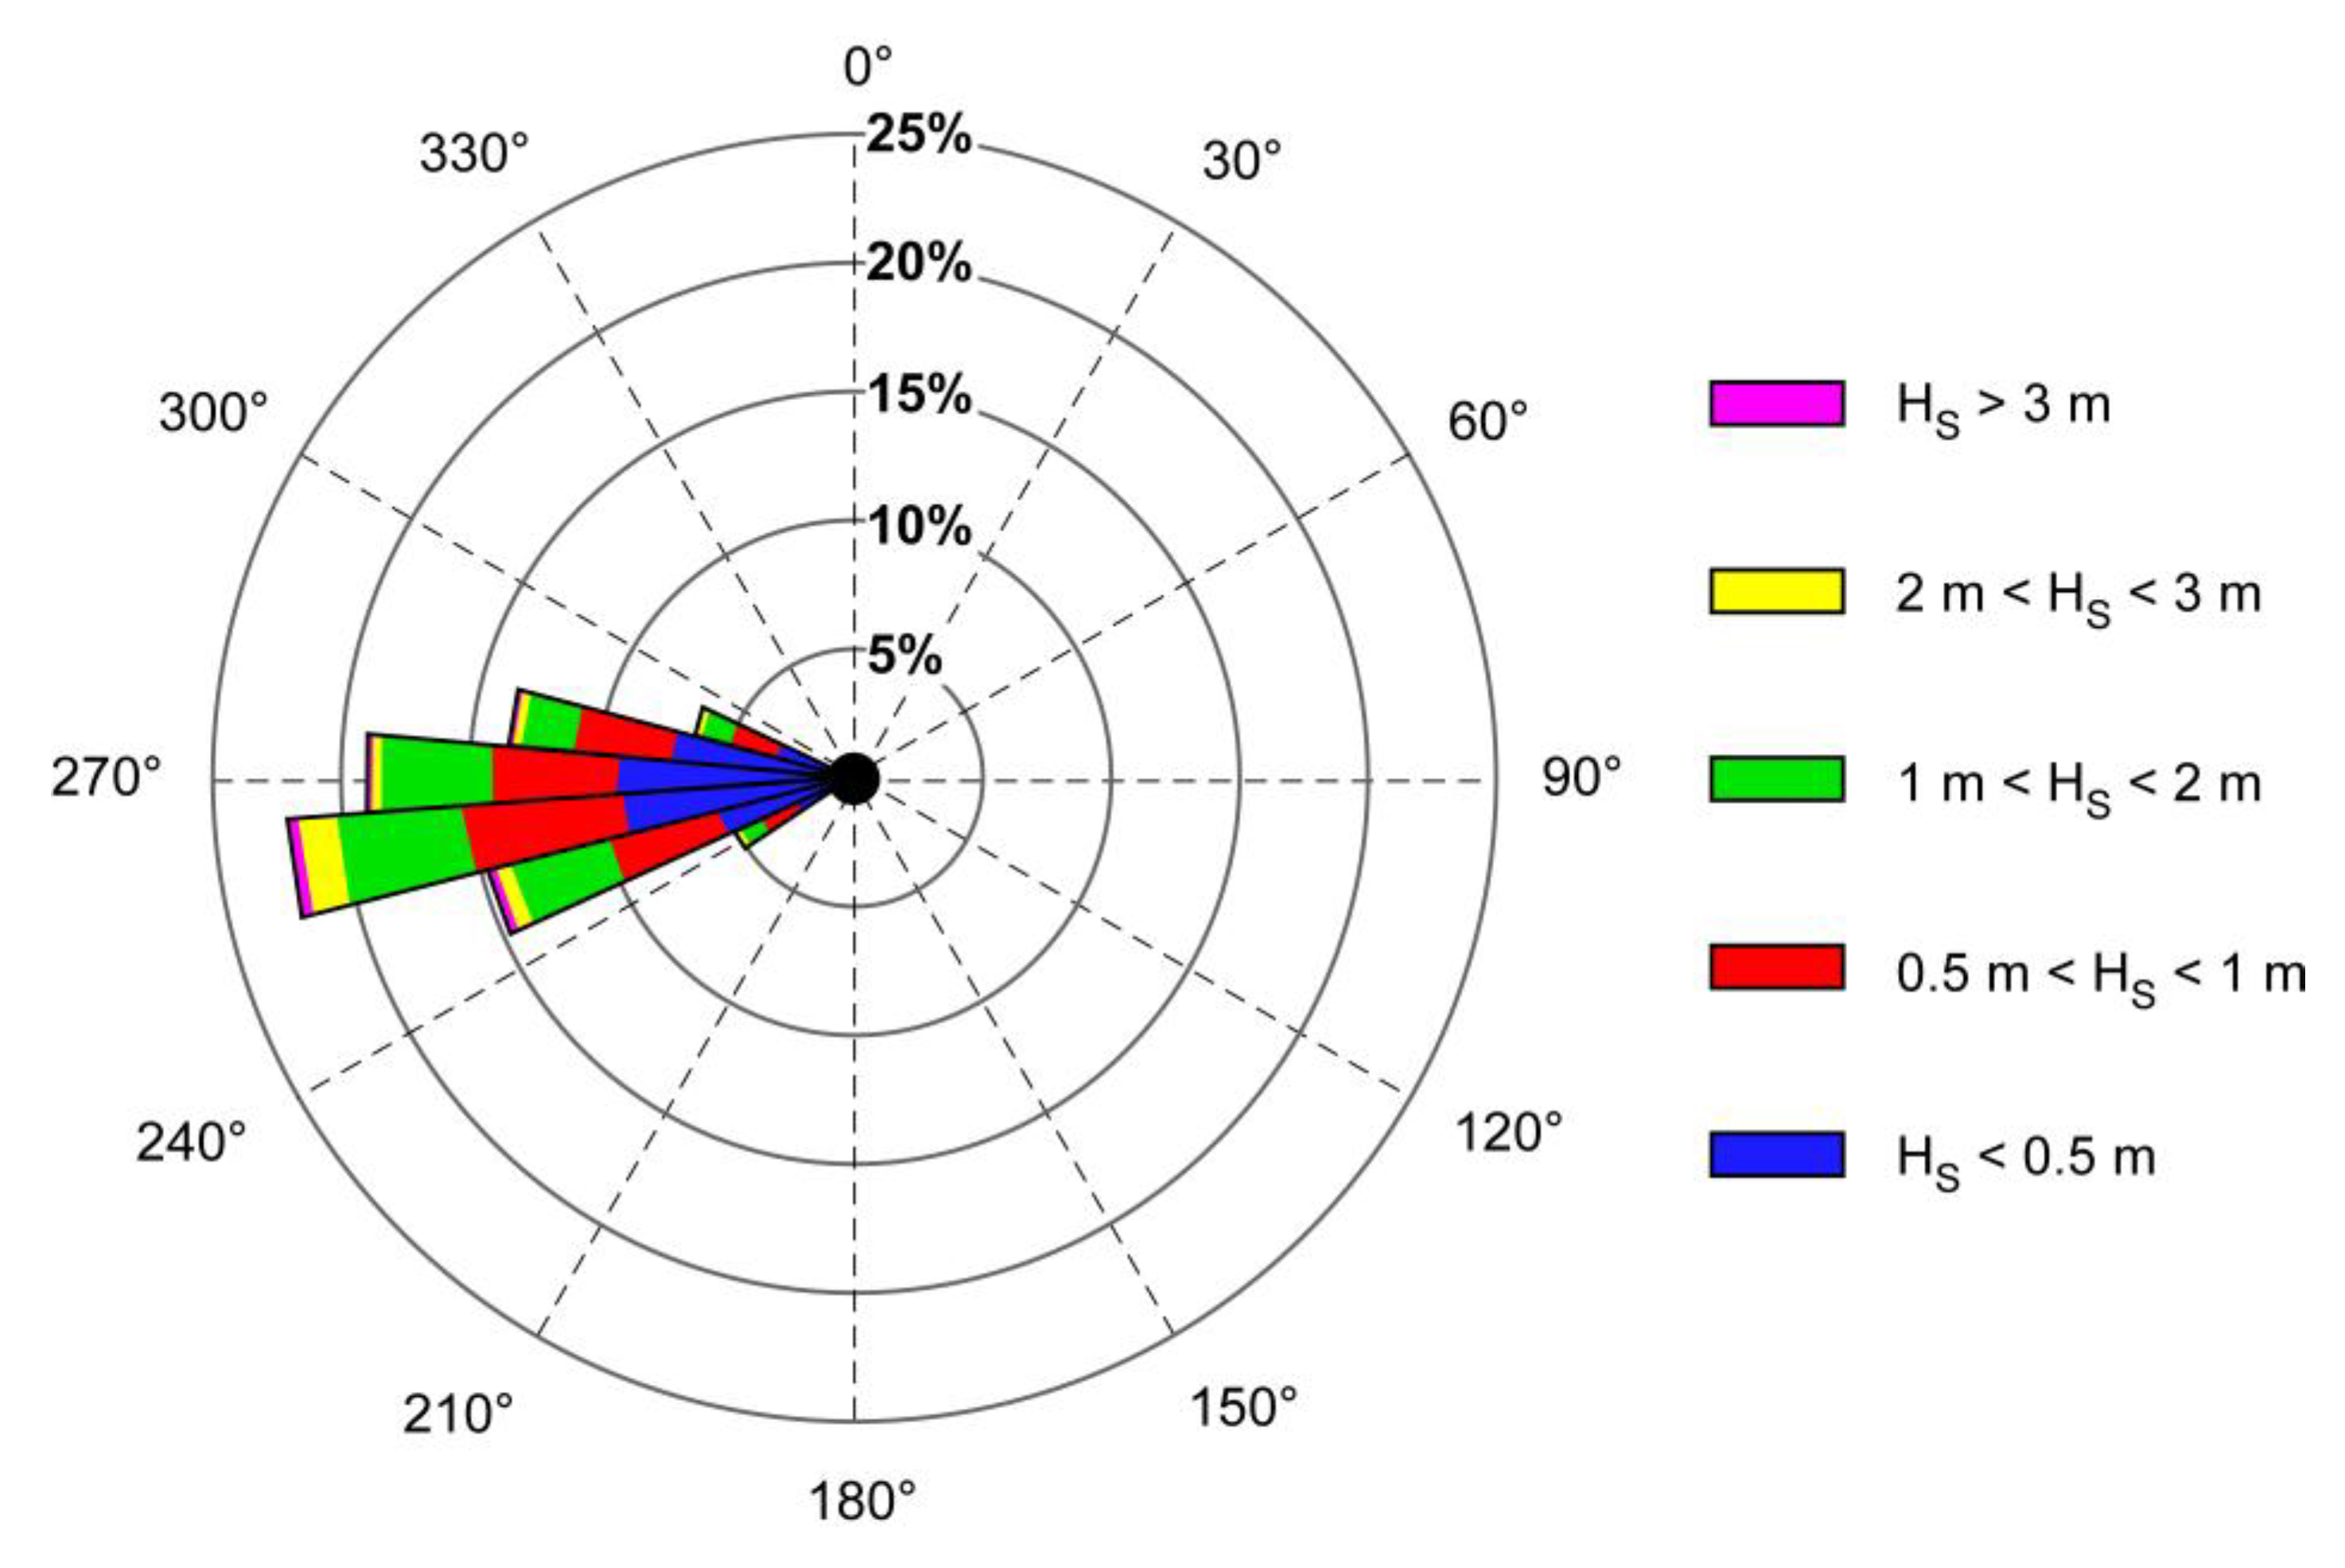
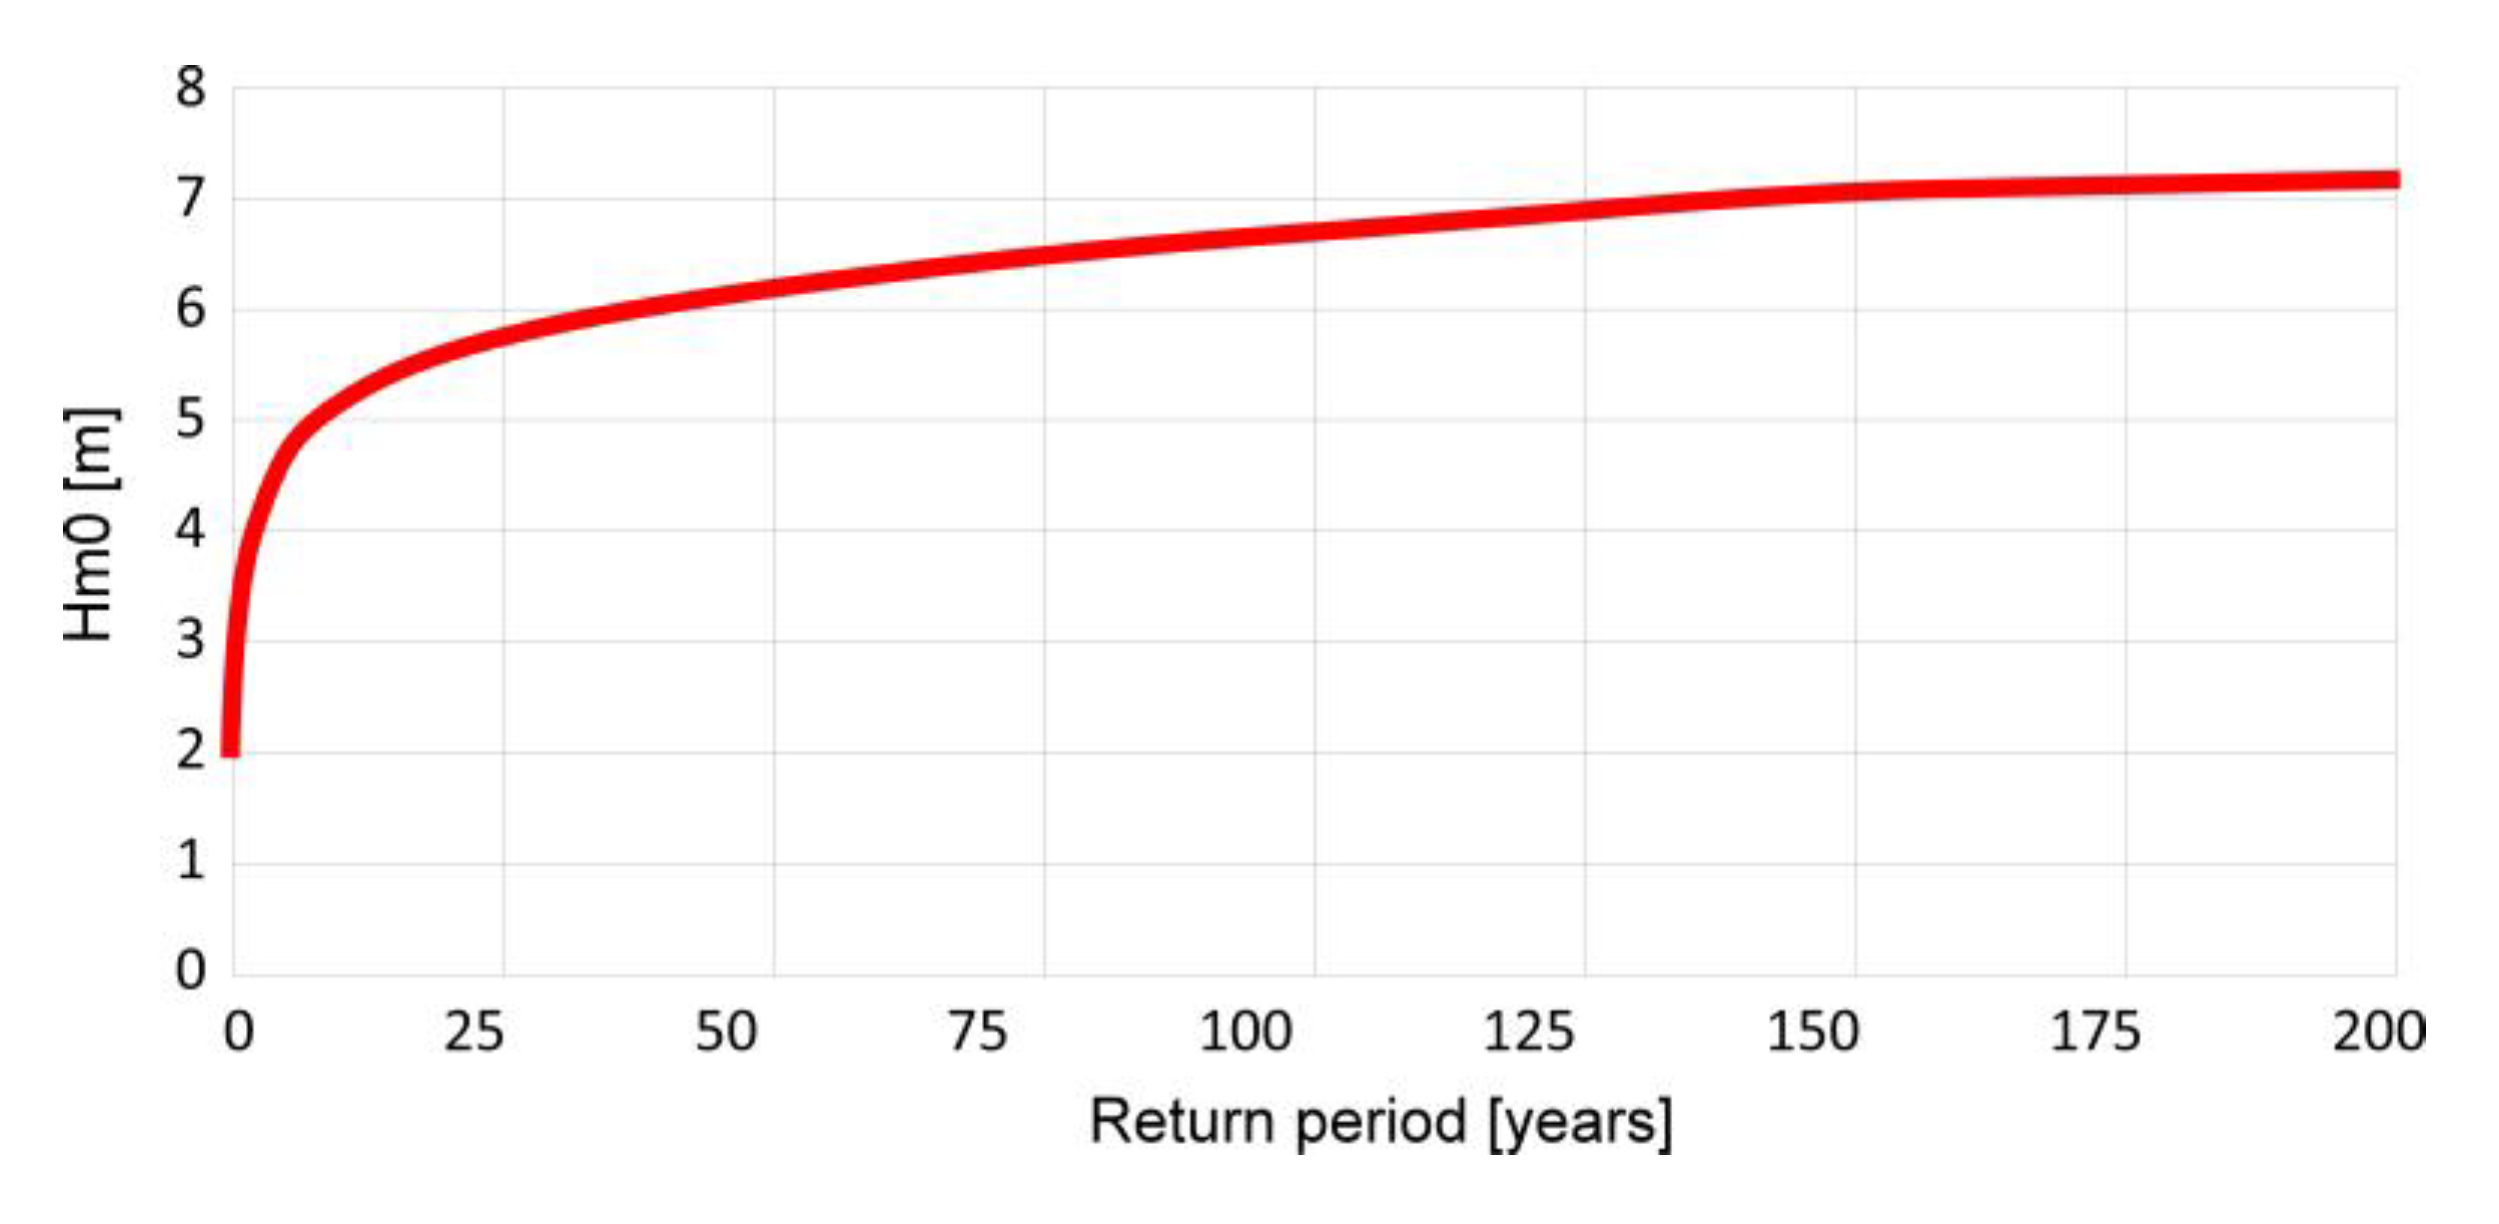
2.3. The Study Area: Calabaia Beach
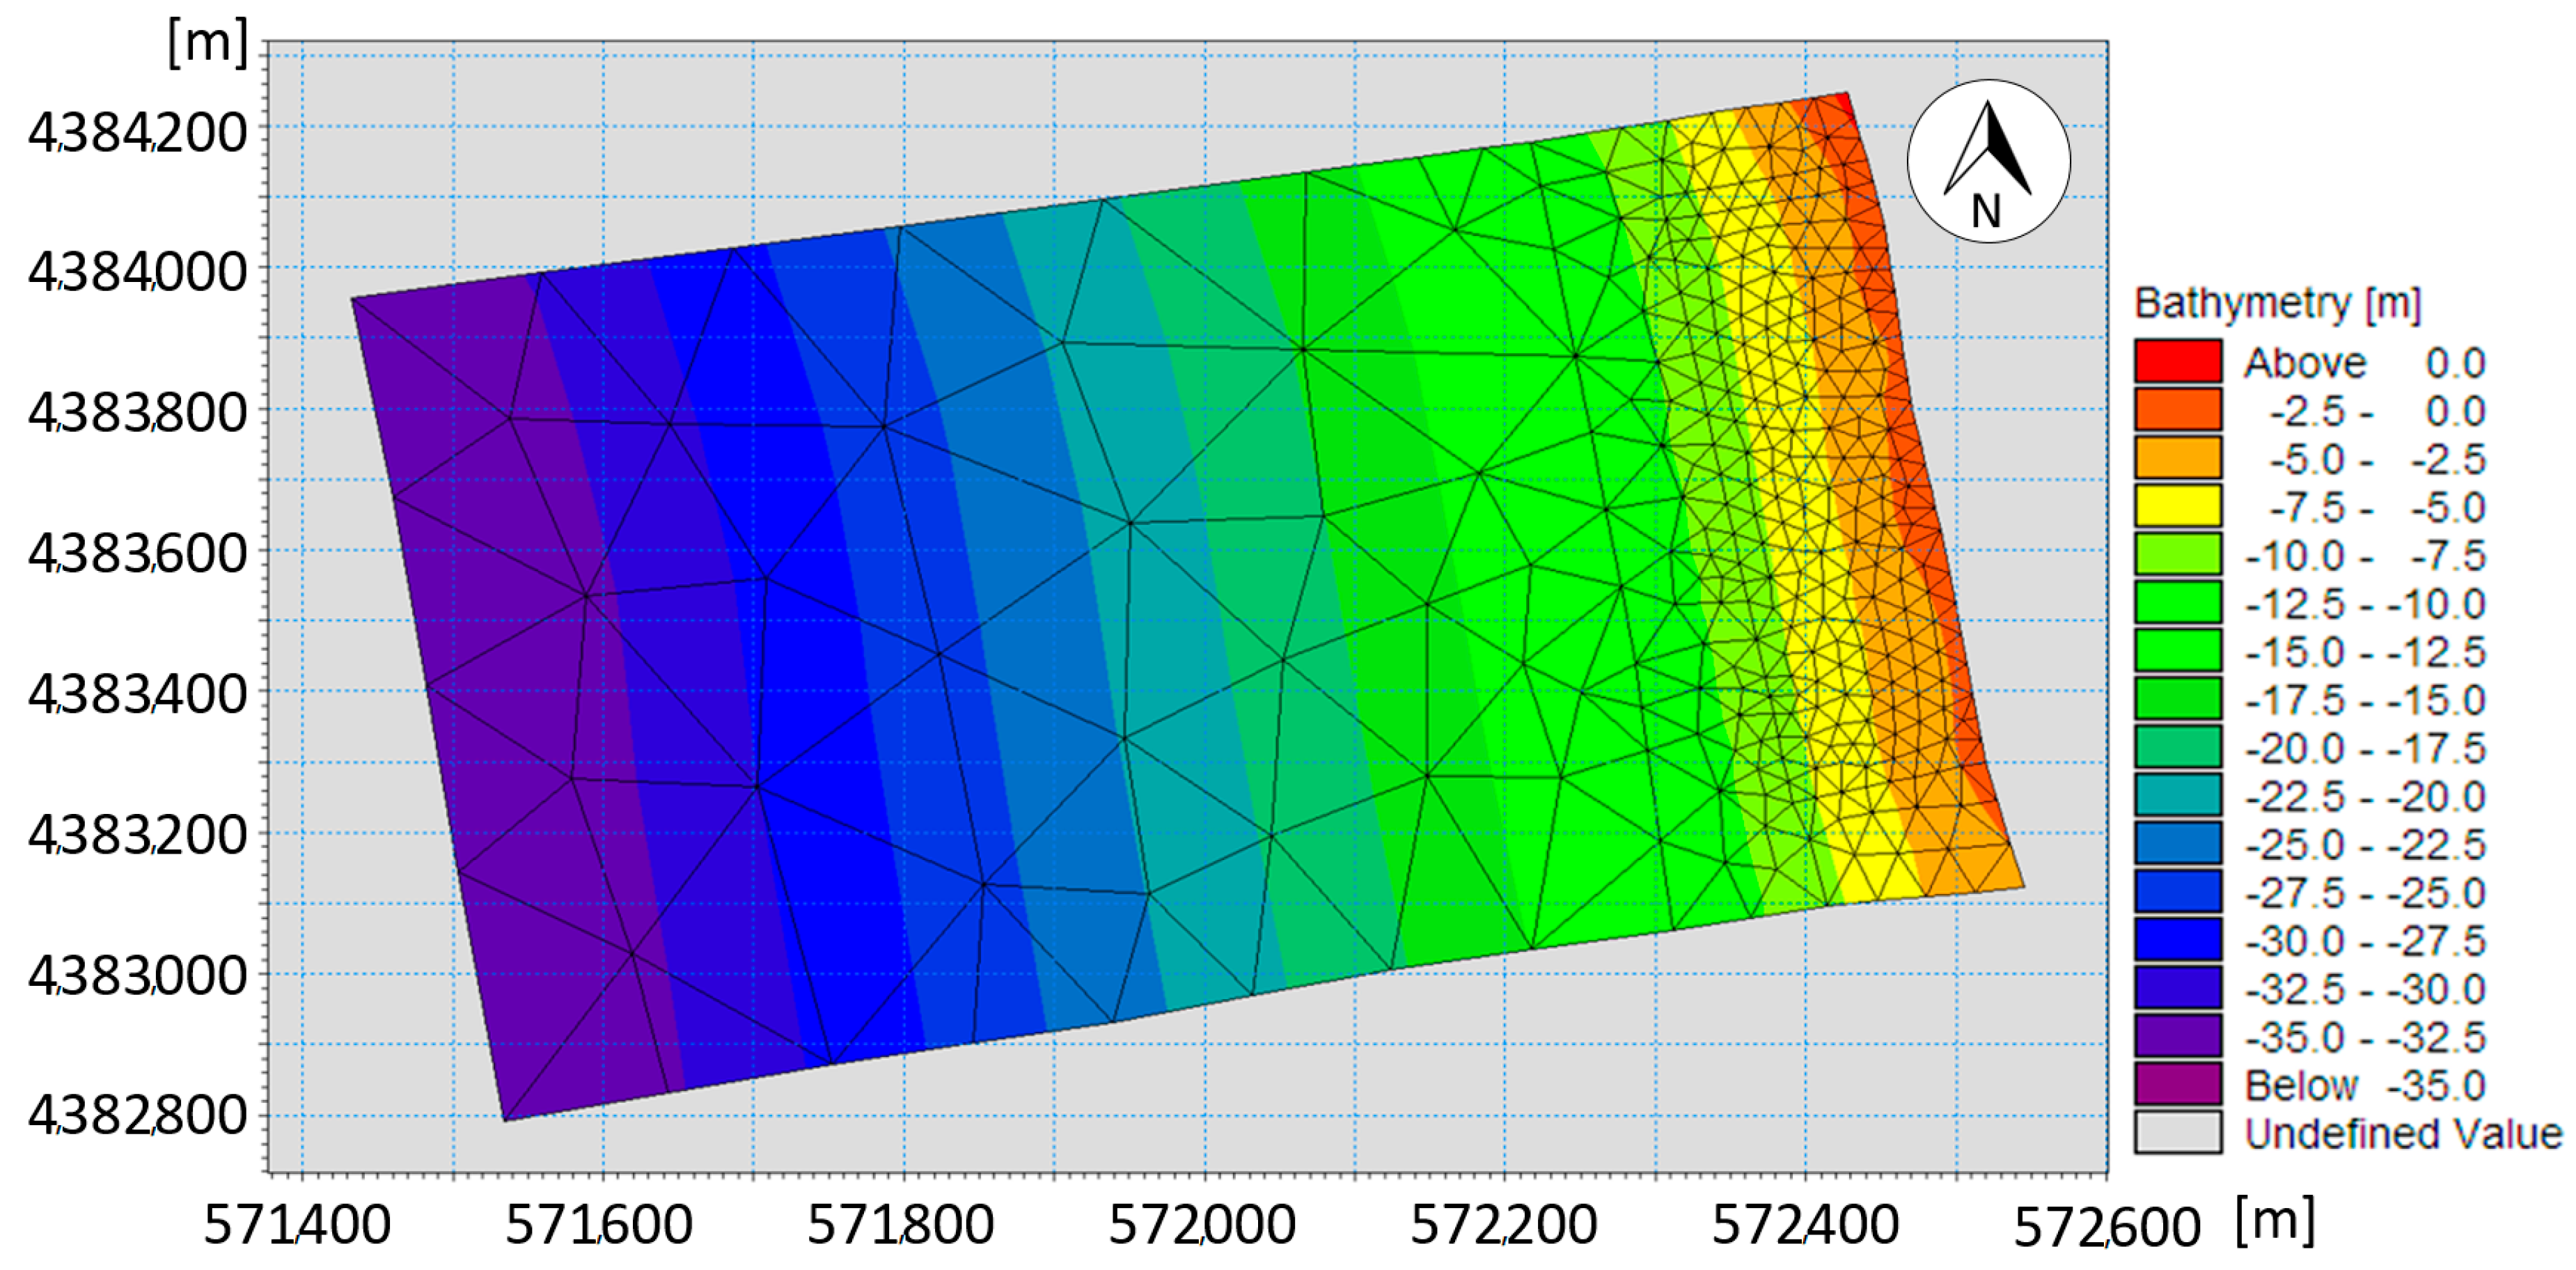
Calabaia Beach is located 1 km south of Belvedere Marittimo, into the Lao region, which is extended 25 km from Capo Scalea to Capo Bonifati. The coast is characterized by sandy and pebbly beaches bounded by narrow dune belts and sedimentary rocks with deposits of conglomerates of pebbles, sand and clay beds [67] (Figure 4).
A granulometric characterization of the site has been carried out by means of several surveys along the shoreline performed in the years 2003, 2006 and 2008, using the ASTM 200 procedure [68].
For each year of monitoring, 24 surveys were carried out, six on each section located at different depths, allowing us to evaluate the composition of the soil (Figure 5). The sample analysis shows that the materials that constitute the bottom have similar features, with an average diameter d50 = 0.22 mm, a specific weight of the soil γsw = 2.65, and a porosity Φ = 0.4. The results of the surveys, together with the reduced extension of the coastal stretch (700 m), allow us to assign averaged values to the whole domain.
Bathymetric surveys ware performed in the years 2005, 2006 and 2008 up to a depth of −10 m (Figure 5, left side), allowing us to build a digital bathymetric model of the area (Figure 5, right side).
During the year 2002, a protected nourishment intervention was built at Calabaia Beach. The submerged breakwater is located parallel to the shoreline, 700-m long, 250-m seaward and with a ridge 2.5 m below the mean sea level (Figure 6). Two perpendicular semi-submerged groynes complete the structure, delimiting a submerged closed cell aimed at supporting the nourishment.
The characterization of the local wave climate at Calabaia Beach has been carried out by using the hindcast dataset based on the data of the Ponza buoy (40°52′00″ N, 12°57′00″ E), collected from 1st July 1989 to 31th December 1999, and the Cetraro buoy (39°27′01″ N, 15°55′01″ E), collected in the year 1999 (Figure 7). Both the buoys are anchored at depth of 100 m. The Ponza buoy is a Wavec MKI directional wave meter; the Cetraro buoy is a Waverider directional wave meter. The hindcast dataset have been reproduced on the entire Tyrrhenian coast, supported by the WAM wave model [40] based on the wind fields provided by the European Center for Medium-Range Weather Forecasts. Calabaia Beach shows a predominant 270° north direction for the waves, with a significant wave height of 7.2 m for a return period of 200 years [69].
Figure 8 relates the significant height of the wave with the return period. The statistical analysis conducted led to a Weibull distribution characterized by a λ value = 0.922 and a k value of 0.454.

2.4. Model Set-Up

The domain of the model is an unstructured mesh, with triangles of different sizes, which are larger offshore and smaller near the barrier and the shoreline, in order to represent the area of concern in more detail (Figure 9).
Wave forcing has been imposed on the west side of the domain. The north and the south side of the grid are characterized by lateral boundary conditions [70,71,72], stated in the set-up manual as good approximations when the boundary line is almost straight and when the depth contours are almost perpendicular to the line [60]. The east side of the mesh, on the other hand, has the condition of land imposed in the MIKE mesh generator. For each run, we set a condition for gradual offshore wave formation, obtaining a linear growth in the significant wave height up to the value we simulated, in order to avoid wave energy peaks that would generate instability in the model. When the targeted wave height has been achieved, the simulation begins, with a duration of 24 h and a print step of 600 s, for a total of 144 pieces of output data. For each run, we consider the forcing as a constant wave (in time and space), setting the wave model with a quasi-stationary formulation, which is suitable for shorelines not longer than 10 km [60].

3. Results

We simulate the efficiency of the submerged barrier for five different offshore waves (Table 1), in order to cover the significant return periods illustrated in Figure 8.
A first set of simulations was carried out by representing the submerged breakwater by means of full 2D modeling (Figure 2). The effects of the breakwater were further evaluated by means of a second set of simulations performed by applying the simplified approach through Goda’s formula instead of the 2D modeling of the barrier. Using the same boundary conditions, five values of β have been tested with the aim being to achieve the same results computed through full 2D modeling (Figure 10).
We compared the results in a control section 1200-m long, perpendicular to the shoreline and located at the mid-point of the length of the barrier, in order to avoid boundary effects (Figure 10, white line).
Figure 11 compares the damping of the wave height produced by the submerged breakwater along the control section, computed by means of full 2D modelling and the simplified 2D approach, with entering waves with Hm0 values of 3 m, 5 m and 7 m (Table 1) as boundary conditions (Figure 11).
The results show that simplified 2D modeling is capable of reproducing wave height damping. With the aim of identifying the value of β that better reproduces the effect of the barrier, we compared the wave height reduction due to the breakwater for all the input waves reported in Table 1 (Figure 11d). We compared the height decay efficiency Eh (9), setting the height of the offshore significant wave as the average of the first 25 m of the control section ( H ¯ m 0   i n ), and the height of the outcoming significant wave ( H ¯ m 0   o u t ) as the average of the last 25 m of the control section (Figure 10, white line).
E h = H ¯ m 0   i n H ¯ m 0   o u t H ¯ m 0   i n
The β coefficient that better represents the effects of the breakwater is 0.30. Table 2 compares the root mean square error (RMS) between the results of the two different sets of simulations, confirming the optimum value for parameter β as equal to 0.30.
We further investigated the damping efficiency using different ridge depths for the breakwater z, ranging between −1 and −2.5 m, in order to provide a more general result [61]. Figure 12 illustrates the logarithmic relation between the height and power damping efficiency and the wave height normalized to the ridge depth of the breakwater H m 0 z . We selected the range H m 0 z , varying from 0.5 (i.e., the breakwater begins to affect the waves) to 3.0, which is the limit constrained by the depth of the breakwater.
The regressive parameters m and q can be further related to the ridge depth z, showing a linear relationship (Figure 12c,d) and allowing us to relate the damping efficiency only to the wave climate and the depth of the ridge of the breakwater, without performing any simulation (10, wave height damping; 11, wave power damping):
E h = m h   · ln ( H m 0 z ) + q h
m h = 0.599   · z + 0.294
q h = 0.0958 · z 0.112
E p = m p   · ln ( H m 0 z ) + q p
m p = 0.0866 · z + 0.513
q p = 0.1918 · z 0.180
Our findings show that the simplified formulation we propose can successfully support the stakeholders in providing an initial assessment of the effectiveness of the submerged breakwater, with particular reference to its design and the further maintenance measures. Although both Equations (10) and (11) have been computed as site specific depending on the surrounding bathymetry, the prevailing environmental conditions and the configuration of the breakwater, the results can have a general validity since, in the area of concern, there are no other structures that can significantly affect the outcomes. The ranges of wave damping we simulated fall within the range of variability provided in the literature [73,74], both in reference to the wave height and to the wave power, showing that the breakwater efficiency is a function of the relative submergence of the crest.

4. Application at Calabaia Beach

We finally applied simplified 2D modeling to assess the effectiveness of the submerged breakwater located at Calabaia Beach through the evaluation of the erosion process affecting the shoreline. Using the same boundary conditions illustrated in Section 2.4, we used the model to reproduce the erosion process affecting the nourishment at Calabaia Beach (Figure 13). Since the area has been subject to a large volume of nourishment, we simulated only one erodible layer, which was characterized by the homogeneous granulometry of the material.
We simulated input waves with a return period of 200 and 50 years, respectively, and two ordinary events with monthly and daily frequencies (Table 3):
The analysis shows a significant loss of material from the nourishment, with a bedload from the protected cell to an offshore direction (Figure 14).
In order to evaluate the magnitude of the erosion, we performed a quantitative analysis of the material eroded based on the change in the elevation of each element of the grid located within the nourishment zone, multiplied by the value of its area (12).
M a t e r i a l   L o s s = i = 1 n A r e a i e l e m e n t   · E l e v a t i o n i e l e m e n t
The aggregated data account for the erosion process within the event (Table 4).
The results indicate that, with the submerged breakwater, 6 months of ordinary wave action produces a volume loss of 700 m3, comparable to a single event with a return time of 200 years, which produces a loss of 629 m3. Submerged barriers are generally not suitable to counteract the erosive process produced by ordinary events, requiring complementary measures. Depending on the duration and extent of the event, nourishment is largely eroded without the protection of breakwater, with a loss of material six to 40 times larger than in the protected configuration.

5. Conclusion

This study focuses on protected nourishment, an environmentally friendly sea defence intervention. Protected nourishments prove to be effective against extreme phenomena, without providing a valid support to face the regular action of waves, which can be very detrimental to the shoreline, subtracting huge amounts of material where the nourishment has been designed. In this work, we develop a simplified methodology to address the effects of submerged breakwaters on the reduction in energy and power of the entering wave, at a significantly smaller computational cost if compared to full 2D modeling. We apply this method to evaluate the shoreline evolution at Calabaia Beach, comparing the effectiveness of the local submerged barrier with the different characteristics of the waves.
The need for such simplified methods arises from the large number of coastal interventions that are planned worldwide and from the need to protect them from the consequences of mean sea level rises and changes in the frequency driven by climate change. The proposed methodology can be used for analysing and predicting the shoreline development over a period of decades, proving to be an essential tool in the modeling and design of different submerged sea defences. Moreover, it can be used to achieve an initial assessment of the long-term efficiency of former submerged breakwaters and the effectiveness of further interventions, e.g., the use of a larger diameter of nourishment sand or the implementation of nature-based solutions, such as the planting of native seagrass meadows (e.g., Posidonia oceanica). However, this method cannot replace the use of the full 2D or 3D mathematical models, since several phenomena, such as local turbulence, flocculation, benthic suspensions and entrainment of fluid mud by shear flow, usually require a two or three-dimensional approach to assess their effect on bedload and erosion. In conclusion, the application of the presented methodology provides the first evaluation of the effectiveness of the former sea defences built at Calabaia Beach, and proves to be promising in assisting engineers and/or environmentalists in designing/evaluating the efficiency of coastal interventions not only in this specific area, but also in worldwide coastal areas where protected nourishments have been designed or already implemented.

Author Contributions

Conceptualization, M.M.; methodology, M.M., R.A.M. and S.S.; software, S.S.; validation, M.M., R.A.M. and S.S.; formal analysis, M.M., R.A.M. and S.S.; investigation, M.M., R.M.A. and S.S.; resources, M.M. and S.S.; data curation, M.M., R.A.M. and S.S.; writing—original draft preparation, M.M., R.A.M. and S.S.; writing—review and editing, M.M., R.A.M. and S.S.; visualization, R.A.M. and S.S.; supervision, M.M.; project administration, M.M.; funding acquisition, M.M. All authors have read and agreed to the published version of the manuscript.

Funding

This research was funded by Governo Italiano, Piano di interventi infrastrutturali di emergenza in Calabria—eventi alluvionali settembre 2000, Ordinanza di Protezione Civile n°3081/2000”, by Regione Calabria, Progetto Integrato Strategico—Rete Ecologica Regionale, POR Calabria—Asse I—Misura 1.10, Convenzione n°1562, and by Provincia di Cosenza, Progetto esecutivo per la difesa e riqualificazione del litorale nei Comuni di Bonifati, Sangineto e Belvedere M.—Tratto da nord Capo Bonifati a nord Capo Tirone, PEG—Bilancio 2004.

Acknowledgments

The authors thank the participants in this study for their time and useful insights. We also thank the Province of Cosenza for their support with the technical documentation provided. The authors sincerely thank the “Danish Hydraulic Institute—DHI” for providing the “MIKE-21 2020 powered by DHI” license in the “Agreement for the development of PhD thesis” between the Danish Hydraulic Institute (DHI) and ‘Capo Tirone Marine Experimental Station’ (UNICAL).

Conflicts of Interest

The authors declare no conflict of interest. The funders had no role in the design of the study; in the collection, analyses, or interpretation of data; in the writing of the manuscript, or in the decision to publish the results.

References

  1. Alexandrakis, G.; Manasakis, C.; Kampanis, N.A. Valuating the effects of beach erosion to tourism revenue. A management perspective. Ocean Coast. Manag. 2015, 111, 1–11. [Google Scholar] [CrossRef]
  2. Roebeling, P.C.; Costa, L.; Magalhães-Filho, L.; Tekken, V. Ecosystem service value losses from coastal erosion in Europe: Historical trends and future projections. J. Coast. Conserv. 2013, 17, 389–395. [Google Scholar] [CrossRef]
  3. Folke, C.; Biggs, R.; Norström, A.V.; Reyers, B.; Rockström, J. Social-ecological resilience and sustainability. Ecol. Soc. 2016, 21, 41. [Google Scholar] [CrossRef]
  4. Leslie, H.M.; Basurto, X.; Nenadovic, M.; Sievanen, L.; Cavanaugh, K.C.; Cota-Nieto, J.J.; Erisman, B.E.; Finkbeiner, E.; Hinojosa-Arango, G.; Moreno-Báez, M.; et al. Operationalizing the social-ecological systems framework to assess sustainability. Proc. Natl. Acad. Sci. USA 2015, 112, 5979–5984. [Google Scholar] [CrossRef] [Green Version]
  5. Sun, C.; Zhang, K.; Zou, W.; Li, B.; Qin, X. Assessment and Evolution of the Sustainable Development Ability of Human–Ocean Systems in Coastal Regions of China. Sustainability 2015, 7, 1–29. [Google Scholar] [CrossRef] [Green Version]
  6. Mele, B.H.; Russo, L.; D’Alelio, D. Combining marine ecology and economy to roadmap the integrated coastal management: A systematic literature review. Sustainability 2019, 11, 4393. [Google Scholar] [CrossRef] [Green Version]
  7. Nicholls, R.J. Coastal Megacities and Climate Change. GeoJournal 1995, 37, 369–379. [Google Scholar] [CrossRef]
  8. De Zolt, S.; Lionello, P.; Nuhu, A.; Tomasin, A. The disastrous storm of 4 November 1966 on Italy. Nat. Hazards Earth Syst. Sci. 2006, 6, 861–879. [Google Scholar] [CrossRef] [Green Version]
  9. Mel, R.; Sterl, A.; Lionello, P. High resolution climate projection of storm surge at the Venetian coast. Nat. Hazards Earth Syst. Sci. 2013, 13, 1135–1142. [Google Scholar] [CrossRef] [Green Version]
  10. Mel, R.; Lionello, P. Verification of an ensemble prediction system for storm surge forecast in the Adriatic Sea. Ocean Dyn. 2014, 64, 1803–1814. [Google Scholar] [CrossRef]
  11. Mel, R.; Lionello, P. Probabilistic dressing of a storm surge prediction in the Adriatic Sea. Adv. Meteorol. 2016, 2016, 3764519. [Google Scholar] [CrossRef] [Green Version]
  12. Pranzini, E.; Wetzel, A.; Williams, A. Aspects of coastal erosion and protection in Europe. J. Coast. Conserv. 2015, 19. [Google Scholar] [CrossRef]
  13. Bendoni, M.; Mel, R.; Solari, L.; Lanzoni, S.; Francalanci, S.; Oumeraci, H. Insights into lateral marsh retreat mechanism through localized field measurements. Water Resour. Res. 2016, 52, 1446–1464. [Google Scholar] [CrossRef] [Green Version]
  14. Finotello, A.; Marani, M.; Carniello, L.; Pivato, M.; Roner, M.; Tommasini, L.; D’alpaos, A. Control of wind-wave power on morphological shape of salt marsh margins. Water Sci. Eng. 2020. [Google Scholar] [CrossRef]
  15. Huang, W. The Influence of Cruise Tourism Dining Waste on the Process of Self-recovery of Natural Ecological Environment. Ekoloji 2019, 28, 49–54. [Google Scholar]
  16. Lamine, I.; Alla, A.A.; Bourouache, M.; Moukrim, A. Monitoring of physicochemical and microbiological quality of Taghazout seawater (Southwest of Morocco): Impact of the new tourist resort “Taghazout bay”. J. Ecol. Eng. 2019, 20, 79–89. [Google Scholar] [CrossRef]
  17. McKenna, J.; Cooper, A.; O’Hagan, A.M. Managing by principle: A critical analysis of the European principles of Integrated Coastal Zone Management (ICZM). Mar. Policy 2008, 32, 941–955. [Google Scholar] [CrossRef]
  18. Pope, J. Responding to coastal erosion and flooding damages. J. Coast. Res. 1997, 13, 704–710. [Google Scholar]
  19. Sakamoto, R.; Seino, S.; Suzaki, H. Coastal Alteration and Changes in Shoreline Morphology Due To Artificial Structures in Miiraku Town on Fukue Is. in the Goto Archipelago. In Proceedings of the EMECS 11-Sea Coasts XXVI. Joint Conference. Managing Risks to Coastal Regions and Communities in a Changing World, Saint Petersburg, Russia, 22–27 August 2016. [Google Scholar]
  20. Reeve, D.E.; Spivack, M. Stochastic prediction of long-term coastal evolution. Environ. Stud. 2001, 58, 55–64. [Google Scholar]
  21. EUROSION. Living with Coastal Erosion in Europe: Sediment and Space for Sustainability—PART I—Major Findings and Policy Recommendations of the EUROSION Project. In Results from the Eurosion study; European Commission: Luxembourg, 2004; p. 54. [Google Scholar]
  22. Post, J.C.; Lundin, C.G. Guidelines for Integrated Coastal Zone Management; The World Bank: Washington, WA, USA, 1996; Volume 9, ISBN 0821337351. [Google Scholar]
  23. OECD. The Ocean Economy in 2030; OECD Publishing: Paris, France, 2016. [Google Scholar]
  24. Seixas, C.S.; Davidson-hunt, I.; Kalikoski, D.C.; Davy, B.; Berkes, F.; de Castro, F.; Medeiros, R.P.; Minte-vera, C.V.; Araujo, L.G. Collaborative Coastal Management in Brazil: Advancements, Challenges, and Opportunities. In Viability and Sustainability of Small-Scale Fisheries in Latin America and The Caribbean; Springer: Cham, Switzerland, 2019; pp. 421–451. ISBN 9783319760780. [Google Scholar]
  25. Crain, C.M.; Halpern, B.S.; Beck, M.W.; Kappel, C.V. Understanding and managing human threats to the coastal marine environment. Ann. N. Y. Acad. Sci. 2009, 1162, 39–62. [Google Scholar] [CrossRef]
  26. Maiolo, M.; Pantusa, D. Sustainable Water Management Index, SWaM_Index. Cogent Eng. 2019, 6, 1–14. [Google Scholar] [CrossRef]
  27. Ondiviela, B.; Losada, I.J.; Lara, J.L.; Maza, M.; Galván, C.; Bouma, T.J.; van Belzen, J. The role of seagrasses in coastal protection in a changing climate. Coast. Eng. 2014, 87, 158–168. [Google Scholar] [CrossRef]
  28. Spalding, M.D.; Ruffo, S.; Lacambra, C.; Meliane, I.; Hale, L.Z.; Shepard, C.C.; Beck, M.W. The role of ecosystems in coastal protection: Adapting to climate change and coastal hazards. Ocean Coast. Manag. 2014, 90, 50–57. [Google Scholar] [CrossRef]
  29. Cantasano, N. Posidonia Oceanica per la Difesa Degli Ambienti. In Proceedings of the SOS Dune, Roma, Italy, 11–18 May 2014; pp. 170–183. [Google Scholar]
  30. Callaghan, D.; Ranasinghe, R.; Nielsen, P.; Larson, M.; Short, A. Process-determined coastal erosion hazards. Proc. Coast. Eng. Conf. 2009, 5, 4227–4236. [Google Scholar]
  31. Li, X.; Zhang, W. 3D numerical simulation of wave transmission for low-crested and submerged breakwaters. Coast. Eng. 2019, 152, 103517. [Google Scholar] [CrossRef]
  32. Hur, D.S.; Lee, W.D.; Cho, W.C. Three-dimensional flow characteristics around permeable submerged breakwaters with open inlet. Ocean Eng. 2012, 44, 100–116. [Google Scholar] [CrossRef]
  33. Hur, D.S.; Lee, W.D.; Cho, W.C. Characteristics of wave run-up height on a sandy beach behind dual-submerged breakwaters. Ocean Eng. 2012, 45, 38–55. [Google Scholar] [CrossRef]
  34. Sharifahmadian, A.; Simons, R.R. A 3D numerical model of nearshore wave field behind submerged breakwaters. Coast. Eng. 2014, 83, 190–204. [Google Scholar] [CrossRef]
  35. Sorensen, R.M.; Beil, N.J. Perched beach profile response to wave action. In Proceedings of the 21st International Conference on Coastal Engineering, Malaga, Spain, 20–25 June 1988; pp. 1482–1492. [Google Scholar]
  36. González, M.; Medina, R.; Losada, M.A. Equilibrium beach profile model for perched beaches. Coast. Eng. 1999, 36, 343–357. [Google Scholar] [CrossRef]
  37. Sollitt, C.K.; Cross, R.H.; Engineer, C. Wave Transmission Through Permeable Breakwaters. Coast. Eng. 1972, 1827–1846. [Google Scholar]
  38. Rahimzadeh, A.; Ghadimi, P.; Feizi Chekab, M.A.; Jabbari, M.H. Determining transmission coefficient of propagating solitary wave over trapezoidal breakwater and parametric studies on different influential factors. ISRN Mech. Eng. 2014, 2014, 841327. [Google Scholar] [CrossRef]
  39. Anastasiau, K.; Chan, C.T. Solution of the 2D shallow water equations using the finite-volume method on unstructured triangular meshes. Int. J. Numer. Methods Fluids 1997, 24, 1225–1245. [Google Scholar] [CrossRef]
  40. Komen, G.J.; Cavaleri, L.; Doneland, M.; Hasselmann, K.; Hasselmann, S.; Janssen, P.A.E.M. Dynamics and Modelling of Ocean Waves; Cambridge University Press: New York, NY, USA, 1994; ISBN 0-521-47047-1. [Google Scholar]
  41. Young, I.R. Wind Generated Ocean Waves; Elsevier: Amsterdam, The Netherlands, 1999; Volume 2, ISBN 9780080433172. [Google Scholar]
  42. Ekebjærg, L.; Justesenu, P. An explicit scheme for advection-diffusion modelling in two dimensions. Comput. Methods Appl. Mech. Eng. 1991, 88, 287–297. [Google Scholar] [CrossRef]
  43. Mel, R.; Carniello, L.; D’Alpaos, L. Addressing the effect of the Mo.S.E. barriers closure on wind setup within the Venice lagoon. Estuar. Coast. Shelf Sci. 2019, 225, 106249. [Google Scholar] [CrossRef]
  44. Mel, R.; Carniello, L.; D’Alpaos, L. Dataset of wind setup in a regulated Venice lagoon. Data Br. 2019, 26, 104386. [Google Scholar] [CrossRef] [PubMed]
  45. Syvitski, J.P.M.; Slingerland, R.L.; Burgess, P.; Murray, A.B.; Wiberg, P.; Tucker, G.; Voinov, A. Morphodynamic models: An overview. In River, Coastal and Estuarine Morphodynamics: RCEM 2009; Vionnet, C.A., Garcia, M.H., Latrubesse, E.M., Perillo, G.M.E., Eds.; Taylor & Francis: London, UK, 2010; pp. 3–20. [Google Scholar]
  46. Short, A.D.; Jackson, D.W.T. Beach Morphodynamics. In Treatise on Geomorphology; Shroder, J.F., Ed.; Academic Press: San Diego, CA, USA, 2013; Volume 10, pp. 106–129. [Google Scholar]
  47. Hamza, W.; Tomasicchio, G.R.; Ligorio, F.; Lusito, L.; Francone, A. A Nourishment Performance Index for Beach Erosion/Accretion at Saadiyat Island in Abu Dhabi. J. Mar. Sci. Eng. 2019, 7, 173. [Google Scholar] [CrossRef] [Green Version]
  48. Danish Hydraulics Institute (DHI). MIKE 21 & MIKE 3 Flow Model FM—Hydrodynamic and Transport Module, Scientific Documentation; DHI, Ed.; DHI: Hørsholm, Denmark, 2017. [Google Scholar]
  49. Roe, P.L. Approximate Riemann Solvers, Parameter Vectors, and Difference Sschemes. J. Comput. Phys. 1997, 135, 250–258. [Google Scholar] [CrossRef] [Green Version]
  50. Jawahar, P.; Kamath, H. A High-Resolution Procedure for Euler and Navier-Stokes Computations on Unstructured Grids. J. Comput. Phys. 2000, 164, 165–203. [Google Scholar] [CrossRef]
  51. Battjes, J.A.; Janssen, J.P.F.M. Energy oss and Set-up due to breaking of random waves. Coast. Eng. 1978, 569–587. [Google Scholar]
  52. Eldeberky, Y.; Battjes, J.A. Spectral modeling of wave breaking: Application to Boussinesq equations. J. Geophys. Res. 1996, 101, 1253–1264. [Google Scholar] [CrossRef]
  53. Nelson, R.C. Design wave heights on very mild slopes—An Experimental Study. Trans. Inst. Eng. Aust. Civ. Eng. 1987, 3, 157–161. [Google Scholar]
  54. Nelson, R.C. Depth limited design wave heights in very flat regions. Coast. Eng. 1994, 23, 43–59. [Google Scholar] [CrossRef]
  55. Ruessink, B.G.; Walstra, D.J.R.; Southgate, H.N. Calibration and verification of a parametric wave model on barred beaches. Coast. Eng. 2003, 48, 139–149. [Google Scholar] [CrossRef]
  56. Danish Hydraulics Institute (DHI). MIKE 21 Sand Transport Module, Scientific Documentation; DHI, Ed.; DHI: Hørsholm, Denmark, 2017. [Google Scholar]
  57. Aagaard, T.; Nielsen, J.; Jensen, S.G.; Friderichsen, J. Longshore sediment transport and coastal erosion at Skallingen, Denmark. Geogr. Tidsskr. 2004, 104, 5–14. [Google Scholar] [CrossRef]
  58. Elfrink, B.; Brøker, I.; Deigaard, R.; Asp Hansen, E.; Justesen, P. Modelling of 3D sediment transport in the surf zone. Coast. Eng. 1996, 3805–3817. [Google Scholar]
  59. Murillo, J.; García-Navarro, P. An Exner-based coupled model for two-dimensional transient flow over erodible bed. J. Comput. Phys. 2010, 229, 8704–8732. [Google Scholar] [CrossRef]
  60. Danish Hydraulics Institute (DHI). MIKE 21 Spectral Wave Module, Scientific Documentation; DHI, Ed.; DHI: Hørsholm, Denmark, 2017. [Google Scholar]
  61. Goda, Y.; Takeda, H. Laboratory Investigation on Wave Transmission over Breakwater; The Port and Harbour Research Institute: Yokosuka, Japan, 1967; Volume 8. [Google Scholar]
  62. Goda, Y. Re-analysis of Laboratory Data on Wave Transmission over Breakwaters; The Port and Harbour Research Institute: Yokosuka, Japan, 1969; Volume 8. [Google Scholar]
  63. Viero, D.P.; D’Alpaos, A.; Carniello, L.; Defina, A. Mathematical modeling of flooding due to river bank failure. Adv. Water Resour. 2013, 59, 82–94. [Google Scholar] [CrossRef]
  64. Viero, D.P.; Defina, A. Multiple states in the flow through a sluice gate. J. Hydraul. Res. 2019, 57, 39–50. [Google Scholar] [CrossRef] [Green Version]
  65. Mel, R.; Viero, D.P.; Carniello, L.; D’Alpaos, L. Optimal floodgate operation for river flood management: The case study of Padova (Italy). J. Hydrol. Reg. 2020, 30, 100702. [Google Scholar] [CrossRef]
  66. Mel, R.A.; Viero, D.P.; Carniello, L.; D’Alpaos, L. Multipurpose use of artificial channel networks for flood risk reduction: The case of the waterway Padova–Venice (Italy). Water 2020, 12, 1609. [Google Scholar] [CrossRef]
  67. Maiolo, M.; Versace, P.; Natale, L.; Irish, J.; Pope, J.; Frega, F. A comprehensive study of the tyrrhenian shoreline of the Province of Cosenza. In Proceedings of the AIPCN 2000—Giornate Italiane di Ingegneria Costiera V Edizione, Reggio Calabria, Italy, 11–13 October 2000. [Google Scholar]
  68. Rubio, C.M. A laboratory procedure to determine the thermal properties of silt loam soils based on ASTM D 5334. Appl. Ecol. Environ. Sci. 2013, 1, 45–48. [Google Scholar]
  69. U.S.A.C.E.-C.H.L.; U.S. Army Corps of Engineers (USACE) Coastal and Hydraulics Laboratory (CHL)—Centro Studi di Ingegneria Ambientale (CSdIA) Analisi Regionale del Litorale della Provincia di Cosenza, Provincia di Cosenza Ed. 2000.
  70. Orlanski, I. A simple boundary condition for unbounded hyperbolic flows. J. Comput. Phys. 1976, 21, 251–269. [Google Scholar] [CrossRef]
  71. Chapman, D.C. Numerical treatment of cross-shelf open boundaries in a barotropic coastal ocean model. J. Phys. Oceanogr. 1985, 15, 1060–1075. [Google Scholar] [CrossRef] [Green Version]
  72. Shabangu, P.E. Investigation of a Simplified Open Boundary Condition for Coastal and Shelf Sea Hydrodynamic Models. Ph.D. Thesis, Stellenbosch University, Stellenbosch, South Africa, March 2015. [Google Scholar]
  73. Hur, D.S.; Lee, W.D.; Cho, W.C.; Jeong, Y.H.; Jeong, Y.M. Rip current reduction at the open inlet between double submerged breakwaters by installing a drainage channel. Ocean. Eng. 2019, 193, 106580. [Google Scholar] [CrossRef]
  74. Goda, Y.; Ahrens, J.P. New formulation of wave transmission over and through low-crested structures. Coast. Eng. 2009, 5, 3530–3541. [Google Scholar]
Figure 1. Coupling scheme representing the information flux among the modules of Mike 21/3 Coupled Model FM 2020 (MIKE).
Jmse 08 00510 g001
Figure 2. Full two-dimensional (2D) modeling of the submerged breakwater.
Jmse 08 00510 g002
Figure 3. Simplified 2D modeling of the submerged breakwater.
Jmse 08 00510 g003
Figure 4. Localization of the Calabaia Beach and the two buoys used to characterize the wave climate.
Jmse 08 00510 g004
Figure 5. Calabaia Beach. Some survey sections at Calabaia Beach (left side); bathymetric characteristics of Calabaia used in the three-dimensional (3D) model (right side).
Jmse 08 00510 g005
Figure 6. Schematization of the of the submerged breakwater built in the year 2002 at Calabaia Beach.
Jmse 08 00510 g006
Figure 7. Wave Rose at Calabaia Beach based on the hindcast data of the Ponza and Cetraro buoys.
Jmse 08 00510 g007
Figure 8. Relationship between significant wave height and return period.
Jmse 08 00510 g008
Figure 9. Grid of the hydrodynamic model used in this study. Different colours refer to different bed elevation. The metric scale refers to WGS84 UTM 33N, EPSG-32633.
Jmse 08 00510 g009
Figure 10. Wave climate computing by means of the simplified simulation with Hm0 = 5 m. The white line represents the location of the control section, highlighting the two sections used to compute the decay efficiency (9). The wave direction is 270° N. The metric scale refers to WGS84 UTM 33N, EPSG-32633.
Jmse 08 00510 g010
Figure 11. Wave height decay (height efficiency Eh) along the cross section of the submerged breakwater. (a) Hm0 = 3 m, (b) Hm0 = 5 m, (c) Hm0 = 7m. (d) Decay efficiency for different values of β .
Jmse 08 00510 g011
Figure 12. Wave damping efficiency for different values of the ratio H m 0 z . (a) Wave height decay, (b) wave power decay; (c) and (d) show the relationship between the value of the parameters of the logarithmic relation and the depth of the ridge of the submerged breakwater.
Jmse 08 00510 g012
Figure 13. Detail of the domain of the model used to evaluate the erosion process at Calabaia Beach.
Jmse 08 00510 g013
Figure 14. Bed level change and sediment flux for an event with a return period of 50 years, simulated with the presence of the breakwater. The metric scale refers to WGS84 UTM 33N, EPSG-32633.
Jmse 08 00510 g014
Table 1. Simulated waves heights and periods.
Hm0 [m]34567
Tp [s]9.1810.609.1811.8514.02
Table 2. RMS error of the wave height damping computed through simplified 2D modeling compared to the results obtained by means of the full 2D model.
Hm0Full 2D ModelBeta Values
0.250.30.350.40.6
317.0615.8116.9818.1019.4525.29
431.2230.7131.9833.1134.2938.88
538.9638.2939.3540.3641.2646.00
641.2540.1740.9841.8942.8247.05
741.7540.8941.7042.5643.4647.55
RMS Error0.9080.4041.232.276.97
Table 3. Simulated event characteristic for material loss analysis.
Simulated Hm0 [m]Event Duration [h]Peak Period [s]Wave Direction [deg]
7.20814.02270
5.001611.85270
2.00327.49270
0.256 months2.65270
Table 4. Summary of material loss data.
Hm0Event Duration [hours]Return Time [years]With BreakwaterWithout BreakwaterRatio of Loss
Volume Loss [m3]Mean Elevation Loss [m]Volume Loss [m3]Mean Elevation Loss [m]
7.208200−629.40−0.00058−25245.93−0.11440.11
5.001650−563.94−0.00045−21671.71−0.10138.43
2.00320.1−1681.02−0.0059−10910.4−0.05026.49
0.256 months0.03−700.29−0.00798−13307.92−0.0655219.00

