Abstract
An innovative variant of a multiphase marine ramjet is investigated analytically and experimentally. Pressure liquefied gas (LG) is injected, boiling under superheat conditions in the water stream within the propulsion unit, and serving as an on-board bubble source necessary for the ramjet operation. Experiments were conducted in a 10 m diameter tow pool at a speed range of 7–18 m/s (approximately 14–35 knots). For the laboratory concept demonstration and process characterization, two liquefied gases, butane and R134a (synthetic refrigerant gas), were employed. In practical applications, non-polluting LGs such as liquid air may be used. The results reveal the overall performance comparable to the operation with pressurized air, with some thrust advantage of the LG at high-speed tests, attributed to the volume increase of gas during phase change, in accordance with the thermodynamic power cycle analysis.
1. Introduction
The marine ramjet (MRJ) is the nautical equivalent of the aeronautical ramjet, using water instead of air as the main working fluid. In both cases, the incoming ambient fluid enters the propulsor due to the motion of the vehicle, without using means such as pumps or compressors. The flow is first dynamically pressurized due to slowing down in the inlet, then additional energy is introduced, after which the flow is expanded and accelerated in a nozzle, generating thrust. Different concepts for marine ramjet propulsion are summarized by Gany [1]. In the case of the marine ramjet type investigated in this research, energy is added not in the form of fuel combustion or chemical reaction but by introducing a secondary gaseous fluid, reducing the mean density of the flow, making it compressible, and adding its expansion work. While the main fluid is water (mass flow rate, ), the secondary fluid is traditionally compressed air (mass flow rate ). The present study focuses on the replacement of the compressed air with an on-board pressure liquefied gas (LG, flow rate, ), boiling at superheat conditions and generating gas bubbles upon injection into the water. The use of LG is a means of a compact storage of gas when ambient air is not readily available (particularly for underwater vehicles with no access to air). Schematic illustration of the two-phase marine ramjet is depicted in Figure 1.
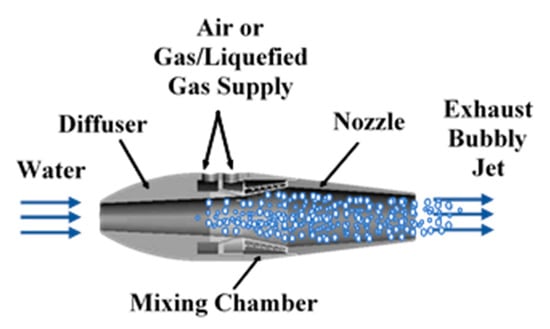
Figure 1.
Schematic illustration of the marine two-phase ramjet fed by air or liquefied gas.
The two-phase marine ramjet concept received some attention already in the 1940s (Tangren et al. [2]). It was studied more extensively in the 1960s and 1970s (Schell and Ornof [3], Muench and Garrett [4], Mottard and Shoemaker [5], Witte [6], Grainer [7], Amos et al. [8], and Chernyy [9]). Comprehensive research on MRJ was conducted at the Technion—Israel Institute of Technology in the 1990s and 2000s. It included static tests and dynamic experiments in a specially constructed 10 m diameter pool (Albagli [10] and Koren [11]), and patents by Varshay and Gany [12,13]. Sea trials with a 4 m boat were conducted as well (Valensy [14]). Application of the concept for waterjet boosting was studied by Gany and Gofer [15]. Fundamental theoretical considerations of the thermodynamic cycle of the MRJ were presented by Gany [16]. Albagli and Gany [17] and Mor and Gany [18] conducted analyses of homogenous quasi-one-dimensional two-phase compressible flow related to the MRJ. The models included wall friction, relative velocities, and heat and mass transfer between phases, leading to a system of nine ordinary differential equations (ODEs). The numerical solution of this equation system has been incorporated into a simulator, used for performance evaluation in the present study. More recently research has been conducted by Chahine and collaborators at Dynaflow [19,20,21], by Gowing et al. [22], and by researchers in China [23,24]. Other works on marine ramjet have focused on water reactive chemicals such as lithium, triethyl aluminum [25], thermite fuel [26], and metallized fuels containing, e.g., magnesium or aluminum [27,28,29,30]. The present research deals with a non-reactive operation.
The operating principle of the marine ramjet as illustrated by Figure 1, is as follows: water at ambient conditions enters the MRJ inlet due to the vessel motion. The water velocity reduces and its pressure increases within the diffuser (inlet) due to the enlargement of the flow cross section. This process is typical to ramjets, in general. A secondary compressible fluid (gas), with significantly lower density, is injected at the mixing chamber into the mainstream flow. Expansion of the secondary fluid from the mixing chamber pressure to the exhaust pressure (typically the ambient pressure) while moving as a multiphase mixture along the nozzle, provides expansion work, which, by a proper design of the nozzle, is converted into an increase in the kinetic energy (i.e., velocity) of the exhaust multiphase jet, hence producing thrust. Similarly to the aeronautical jet engine, the thrust developed by the MRJ is equal to the difference between the outgoing and incoming momentum flow rate. With a proper design of the nozzle (exit pressure equal to the ambient pressure) and accounting for the fact that the mass fraction of the gas component in the flow is very low (typically, less than 1%) compared to the water flow rate, the thrust equation is approximated as follows:
where F is the thrust and and are the exit jet and incoming flow velocities, respectively.
2. Thermodynamic Cycle
When the gas component is air or any non-condensable and non-soluble gas, the expansion process can be assumed to be isothermal, due to the rapid heat transfer between the small bubbles and surrounding water, and accounting for the relatively small mass fraction of air and the very large overall heat capacity of the water (see Gany [16] and Albagli and Gany [17]). Figure 2 presents the ideal thermodynamic power cycle per unit mass of air; it assumes adiabatic compression of air from the ambient pressure Pa and temperature Ta (point a) to the mixing chamber pressure Pmix (point comp), followed by isobaric cooling (path comp to mix), and isothermal expansion of bubbles due to dropping from the mixing chamber pressure (point mix) to the exit pressure (point a, assuming that the exit pressure is equal to the ambient pressure), while flowing through the nozzle. The ideal specific expansion work (per unit mass of air or gas), is given in Equation (2):
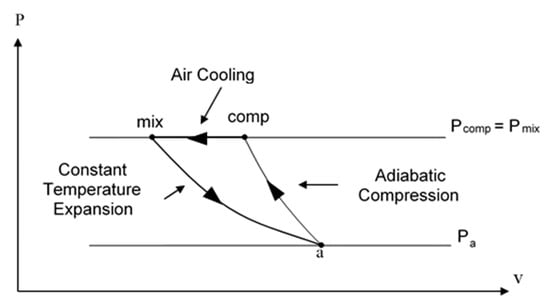
Figure 2.
P–V plot of the ideal thermodynamic operating cycle of the water-air marine ramjet.
In Equation (2) R is the specific gas constant, Ta is the ambient temperature, Pmix the pressure in the mixing chamber, and Pa is the ambient pressure.
From this mechanistic explanation, assuming a similar characteristic bubble size for all gases examined, it is implied that the thrust generated is proportional to the volume of injected gas rather than to its mass. For this reason, when employing a gas or LG other than air, its mass flow rate is first converted to a volume-equivalent air mass flow rate (its mass flow rate divided by its molecular weight and multiplied by that of air), allowing comparison between different operating gases on an equal scale. The gas to the water mass ratio is then given as the air (or air-equivalent) mass flow rate divided by the water mass flow rate (hereafter, a/w = ).
As mentioned before, for submerged marine vessels employing MRJ propulsion, there is a need for an onboard compact gas source due to the lack of access to ambient air.
Pressure liquefied gas (LG) can be compactly stored as a liquid in a self-contained unit by pressurizing it to its vapor pressure and above at the room (storing) temperature; thereby it can serve as a source of gas instead of compressed air, enabling the MRJ submerged operation. Upon injection as small droplets into the flowing water within the mixing chamber, it boils (being in superheat conditions), forming bubbles, which both grow due to phase change and expand due to the pressure gradient while the multiphase mixture is flowing through the exhaust nozzle. Figure 3 presents the ideal simplified thermodynamic cycle of the LG for the boiling-expansion driven MRJ. The liquefied gas reduces in pressure as it is injected (Figure 3, A to B, at constant enthalpy); boils in the mixing chamber (B to C, constant pressure/temperature); then heats up in the mixing chamber to the water (ambient) temperature at constant pressure (C to D), and finally expands isothermally from the mixing chamber pressure to the ambient pressure, while moving along the nozzle (D to E). The closure of the cycle, namely, the liquefaction process of the gas, storing it as a liquid at a higher pressure (E to D to F and back to A), is conducted externally at the liquefaction plant. The maximal work that can be done by the gas on the fluid flowing through the propulsor in such an ideal cycle, consists of two processes: first is an increase in volume due to phase change, when the LG is boiling, namely, turning into vapors (path ABCD). Since the initial size of a droplet is some two orders of magnitude smaller than the resulting bubble, the potential work done by the growing bubble (per unit mass) at constant pressure can be approximated by Pmixv = RTa, and denoted as “Potential work due to phase change” in Figure 3. The other process, denoted as “Expansion work” in Figure 3 (path DE), is the work due to expansion of bubbles because of the pressure drop from Pmix to Pa while moving in the nozzle. The work done on the fluid during the latter process is formulated in Equation (2). The ideal work per unit mass of the LG, combining the two contributions, is approximated by Equation (3).
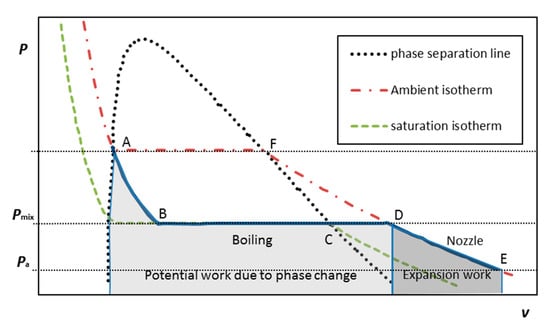
Figure 3.
P–V diagram of an ideal simplified thermodynamic cycle of a multiphase ramjet employing boiling of liquefied gas as a source of bubbles. The area under the ABCD line reflects a potential ideal additional work due to phase change of the liquefied gas (LG). The area under DE is the expansion work in the nozzle.
The process of the phase change (boiling) of a superheated pressure liquefied gas (propane) when injected into a host liquid (water) was studied by Haustein et al. [31], revealing 200-folds volume growth within 30 ms (Figure 4). It is noted that in the turbulent flow and convection regime due to the velocity difference between the phases within the propulsor, boiling is expected to be faster than in quiescent or natural floating conditions characteristic to laboratory experiments.
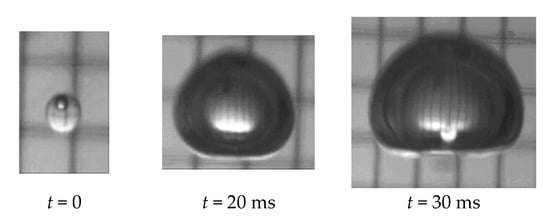
Figure 4.
Phase change (boiling) of a 2 mm propane droplet while moving due to buoyancy within a column of water at ambient temperature and pressure (data adapted from Haustein et al. [31]).
Realizing the potential additional work associated with the phase change of an LG compared to compressed air may not be straightforward because of the non-equilibrium (transient) phase change process. In this study, a certain thrust advantage has been indicated with a boiling liquefied gas at high velocities, in comparison to compressed air propulsion. However, this method is not devoid of disadvantages. The main disadvantage is that, as a self-contained unit carrying its own “fuel”, operation time/range is rather limited. Additionally, in underwater operation the entire unit’s surface is subject to drag.
In general, both the air and LG propelled MRJs have a moderate thrust margin compared to the vessel drag, making them feasible for operation at medium/high but not at very high cruise speed range. See discussion in Gany [1]. In addition, similarly to the aeronautical ramjet, the MRJ has to be brought to an optimal work range (velocity) that varies with operating and ambient conditions (working fluids, ambient temperature, and depth). This aspect of acceleration of the MRJ to a working velocity is not dealt with in this study, though different methods exist (e.g., the use of rocket boosters or compressed air for launching).
3. Experimental Setup
The tow pool setup employed in this experimental investigation was originally designed and constructed by Varshay [32]; it was modified by Koren [11] for controlled MRJ operation with compressed air (up to 50 g/s of air) at low/medium velocities (up to 13 m/s, about 25 knots). Additional modifications were made in the present investigation to adapt the system for LG storage, supply, and operation, as well as to increase its velocity up to 18 m/s (about 35 knots). The 10 m diameter pool is presented in Figure 5. Figure 6 shows a cross-sectional schematic illustration of the system: a computer-controlled 7.5 kW central electric motor rotates an arm supporting the test MRJ propulsor submerged within the circular water-channel at a preset velocity. The path of rotation was 30 m long (diameter of rotation 9.55 m), the depth of the pool was about 0.8 m, and the width varied between a minimum of 1 m and a maximum of 2 m because of the hexagonal structure of the walls. This results in a blockage ratio of 0.5% and less. Baffles located in the pool about 2.5 m apart were aimed at reducing the water circulation due to the MRJ propulsor rotation. With the minimum free path between baffles at a cross-section (0.45 m wide), the blockage ratio was about 1%.
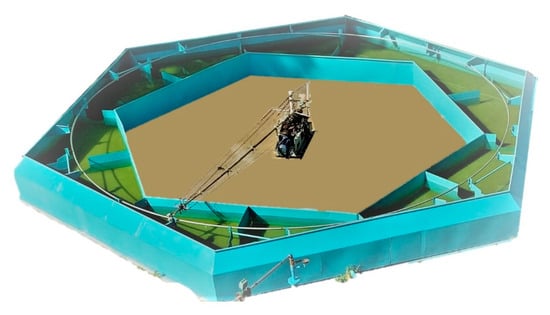
Figure 5.
The 10 m diameter tow pool facility used for the marine ramjet research.
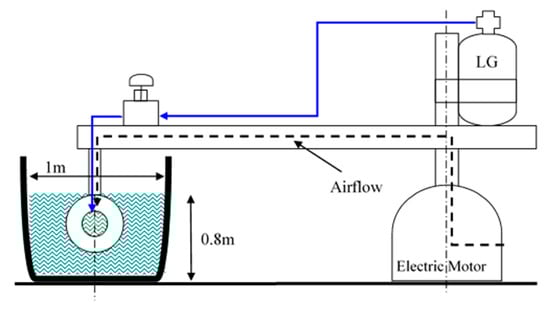
Figure 6.
Schematic cross-sectional view of marine ramjet (MRJ) tow pool modified for boiling LG propulsion.
The propulsor’s supporting arm also functioned to accommodate both the compressed air and LG supply pipes. As mentioned, a computer controlled central electric motor was a priori set to rotate the supporting arm to yield the determined preset speed of the propulsor in the water. The angular velocity of the arm, moment, and power consumption of the motor were instantaneously recorded, enabling determination of the resistance force (drag). The air supply was measured by a choked-flow orifice meter, whereas the LG average flow rate was measured by the LG mass loss during a test divided by the test duration. Pressure was measured during operation with calibrated transducers at different locations along the MRJ propulsor, as depicted in Figure 7. The entire data were transferred through an optical encoder, located at the center axis of the rotating arm, to a computer, where they were recorded by a custom Labview program. This data transfer method limited the sampling rate to 1.25 Hz, so results were later time-averaged to reduce noise-induced errors.
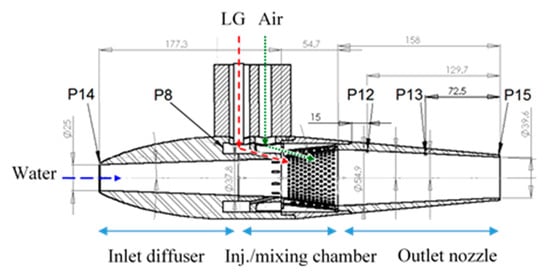
Figure 7.
Cross section of the MRJ motor (39.6 mm outlet nozzle shown) enabling either air or LG application. P = pressure readings.
The overall dimensions of the MRJ propulsor in our experiments are: the maximum outer diameter 80 mm, overall length 390 mm, of which the mixing chamber takes up 55 mm, and the nozzle 158 mm. The inlet diameter was 25 mm, the nozzle exit diameter was either 39.6 mm or 32 mm, and the other internal dimensions can be seen in Figure 7. Pressure measurements in the MRJ propulsor were as follows: P14 at the inlet (for estimating the effective capture cross-section); P12, P13, and P15 along the nozzle; P8 was taken within the LG preinjection chamber (for verification that the LG is in liquid form, i.e., above saturation pressure, before injection).
3.1. Test Procedure
The MRJ can operate at low speed but has a significant advantage at the medium/high speeds. Hence, the central electric motor was adjusted to yield speeds of up to 18 m/s (about 35 knots) by optimizing the transmission.
Liquefied gas was delivered to the MRJ propulsor from a high-pressure tank, fixed to the central axis, as shown in Figure 6. The tank was periodically repressurized with nitrogen (inert gas) to maintain a roughly constant flow rate and avoid boiling prior to injection, thereby delivering the LG into the primary water flow as a liquid. As shown in Figure 6 and Figure 7, either LG or compressed air could be introduced into the water flow within the mixing chamber. The duration of the liquefied gas injection was determined by a remotely controlled pneumatic valve, whereas when conducting tests with compressed air, it was remotely controlled by a pressure regulator and a valve on the main supply line. The liquefied gas was injected into the water at an angle of 20 degrees from the downstream direction, through an injection ring with up to ten 0.8 mm jets, thereby enabling the presetting of the radial distribution and an air-equivalent mass flow rate from 3 to 30 g/s. The liquefied gas stream would then break up and boil in the primary water flow. In the following chapter, all experiments were conducted with 5 injection jets, maintaining good distribution and an adequate LG flow rate. When using air, it was injected through a fine mesh (1 mm holes) at the inner walls, distributing the incoming bubbles along the mixing chamber. The difference in the injection way between liquefied gas and air resulted from the different densities of these two fluids and the way the bubbles were formed. For the liquefied gas, a relatively small injection area was sufficient. In addition, the gas bubbles volume increased gradually along the chamber while the LG was boiling. Air required a larger injection area and spreading to avoid an abrupt increase in volume and back pressure.
For our laboratory investigation, characterization of the process, and concept demonstration, two types of readily available liquefied gases, butane and R134a (synthetic refrigerant gas), were used in the experiments. In practical applications, non-polluting LGs such as liquid air may be employed. The physical properties of the LGs used are presented in the following sections. Injection pressures of the LGs were above saturation in the preinjection chamber (P8 label in Figure 7), around 7–8 atm for R134a and 3 atm for butane, whereas the mixing chamber pressure was typically about 1.5 atm (absolute), depending on inlet flow and injection conditions. Compressed air source pressure was typically around 5 atm (i.e., above twice the mixing chamber pressure) to allow flow rate measuring via a choked-flow orifice.
The LG flow rate was measured by weighing the liquefied gas tank before and after every experiment and dividing by the injection duration (retrieved from the pressure readings). The uncertainty associated with this averaged flow-rate measurement is discussed in the next subsection.
Each experiment was conducted as follows: water temperature was measured at several locations in the pool, and the LG tank (for liquefied gas runs) was weighed. The MRJ propulsor was then accelerated by the central electric motor until it reached the desired velocity; after a short duration at constant velocity, liquefied gas (or compressed air) was injected for 13–16 s (equivalent to at least 6 complete rotations around the tow pool). After which the MRJ propulsor was slowed down to a standstill, and the LG tank was weighed again. All data were recorded, plotted, and saved in preparation for the next run. The liquefied gas experiments were immediately followed (or preceded) by an experiment with compressed air, for comparison under similar conditions (water level in the pool, water temperature, velocity, and flow rate).
3.2. Uncertainty of Results
As explained in the previous section, the data collected included pressure readings, drag readings, airflow rate (in compressed air experiments), or LG tank weight measurements (in LG experiments).
Injection time was 13 s or above and a reading was taken every 0.8 s, leading to a 6% uncertainty in average mass flow-rate. In the LG tests, all experiments were within a 15% average flow rate. For comparison of different experiments, the results were interpolated to the average value.
Calibration of the pressure readings led to a bias-error up to 0.05 atm (5 kPa). Drag measurements were accompanied by a high level of noise and therefore averaging over a minimum of 11 data points was used, leading to an error of less than 1 N in the average value. Generally, lower errors were associated with higher velocities, as the signal-to-noise ratio increased with the increase in drag.
4. Results
4.1. Pressure Measurements
Figure 8 presents the pressure readings at different locations along the propulsor during a typical experiment using injection of liquefied gas butane. The pressure in the preinjection chamber P8 remained quite constant and above the ambient saturation pressure (the absolute vapor pressure of butane at 20 °C was about 2 atm), demonstrating that the pressurization system was holding the LG in a liquid state up to injection and maintaining a constant flow. During the LG injection (and its conversion to gas), the maximum pressure (in the mixing chamber, P12) increased due to the increase in the volumetric flow rate and the blockage effect of the gas. As Figure 8 shows, this pressure was also projected forward, to the inlet (P14). As expected, the pressure decreased along the nozzle (P15). In general, in the optimal design for given operating conditions (mainly cruise speed) of the MRJ, the relative cross sections of the inlet and nozzle exit are planned to imply local pressure equal to the ambient pressure in these sections at the designed gas to liquid flow rate ratio. The pressure at the inlet increased with increasing the gas injection rate and with decreasing the nozzle exit cross section. In the example of Figure 8, the inlet pressure was somewhat below the atmospheric pressure, indicating a water capture area larger than the inlet geometrical cross section. When increasing the gas flow rate at the given geometry and speed, the pressure at the inlet increased. For the present operating conditions it reached the ambient (atmospheric) pressure for the air to water mass flow rate ratio, a/w = 0.3%. Such conditions mean that the capture area was equal to the geometric inlet area. A further increase in the gas injection caused a reduction of the effective capture area below that of the geometric inlet, and some of the water did not enter the MRJ, i.e., “spillage” occurred; this was followed by a weaker thrust increase with a/w and a significant reduction in efficiency. Theoretically, to maintain a bubbly flow (bubbles in water), the maximum volumetric fraction (packing limit) of monodisperse bubbles was about 74%, corresponding to the air-equivalent to water mass ratio of about 0.35%. Therefore, in our experiments we remained with a/w below 0.3%, corresponding to about 16 g/s in terms of air.
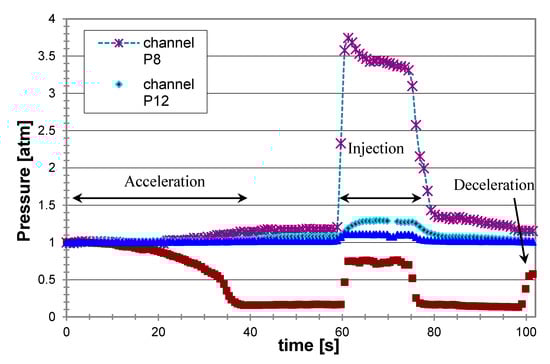
Figure 8.
Typical pressure readings from the MRJ propulsor driven by boiling butane, at 15 m/s (see locations of measurements in Figure 7).
In the compressed air experiments, pressure readings were also taken before and after the choked flow orifice, practically measuring and controlling the flow rate by the upstream pressure and the size of the orifice, with only a weak dependence on temperature.
As explained in the introduction, all gas flow rates presented are in volume-equivalent air mass flow rates (i.e., all gases have their mass flow rate divided by the ratio of their molecular weight to that of air). This means that similar gas volume flow rates were injected, as the thrust generated by expansion is dependent on the gas phase volume fraction.
4.2. Drag
The system was operated in a towing mode. The central electric motor provided the necessary power and controlled the desired velocity, while the overall system resistance (including mechanical friction and the drag on the propulsor during motion in the water) was larger than the thrust generated. The power output of the electric motor was measured, from which, after calibration (as done by Koren [11]), the total drag could be found.
By conducting a series of runs without water in the tow pool, the parasitical (system) drag-equivalent resistance could be evaluated. This drag was then deducted from the total drag measured to give the “net drag” due to water only, as shown in Figure 9.
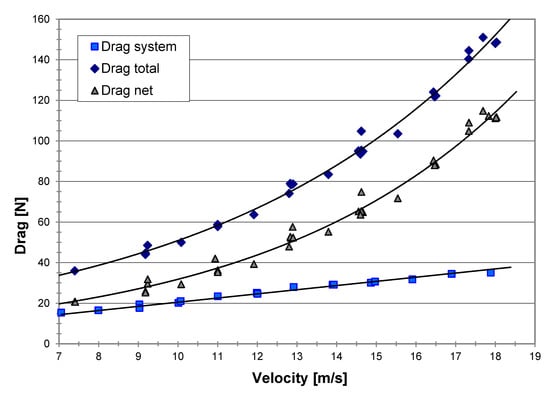
Figure 9.
Measured drag of the MRJ vs. velocity; the net drag is that due to the water only.
We defined an overall drag coefficient CD based on the largest cross section of the propulsor as a reference area (as it is common for aeronautical slender bodies like missiles) rather than on the wetted area:
= drag force and A = reference area (equal in our case to the cross-section of a cylindrical body of a diameter d = 80 mm).
The drag coefficient is usually related to the Reynolds number, Re = ud/µ, of the water flow. Figure 10 shows the dependency of the net drag coefficient on the Reynolds number as was obtained from our experiments. The drag coefficient, CD, was found to be around 0.2 for the majority of the range of Reynolds numbers examined. It is important to note that no sudden change occurred in drag (no critical Reynolds number was crossed), which could significantly distort the thrust measurements and the observed trends.
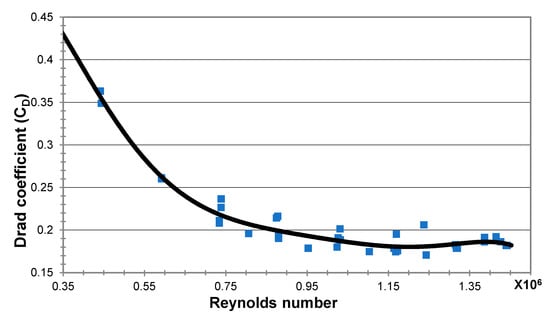
Figure 10.
The drag coefficient measured on the MRJ propulsor in the tow pool.
4.3. Thrust
As mentioned before, the propulsor velocity in the water was controlled by the central electric motor; the electric motor would first accelerate the propulsor to the preset velocity and then maintain a constant speed during the propulsor operation; the overall resistance force could be deduced from the motor power record. Since the resistance force was always larger than the propulsive force of the propulsor, the thrust was obtained from the difference between the measured resistance with propulsion operation off (no air or LG injection) and on (when injecting air or LG). A typical record during a test conducted with air injection at a cruise speed of 15 m/s is presented in Figure 11. During the first 50 s the electric motor accelerated the propulsor in the water up to a maximum velocity of about 15 m/s. For the following 10 s, a constant velocity was kept. No injection of air within the propulsor was applied until that instant, and an overall resistance (drag) of about 123 N was attained. At this point, the propulsor operation was turned on by injecting air bubbles for about 15 s; the overall resistance was reduced to about 86 N; the difference between the two modes of operation indicates a thrust contribution of about 37 N. After that stage the air injection was stopped, the overall resistance returned to the level before thrust application for about 7 s; then the electric motor operation was turned off, and the propulsor velocity slowed down due to drag until a full stop.
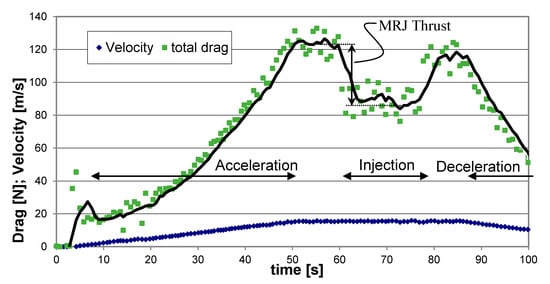
Figure 11.
Typical drag and velocity readings during an experimental run showing the thrust resulting from air injection, at a cruise speed of 15 m/s.
4.3.1. Air Injection and Exit Nozzle Effect
As stated before, the design of the MRJ should take into account the ratio between the relative cross sections of the inlet and exit, depending on the propulsor speed and the gas to water ratio. The reduced nozzle exit cross section can cause a blockage when increasing the gas to water ratio, implying the spillage of water and a lower efficiency. Figure 12 presents thrust vs. vessel velocity for a propulsor with two different nozzle exit diameters (32 and 39.6 mm) and the same inlet diameter (25 mm). The effect of a medium vs. high airflow rate can also be observed. The main observation is that the 32 mm diameter nozzle was too small. It gave a lower thrust than the 39.6 mm nozzle for similar operating conditions. The experiments of the present research were conducted at airflow rates of 16.4 g/s with the 32 mm diameter nozzle and 15.3 g/s with the 39.6 mm diameter nozzle. Additional data points were taken from Koren [11]. His results are in good agreement for the airflow rate of 16.4 g/s for both nozzle diameters. However, when increasing the airflow rate to 24 g/s the thrust showed only little change compared to the lower airflow rate in the case of the smaller nozzle (32 mm diameter), indicating a blockage effect. On the other hand, in the case of the 39.6 mm nozzle, the higher airflow rate resulted in a noticeable increase in thrust.
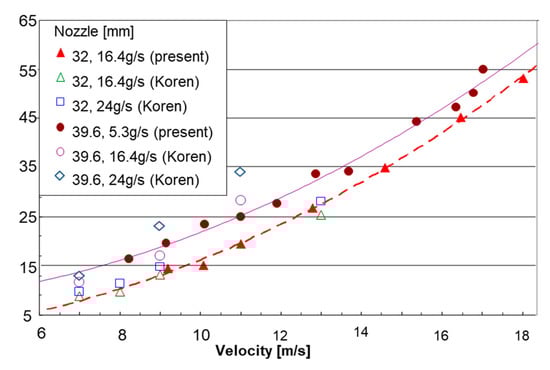
Figure 12.
Test results of the thrust vs. propulsor velocity using air injection for 32 mm and 39.6 mm outlet nozzles.
4.3.2. Operation with Liquefied Gas
Experiments with two types of liquefied gases were conducted. The first one was a synthesized refrigerant, tetrafluoroethane, CH2FCF3, known as R134a; it is in a gas state at atmospheric pressure, but liquefies under moderate pressure (above 6 atm) at room temperature. The properties of R134a at its boiling (saturation) temperature at atmospheric pressure (−26.07 °C) taken from the NIST Chemical Webbook Database [33] are given in Table 1.

Table 1.
Saturation properties of R134a at atmospheric pressure (−26.07 °C), from the NIST Chemical Webbook Database [33].
Tests took place again with the two nozzle outlets, 32 mm and 39.6 mm diameter, at a similar water temperatures (24 °C and 26 °C, respectively), and were compared to experiments with air at the same conditions; all experiments were done with an air-equivalent mass flow rate of 15.3 g/s (Figure 13). In accordance with the test results displayed in Figure 13, both the LG R134a and air showed generally a better performance for the larger outlet nozzle, meaning that the 39.6 mm diameter nozzle was more adequate for these operating conditions and the given inlet diameter of 25 mm. For the 32 mm nozzle, the propulsor thrust with the LG R134a and with air were comparable throughout the velocity range of 8–18 m/s with a little advantage for the R134a at the higher velocity range. When using the larger outlet nozzle, 39.6 mm diameter, air showed a somewhat better performance at the low velocity range. However, above approximately 15 m/s (about 29 knots), the R134a seemed to surpass the air, demonstrating an increasing thrust advantage reaching as high as 19% at 17 m/s (about 33 knots).
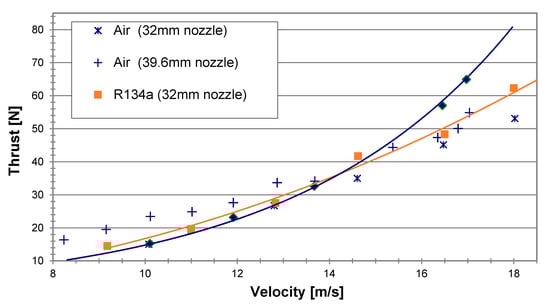
Figure 13.
Test results of the thrust vs. velocity for LG R134a and air at a constant air-equivalent flow rate of 15.3 g/s for nozzle exit diameters of 32 mm and 39.6 mm.
The second liquefied gas tested was butane, C4H10 (also called n-butane). It liquefied at a pressure of about 2 atmospheres, and its normal boiling (saturation) temperature at atmospheric pressure was about −0.5 °C, hence, its superheat level was lower than that of the R134a. Practically, testing butane required the addition of a safety sprinkler system to the tow pool setup, for the absorption of the gas and reduction of flammability risk.
The properties of butane at its saturation (boiling) temperature at atmospheric pressure (−0.49 °C), taken from the NIST Chemical Webbook Database [33], are presented in Table 2.
Table 2.
Saturation properties of butane at atmospheric pressure (−0.49 °C), from NIST Chemical Webbook Database [33].
Figure 14 presents a comparison of thrust vs. vessel velocity between experiments conducted with air and those employing liquefied gas butane at an air-equivalent mass flow rate of 17 g/s. As in the other cases, the results with the outlet nozzle with a 39.6 mm diameter were better than the data obtained for the 32 mm nozzle at the same operating conditions and similar water temperatures (24 °C and 21 °C, respectively). While at the lower speed range the results with butane were comparable and somewhat lower than those obtained with air, at velocities exceeding about 15 m/s, the liquefied gas seemed to outperform the air, demonstrating a peak thrust advantage as high as about 40% between 16 and 17 m/s.
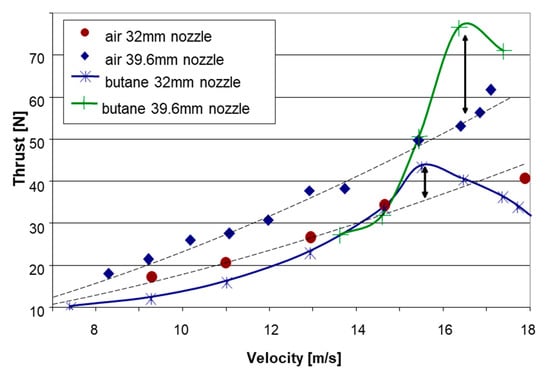
Figure 14.
Test results of the thrust vs. velocity for LG butane and air at a constant air-equivalent flow rate of 17 g/s for nozzle exit diameters of 32 mm and 39.6 mm.
The thrust advantage revealed by both liquefied fuels, R134a and butane, over air, indicates that, at certain operating conditions, a part of the potential expansion work due to phase change may be realized for increasing the bubbly jet velocity, contributing to the thrust. R134a exhibits a large overheat implying very fast boiling and a highly non-equilibrium growth of volume; hence, from the thermodynamic standpoint, the contribution of a phase change to actual expansion work is small. In addition, an abrupt increase in gas volume may result in a blockage effect, reducing efficiency. Hence, also in the case of the use of air, a gradual introduction along the mixing chamber is preferable. Butane boils more slowly than R134a due to lower superheat, hence the expansion because of a phase change is more gradual and may have a better contribution to the overall work done by the gas on the flow. The drop-off in thrust after the peak may be due to insufficient residence time for phase change when the vessel speed exceeds a certain value, depending on the propulsor geometry and size.
5. Conclusions
This study is one of a few attempts to adapt the marine ramjet principle to underwater operation, and the only one known to use the method of phase transfer. Storing of a pressure liquefied gas (LG) at a superheat condition can serve as a compact onboard source of bubbles for a submerged propulsion unit, resulting from the boiling of the LG droplets injected into the water stream within the propulsor. Thermodynamic analysis of the power cycle reveals a potential for additional expansion work because of the growing bubbles due to phase change and, hence, more thrust compared to air at similar air-equivalent flow rates
Experiments employing two liquefied gases, a refrigerant gas R134a and butane, were conducted in a 10-m diameter tow pool with a submerged propulsor moving at a range of velocities from about 7 to 18 m/s (14–35 knots). A comparison to the use of air revealed comparable results with a somewhat lower performance of the LG at the low speed range. However, at velocities exceeding about 15 m/s, the liquefied gases demonstrated a thrust advantage over air, reaching a peak increase of up to 19% for R134a and 40% for butane. This additional thrust may be attributed to the phase change process, as shown in the thermodynamic analysis. Two outlet nozzles were tested (39.6 and 32 mm diameter), revealing better performance for the larger nozzle. This is one of the parameters, which shows that efficient operation of the multiphase marine ramjet, in general, and realization of the phase-change expansion work of LG, in particular, need a careful design. It should minimize the blockage effect and highly non-equilibrium situations and ensure complete boiling of the LG within the propulsor before expulsion through the outlet nozzle.
Author Contributions
H.D.H.: Experimental investigation, data acquisition, analysis, first draft. A.G.: Concept, evaluation of data and analysis, overall supervision, final manuscript writing. E.E.: Two-phase flow analysis, data consideration, team discussion. All authors have read and agreed to the published version of the manuscript.
Funding
This research received no external funding.
Conflicts of Interest
The authors declare no conflict of interest.
References
- Gany, A. Innovative Concepts for High-Speed Underwater Propulsion. Int. J. Energet. Mater. Chem. Propuls. 2018, 17, 83–109. [Google Scholar] [CrossRef]
- Tangren, R.F.; Dodge, C.H.; Seifert, H.S. Compressibility Effects in Two-Phase Flow. J. Appl. Phys. 1949, 20, 637–645. [Google Scholar] [CrossRef]
- Schell, C.J., Jr.; Ornoff, H. Hydro-Pneumatic Ramjet. U.S. Patent No. 3,171,379, 2 March 1965. [Google Scholar]
- Muench, R.K.; Garrett, J.H. A Review of Two-Phase Marine Propulsion. In Proceedings of the AIAA/SNAME/USN Advanced Marine Vehicles Meeting, Annapolis, MD, USA, 17–19 July 1972. AIAA Paper 72-589. [Google Scholar]
- Mottard, E.J.; Shoemaker, C.J. Preliminary Investigation of an Underwater Ramjet Powered by Compressed Air; NASA TN-D-991: Washington, DC, USA, 1 December 1961. [Google Scholar]
- Witte, J.H. Predicted Performance of Large Water Ramjets. In Proceedings of the AIAA 2nd Advanced Marine Vehicles and Propulsion Meeting, Seattle, WA, USA, 21–23 May 1969. AIAA Paper 69-406. [Google Scholar]
- Greiner, L. (Ed.) Underwater Missile Propulsion; Compass Publications, Inc.: Arlington, VA, USA, 1967. [Google Scholar]
- Amos, R.G.; Maples, G.; Dyer, D.F. Thrust of an Air-Augmented Waterjet. J. Hydronaut. 1973, 7, 64–71. [Google Scholar] [CrossRef]
- Chernyy, I.M. Optimal Parameters and Efficiency of Gas-Water Jet Engines Operating on Cold and Hot Gas. Fluid Mech. -Sov. Res. 1977, 6, 87–105. [Google Scholar]
- Albagli, D. Characterization of High Speed Bubbly Flows in Underwater Jet Propulsion Systems. Ph.D. Thesis, Technion–Israel Institute of Technology, Haifa, Israel, 1992. [Google Scholar]
- Koren, O. Water Tank Testing of a Laboratory Two-Phase Marine Ramjet Engine. Master’s Thesis, Faculty of Aerospace Engineering, Technion–Israel Institute of Technology, Haifa, Israel, 2005. [Google Scholar]
- Varshay, H.; Gany, A. Underwater Two-Phase Ramjet Engine. U.S. Patent No. 5,598,700, 4 February 1997. [Google Scholar]
- Varshay, H.; Gany, A. Underwater Two-Phase Ramjet Engine. U.S. Patent No. 5,692,371, 2 December 1997. [Google Scholar]
- Valensy, S. Parametric Sea Trials of Marine Ramjet Engine Performance. Master’s Thesis, Faculty of Aerospace Engineering, Technion–Israel Institute of Technology, Haifa, Israel, 2005. [Google Scholar]
- Gany, A.; Gofer, A. Study of a Novel Air Augmented Waterjet Boost Concept. J. Ship Prod. Des. 2014, 30, 1–6. [Google Scholar] [CrossRef]
- Gany, A. Analysis of a New Thermodynamic Power Cycle for a Two-Phase Waterjet. In Proceedings of the International Conference Waterjet Propulsion 4, The Royal Institute of Naval Architects (RINA), London, UK, 26–27 May 2004. [Google Scholar]
- Albagli, D.; Gany, A. High Speed Bubbly Nozzle Flow with Heat, Mass, and Momentum Interactions. Int. J. Heat Mass Transf. 2003, 46, 1993–2003. [Google Scholar] [CrossRef]
- Mor, M.; Gany, A. Analysis of Two-Phase Homogenous Bubbly Flows Including Friction and Mass Addition. J. Fluid Eng. Trans. ASME 2004, 126, 102–108. [Google Scholar] [CrossRef]
- Chahine, G.L.; Hsiao, C.-T.; Choi, J.-K.; Wu, X. Bubble Augmented Waterjet Propulsion: Two-Phase Model Development and Experimental Validation. In Proceedings of the 27th Symposium on Naval Hydrodynamics, Seoul, Korea, 5–10 October 2008; pp. 1127–1143. [Google Scholar]
- Singh, S.; Fourmeau, T.; Choi, J.K.; Chahine, G.L. Thrust Enhancement Through Bubble Injection into an Expanding-Contracting Nozzle with a Throat. J. Fluids Eng. 2014, 136, 071101-1–071101-10. [Google Scholar] [CrossRef]
- Wu, X.; Choi, J.-K.; Nye, A.L.; Chahine, G.L. Effect of Nozzle Type on the Performance of Bubble Augmented Waterjet Propulsion. In Proceedings of the 4th International Symposium on Marine Propulsors (SMP’15), Austin, TX, USA, 31 May–4 June 2015; pp. 122–134. [Google Scholar]
- Gowing, S.; Mori, T.; Neely, S. Research on Two Phase Waterjet Nozzles. J. Fluid Eng. 2010, 132, 121302-1–121302-9. [Google Scholar] [CrossRef]
- Zhang, J.; Xia, Z.; Huang, L.; Ma, L. Experimental and Numerical Parametric Studies on Two-Phase Underwater Ramjet. J. Propuls. Power 2018, 34, 161–169. [Google Scholar] [CrossRef]
- Zhang, J.; Xia, Z.; Huang, L.; Ma, L. Power Cycle Analysis of Two-Phase Underwater Ramjet. Appl. Ocean Eng. 2018, 71, 69–76. [Google Scholar] [CrossRef]
- Schoeffl, R. The Use of Triethylaluminum (TEA) as Underwater Ramjet Propulsion Fuel. In Proceedings of the 24th Joint Propulsion Conference, Boston, MA, USA, 11–13 July 1988. AIAA Paper 88-2889. [Google Scholar]
- Hacker, D.S.; Lieberman, P. Thermodynamic Performance Evaluation of a Hydroduct Using a Thermite Fuel. J. Hydronaut. 1969, 3, 139–144. [Google Scholar] [CrossRef]
- Yang, Y.; He, M. Thermodynamic Cycle Analysis of Ramjet Engines Using Magnesium-Based Fuel. Aerosp. Sci. Technol. 2012, 22, 75–84. [Google Scholar] [CrossRef]
- Hu, J.; Han, C.; Xia, Z.; Huang, L.; Huang, X. Experimental Investigation on Combustion of High-Metal Magnesium-Based Hydroreactive Fuels. J. Propuls. Power 2013, 29, 692–698. [Google Scholar] [CrossRef]
- Ramakrishnan, M.; Chakravarthy, S.R.; Kandasamy, J.; Sarathi, R. Development of Nano-Al Based Highly Metalized Fuel-Rich Propellant for Water Ramjet Propulsion Applications. Propellants Explos. Pyrotech. 2020, 45, 1026–1040. [Google Scholar] [CrossRef]
- Eisen, N.; Gany, A. Theoretical Performance Evaluation of a Marine Solid Propellant Water-Breathing Ramjet Propulsor. J. Mar. Sci. Eng. 2020, 8, 8. [Google Scholar] [CrossRef]
- Haustein, H.D.; Gany, A.; Elias, E. Rapid Boiling of a Two-Phase Droplet in an Immiscible Liquid at High Superheat. J. Heat Transf. 2009, 131, 121010-1–121010-7. [Google Scholar] [CrossRef]
- Varshay, H. Development of a System for Feasibility Study of Underwater Jet Propulsion. Master’s Thesis, Faculty of Aerospace Engineering, Technion–Israel Institute of Technology, Haifa, Israel, 1993. [Google Scholar]
- NIST Chemistry WebBook. Standard Reference Database No. 69. 2018. Available online: http://webbook.nist.gov/chemistry/ (accessed on 3 August 2020).


© 2020 by the authors. Licensee MDPI, Basel, Switzerland. This article is an open access article distributed under the terms and conditions of the Creative Commons Attribution (CC BY) license (http://creativecommons.org/licenses/by/4.0/).