Abstract
A shallow draft cylindrical barge type floater with footing close to the water surface was experimentally evaluated in waves to investigate non-linear motion characteristics. The floater was designed to be used as an option for FOWT—floating offshore wind turbines. The non-linear mechanism can be promoted due to the viscous force that acts on the footing edges and the footing interaction with the free surface. In general, the observed non-linear viscous damping is modeled as a force proportional to the square of the relative velocity between the floater and the water. Therefore, the viscous damping levels is expected to increase, and the response in waves, to decrease. However, an increase in motion responses was observed for a broad range of wave periods. An attempt was made to clarify the hydrodynamic mechanism by comparing wave tank experiments, numerical calculations by CFD—computational fluid dynamics codes, and linear potential theory codes. Regular wave tests for three different wave height conditions were carried out, including free decay tests in still waters. For CFD simulations, the OpenFOAM code was selected. For potential theory simulations, the WAMIT code was chosen. As a result of the research, three points could be highlighted and discussed: first, the hydrodynamic phenomenon that contributed to the non-linear motion of the floater was identified; second, the increase and coupling of the motions response of heave and pitch motions; and finally, the phenomenon that the footing held water mass and lifted it to the water surface. The CFD calculations were able to get good qualitative results compared with the experiments and confirmed the use of CFD as a useful tool to capture the non-linear hydrodynamic phenomenon. The linear potential theory was not able to capture the phenomenon discussed herein.
1. Introduction
In relation to the use of renewable energies in Japan, the Basic Energy Plan [1] describes that energy should be economically feasible, and non-carbon emission sources must be used to generate electric power. A new government policy was created concerning offshore wind energy development, enabling long-term exclusive use of general sea areas, support measures for wind condition surveys and design, besides the enhancement of technical standards and operation [2,3,4].
Among the offshore wind turbines, expected to be deployed on a large scale, the bottom-mounted type is in the commercial phase. Regarding FOWT—floating offshore wind turbines, technological developments are underway in Japan. Two main projects in the evaluation phase can be cited: “Fukushima Technology Demonstration Project of Floating Offshore Wind Farm” [4,5,6], implemented with the support of the Ministry of Economy, Trade and Industry; and, “Goto Technology Demonstration Project of Floating Offshore Wind Turbine” [7], implemented with the support of the Ministry of the Environment. The “Kitakyushu Project” [8] is now underway as a NEDO—New Energy and Industrial Technology Development Organization consignment project aiming to further reduce costs inviting technological concepts with contributions from all over the world. Cost reductions can be made in the technical areas of wind turbines, support floaters, moorings, construction/fabrication, transportation, and installation. As for the support floater, an overall ramification effect is expected by reducing the cost of mooring, construction/production, transportation, and installation by making the floater light and small; as a consequence, various new conceptual proposals have recently been made [9,10,11,12,13,14,15].
The Advanced Spar FOWT is characterized by its two footing structures, one close to the free surface and the other at the bottom of the platform. The top footing (close to the free surface) is responsible for large non-linear motion behaviors, mainly in the heave and pitch directions. The non-linear behaviors due to the top footing are the motivation for this study; see details of the concept in [16,17] and in Figure 1.
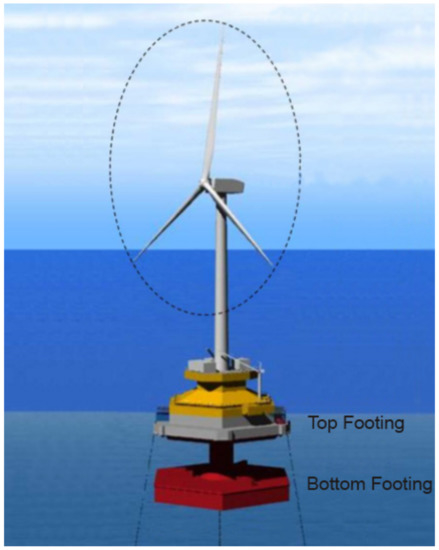
Figure 1.
The conceptual idea of the Advanced Spar FOWT type with footings.
The behavior in the waves of the Advanced Spar FOWT was detailed in [16,17]. In the present article, the geometry was simplified, and the structures below the top footing were removed. A single-column structure with footing was selected to isolate the non-linear effects due to the footing. The viscous drag force that acts on footings and skirts of floating units is usually modeled as a force proportional to the square of the relative velocity between the fluid and the moving body. It is expected to increase the damping of the floater motion and reduce the RAO—response amplitude operator; see studies conducted for monocolumn platforms [18,19]. However, the RAOs obtained from the experiments showed a remarkable increase in the wave period range around the cancellation points. This phenomenon can be seen in detail for a two-dimensional (2D) case in [20].
Conventionally, linear potential theory calculations have been widely used in the design process as a numerical calculation of floating body motions. In recent years, floater concepts observed significant non-linear hydrodynamic phenomena, such as flow separation, vortex formation, and free-surface deformation. Therefore, the floater motions cannot be calculated with the necessary accuracy by the linear potential theory. CFD—computational fluid dynamics simulation that solves Navier-Stokes equations by discretizing temporally and spatially is increasingly applied to floater motion analysis research.
This paper attempts to clarify the mechanism of a non-linear hydrodynamic phenomenon that significantly increases RAO of the heave and pitch of a cylindrical barge type FOWT for shallow waters in specific wave periods.
Regular wave experiments were performed in a towing tank to obtain RAOs of heave and pitch motions. A focus on the emergence of the footing in air and the related free-surface deformation, such as the water entrapment above the footing, was considered. The non-linear hydrodynamic phenomenon and its effect on the RAOs were clarified by comparisons between regular wave experiments, CFD simulations (by OpenFOAM code), and linear potential theory calculations (by WAMIT code).
2. Experimental Setup
2.1. Reduced Scale Model
The studied floater in the real scale is a cylindrical floater with a 45-m diameter, and it has a footing with a 55-m diameter. The thickness of the footing is 3.5 m, and the draft of the floater is 7.5 m. The experimental model of the floater used in the experiments and numerical calculations was a 1/73.5 scale model, as shown in Figure 2. It had a high enough freeboard to prevent wave overtopping.
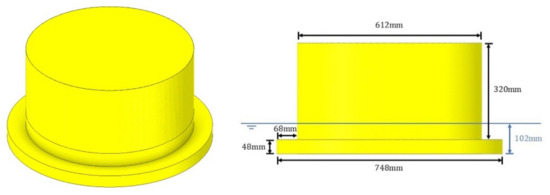
Figure 2.
Reduced scale model dimensions.
The center of gravity, —center of gravity measured from the keel, and the moment of inertia of the model were obtained by performing a pendulum test in the air, changing the fixed ballast position. —metacentric height was obtained from an incline test in which a fixed ballast was moved in the floating condition. The main properties of the model are presented in Table 1.

Table 1.
Main properties of the floater.
2.2. Wave Tank
All the experiments were carried out in a towing tank at the UTokyo—the University of Tokyo, Japan, with 85.0 m × 3.5 m × 2.4 m (length × width × depth).
In the wave experiments, 6DOF—degree-of-freedom motions of the model and the incident wave were measured. The floating body motions were measured by the Qualysis Optical Motion Capture System® comprising 4 cameras. The model was installed in the middle of a 85-m long water tank, 40 m away from the wave generator. The regular waves were previously calibrated with a wave probe installed in the same position as the experimental model during the regular wave tests. See the experimental setup views in Figure 3.
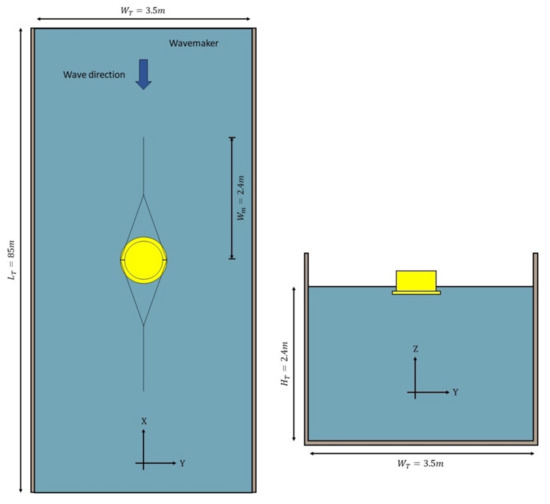
Figure 3.
Top and front views of the wave tests setup in the towing tank.
A pair of Y shape wire and soft spring was connected to avoid the drift of the model, but without constraining the motions in the other degrees of freedom. The springs had constant = 4 N/m. The effect of tension on the heave motion was sufficiently small, and it was 0.2% of the hydrostatic restoring force. The effect of tension on the pitch motion was small enough since the connection point was at the same height as the CG—center of gravity, i.e., no pitching moment was included due to the mooring line force and pre-tension. The measured natural period of surge motion was 13.3 s, and the interference in pitch and heave motions could be neglected; more details about the free decay tests are found in Table 2.
Table 2.
Free decay test results.
2.3. Experimental Conditions
Decay tests for surge, heave, and pitch were performed to obtain the natural periods and total hydrodynamic damping for each degree of freedom.
Regular wave tests were performed to obtain the RAO response of heave and pitch. The selected range of wave periods and wave height were chosen due to the limitations of the wavemaker. Three different wave heights were determined to fully understand the non-linear phenomenon, which was very susceptible to the wave height. The wave conditions details are presented in Table 3.
Table 3.
Details of the wave conditions performed.
3. Numerical Methods
3.1. CFD Model
CFD simulations were performed corresponding to the wave test conditions and compared with the experimental result to verify the accuracy of CFD calculation and to clarify the hydrodynamic phenomenon.
OpenFOAM (version: v1606 +), an open-source CFD simulation tool that allows code rewriting, was used, and waves2Foam, a toolbox of OpenFOAM for wave generation and absorption, were selected as the CFD code, see details of the codes in [21]. As a simulation solver, interDyMFoam of OpenFOAM expresses free surface as two-phase flow by VOF—Volume of Fluid method and enables to simulate floating body motion in waves. Merging waveFoam of waves2Foam, which calculates wave generation/absorption, the floating body motion, was simulated. For mesh generation, blockMesh, a structural mesh generation utility of OpenFOAM, was used to simulate the three-dimensional (3D) shallow draft floater; the unstructured mesh generation utility, snappyHexMesh, was further used to subdivide the background mesh generated by blockMesh, see Figure 4.
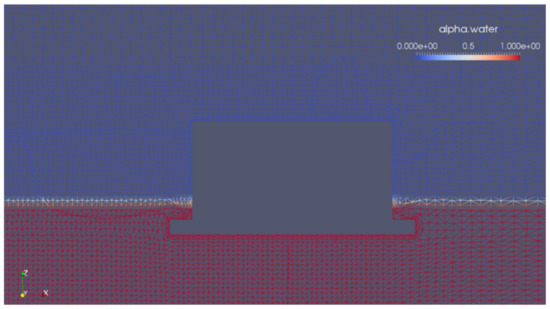
Figure 4.
Mesh details generated by blockMesh.
Much research has been conducted in recent years to compare CFD simulations and experimental results for floating body motion in waves. Comparisons between the CFD simulation using OpenFOAM and waves2Foam and the experimental results have also been performed [22,23,24]. However, in the previous studies, the comparison between the CFD simulation of floating body motion and the experimental results was conducted only for a limited number of wave conditions. From the viewpoint of the non-linearity motions of floating bodies, a large number of wave periods and wave heights are necessary to clarify the whole picture of the motion characteristics.
3.2. WAMIT Code Model
Besides the CFD code analysis, the floater behavior was also evaluated using the WAMIT code, a commercial BEM—Boundary Element Method code for analyzing wave interactions with offshore structures. The code evaluates the hydrodynamic loads through the radiation/diffraction problem in the frequency domain. Since the potential solution is a different method than the one employed in the CFD code, comparing the motion RAOs obtained with both types of software indicates how conditions each way are better at reproducing the experiments.
The WAMIT simulation was performed with a high-order mesh composed of 786 flat quadrilateral and triangular panels, as illustrated in Figure 5.
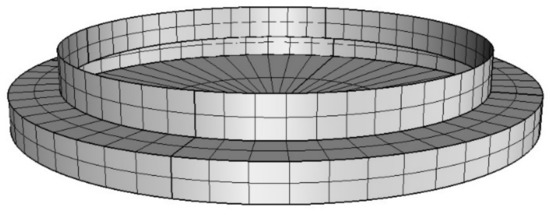
Figure 5.
High order mesh considered in the WAMIT code analysis.
Since the viscous effect is not considered in the potential theory calculation, the viscous effect was incorporated into the external damping analysis. The external damping was estimated firstly from the free decay tests and incorporated into the numerical model. The linear damping values used in the WAMIT code calculations are presented in Table 2.
4. Results
4.1. Experimental and 3D CFD Free Decay Tests
Figure 6 and Figure 7 show the time series of the free decay tests obtained from the experiment and CFD simulation for heave, and pitch, respectively. The natural periods and damping coefficients obtained for heave and pitch motions are shown in Table 4.
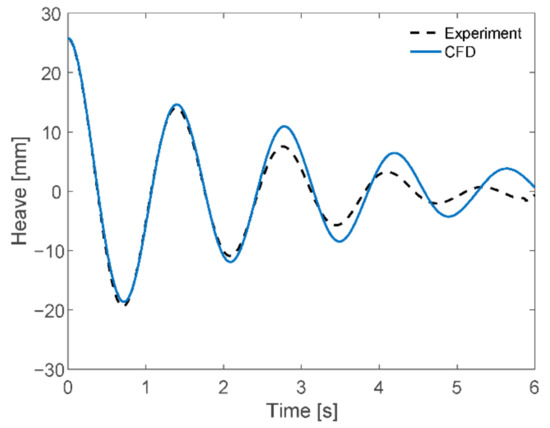
Figure 6.
Comparison of experiment and CFD simulation of heave motion.
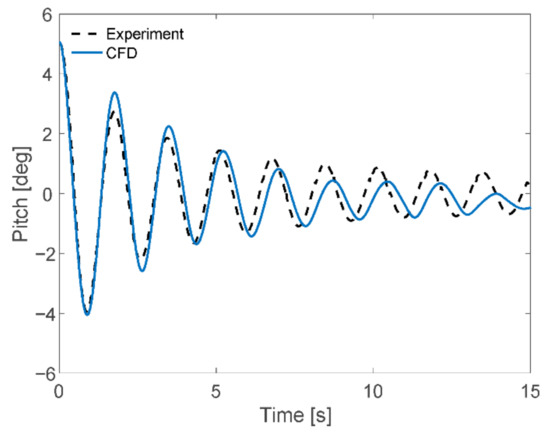
Figure 7.
Comparison of experiment and CFD simulation of pitch motion.
Table 4.
Comparison of the free decay test results for heave and pitch from experiments and CFD calculations.
The methodology to obtain the linear and quadratic damping coefficients followed the work by [25]. The detailed methods can be seen in the Appendix A. The difference between the natural period values obtained from experiments and CFD simulations was 2% and 4% for heave, and pitch motions, respectively.
Looking at the time series of free decay tests of pitch motions, see Figure 7. The experiment results showed higher attenuation in the early stages than the CFD simulations. After that, the behavior was slower; the experiment showed smaller attenuation. From this, it is observed that the secondary damping of the pitch, which is proportional to the square of the relative angular velocity, was relatively more considerable for the experiment, and the primary damping of pitch proportional to relative angular velocity was higher for the CFD simulation.
4.2. Experimental and Numerical Motion Response in Waves
The RAO heave and pitch results are shown in Figure 8 and Figure 9, respectively. Three different wave heights were evaluated to verify the non-linear effects on the RAOs.
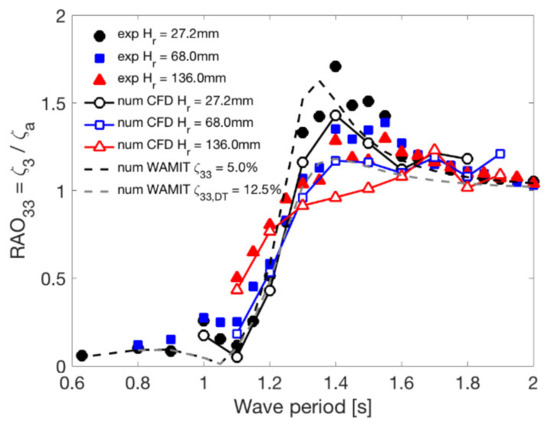
Figure 8.
RAO heave of the shallow draft cylindrical barge type floater.
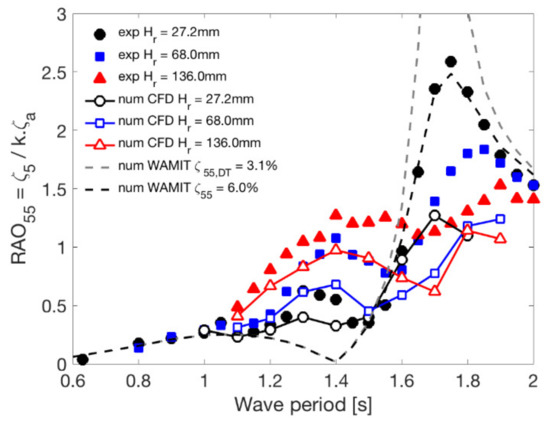
Figure 9.
RAO pitch of the shallow draft cylindrical barge type floater.
For the RAO heave, see Figure 8, the quadratic damping worked to decrease the peak response level in the heave natural period around 1.4 s, i.e., a decrease in the amplitude level was observed when increasing the wave height. The effect was the opposite in the region of the cancellation point around 1.1 s, i.e., an increase in the amplitude level was observed when increasing the wave height. The cancelation point around 1.1 s was due to the difference of pressure on the bottom and top of the footing; the behavior is similar to the one found in the pontoons of semi-submersible platforms.
The CFD simulations showed a good qualitative agreement with the experiments and represented the trend of the RAOs. However, the amplitude levels around the resonance range of the heave motion presented a lower value around 20%, compared with the experiments. That may be due to the footing proximity and crossing/piercing the free surface phenomenon, which in the CFD simulations are considered non-linear interactions. However, the non-linear phenomenon observed in the experiment was successfully and qualitatively captured in the CFD simulation.
In WAMIT code simulations, the external damping due to the viscous effects must be included as an external linear matrix. Two different linear damping levels were simulated in the WAMIT code. The first one used the value from the decay tests, , and the second used the calibrated value to match the RAO heave peak value for the lowest wave height tested . As seen in Figure 8, the damping value from decay tests experiments, , presented an attenuated value at the peak of the natural period of heave, around 40% lower. This difference could occur because the free decay tests were conducted for high initial conditions, which implied a large damping ratio compared with the regular wave tests with low wave amplitude. Low external damping, , could present a good agreement between the numerical and experimental RAO heave; the peak value presented similar values; however, the non-linearity of the physical phenomenon around the heave resonance was not represented.
For the RAO pitch results, see Figure 9, the quadratic damping worked to decrease the peak response level on the pitch natural period around 1.7 s, i.e., a decrease in the amplitude level was observed when increasing the wave height. Again, the effect was the opposite in the region of the cancellation point around 1.4 s, i.e., an increase in the amplitude level was observed when increasing the wave height. The non-linear phenomenon for pitch motion was remarkable.
Similar to heave motions, the CFD simulations showed a good qualitative agreement and quantitative differences in the resonance and cancellation regions when compared with the experiments.
The WAMIT code calculation could not represent the remarkable non-linearity around 1.4 s, even with damping level calibrations. The damping level was only able to adjust the RAO pitch peak around the natural period. In this case, the adjustment using qualitatively and quantitatively represented the resonance region well.
In the wave range from 1.1 s up to 1.6 s, the experimental and CFD pitch responses were larger than the potential theory since the viscous forces were presented. In the potential theory, the viscous forces were not included. One alternative to represent the experiment is to have additional terms, for example, vortex shedding and green water, as proposed in [20]. The CFD calculations represented the viscous forces, and the pitch RAO results were qualitatively well evaluated.
Experiments and CFD simulations were performed for the floater, changing the wave height and the wave period of the incident wave to obtain the RAO. The wave height dependence of RAOs was examined. Furthermore, the potential theory calculation was carried out to explore the differences compared to the experimental and CFD simulations and to confirm this phenomenon non-linear behavior. Non-linearity generally means a hydrodynamic phenomenon related to the separation and generation of vortices around the footing and the emergence of the footing in air, and the free-surface deformation. These two behaviors implied the RAO dependence and the wave height due to the non-linear phenomenon. The separation and vortex generation around the footing were responsible for increasing the damping levels for high wave amplitudes and for reducing the response in the heave and pitch peaks around their respective natural periods. Conversely, the emergence of the footing in the air was responsible for increasing the response amplitudes around the cancellation points (waveless region) for high wave amplitudes. This evidence is further discussed in the following figures.
By visualization and by pressure measurements from CFD calculations, the purpose of the next discussions is to evidence the non-linear behavior due to the footing emerging in the air, i.e., when footing crosses/pierces the free surface.
In relation to the non-linear behavior of the RAO pitch depending on the wave height, it was possible to infer that the footing vertical motion was large at the wave encountered side (upstream). Using CFD simulations, the pressure difference between the upper surface and lower surface of the footing was averaged and plotted for one period of pitch motion. The pressure difference was plotted as positive when the upward force was generated by the pressure difference, as illustrated in Figure 10, and the results are presented in Figure 11 for the cases of wave heights of 27.2 mm and 136.0 mm.
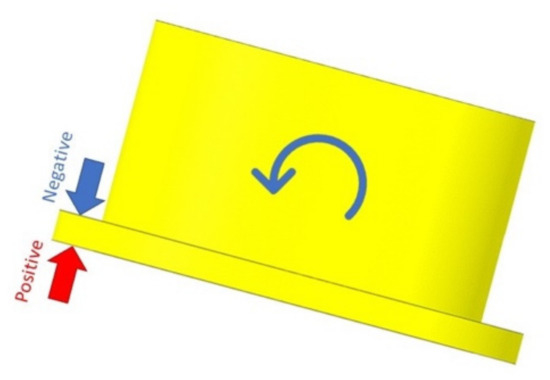
Figure 10.
Signal of the different pressure adopted: positive, upward force direction, negative, downforce direction.
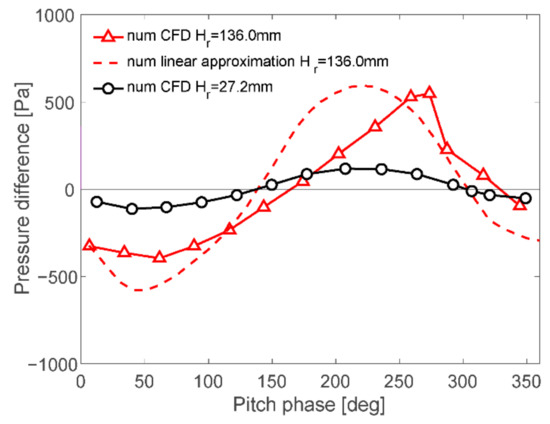
Figure 11.
Average pressure difference between upper and lower surfaces of footing on the wave side.
The pressure difference was plotted as positive when the upward force was generated by the pressure difference, as illustrated in Figure 10, and the results are presented in Figure 11. The red dashed line shows the linear extrapolation case whereby the pressure difference obtained for the lowest wave height of 27.2 mm was magnified by 5, and the pressure difference for the higher wave height case of 136.0 mm was obtained. The black line indicates the lower wave height case of 27.2 mm. At the phase 180°, where the pitch angular velocity took maximum value, the solid red line pressure difference was significantly lower than the linearly predicted value indicated by the red dashed line. The schematic of the phase angles can be seen in Figure 12. It showed that the work is given by the pitch angular velocity product and the upward pressure difference was significantly lower than the linearly predicted one. It made the pitch motion markedly larger in the experiment compared with the case linearly extrapolated from the lower wave height case.
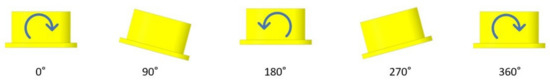
Figure 12.
Schematic of pitch phase angles and respective rotation.
The pressure fields in the central vertical section of the floater estimated by CFD simulations with the wave height of 136.0 mm are presented in Figure 13 and Figure 14. Figure 13 shows the pressure field when the wave encountered side-footing was raised, and Figure 14 shows the pressure field when the footing was lowered for the case of wave period of 1.4 s and wave height of 136.0 mm.
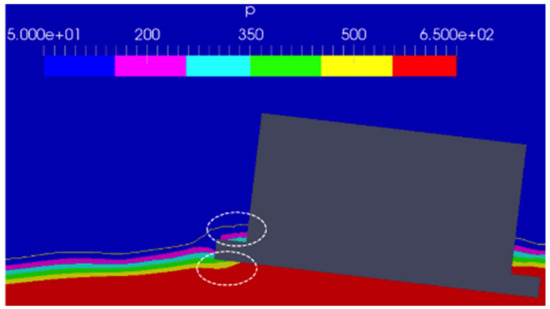
Figure 13.
Pressure in the central vertical section of the floater (pitch phase 120 degrees).
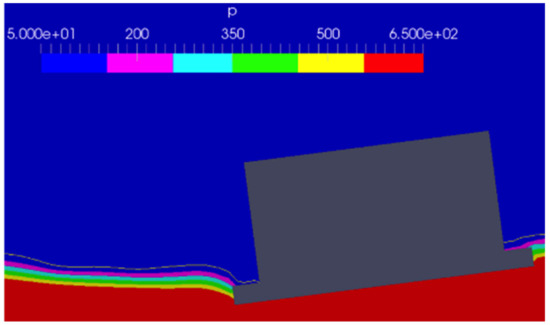
Figure 14.
Pressure in the central vertical section of the floater (pitch phase 270 degrees).
Figure 13 indicates that when the wave encountered side-footing is lifted, the footing raised just above the still water surface, but a water mass was observed to be trapped on the upper surface of the footing. Since this wave period was shorter than the natural period of pitch motion, the pitching moment and pitch had the opposite phase. Therefore, the force of pushing down the wave side-footing contributed to a further increase of pitch motion. The pressure on the lower surface of the footing was low, and it pulled the footing down and contributed to increasing pitch motion. In the state of Figure 14, when the footing went down, the inertia of the water caused delays in the flow of surrounding water to come onto the upper surface of the wave encountered side-footing. As a result, the force pushing the footing upwards became larger. This behavior also contributed to an increase in pitch motions. The same behavior can be seen in [20] for a 2D case.
5. Conclusions
Regarding the non-linear motion characteristics observed in regular waves for a shallow draft cylindrical barge type floater with footing, this hydrodynamic phenomenon was investigated to clarify the mechanism of the non-linear motion characteristics by comparing the experimental regular wave tests using the 1/73.5 scale model and numerical simulations by CFD and potential theory codes. The results and observations were as follows.
- For free decay tests, the model natural period agreed well between the experiment and CFD simulations. The quadratic model for obtaining the damping coefficients showed that the non-linear behavior of damping was mainly for pitch motions;
- For the regular wave tests, the RAO pitch was found to increase in the wave period range of 1.1 s to 1.6 s as the wave height was increased due to the viscous forces, such as vortex shedding and green water. Conversely, a significant decrease in peak height was observed for the resonance condition pitch. In the case of low wave height, the cancelation point (waveless period) and resonance peak were observed, close to the result of the linear potential calculation;
- For CFD simulations, calculating the pressure difference between the footing upper and lower surfaces on the wave encountered side-footing, the pressure on the footing was found to act in the direction of increasing the pitch motion. This was considered based on the effect that the water mass exerts on the upper surface of the wave side-footing when the coupling motion with heave makes the footing come up to the water surface;
In this study, the non-linear phenomenon was investigated by experimental model tests and corresponding CFD simulations.
The phenomenon of interest in this study is a hydrodynamic phenomenon with significant flow separation and vortex formation around the footing region and its interaction with the free surface. For this reason, the findings from this study do not necessarily reflect the phenomena of a real floater. Still, they will help clarify and understand the response characteristics of the real floater. It is necessary to examine how much the higher Re number affects the real floater phenomenon.
In this research, the focus is placed on clarifying the whole picture of RAO; some discussions were left for future studies, such as the validity of relatively rough calculation mesh in CFD simulation and the turbulence models, and the generality of the obtained knowledge, especially for a real floater.
Author Contributions
Conceptualization, H.S., H.Y. and K.K.; methodology, Y.Y. and H.H.; software, Y.S., H.H. and R.T.G.; validation, Y.S. and L.H.S.C.; formal analysis, Y.S.; investigation, Y.Y., H.H. and R.T.G.; resources, Y.Y. and H.H.; data curation, Y.S. and H.H.; writing—original draft preparation, H.S. and R.T.G.; writing—review and editing, R.T.G.; supervision, H.S., Y.Y., H.H. and R.T.G.; project administration, H.S.; funding acquisition, H.S., H.Y. and K.K. All authors have read and agreed to the published version of the manuscript.
Funding
This research is based on the results from a project supported by Japan Marine United Corporation (JMU), Japan.
Institutional Review Board Statement
Not applicable.
Informed Consent Statement
Not applicable.
Data Availability Statement
Not applicable.
Acknowledgments
The authors would like to express sincere thanks to S. Hirabayashi from the University of Tokyo (UTokyo), Japan, for giving us valuable advice on CFD simulation. The authors would also like to thank T. Kato, the technical staff of the towing tank of UTokyo, for his technical support in conducting the experiments. The authors also would like to thank Marques, M. A. from the Federal zUniversity of Pernambuco (UFPE), Brazil, for his help during the image developments; and E. B. Malta from Technomar Engenharia Oceânica, Brazil, for his help developing the WAMIT code implementations.
Conflicts of Interest
The authors declare no conflict of interest.
Nomenclature
| metacentric radius | |
| center of gravity | |
| metacentric height | |
| regular wave height | |
| spring constant | |
| distance from the buoyance center to the keel point | |
| center of gravity measured from the keel | |
| Natural period of heave | |
| Natural period of pitch | |
| Linear damping of heave | |
| Linear damping of heave from free-decay tests | |
| Linear damping of pitch | |
| Linear damping of pitch from free-decay tests |
Appendix A
Appendix A.1. Linear Damping
The most common way to determine the viscous damping is through free decay tests. The equation of motions for the free decay tests, considering only the linear damping and no external forces, is a simplification of Equation (A1) as:
where the sum between and can be written as . This equation is linear and can be written in a non-dimensional form as:
where is a percentage of critical damping (=) and is the natural frequency of the motion (). Equation (A2) is linear, and its solution can be written as:
where is the initial condition of motion. An exponential fitted curve can be adjusted through amplitude peaks , parameters (a) and (b) from exponential fit can be found as:
where is the damped natural frequency obtained from the oscillations of free decay tests. Thus, natural frequency can be written as:
Appendix A.2. Quadratic Damping
The floating unit dynamic can present a non-linear behavior due to the damping forces. Studies have shown that the quadratic Equation (A6) is more appropriate to represent the viscous damping forces.
or in other form as:
For evaluating term , first the linearization of term is performed as follows:
The linearization in Equation (A8) allows writing:
Equation (A9) can be used to determine the values of and . Details about this procedure can be found in [26].
References
- Ministry of Economy, Trade and Industry. Strategic Energy Plan. Available online: https://www.meti.go.jp/english/press/2018/0703_002.html (accessed on 7 July 2018).
- Ministry of Justice, Japan. Act on Promoting the Utilization of Sea Areas for the Development of Marine Renewable Energy Power Generation Facilities. Available online: http://www.japaneselawtranslation.go.jp/law/detail/?id=3519&vm=04&re=02 (accessed on 5 May 2020).
- Ministry of Economy, Trade and Industry. Official Explanation of Technological Standards for Offshore Wind Power Facilities (Revised) Released. Available online: https://www.meti.go.jp/english/press/2020/0327_006.html (accessed on 18 March 2020).
- NEDO—New Energy and Industrial Technology Development Organization. NEDO Activity Report: Annual Report FY2018. Available online: https://www.nedo.go.jp/content/100898902.pdf (accessed on 5 May 2020).
- Fukushima Offshore Wind Consortium. Fukushima Floating Offshore Wind Farm Demonstration Project (Fukushima FORWARD)—Construction of Phase I. Available online: http://www.fukushima-forward.jp/english/pdf/pamphlet4.pdf (accessed on 18 March 2020).
- Fukushima Offshore Wind Consortium. Fukushima Floating Offshore Wind Farm Demonstration Project (Fukushima FORWARD)—Construction of Phase II. Available online: http://www.fukushima-forward.jp/english/pdf/pamphlet5.pdf (accessed on 18 March 2020).
- Ministry of Environment, Japan. 2010 Renewable Energy Introduction Potential Survey Report (in Japanese). Available online: http://www.env.go.jp/earth/report/h23-03/index.html (accessed on 18 March 2020).
- Glocal. Next Generation Floating Offshore Wind Power Generation System Demonstration Research (Barge Type). Available online: https://g-local.co.jp/works/barge/ (accessed on 18 March 2020).
- Raventos, A. Development of a second generation floating platform for offshore wind. In Proceedings of the Floating Offshore Wind Turbines Conferences, Montpellier, France, 24–26 April 2019. [Google Scholar]
- Stiesdal, H. The tetraspar demo design and status of an industrialized floating offshore wind turbine demonstration unit. In Proceedings of the Floating Offshore Wind Turbines Conferences, Montpellier, France, 24–26 April 2019. [Google Scholar]
- Lemmer, F.; Raach, S.; Schlipf, D.; Cheng, P.W. A new lightweight wave canceling semi-submersible design. In Proceedings of the Floating Offshore Wind Turbines Conferences, Montpellier, France, 24–26 April 2019. [Google Scholar]
- Guyot, M. How floating wind will enable 40€/MWh? In Proceedings of the Floating Offshore Wind Turbines Conferences, Montpellier, France, 24–26 April 2019. [Google Scholar]
- Suzuki, H.; Xiong, J.; Carmo, L.H.S.; Vieira, D.P.; Mello, P.C.; Malta, E.B.; Simos, A.N.; Hirabayashi, S.; Gonçalves, R.T. Elastic response of a light-weight floating support structure of FOWT with guywire supported tower. J. Mar. Sci. Technol. 2019, 24, 1015–1028. [Google Scholar] [CrossRef]
- Mello, P.C.; Malta, E.B.; Silva, R.O.P.; Candido, M.H.O.; Carmo, L.H.S.; Alberto, I.F.; Franzini, G.R.; Simos, A.N.; Suzuki, H.; Gonçalves, R.T. Influence of heave plates on the dynamics of a floating offshore wind turbine in waves. J. Mar. Sci. Technol. 2020. [Google Scholar] [CrossRef]
- Shiohara, H.; Gonçalves, R.T.; Houtani, H.; Suzuki, H.; Schnepf, A.; Hirabayashi, S.; Carmo, L.H.S.; Nihei, Y. Numerical and experimental comparison of the wave response of a very light floating offshore wind turbine with guy wires. In Proceedings of the ASME 2020 39th International Conference on Ocean, Offshore and Arctic Engineering, OMAE2020-19163, Fort Lauderdale, FL, USA, 21–30 June 2020. [Google Scholar]
- Yoshimoto, H.; Awashima, Y.; Kitakoji, Y.; Suzuki, H. Development of floating offshore substation and wind turbine for Fukushima FORWARD. In Proceedings of the International Symposium on Marine and Offshore Renewable Energy, Tokyo, Japan, 28–30 October 2013. [Google Scholar]
- Matsuoka, R.; Yoshimoto, H. Verification of precision concerning the design of advanced spar type structure. In Annual Spring Meeting of the Japan Society of Naval Architects and Ocean Engineers. 2015. Available online: https://www.jstage.jst.go.jp/article/conf/20/0/20_1/_article/-char/ja/ (accessed on 5 January 2021).
- Matsumoto, F.T.; Gonçalves, R.T.; Malta, E.B.; Medeiros, H.F.; Nishimoto, K.; Masetti, I. The influence at vertical first order motions using appendages in a monocolumn platform. In Proceedings of the ASME 2008 27th International Conference of Offshore Mechanics and Arctic engineering, OMAE2008-57440, Estoril, Portugal, 15–20 June 2008. [Google Scholar]
- Gonçalves, R.T.; Matsumoto, F.T.; Malta, E.B.; Rosetti, G.F.; Fujarra, A.L.C.; Nishimoto, K. Evolution of the MPSO (monocolumn production, storage and offloading system). Mar. Syst. Ocean Technol. 2010, 5, 45–53. [Google Scholar] [CrossRef]
- Hu, C.; Kashiwagi, M. Two-dimensional numerical simulation and experiment on strongly non-linear wave-body interactions. J. Mar. Sci. Technol. 2009, 14, 200–213. [Google Scholar] [CrossRef]
- Jacobsen, G.N. waves2Foam Manual. 2017. Available online: file:///C:/Users/MDPI/AppData/Local/Temp/manualWaves2Foam_v090.pdf (accessed on 5 January 2021).
- Revera-Arreba, I.; Bruinsma, N.; Bachynsky, E.E.; Viré, A.; Paulsen, B.T.; Jacobsen, N.G. Modeling of a semi-submersible floating wind platform in severe waves. In Proceedings of the ASME 2018 37th International Conference on Ocean, Offshore and Arctic Engineering, OMAE 2018-77680, Madrid, Spain, 17–22 June 2018. [Google Scholar]
- Bruinsma, N.; Paulsen, B.T.; Jacobsen, N.G. Validation and application of a fully non-linear numerical wave tank for simulating floating offshore wind turbines. Ocean Eng. 2018, 147, 647–658. [Google Scholar] [CrossRef]
- Ming, H.; Bing, R.; Da-hong, Q. Experimental study of non-linear behaviors of a free-floating body in waves. China Ocean Eng. 2016, 30, 421–430. [Google Scholar]
- Malta, E.B.; Gonçalves, R.T.; Matsumoto, F.T.; Pereira, F.R.; Fujarra, A.L.C.; Nishimoto, K. Damping coefficient analyses for floating offshore structures. In Proceedings of the ASME 2010 29th International Conference of Offshore Mechanics and Arctic engineering, OMAE2010-20093, Shanghai, China, 6–11 June 2010. [Google Scholar]
- Chakrabarti, S.K. Offshore structure modeling. Adv. Ser. Ocean Eng. 1994, 9, 445–451. [Google Scholar]


Publisher’s Note: MDPI stays neutral with regard to jurisdictional claims in published maps and institutional affiliations. |
© 2021 by the authors. Licensee MDPI, Basel, Switzerland. This article is an open access article distributed under the terms and conditions of the Creative Commons Attribution (CC BY) license (http://creativecommons.org/licenses/by/4.0/).