Article

Dynamic Responses for WindFloat Floating Offshore Wind Turbine at Intermediate Water Depth Based on Local Conditions in China

1
Key Laboratory of Far-Shore Wind Power Technology of Zhejiang Province, Hangzhou 311122, China
2
Powerchina Huadong Engineering Corporation Limited, Hangzhou 311122, China
3
State Key Laboratory of Coastal and Offshore Engineering, Dalian University of Technology, Dalian 116024, China
*
Author to whom correspondence should be addressed.
J. Mar. Sci. Eng. 2021, 9(10), 1093; https://doi.org/10.3390/jmse9101093
Submission received: 1 September 2021 / Revised: 29 September 2021 / Accepted: 1 October 2021 / Published: 7 October 2021
(This article belongs to the Special Issue Offshore Wind Turbine Dynamic Analysis)

Abstract

:
Offshore wind energy, a clean energy resource, is considered to be a possible alternative to fossil energy. Floating offshore wind technology is considered to be a proper concept to develop abundant wind energy in deep water. Considering the reality of offshore wind energy development in China, the floating offshore wind turbine concept is expected to be developed at moderate water depths. In this paper, a mooring system of the WindFloat semisubmersible floating offshore wind turbine (SFOWT) at a water depth of 60 m is designed. The dynamic responses of the WindFloat SFOWT under different wind–wave combination conditions are investigated using the coupled method and the simplified method, which do not include the effect of the tower top motion in the aerodynamic calculation. The results show that the dynamic responses of the WindFloat SFOWT, including the platform motions, tower loads, and mooring line tensions, perform fairly well at a moderate water depth. A comparison between the coupled method and simplified method shows that the calculated results are slightly different between the different conditions for the time domain results, response spectra results, and fatigue results. In addition, mooring line 1 (ML 1) suffers higher fatigue damage than ML2, which should be paid more attention.

1. Introduction

Fossil energy shortages and environmental pollution caused by the consumption of fossil fuels have become one of the most critical problems around the world [1,2]. Great efforts have been made to pursue clean and sustainable energy. Offshore wind energy, as an excellent substitute energy of fossil energy, is trying to move from shallow water to deep water to exploit the abundant wind energy far from the shore [3]. China is now the world’s third largest offshore market in total installation as of the end of 2019 (after the UK and Germany) [4]. As offshore wind technology moves to deeper water (over 50 m water depth), floating foundations are expected to be an active research area. Floating offshore wind turbine foundations can be divided into three types: semisubmersible [5,6], tension leg platforms [7,8], and spar [9,10]. Among all floating types, semisubmersible floating foundations are considered to be very efficient design configurations due to their low construction cost and widely applicable range of water depths [11]. Considering the energy distribution and technical reality, the floating offshore wind technology is expected to be developed mainly at moderate water depths with the application of SFOWTs.
A variety of numerical simulation and tank tests have been conducted for investigating the dynamic responses of floating an offshore wind turbine with combined wind-wave interaction. Based on the designed Windfloat SFOWT, Roddier et al. [12] investigated the dynamic responses of WindFloat SFOWT, which was equipped with a National Renewable Energy Laboratory (NREL) 5 MW offshore wind turbine at 200 m water depth through an experimental approach. Comparison of WindFloat SFOWT is made between the experiment and the numerical simulation via TimeFloat-Fast software. The response amplitude operators (RAOs) in the surge, heave, and pitch show good agreement between the numerical results and experimental results. To investigate the damping effect of the heave plate on the SFOWT, Moreno et al. [13] carried out a model test based on WindFloat SFOWT. The hexagonal and circular structure of the heave plates is explored. The results show that different shapes of the heave plates show similar trends in the hydrodynamic performance, and the maximum difference of the damping coefficient is 8%. Based on the DeepCwind project in the US [14], the University of Maine (UoM) and NREL proposed a floating offshore wind turbine concept named OC4-DeepCwind SFOWT. Additionally, the OC4-DeepCwind SFOWT was selected as the reference model for IEA Wind Task 30 (OC4 to OC6), which was used for the validation of the response quantities of the system by a comparison with the experimental data. The numerical simulations of Braceless SFOWT by Luan et al. [15] were carried out to analyze its intact stability, natural period, and dynamic global responses. Moreover, a scale model of the Braceless SFOWT has been investigated in a hybrid model test by SINTEF Ocean (Marintek).
Several papers have discussed the utilization of floating offshore wind turbines at moderate water depths. Xu et al. [16] designed the mooring systems of Braceless SFOWT at 50 m water depth. A second order wave force is considered, and a fully coupled method was used in the study to investigate the response performance of Braceless SFOWT under parked conditions. The results show that it is feasible to mount the semisubmersible floating offshore wind turbine at shallow water depths and that the second order wave force has great impacts on the dynamic responses. Zhang et al. [17] compared different floating offshore wind turbine configurations at moderate and deep water depths. The results revealed that second-order difference wave loads can excite the resonance of motion, especially for the pitch motion. Bayati et al. [18] analyzed the hydrodynamic performance of OC4-semisubmersible offshore wind turbine from deep water depths to shallow water depths, illustrating that the water depth has a great impact on the low frequency motion of the platform. Zhang et al. [19] designed a semisubmersible floating offshore wind foundation at a water depth of 60 m. Combined wind and wave environments were used to investigate the dynamic responses of the SFOWT. The motions and mooring line tensions show good performance in the ocean environment.
In this paper, the WindFloat SFOWT is used to investigate the feasibility of floating offshore wind turbines at moderate water depths. Most of papers discuss the dynamic responses of WindFloat SFOWT at deep water depth. Considering the reality of floating offshore wind turbine development in China, it is very valuable to investigate the dynamic response of WindFloat SFOWT at shallow water depths. Therefore, mooring system design for WindFloat SFOWT at 60 m water depth is carried out in this paper. A comparison between the coupled analysis and decoupled analysis is made to investigate the dynamic responses of WindFloat SFOWT at a moderate water depth. This paper may help resolve the fundamental design trade-offs between the floating-system concepts in areas with moderate water depths.

2. Theory Background

2.1. Aerodynamic Load

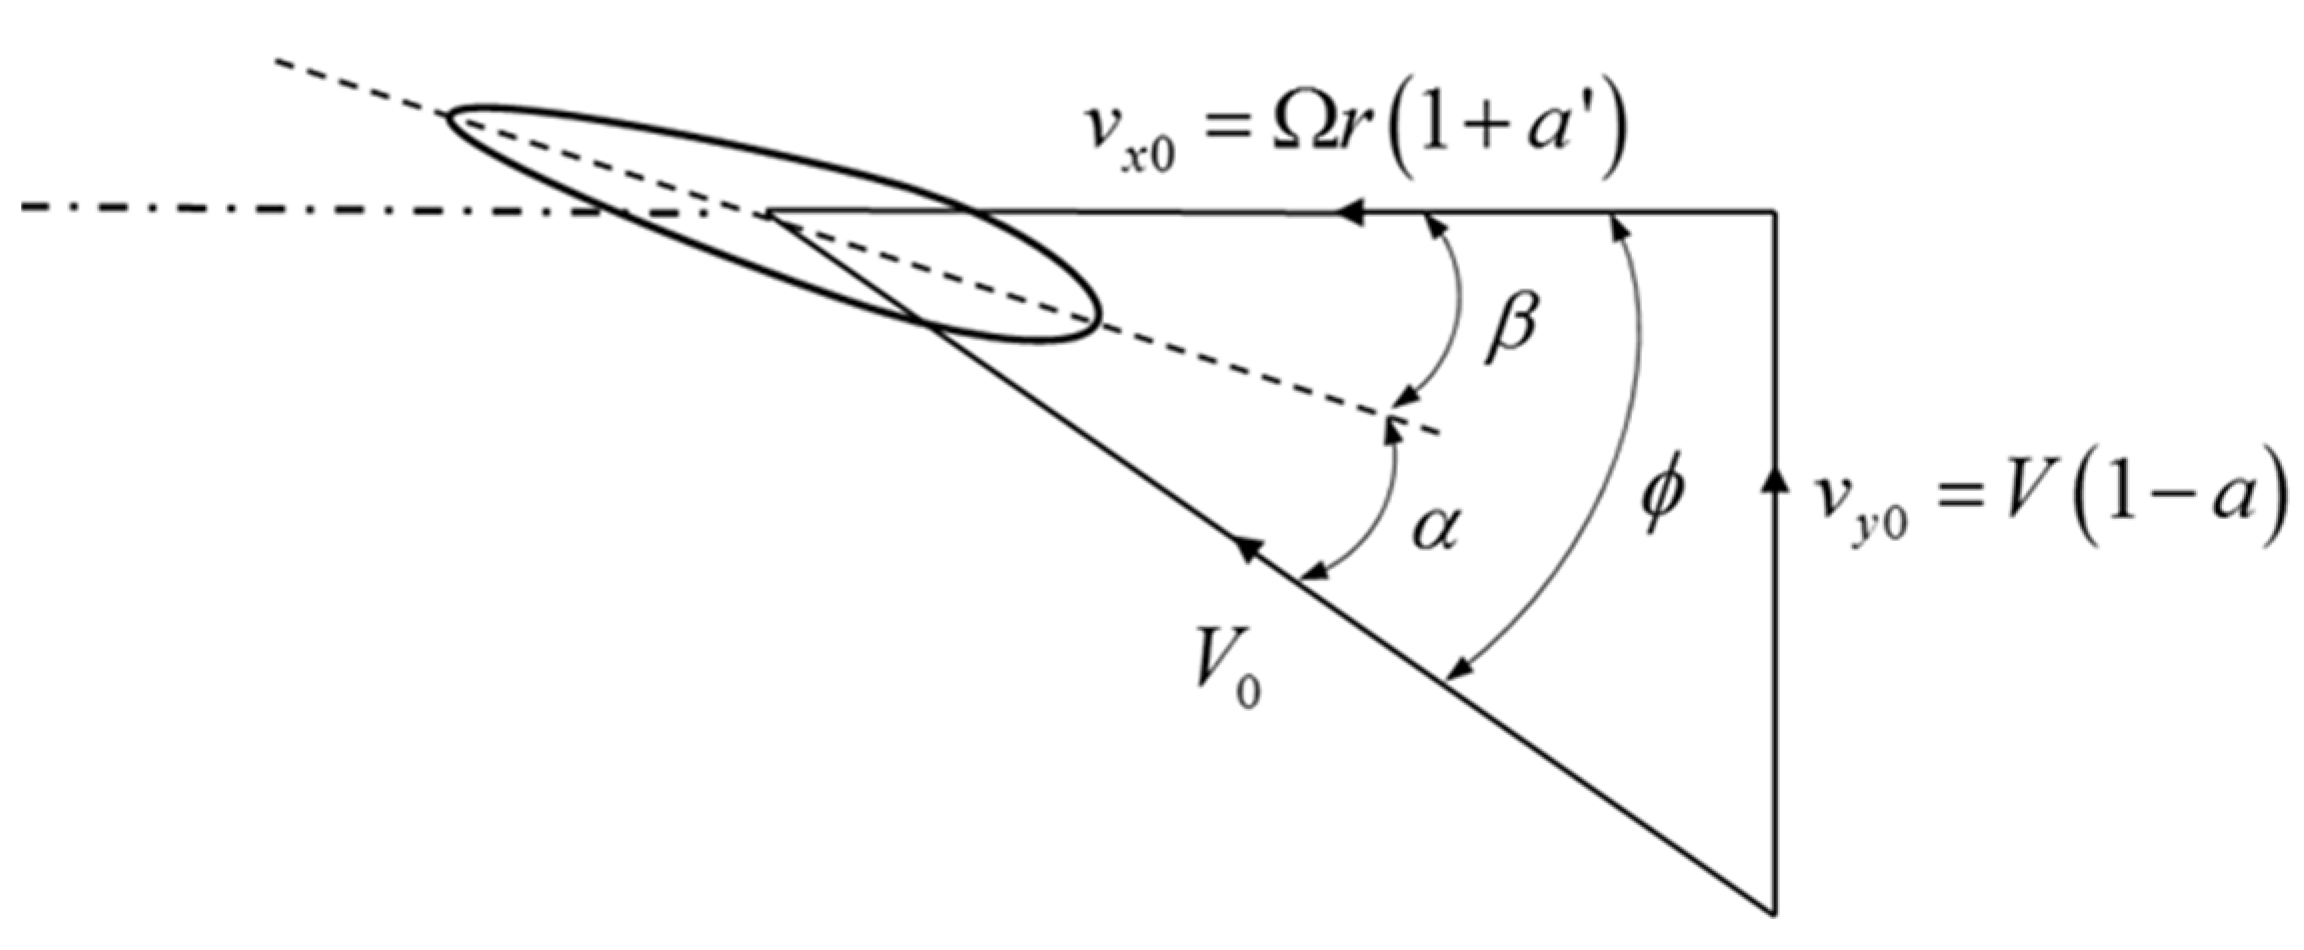
2.1.1. Blade Element Momentum Theory

In the present simulation, blade element momentum theory (BEMT) [20] is used to derive the aerodynamic load on the blade. The blade is divided into a set of elements, and the blade elements are assumed to be independent from each other. As shown in Figure 1, the aerodynamic loads are calculated by evaluating the relative inflow wind speed. The relative wind speed can be calculated by the Equation (1):
V 0 = ( 1 a ) 2 V 2 + ( 1 + a ) ( Ω r ) 2
d T = 0.5 ρ V 2 ( 1 a ) 2 sin 2 φ c ( C L cos φ + C D sin φ ) d r d M = 0.5 ρ V 2 ( 1 a ) Ω r ( 1 + a ) sin φ cos φ c ( C L sin φ C D cos φ ) r d r
where ρ is the air density, c is the chord length, and C L and C D are the lift coefficient and drag coefficient of each air foil, respectively. The NREL 5 MW wind turbine of the lift coefficient and drag coefficient can be found in [21]. It should be noted that the unsteady effects are not considered in Equation (2), which are illustrated in [22,23].

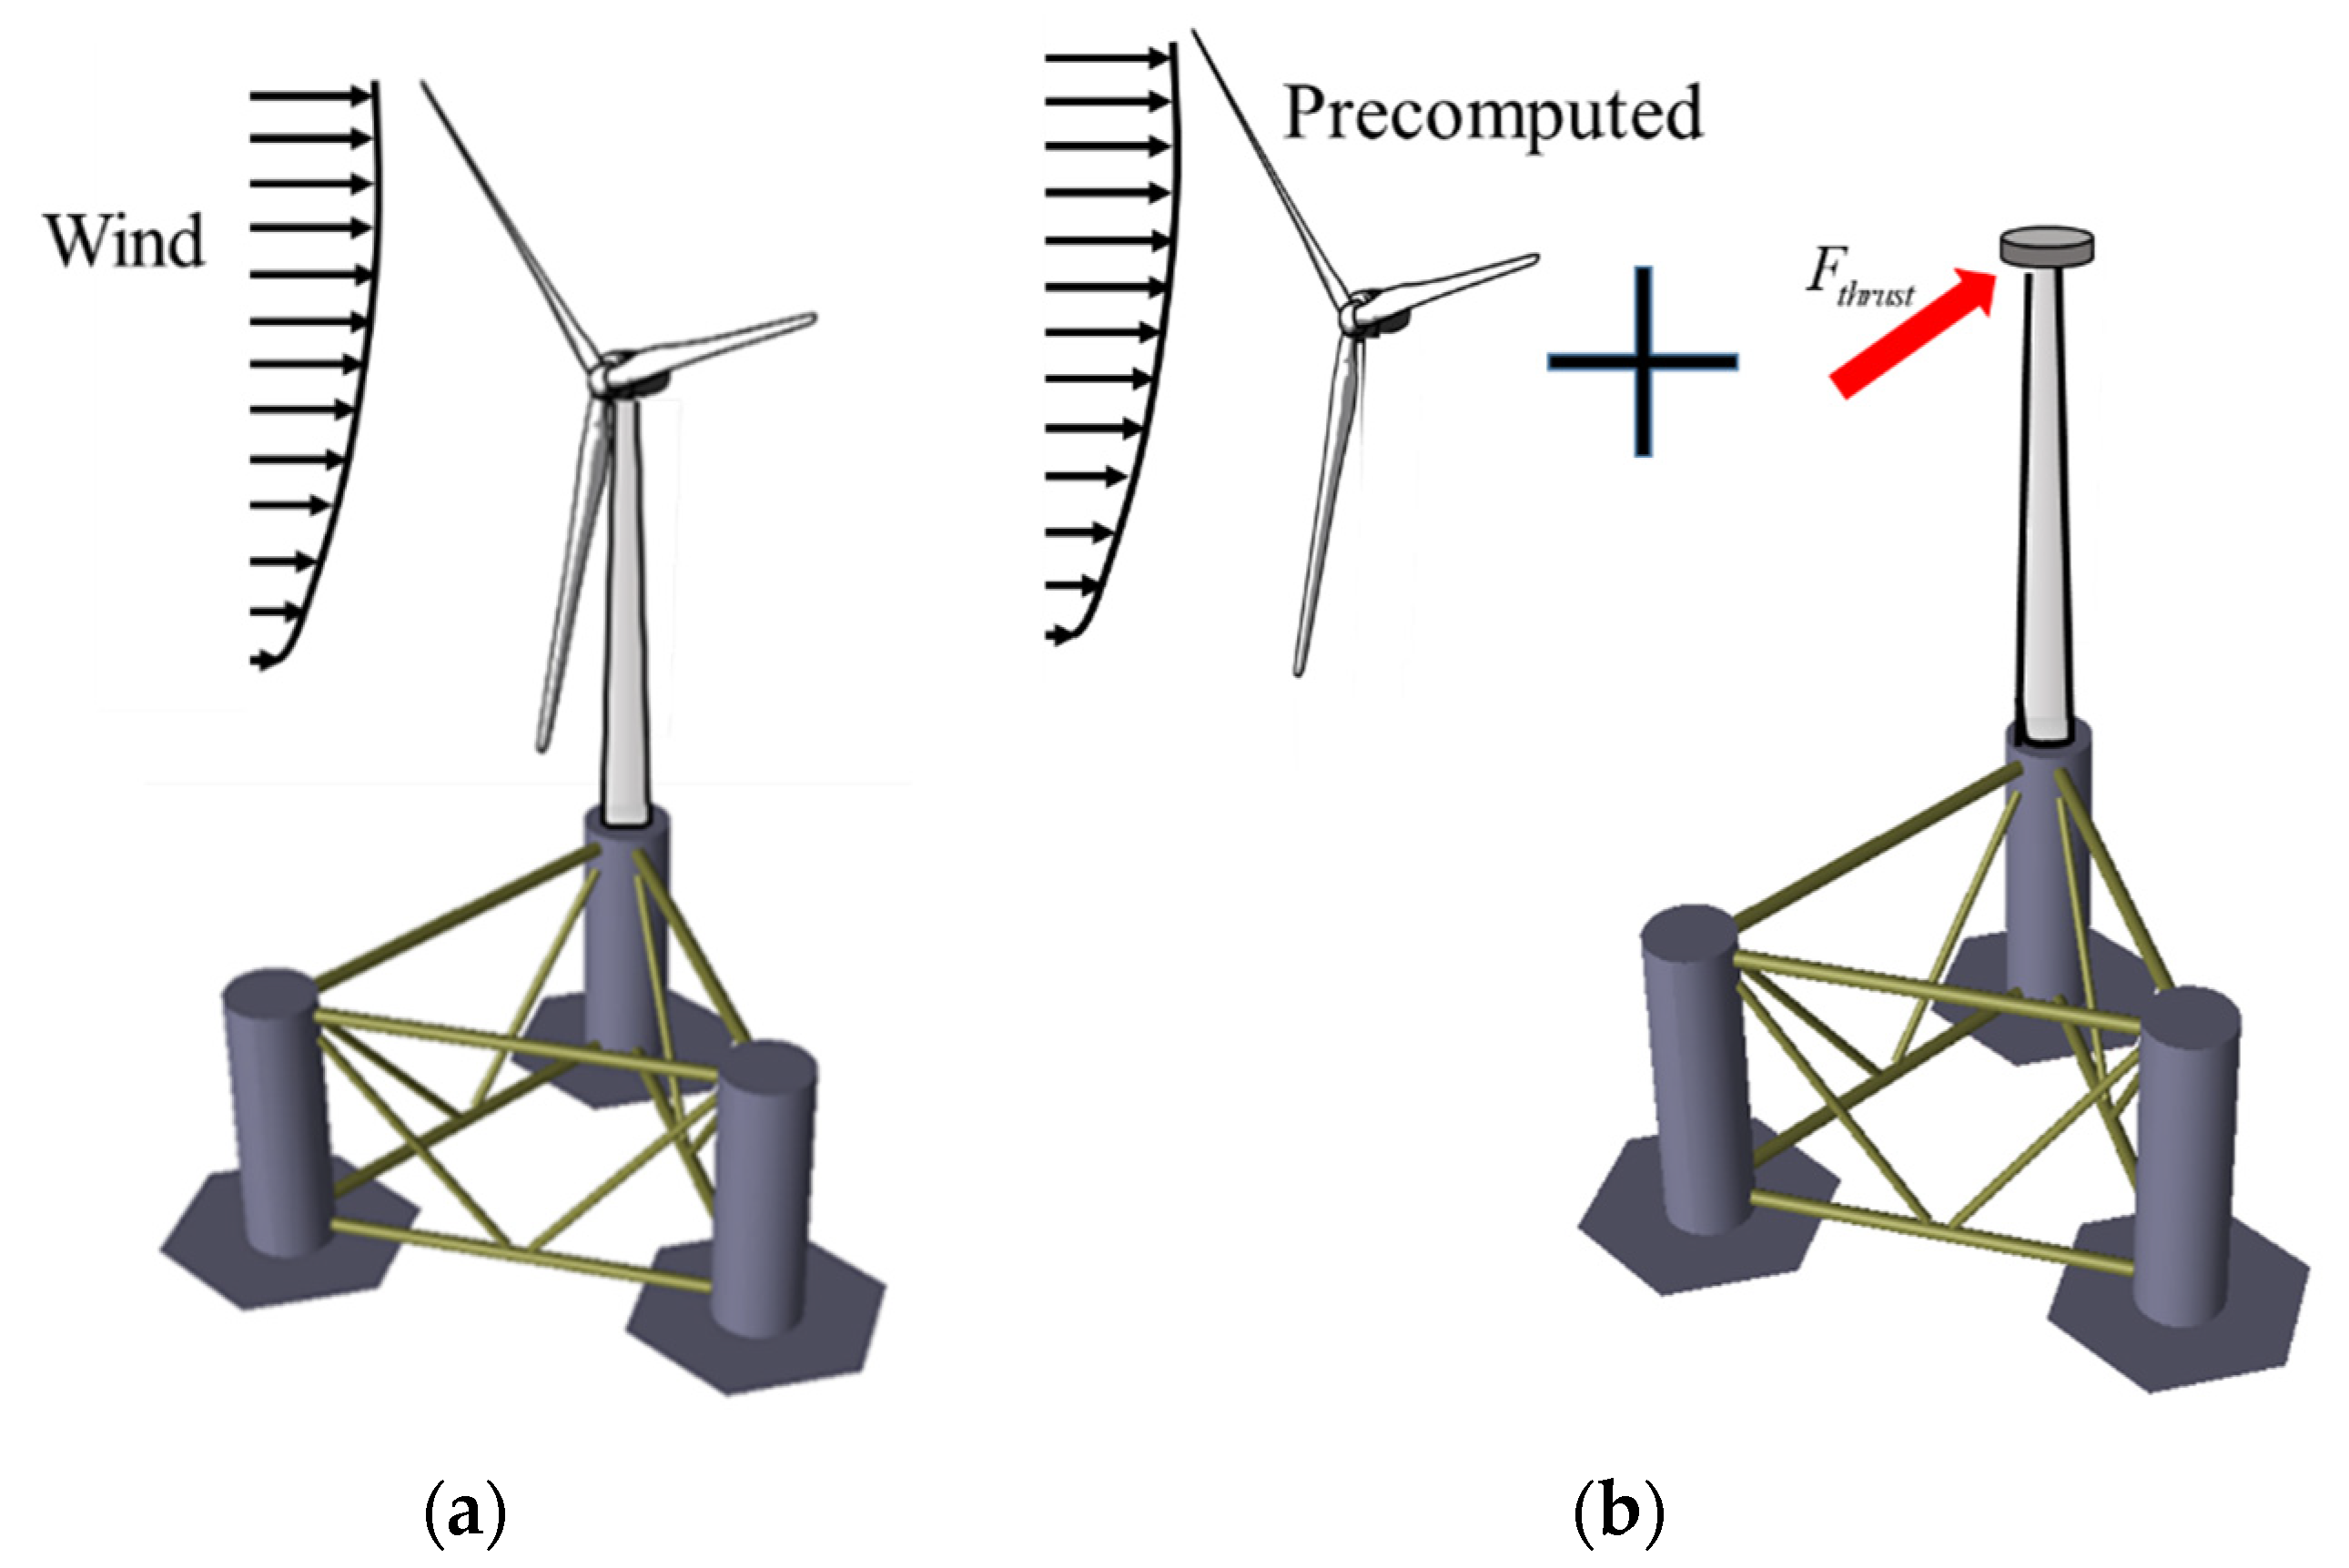
2.1.2. Aerodynamic Calculation by Coupled Method and Simplified Method

For the calculation of the rotor thrust force [24], the coupled method (Figure 2a) considers the tower top motion. When the wind turbine moves along the direction of the wind, the aerodynamic loads decrease.
For the one-dimensional model, the rotor thrust F t h r u s t with the assumption of an ideal rotor can be calculated by:
F t h r u s t = 1 2 C T ρ A V 2
where C T is the thrust coefficient, ρ is the air density, A is the rotor disc area, and V is the wind speed. The wind speed is separated into two parts, as shown below:
V = V m e a n + V t u r b
where V m e a n is the mean wind speed and V t u r b is the turbulent wind speed. Considering the tower top motion of the wind turbine, the relative wind speed V r e l can be obtained by subtracting the velocity of the tower top x ˙ t :
V r e l = V m e a n + V t u r b + x ˙ t
Then, the rotor thrust force F t o t a l can be divided into the mean thrust force F m e a n , the turbulent thrust force F t u r b and the aerodynamic damping force F d a m p i n g :
F t o t a l = 1 2 C T ρ A V m e a n 2 + 1 2 C T ρ A ( V t u r b 2 + 2 V m e a n V t u r b ) + 1 2 C T ρ A ( x ˙ t 2 2 V m e a n x ˙ t 2 V t u r b x ˙ t ) = F m e a n + F t u r b + F d a m p i n g
For the simplified method (Figure 2b) used in the present paper, the precomputed aerodynamic load from a rigid wind turbine model includes mean and turbulent part. The aerodynamic damping caused by the interaction between the wind speed and tower top motion is not considered. Firstly, the precomputed rotor thrust force is calculated from a rigid wind turbine. Secondly, the rotor thrust force is added at the hub height for the simplified method.

2.2. Hydrodynamic Theory

2.2.1. Morison Equation

For the hydrodynamic calculation of braces, the Morison equation [25] is used. The form of the Morison equation accounts for the wave-induced excitation load, added mass and, drag force. The wave loads are calculated by using the Morison equation with the following formula:
d F = 1 2 ρ C D D d z ( u x 1 ) | u x ˙ 1 | + ρ C M u ˙ π D 2 4 d z ρ ( C M 1 ) π D 2 4 d z x ¨ 1
where ρ is the water density; x 1 , x ˙ 1 and x ¨ 1 represent the floating body motion, velocity and acceleration, respectively; C D is the drag coefficient; C M is the inertia coefficient; u and u ˙ are the velocity and acceleration of water particles, respectively; D is the diameter of cylinder and d z is the length of a strip.

2.2.2. Potential Flow Theory

For a large volume floating structure, the Morison equation is not capable of calculating the hydrodynamic loads. The potential flow theory [26], assuming that the fluid is inviscid, incompressible, and irrotational, is used to calculate the hydrodynamic loads of the large floating structures. Three components of hydrodynamic loads are accounted for: hydrostatic force, radiation wave force, and wave-induced excitation force.
F = F i + F d + F r
F i + F d = s i ω ρ ϕ i n j d s s i ω ρ ϕ d n j d s j = 1 , 2…6
F R = x ¨ k ρ ω s ϕ ik Re n j d s x ˙ k ρ s ϕ i k Im n j d s = A jk x ¨ k B jk x ˙ k k = 1 , 2…6 j = 1 , 2…6
where F i is the incident wave load; F d is the diffraction wave load; F r is the radiation wave load; ω is the wave frequency; n is the normal direction vector of the wet surface; s is the wet surface area; ϕ i is the incident potential of the wave; ϕ d is the diffraction potential of the wave; ρ is the density of the water; ϕ i Re and ϕ i Im are the real and imaginary parts of the incident potential of the wave, respectively; A jk and B jk are the added mass and radiation damping coefficients, respectively; and the indices k and j refer to the degrees of freedom (DOFs) of the platform.

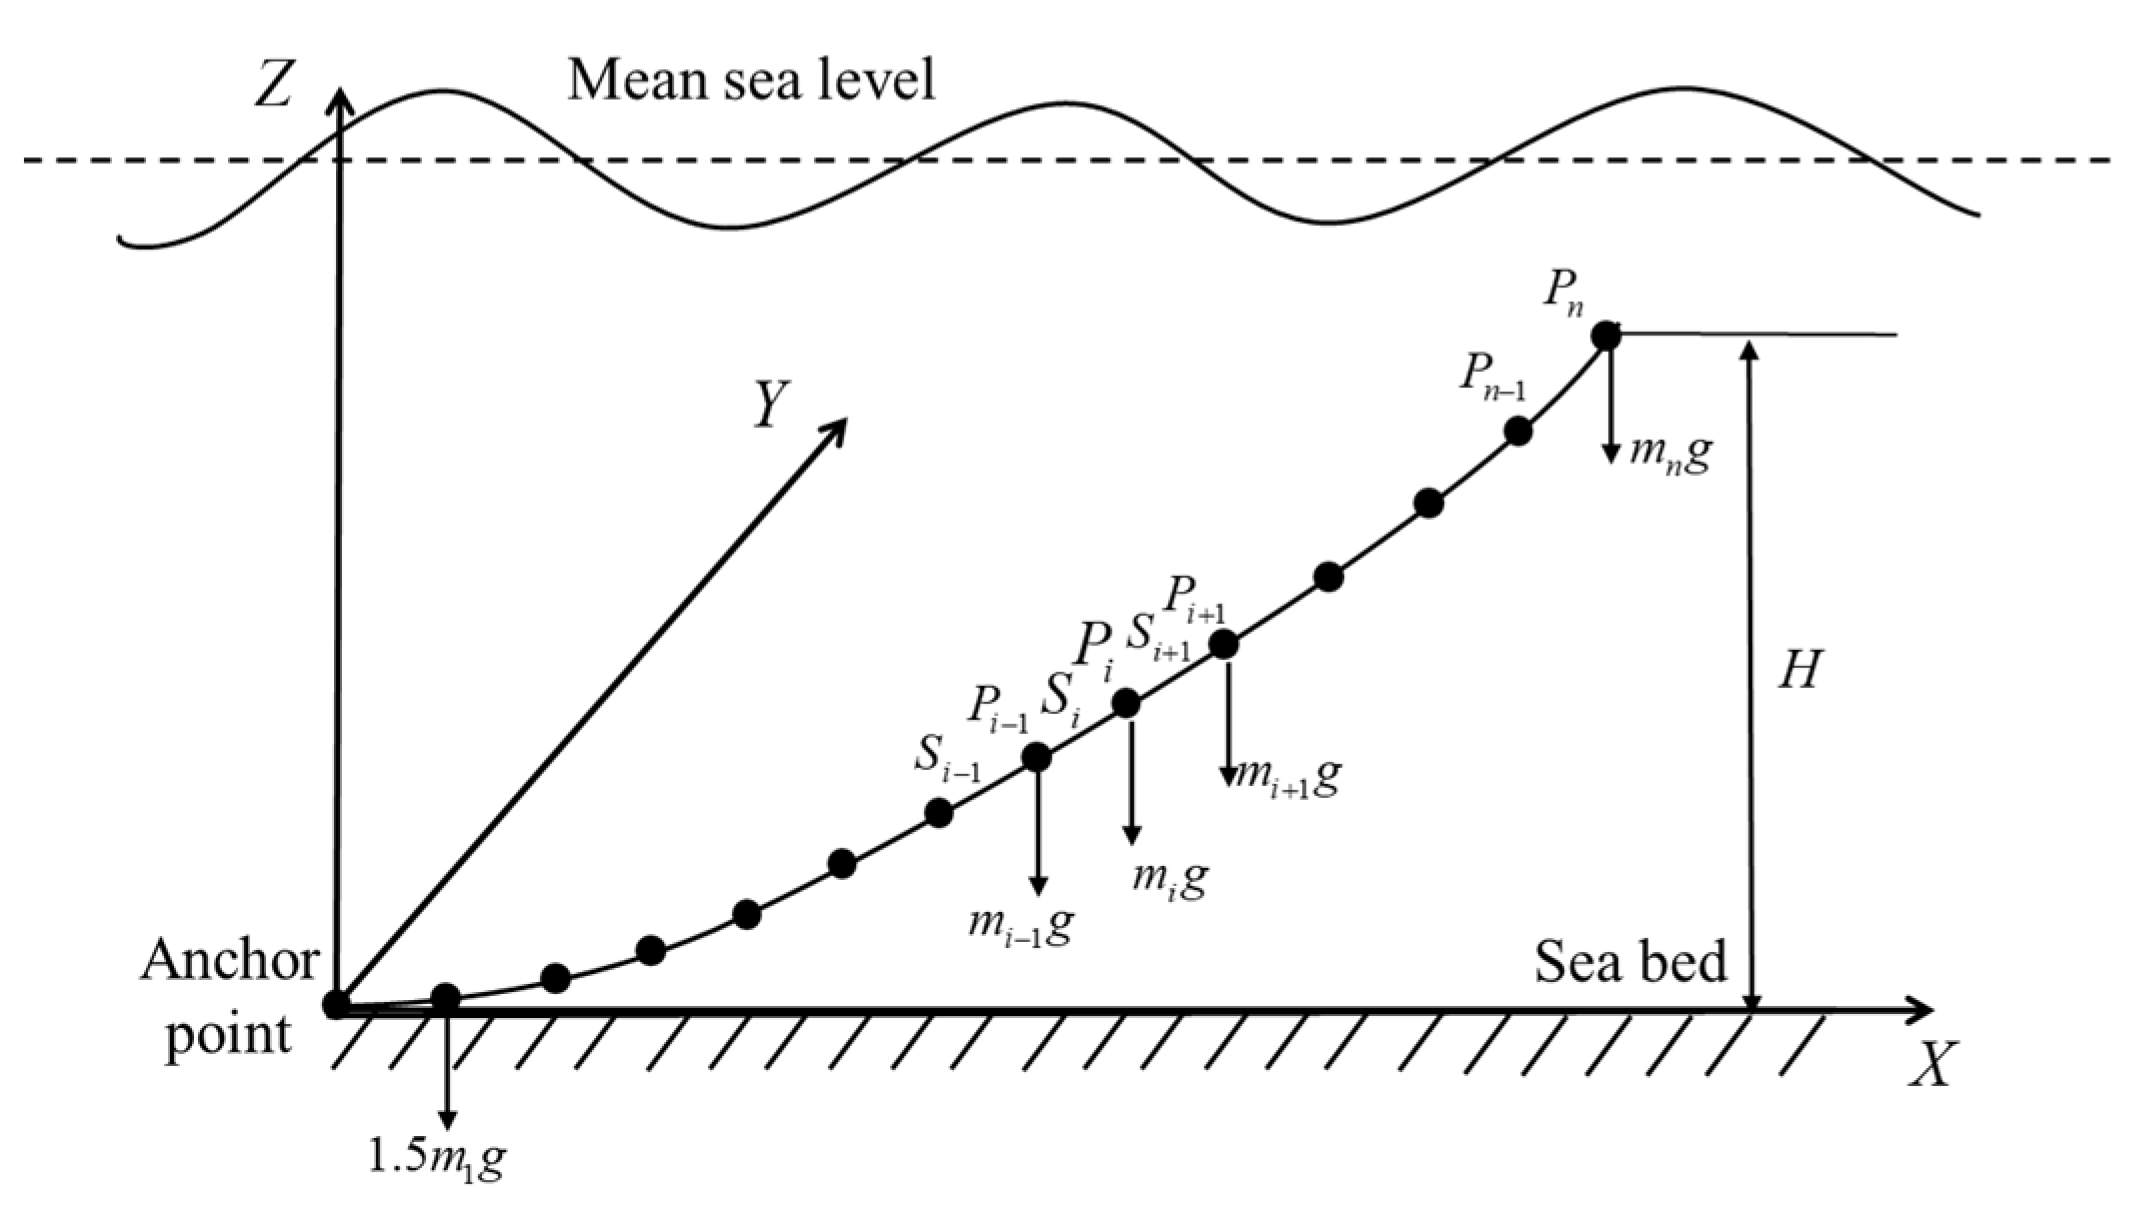
2.3. Mooring System Theory

We use the lumped-mass model [27] (Figure 3) to calculate the mooring system connected to the floating platform. For the lumped-mass method, the mooring line is divided into a set of segments, which are represented by the connected nodes and spring-damper systems. Each segment is divided into two components, and the properties are assigned and lumped to the two nodes at each end of that segment. The connections between adjacent nodes are represented by damper-spring systems. Only the axial properties of the mooring lines are accounted for, whereas the torsional and bending properties are not considered.

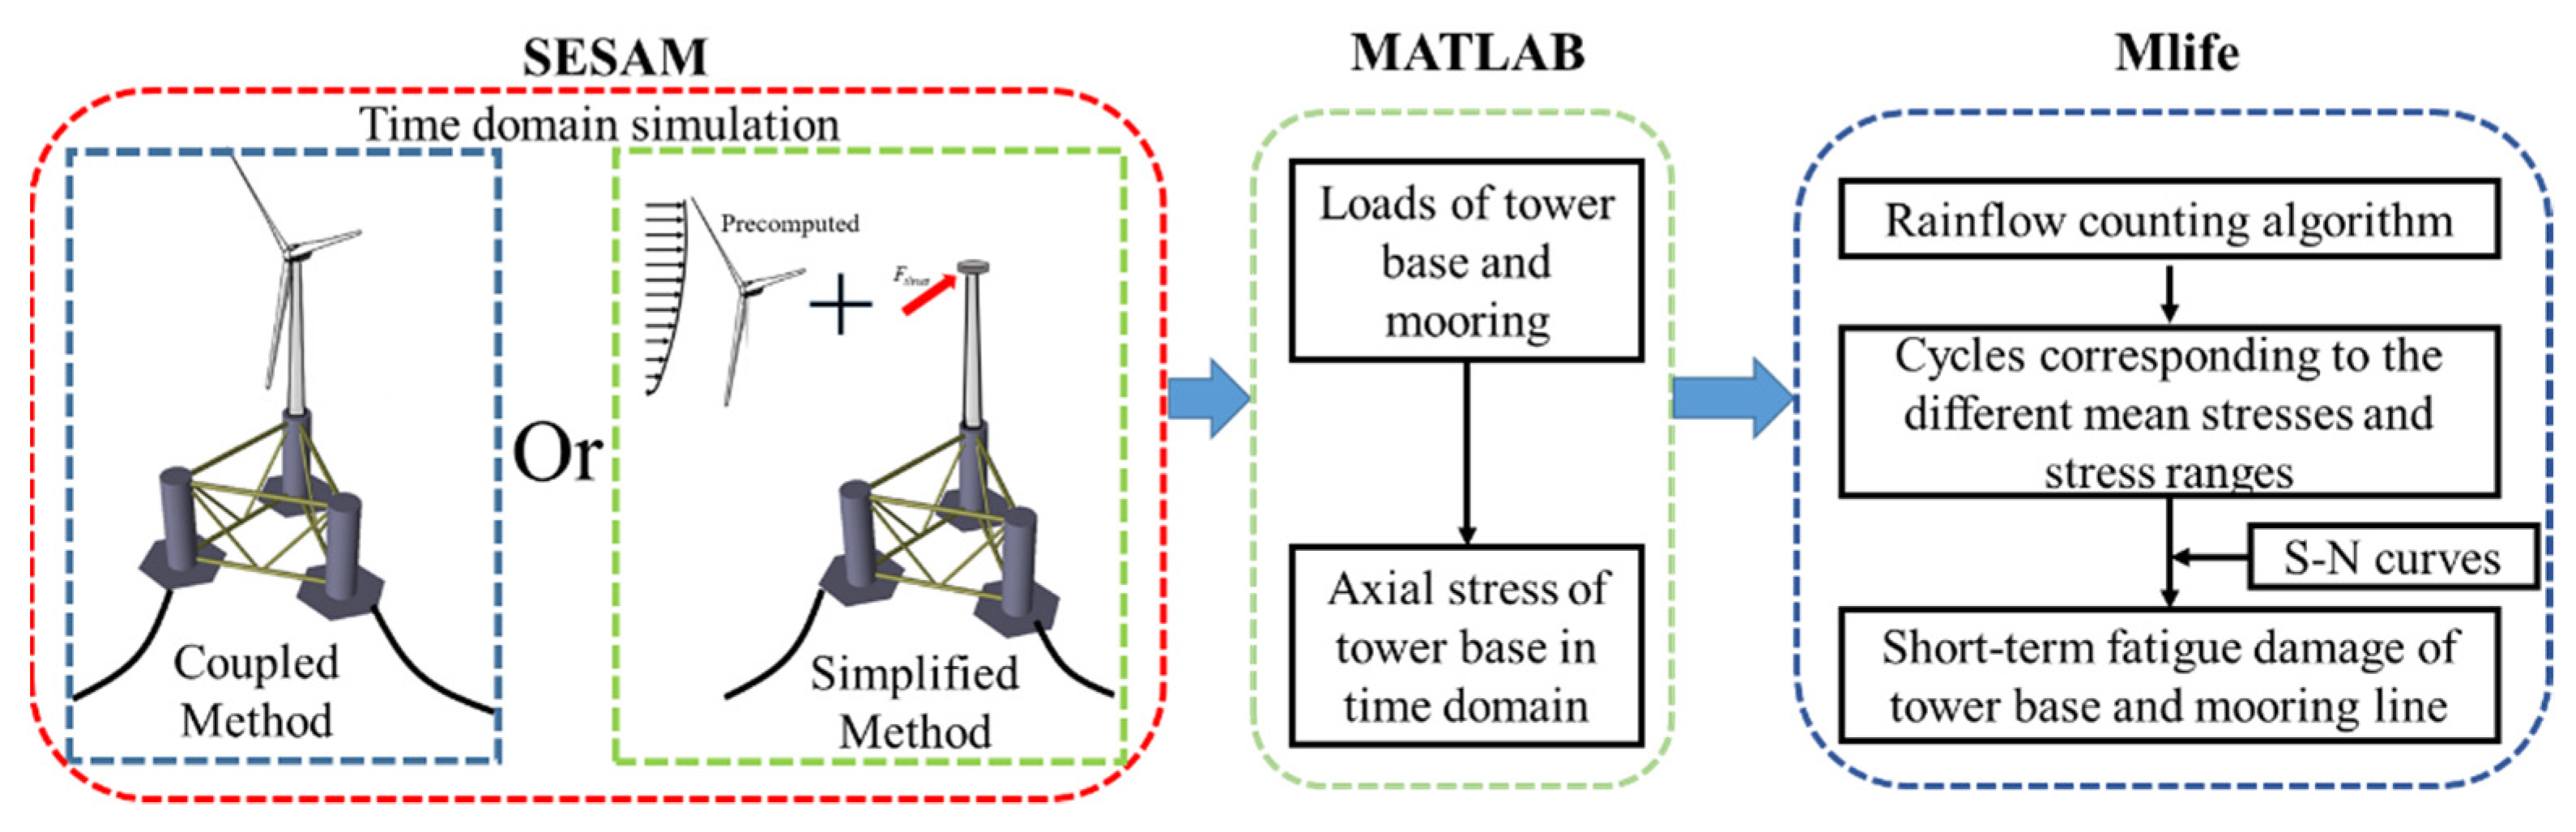
2.4. Fatigue Damage Calculation

In this paper, the tower base section is simplified as a thin-walled cylinder structure that does not consider the welding effect. Fatigue damage includes shear fatigue and axial fatigue, while shear fatigue is less than axial fatigue. Therefore, shear fatigue is not considered in this paper. The procedure of the short-term fatigue damage analysis for the tower base and mooring lines is displayed in Figure 4. The Mlife code [28] developed by the NREL is used to calculate the fatigue of the tower base and mooring lines.
According to [29], the tower base axial stress can be calculated by the following equation:
σ = F Z A + M x I x r sin θ + M y I y r cos θ .
where σ is the nominal stress axial stress; A is the area of the cross section; F z , M x and M y are the axial force, moment about the x axis, and moment about the y axis, respectively; I x and I y are the sections of the area to x axis, y axis, respectively; and θ is the angle from the point to the calculated point (Figure 5), Point 1 (P1) to point 12 (P12) are used to defined the location peripheral direction where the stress was calculated.
To evaluate the mooring line fatigue damage [30], the nominal stress of the mooring line can be calculated by the following equation:
σ m o o r i n g = F m o o r i n g A
where F m o o r i n g is the mooring line force.
Then, the rainflow method is used to process the time series results of the axial stress analysis. After that, the fatigue damage can be obtained using the S-N curve. Based on the S-N curve, the predicted number of cycles to failure for the stress range N i can be given as:
N i = ( L u l t | L m f | 0.5 L i , R F ) m .
where L u l t is the ultimate stress; L m f is the fixed mean stress value; m is the negative inverse slope of S-N curve; m is defined as 3 in the present paper; and L i , R F is the stress value corresponding to the number of cycles.

3. Model Description

In this paper, the NREL 5 MW wind turbine mounted on the WindFloat semisubmersible floating foundation is modeled and simulated, as shown in Figure 6.

3.1. Wind Turbine Model

The wind turbine model [30] was developed by the National Renewable Energy Laboratory (NREL), USA, which is a conventional three-bladed, upwind, variable-speed, collective-pitch controlled horizontal axis wind turbine. Its main properties are listed in Table 1.

3.2. WindFloat Floating Platform Properties

In this paper, the WindFloat semisubmersible platform was adopted to support the NREL 5-MW reference wind turbine. The platform consists of one center column and two side columns connected by braces. It should be noted that the active ballast method was used for the WindFloat semisubmersible platform. However, this was not considered in the present simulation. It should be noted that all the parameters are given about the reference system at the mean sea level (MSL). The properties of the WindFloat semisubmersible floating platform are summarized in Table 2.

3.3. Mooring System Design

Considering the geographical and technical strategy in China, the mooring system of WindFloat SFOWT at 60 m water depth is designed (Figure 7). The objective of the design of the mooring system at moderate water depth is to achieve the reasonable natural frequency of the structure, pretension, and the safety of the mooring system. For each mooring line, a clump mass is used. Compared to the original mooring system of the WindFloat SFOWT at 200 m water depth, a heavier mooring line and clump are used to obtain a reasonable mooring tension.
The fairlead, anchoring positions, and mooring line properties are listed in Table 3. The static configuration and axial tension for each mooring line element are presented in Figure 8. The results show that the mooring line tension at the fairlead position is the largest, which is 1400 kN in the static equilibrium position and a large drop in the mooring line tension at the clump position. Figure 9 presents the mooring line force and restoring force with offset in surge. As shown in Figure 7 and Figure 8, the characteristics of the nonlinearity appear in the mooring line force and restoring force with offset in surge.

4. Result and Discussion

4.1. Load Case Definition

Considering the metocean conditions in the South China Sea, typical load cases (LCs) at 60 m water depth, including the operating conditions and parked conditions, are included in the present simulation. The wind and wave are collinear along the positive X axis. The misaligned wind–wave conditions are not considered in the simulation. It should be noted that turbulent wind is used in this paper. The turbulent intensity (TI) is 0.12. The load cases are listed in Table 4.

4.2. Natural frequencies of WindFloat SFOWT

The natural frequencies of the WindFloat SFOWT for different modes are obtained by free decay test simulation in SIMA by giving an initial displacement to the platform. Then, the time series of the free decay for each DOF can be obtained for the output results. The natural frequency for each DOF can be calculated based on the fast Fourier transform (FFT). The natural frequencies of the WindFloat SFOWT for all DOFs are shown in Table 5.

4.3. Comparison of Dynamic Responses Using Coupled and Simplified Method

In this section, the dynamic response of the coupled method and simplified method are compared and investigated. For the simplified method, the wind force is considered as a time series signal. In the present simulation, the dynamic damping force is not yet considered. The other two components (mean part and the dynamic turbulent part), can be calculated from the monopole offshore wind turbine with A rigid foundation. The total simulation time is 4600 s, and, for the calculation of the statistical results, the first 1000 s has been excluded to avoid the transient effect. It should be noted that the time series results of the motion and force responses between 2000 and 2500 s are displayed to better see the difference between the coupled method and simplified method.

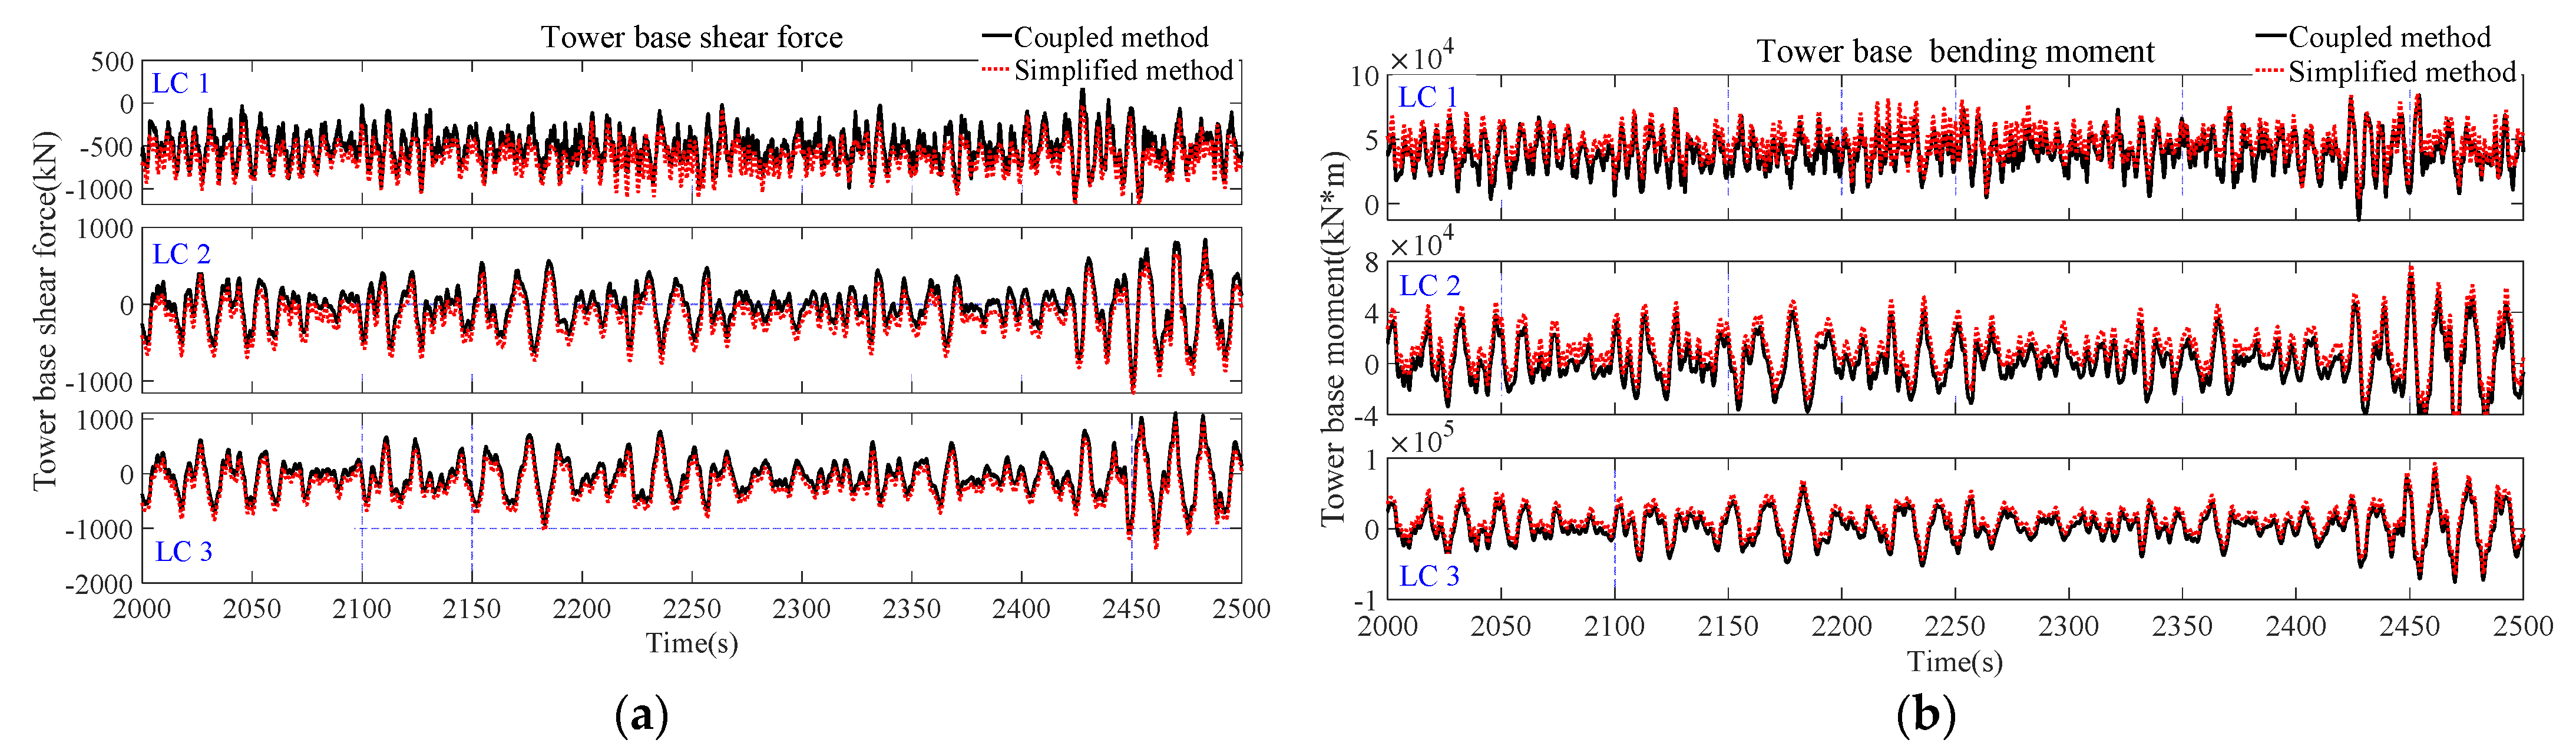
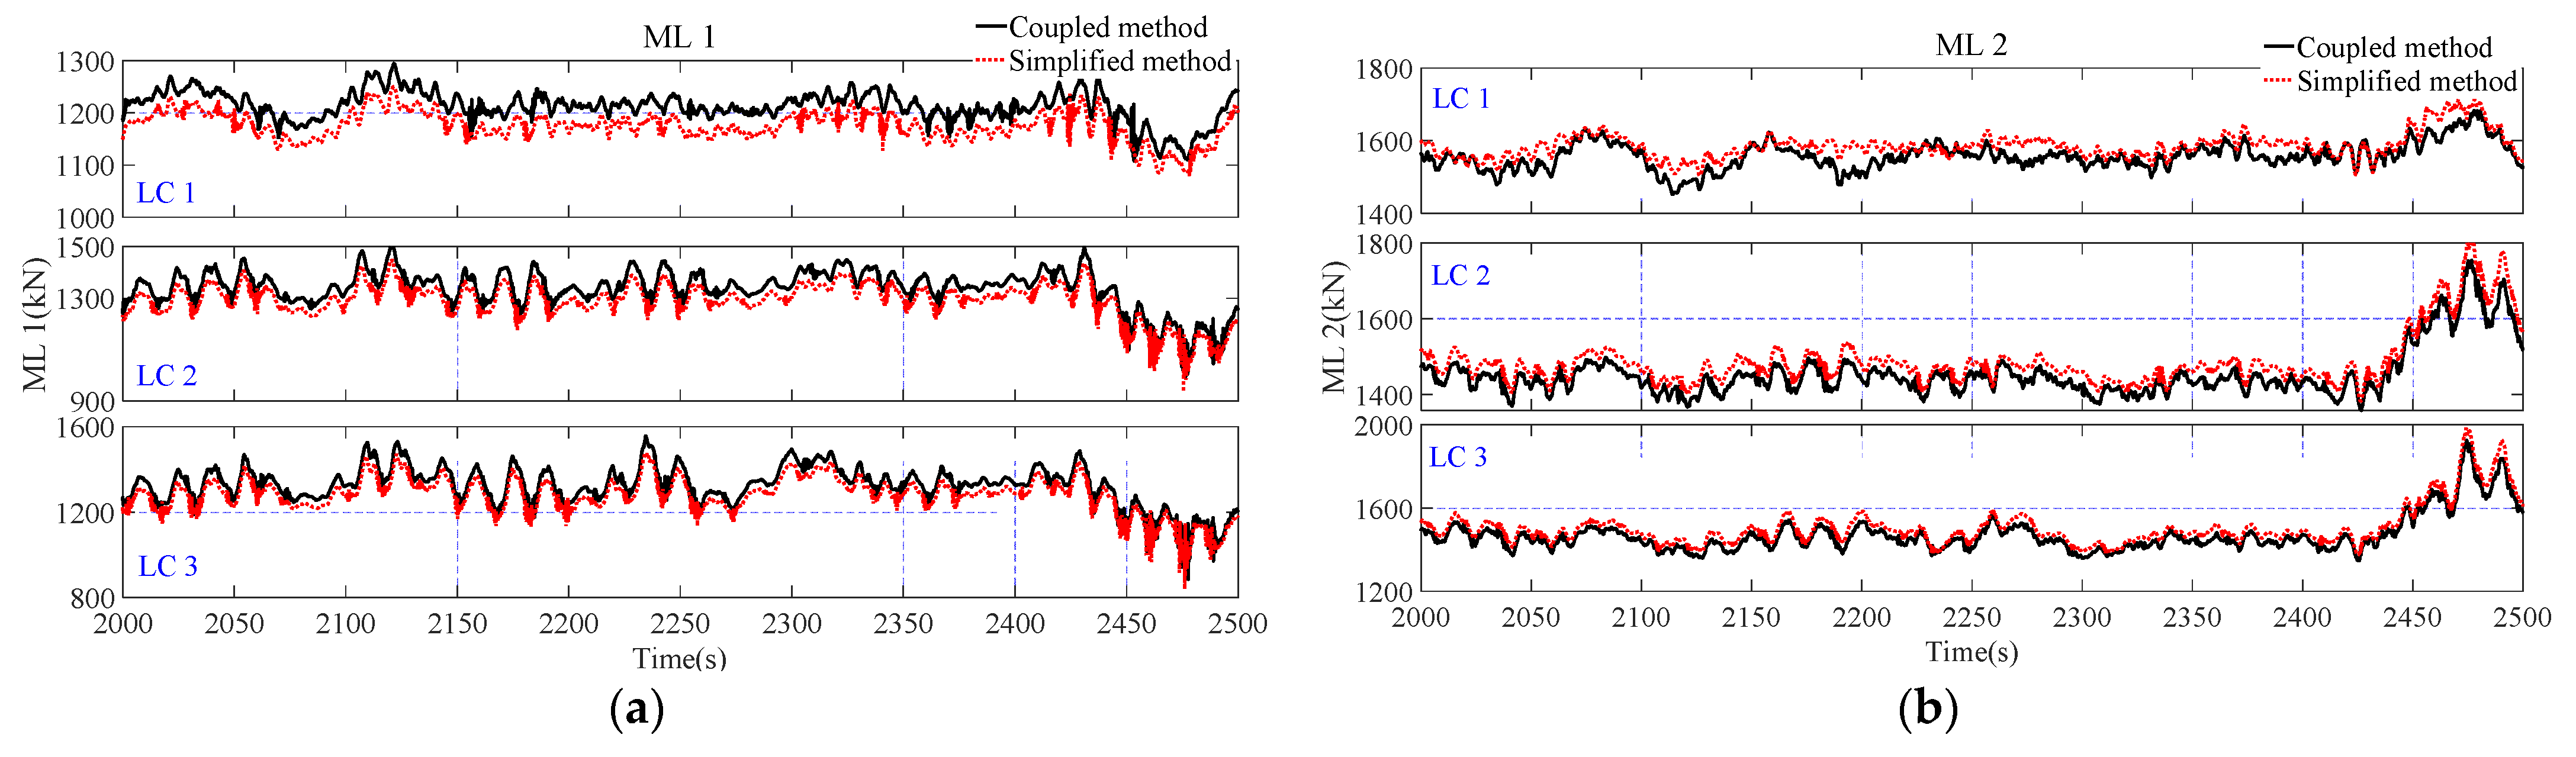
4.3.1. Comparison of Time-Domain Response

Figure 10 presents the comparison of the surge, heave, and pitch motion in the time domain. Table 6 shows a comparison of statistics, including the maximum, minimum, average, and standard deviation (STD) values in surge, heave, and pitch motion. The motion statistics of the WindFloat SFOWT at moderate water depth are quite acceptable for both normal operating condition (LC 1) and extreme sea conditions (LC 2 and LC 3). For surge motion, the amplitude is 9.07 m under normal operation, while it is 20.86 m under extreme condition (LC 3). For the heave and pitch motion, their amplitudes are 3.5 m and 4°, respectively. With respect to the difference of the motion response between the coupled method and the simplified method, the calculated response of the simplified method is larger than that of the coupled method. For example, under normal operational condition, the surge and pitch motion maxima are increased by 11% and 16%, respectively. It seems that the STDs between the different motions are quite close. For example, the STDs of the surge motion of the two methods are 1.09 and 1.10 under normal operating condition (LC 1).
Figure 11 and Figure 12 present a time-domain comparison of the tower base loads and mooring line tensions between the coupled method and simplified method under different load cases. Table 7 shows the statistical comparison of tower base loads and mooring line tensions for different load cases. It should be noted that only the tension forces of ML 1 and 2 are displayed in the present paper, since the ML 2 and 3 are in the upwind condition and show the similar mooring tension responses. The results show that the tower base force and mooring line tension have similar STD values under the extreme sea conditions (LC 2 and LC 3), while the STD value of the simplified method is slightly lower than those of the coupled method for the over-rated wind speed condition (LC 1). The means and maximums of the tower base shear force and moment are larger in the calculation of the simplified method. For the mooring line tension, the forces acting on the hub under the parked conditions are lower than those under the normal operating conditions. The mean surge motion shown in Table 6 is lower under the parked condition. Therefore, the ML 1 tension (downwind direction) is expected to be larger in extreme sea conditions, while the ML 2 tension is not.

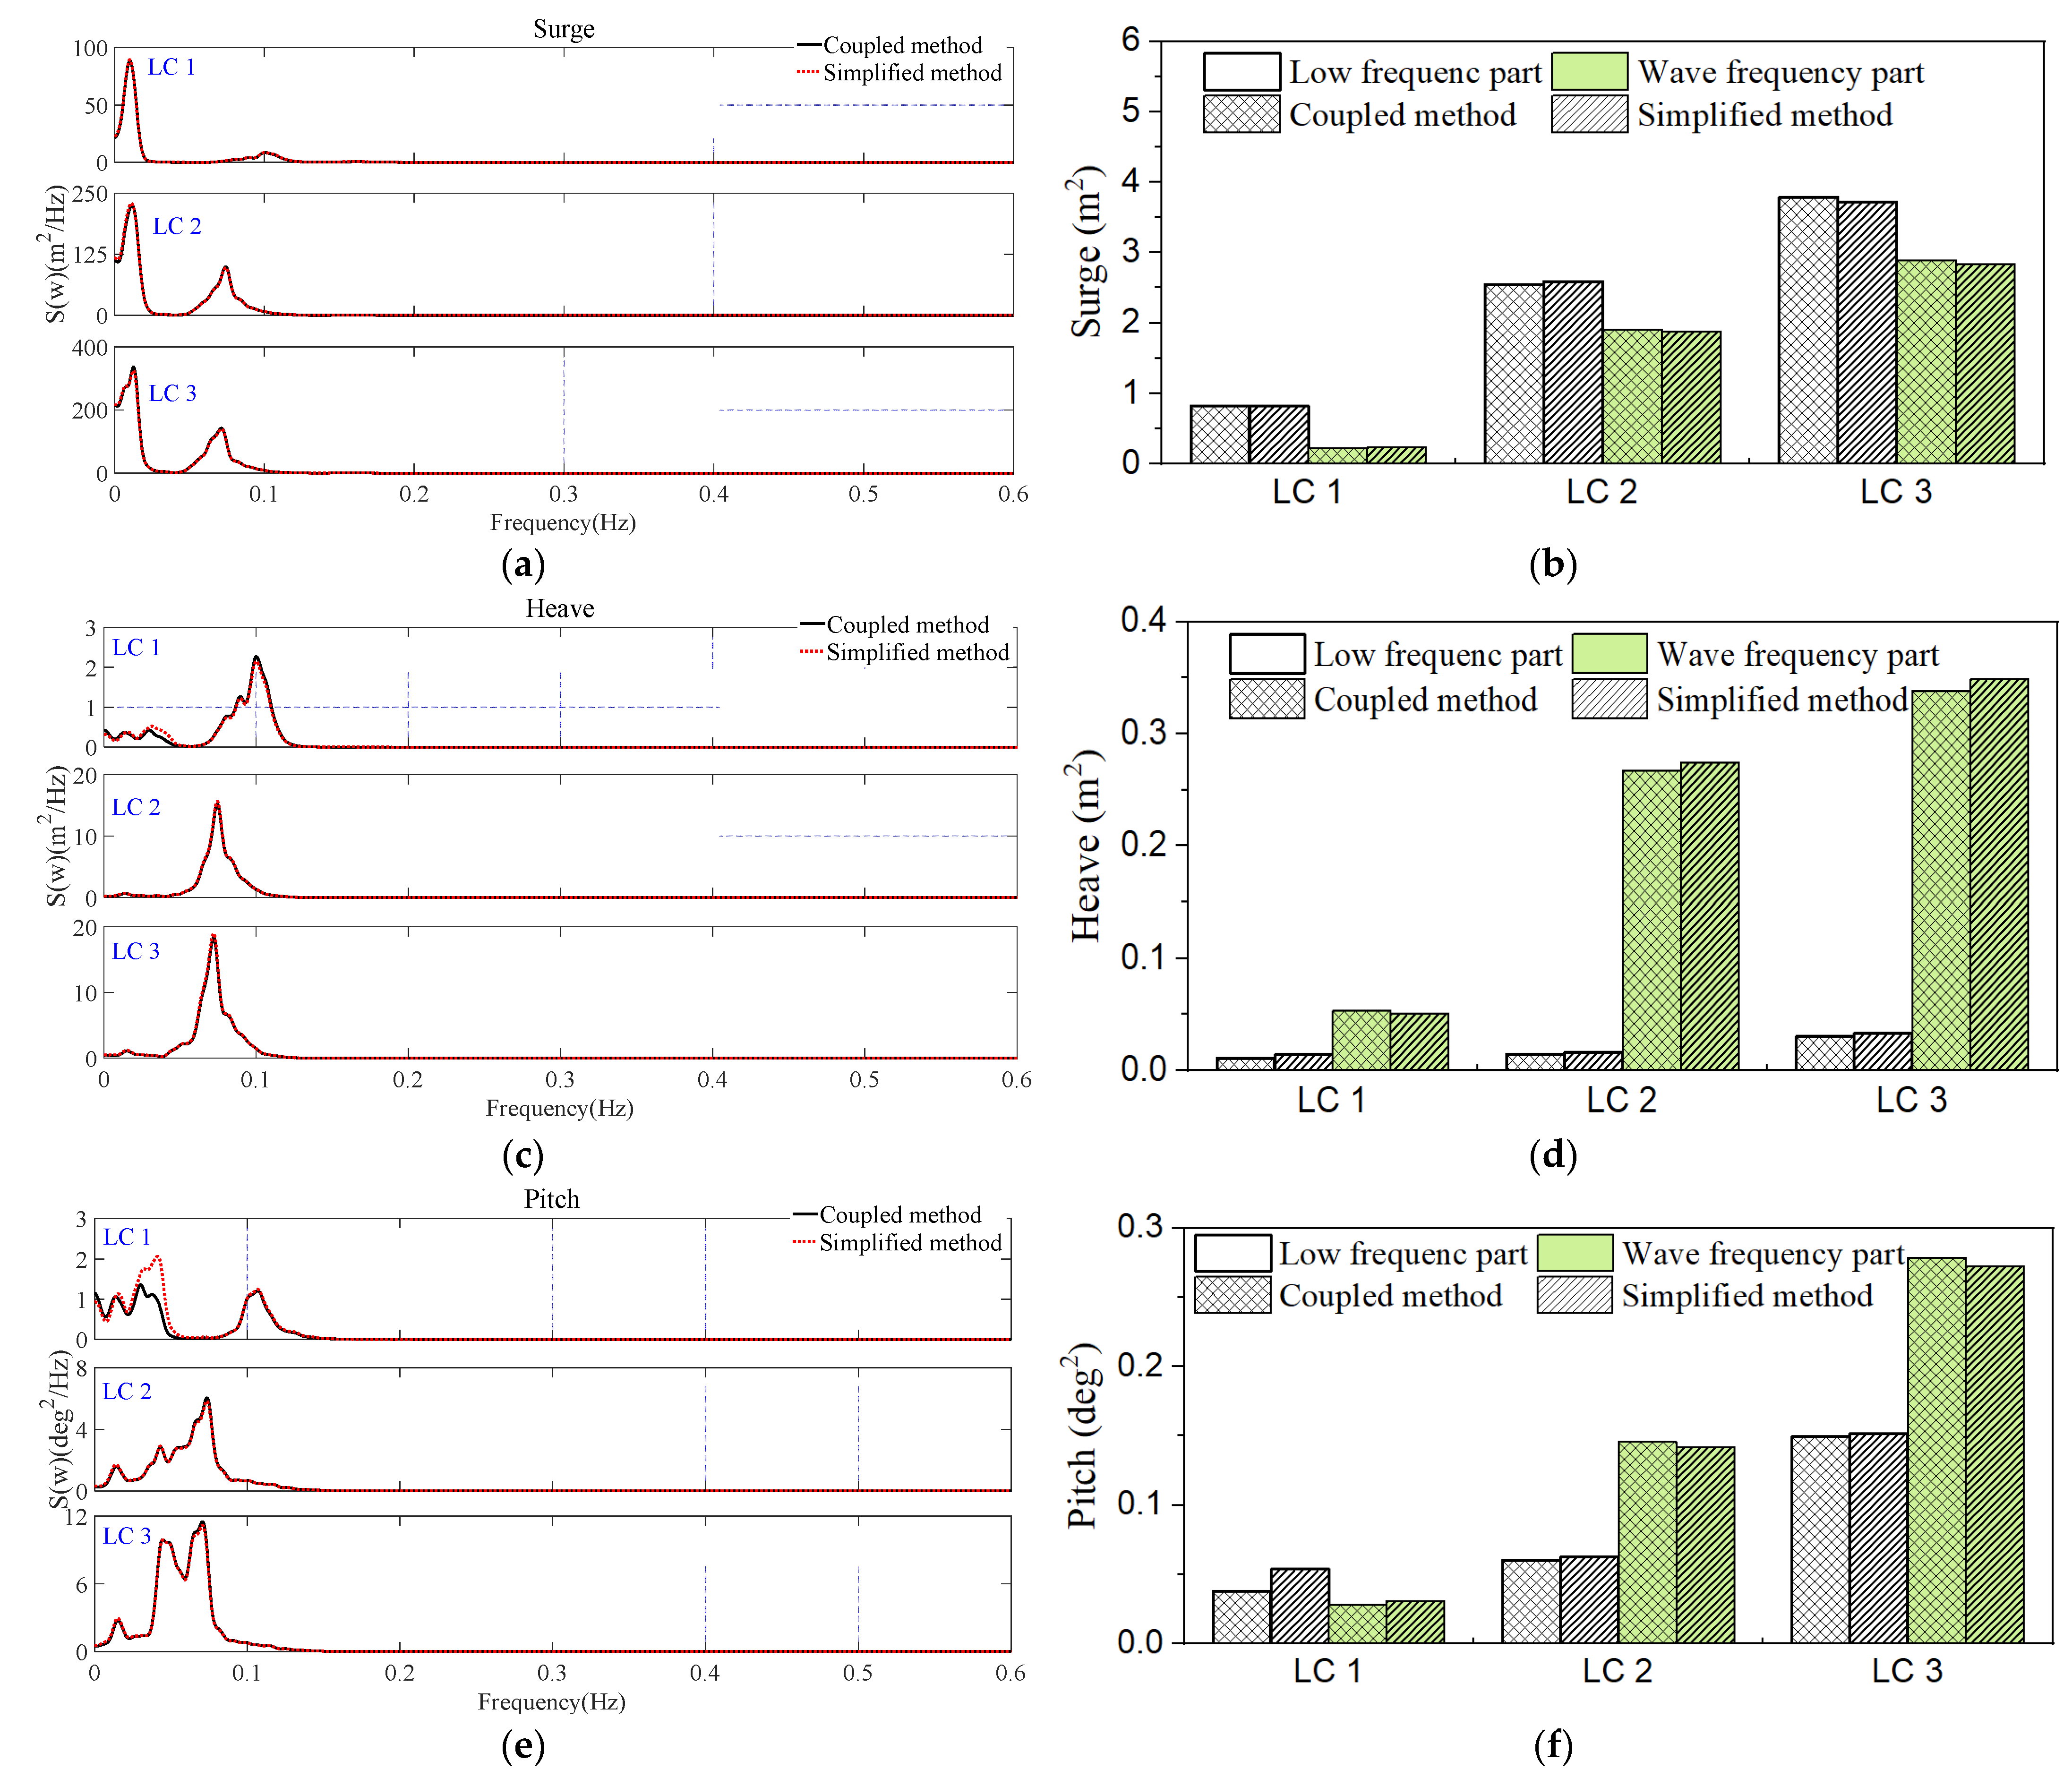
4.3.2. Comparison of Frequency-Domain Response

In this section, a frequency-domain comparison of motions and mooring line tensions is made between the coupled method and simplified method. To investigate the contribution from different frequency regions, the integrals of the power spectral density (PSD) plots at low frequency and wave frequency regions are displayed. It should be noted that the first 1000 s of the total simulation time (4600 s) was removed for the frequency domain analysis to avoid the transient effect.
Figure 13 shows the PSD plots of the surge, heave, and pitch motion of the WindFloat SFOWT under normal operation (LC 1) and extreme sea conditions (LC 2 and LC 3). For the surge motion, the wave frequency and natural frequency of the surge motion are indicated in the surge motion PSD plot. The low frequency response contribution is larger than the wave frequency response under both the normal operating condition and extreme sea conditions, as shown in Figure 13b. Compared to the normal operation condition (LC 1), the contribution to surge motion from the wave excitation force increases. Additionally, a comparison between the coupled and simplified methods indicates that the simplified method has a relatively similar frequency response in both the low frequency and wave frequency areas. Being different with the surge motion response, the heave motion response (Figure 13c,d) is mainly dominated by the wave excitation force. Compared to the coupled method, the low frequency response is slightly larger for the simplified method under normal operating conditions, while the wave frequency response is larger under extreme sea conditions. The response spectra of the pitch motion shows that the pitch natural frequency response has a larger contribution than the wave excitation frequency in response to the pitch motion under the normal operating condition, while the motion response is mainly dominated by the wave excitation force under the parked conditions. For both normal operating conditions and extreme sea conditions, small peaks at the surge natural frequency are observed in the pitch motion response spectra, showing a strong coupling effect between the surge and pitch motion. Under the normal operation, the low frequency response of the pitch motion using the simplified method is larger than that using the coupled method.
As mentioned in the time domain analysis, ML 2 and ML 3 share similar responses due to the symmetry of the mooring configuration. Therefore, only the ML 1 and ML 2 tension response spectra are displayed in the present section. Figure 14 presents a comparison of tension spectra for ML 1 and ML 2 between the two methods, including the coupled and simplified method under different wind–wave combination cases. The consequences reveal that the mooring forces are mainly dominated by responses at the surge natural frequency for the normal operation. Wave actions also contribute to the mooring tension responses. When the WindFloat SFOWT operates in the extreme sea conditions, the contribution of the ML 1 tension caused by the wave excitation force increases. Compared with the ML 1 tension response, it seems that the low frequency has a much larger impact on the mooring line tension response. A comparison of the mooring line tension between the two methods indicates that, the calculated results of the mooring line tension response using the simplified are lower than those using the coupled method. For ML 2 tension response spectra, the calculated response using the coupled method is slightly larger under the normal operating conditions, while the low frequency response of the mooring line is lower than those using the simplified method. A comparison of the mooring line tension responses shows that the different methods have an impact on the mooring tension performance. Therefore, fatigue damage estimation is needed to further check the difference between the two methods.

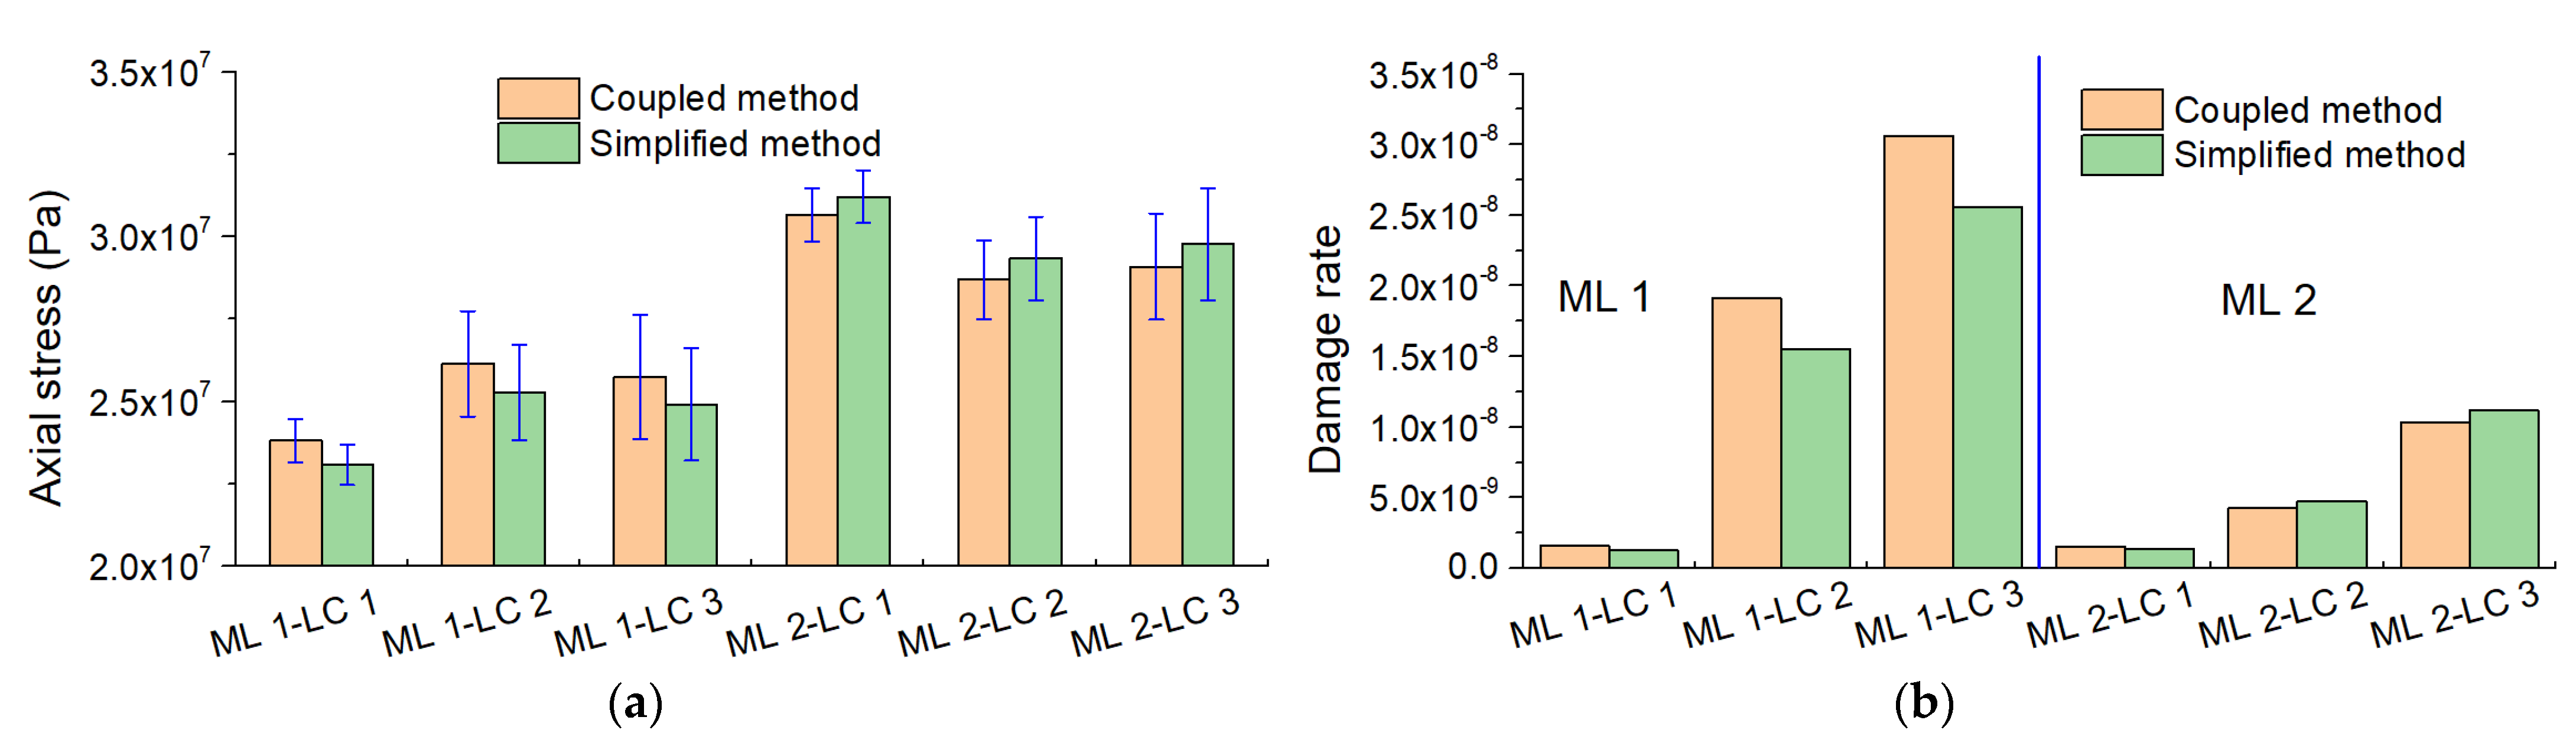
4.3.3. Comparison of Fatigue Damage

As shown in Figure 15, judging by the axial stress and damage rate of the tower base position at the different points (P1 to P12) shown in Figure 5, the points along the wind–wave direction have the maximum fatigue damage, while the points perpendicular to the wind–wave direction have the lowest fatigue damage. Meanwhile, P7 experiences greater fatigue damage compared to P1. When the floating wind turbine operates in the parked condition, the fatigue damage rate difference between P1 and P7 fatigue damage rate decreases. Compared to the normal operating condition (LC 2), the fatigue load at the tower base is larger under the extreme conditions (LC 2 and LC 3). According to the comparison between the coupled method and simplified method under the normal operating condition (LC 1), there is a large difference between the P1 and P7, while they are smaller under extreme sea conditions (LC 2 and LC 3). For example, the damage rates calculated based on the coupled method and decoupled method of P1 at tower base are 1.64 × 10⁻⁶ and 1.1710−6 under the normal operating condition (LC 1), while the damage rates are 2.18 × 10⁻⁶ and 2.10 × 10⁻⁶ under extreme sea condition (LC 2), respectively. This is because the wave excitation force dominates the tower base responses under the extreme sea condition.
Figure 16 presents the axial stress and damage rate of the mooring system. The results show that the mooring system experiences a smaller fatigue load under normal operating condition than that under extreme sea conditions (LC 2 and LC 3). According to the time domain response of ML 2, although the mean value of ML 2 is larger than that of ML 1, the STD value of the mooring line tension is larger for ML 1, which has a significant impact on fatigue damage. A comparison between ML 1 and ML 2 indicates that ML 1 suffers more fatigue damage than ML 2, which should be paid more attention. Moreover, under extreme sea conditions (LC 2 and LC 3), the mooring lines experience more fatigue damage than under normal conditions. The time series statistics in Table 7 show that the mean value and STD value of ML 1 are larger using the coupled method, while those of ML 2 are larger using the simplified method. The comparison of fatigue damage between the coupled method and simplified method shows that the fatigue damage using the coupled method is larger than that using the simplified method for ML 1, while the fatigue of ML 2 is the opposite.

5. Conclusions

In this paper, the dynamic response analysis of the WindFloat SFOWT at a moderate water depth was carried out. A comparison of the dynamic responses between the coupled method and simplified method is made. The coupled method considers the motion interaction between the wind turbine and tower top and the aerodynamic damping, while the simplified method considered the wind load as an external load. The following conclusion can be drawn from the results:
(1)
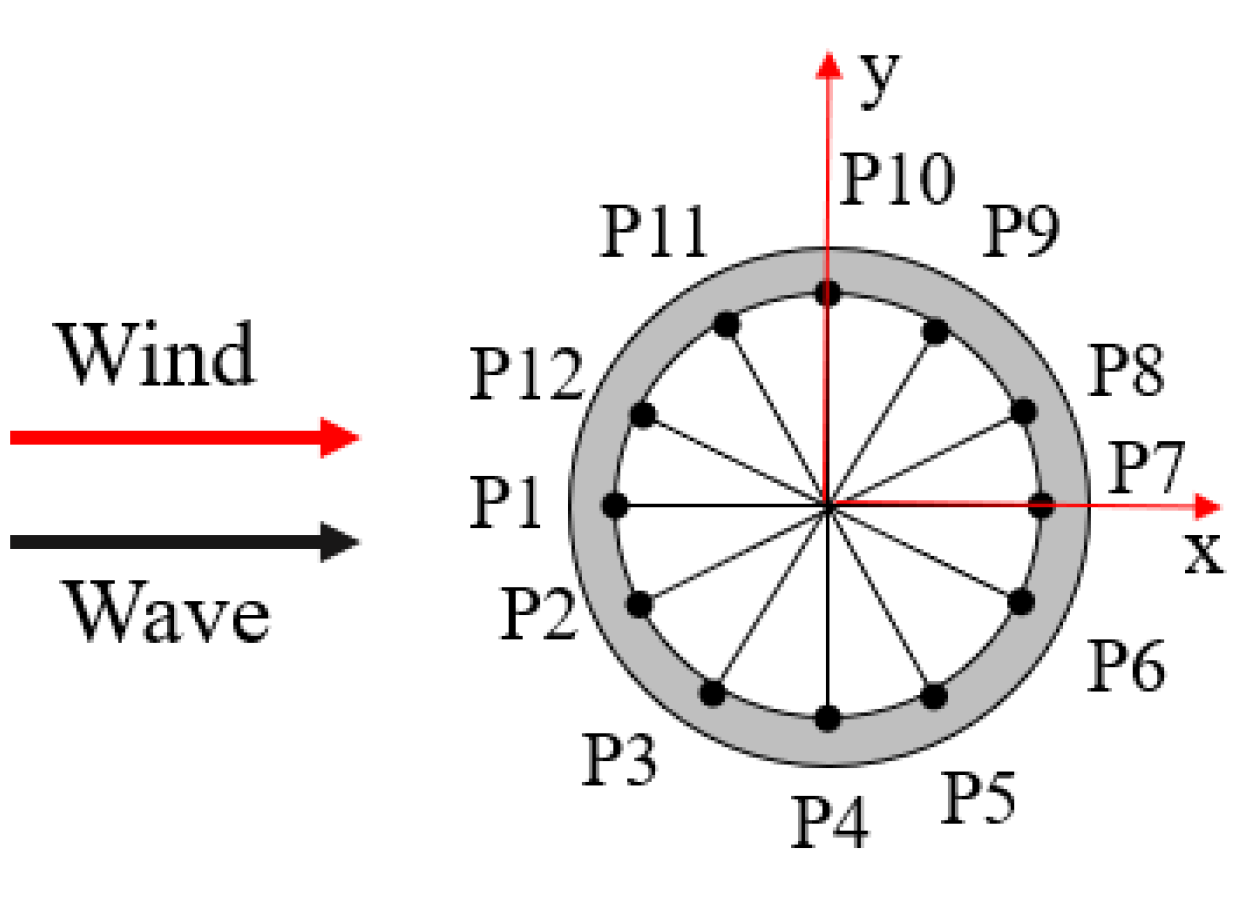
The WindFloat SFOWT motions and force responses are quite reasonable at a moderate water depth, showing the possibility of semisubmersible floating wind turbines installing at moderate depths. The amplitude of the surge motion response is 9.07 m under a normal operating condition. For the extreme conditions, the amplitude of the surge motion response is approximately 20 m. The maximum pitch motion for all load cases is below 5°. For the mooring line tension responses, the maximum value for ML 1 and ML 2 are 1337.7 kN and 1791.6 kN, respectively, under normal operating conditions. The PSD analysis of the WindFloat SFOWT under different load cases shows that the low frequency responses are the main part of the surge motion response for all load cases, while the heave and pitch motion are mainly dominated by the wave excitation force. The fatigue damage results indicate that the points on the leeward side experience greater fatigue damage than those points on the heading wave side, to which should be paid more attention. For the mooring line tension fatigue, the fatigue damage on ML 1 is larger than that of ML 2 for all load cases.
(2)
A comparison between the coupled and simplified methods shows that the simplified method overestimates the maximum motion responses of the WindFloat SFOWT, while the STD value does not change a lot. The simplified method predicts a close PSD response in surge motion. The response spectra in the low frequency region of the heave and pitch motion are larger when using the simplified method. For the mooring line tension responses, the calculated response spectra of the simplified method are underestimated under different load cases for both the low frequency and wave frequency parts, while the response spectra of ML 2 are the opposite. Under normal operating conditions, the difference between the coupled method and simplified method is larger, while it is close under extreme sea conditions because the wave excitation force dominates the tower base responses.

Author Contributions

Conceptualization, W.S., L.Z., S.G., B.W. and X.L.; methodology, S.G., W.S., B.W. and X.L.; investigation, S.G., L.Z., W.S. and B.W.; writing—first draft preparation, S.G., L.Z. and W.S.; review and editing, W.S., L.Z., S.G., B.W. and X.L.; supervision, W.S. and X.L.; project administration, W.S.; funding acquisition, S.G., W.S. and B.W. All authors have read and agreed to the published version of the manuscript.

Funding

This research was funded by the National Natural Science Foundation of China (Grant No. 52071058, 51939002, 52101333, 52071301), China Postdoctoral Science Foundation (No. 2020M681801) and Zhejiang Provincial Natural Science Foundation of China (No. LQ21E090009). This work is also partially supported by LiaoNing Revitalization Talents Program (XLYC1807208), special funds for promoting high quality development from department of natural resources of Guangdong province (GDNRC [2020]016) and the Fundamental Research Funds for the Central Universities (DUT20ZD219).

Institutional Review Board Statement

Not applicable.

Informed Consent Statement

Not applicable.

Conflicts of Interest

The authors declare no conflict of interest.

References

  1. DeCastro, M.; Salvador, S.; Gómez-Gesteira, M.; Costoya, X.; Carvalho, D.; Sanz-Larruga, F.J.; Gimeno, L. Europe, China and the United States: Three different approaches to the development of offshore wind energy. Renew. Sustain. Energy Rev. 2019, 109, 55–70. [Google Scholar] [CrossRef]
  2. Dong, F.G.; Shi, L.; Ding, X.H.; Li, Y.; Shi, Y.P. Study on China’s renewable energy policy reform and improved design of renewable portfolio standard. Energies 2019, 12, 2147. [Google Scholar] [CrossRef] [Green Version]
  3. Shi, W.; Park, H.; Chung, C.; Kim, Y. Comparison of dynamic response of monopile, tripod and jacket foundation system for a 5-MW wind turbine. In Proceedings of the Twenty-first International Offshore and Polar Engineering Conference, Maui, HI, USA, 19–24 June 2011. [Google Scholar]
  4. Global Wind Report. 2021. Available online: https://gwec.net/global-wind-report-2021/ (accessed on 25 March 2021).
  5. Karimirad, M.; Michailides, C. Fault condition effects on the dynamic response of V-shaped offshore wind turbine. J. Mar. Sci. Technol. 2019, 24, 34–45. [Google Scholar] [CrossRef] [Green Version]
  6. Karimirad, M.; Michailides, C. Dynamic Analysis of a Braceless Semisubmersible Offshore Wind Turbine in Operational Conditions. Energy Procedia 2015, 80, 21–29. [Google Scholar] [CrossRef] [Green Version]
  7. Oguz, E.; Clelland, D.; Day, A.H.; Incecik, A.; López, J.A.; Sánchez, G.; Almeria, G.G. Experimental and numerical analysis of a TLP floating offshore wind turbine. Ocean. Eng. 2018, 147, 591–605. [Google Scholar] [CrossRef] [Green Version]
  8. Wu, H.; Zhao, Y.; He, Y.; Shao, Y.; Mao, W.; Han, Z.; Huang, C.; Gu, X.; Jiang, Z. Transient response of a TLP-type floating offshore wind turbine under tendon failure conditions. Ocean Eng. 2021, 220, 108486. [Google Scholar] [CrossRef]
  9. Antonutti, R.; Peyrard, C.; Johanning, L.; Incecik, A.; Ingram, D. An investigation of the effects of wind-induced inclination on floating wind turbine dynamics: Heave plate excursion. Ocean Eng. 2014, 91, 208–217. [Google Scholar] [CrossRef] [Green Version]
  10. Tao, L.; Cai, S. Heave motion suppression of a Spar with a heave plate. Ocean Eng. 2004, 31, 669–692. [Google Scholar] [CrossRef] [Green Version]
  11. Karimirad, M.; Michailides, C. V-shaped semisubmersible offshore wind turbine: An alternative concept for offshore wind technology. Renew. Energy 2015, 83, 126–143. [Google Scholar] [CrossRef] [Green Version]
  12. Roddier, D.; Cermelli, C.; Aubault, A.; Weinstein, A. WindFloat: A floating foundation for offshore wind turbines. J. Renew. Sustain. Energy 2010, 2, 033104. [Google Scholar] [CrossRef]
  13. Moreno, J.; Thiagarajan K, P.; Cameron, M. Hydrodynamic Coefficients of Hexagonal Heave Plates for Floating Offshore Wind Turbine Platforms. In Proceedings of the International Conference on Offshore Mechanics and Arctic Engineering, Busan, Korea, 19–24 June 2016. [Google Scholar]
  14. Robertson, A.; Jonkman, J.; Masciola, M.; Song, H.; Goupee, A.; Coulling, A.; Luan, C. Definition of the Semisubmersible Floating System for Phase II of OC4; National Renewable Energy Lab. (NREL): Golden, CO, USA, 2014. [Google Scholar]
  15. Luan, C.; Gao, Z.; Moan, T. Design and Analysis of a Braceless Steel 5-Mw Semi-Submersible Wind Turbine. In Proceedings of the International Conference on Offshore Mechanics and Arctic Engineering, Busan, Korea, 19–24 June 2016. [Google Scholar]
  16. Xu, K.; Gao, Z.; Moan, T. Effect of hydrodynamic load modelling on the response of floating wind turbines and its mooring system in small water depths. J. Phys. Conf. Ser. 2018, 1104, 12006. [Google Scholar] [CrossRef] [Green Version]
  17. Zhang, L.; Shi, W.; Karimirad, M.; Michailides, C.; Jiang, Z. Second-order hydrodynamic effects on the response of three semisubmersible floating offshore wind turbines. Ocean Eng. 2020, 207, 107371. [Google Scholar] [CrossRef]
  18. Bayati, I.; Gueydon, S.; Belloli, M. Study of the effect of water depth on potential flow solution of the OC4 semisubmersible floating offshore wind turbine. Energy Procedia 2015, 80, 168–176. [Google Scholar] [CrossRef] [Green Version]
  19. Zhang, R.; Tang, Y.; Hu, J.; Ruan, S.; Chen, C. Dynamic response in frequency and time domains of a floating foundation for offshore wind turbines. Ocean Eng. 2013, 60, 115–123. [Google Scholar] [CrossRef]
  20. Ingram, G. Wind Turbine Blade Analysis Using the Blade Element Momentum Method; Version 1.1; Durham University: Durham, UK, 2011. [Google Scholar]
  21. Jonkman, J.; Butterfield, S.; Musial, W.; Scott, G. Definition of a 5-MW Reference Wind Turbine for Offshore System Development; National Renewable Energy Lab. (NREL): Golden, CO, USA, 2009. [Google Scholar]
  22. Zhang, M.; Xu, F.; Zhang, Z.; Ying, X. Energy budget analysis and engineering modeling of post-flutter limit cycle oscillation of a bridge deck. J. Wind. Eng. Ind. Aerod. 2019, 188, 410–420. [Google Scholar] [CrossRef]
  23. Zhang, M.; Xu, F.; Han, Y. Assessment of wind-induced nonlinear post-critical performance of bridge decks. J. Wind. Eng. Ind. Aerod. 2020, 203, 104251. [Google Scholar] [CrossRef]
  24. Schafhirt, S.; Muskulus, M. Decoupled simulations of offshore wind turbines with reduced rotor loads and aerodynamic damping. Wind Energy Sci. 2018, 3, 25–41. [Google Scholar] [CrossRef] [Green Version]
  25. Ishihara, T.; Zhang, S. Prediction of dynamic response of semi-submersible floating offshore wind turbine using augmented Morison’s equation with frequency dependent hydrodynamic coefficients. Renew. Energy 2019, 131, 1186–1207. [Google Scholar] [CrossRef]
  26. Faltinsen, O. Sea Loads on Ships and Offshore Structures; Cambridge university press: Cambridge, UK, 1993. [Google Scholar]
  27. Hall, M.; Goupee, A. Validation of a lumped-mass mooring line model with DeepCwind semisubmersible model test data. Ocean Eng. 2015, 104, 590–603. [Google Scholar] [CrossRef] [Green Version]
  28. Hayman, G. MLife Theory Mannual for Version 1.00; National Renewable Energy Laboratory (NREL): Golden, CO, USA, 2012. [Google Scholar]
  29. Li, H.; Hu, Z.; Wang, J.; Meng, X. Short-term fatigue analysis for tower base of a spar-type wind turbine under stochastic wind-wave loads. Int J. Nav Arch. Ocean. 2018, 10, 9–20. [Google Scholar] [CrossRef]
  30. Thies, P.R.; Johanning, L.; Harnois, V.; Smith, H.C.; Parish, D.N. Mooring line fatigue damage evaluation for floating marine energy converters: Field measurements and prediction. Renew. Energy 2014, 63, 133–144. [Google Scholar] [CrossRef] [Green Version]
Figure 1. Diagram of blade element.
Jmse 09 01093 g001
Figure 2. Illustration of coupled and simplified method: (a) Coupled method; (b) Simplified method.
Jmse 09 01093 g002
Figure 3. Description of lumped-mass method for mooring system.
Jmse 09 01093 g003
Figure 4. Procedure of fatigue damage calculation.
Jmse 09 01093 g004
Figure 5. Top view of tower base.
Jmse 09 01093 g005
Figure 6. Schematic diagram of WindFloat SFOWT.
Jmse 09 01093 g006
Figure 7. Mooring configuration of the WindFloat SFOWT.
Jmse 09 01093 g007
Figure 8. Mooring line configuration and axial tension of ML 1: (a) Static equilibrium configuration; (b) Axial effective tension.
Jmse 09 01093 g008
Figure 9. Mooring line force and restoring force in surge vs. offset in surge: (a) ML 1 tension; (b) Restoring force.
Jmse 09 01093 g009
Figure 10. Time series of the WindFloat SFOWT motion in: (a) Surge; (b) Heave; (c) Pitch.
Jmse 09 01093 g010
Figure 11. Tower base force of WindFloat SFOWT under different load cases: (a) Tower base shear force; (b) Tower base bending moment.
Jmse 09 01093 g011
Figure 12. Mooring line force of WindFloat SFOWT under different load cases: (a) ML 1; (b) ML 2.
Jmse 09 01093 g012
Figure 13. PSD plot of surge, heave, and pitch motion for WindFloat SFOWT platform under different load cases: (a) Surge; (b) Integrals of surge; (c) Heave; (d) Integrals of heave; (e) Pitch; (f) Integrals of pitch.
Jmse 09 01093 g013
Figure 14. PSD plot of mooring line tension for WindFloat SFOWT platform under different load cases: (a) ML 1 tension; (b) Integrals of ML 1 tension; (c) ML 2 tension; (d) Integrals of ML 2 tension.
Jmse 09 01093 g014
Figure 15. Fatigue plot of tower base under different load cases: (a) Axial stress; (b) Damage rate.
Jmse 09 01093 g015
Figure 16. Fatigue plot of mooring line under different load cases: (a) Axial stress; (b) Damage rate.
Jmse 09 01093 g016
Table 1. Main properties of the NREL 5 MW reference wind turbine.
ParameterValue
Rated power/MW5
Rotor OrientationUpwind
Rotor, Hub diameter/m126, 3
Hub height/m90
Cut-in, Rated, Cut-Out Wind speed/m/s3, 11.4, 25
Cut-in, Rated, Rated Rotor Speed/rpm6.9, 12.1
Overhang, Shaft tilt, Precone5 m, 5°, 2.5°
Rotor, Nacelle, Tower mass/ton110, 240, 347.46
Tower top, diameter, wall thickness/m3.87, 0.019
Table 2. Properties of the WindFloat semisubmersible floating platform.
ParameterValue
Column diameter/m10.7
Distance of column to column/m56.4
Brace diameter/m28
Cross brace diameter/m2.0
Diagonal brace diameter/m2.2
Column height/m33.6
Draft/m22.9
COG (x, y, z)/m(−32.6, 0, −13.1)
Mass of the platform/m2.02 × 106
Radius of gyration—rx/m25.8
Radius of gyration—ry/m25.8
Radius of gyration—rz/m32.3
Table 3. Mooring line properties of WindFloat SFOWT.
ParameterValue
Water depth/m60
Mooring line length/m560
Mass per unit length/(kg/m)648
Diameter of mooring line/m0.180
Axial stiffness/kN2.92 × 109
Fairlead for ML 1 (x, y, z) /m(5.35, 0, −10)
Fairlead for ML 2 (x, y, z) /m(−51.52, 32.83, −10)
Fairlead for ML 3 (x, y, z) /m(−51.52, −32.83, −10)
Anchor point of ML 1 (x, y, z) /m(543.84, 0, −60)
Anchor point of ML 2 (x, y, z) /m(−320.76, 499.18, −60)
Anchor point of ML 3 (x, y, z) /m(−320.76, −499.18, −60)
Pretension/ kN1400 kN
Clump mass/kg75,000
Table 4. Load Case Definition.
Load CaseHs/mTp/sUw/(m/s)TI
Load case 1 (LC 1)5.49.718.70.12
Load case 2 (LC 2)9.413.530.10.12
Load case 3 (LC 3)11.014.333.70.12
Table 5. Natural frequency of WindFloat SFOWT at each DOF.
ModeNatural Period/sNatural Frequency/Hz
Surge75.80.013
Heave20.40.049
Pitch31.20.032
Table 6. Statistical results of WindFloat platform motion.
ModeLoad CaseMaximumMinimumAverageStandard Deviation
Coupled MethodSimplified MethodCoupled MethodSimplified MethodCoupled MethodSimplified MethodCoupled MethodSimplified Method
Surge/mLC 110.0611.180.992.164.385.551.091.10
LC 211.9613.05−5.67−4.511.802.772.252.25
LC 314.8115.70−6.05−4.862.393.342.792.77
Heave/mLC 1−0.21−0.32−1.86−1.99−0.90−1.050.260.26
LC 21.281.01−1.53−1.900.03−0.260.530.54
LC 31.451.16−1.79−2.150.01−0.300.610.62
Pitch/°LC 12.613.030.751.071.591.860.270.30
LC 21.602.14−1.49−1.020.000.470.460.45
LC 32.082.58−1.90−1.460.030.520.660.65
Table 7. Statistical results of tower base loads and mooring line tension.
ModeLoad CaseMaximumMinimumAverageStandard deviation
Coupled MethodSimplified MethodCoupled MethodSimplified MethodCoupled MethodSimplified MethodCoupled MethodSimplified Method
Tower base Fx/kNLC 11335.81304.0−447.1−220.9501.5627.2219.7194.6
LC 21189.21316.2−1228.4−1118.433.0167.5297.5296.3
LC 31421.41537.5−1246.0−1089.344.6178.9353.8352.4
Tower base My/kN*mLC 197,092.093,171.0−26,980.0−12,934.038,788.746,348.715,462.213,521.1
LC 279,377.088,518.0−83,887.0−75,899.01764.211,350.919,802.219,644.9
LC 395,648.0103,000.0−84,430.0−73,843.02804.612,196.023,593.223,392.4
ML 1/kNLC 11337.71286.0993.8975.21212.21174.533.531.2
LC 21721.41618.9995.6936.11330.71285.781.273.9
LC 31747.21641.0885.6838.81310.81267.996.086.7
ML 2/kNLC 11791.61835.41442.21463.91560.41588.640.940.5
LC 21815.61860.41313.51350.71460.21493.260.764.5
LC 31960.91998.01299.61323.61480.81515.181.985.8
Publisher’s Note: MDPI stays neutral with regard to jurisdictional claims in published maps and institutional affiliations.

