Abstract
In this study, the propagation and evolution characteristics of internal solitary waves on slope topography in stratified fluids were investigated. A numerical model of internal solitary wave propagation based on the nonlinear potential flow theory using the multi-domain boundary element method was developed and validated. The numerical model was used to calculate the propagation process of internal solitary waves on the topography with different slope parameters, including height and angle, and the influence of slope parameters, initial amplitude, and densities jump of two-layer fluid on the evolution of internal solitary waves is discussed. It was found that the wave amplitude first increased while climbing the slope and then decreased after passing over the slope shoulder based on the calculation results, and the wave amplitude reached a maximum at the shoulder of the slope. A larger height and angle of the slope can induce larger maximum wave amplitude and more obvious tail wave characteristics. The wave amplitude gradually decreased, and a periodic tail wave was generated when propagating on the plateau after passing the slope. Both frequency and height of the tail wave were affected by the geometric parameters of the slope bottom; however, the initial amplitude of the internal solitary wave only affects the tail wave height, but not the frequency of the tail wave.
1. Introduction
Internal solitary waves are observed in many domains through synthetic aperture radar images and the measurement data of acoustic Doppler current profiler in oceans worldwide [1,2,3,4,5,6]. ISWs can propagate over long distances in the ocean owing to their large amplitude and concentrated energy [7], and they shoal with the influence of topography when propagating to the continental shelf area. The shoaling of ISWs upon sloping in oceans plays an important role in controlling the stratification and vertical distribution of biogeochemical matter in the water column [8,9,10]. In particular, the interaction between ISWs and the seabed is considered an important factor that promotes sediment suspension on the seabed and instability [11,12]. Meanwhile, strong ISW-induced shear flow during the shoaling process is a non-negligible threat to offshore engineering structures, such as oil drilling rigs, marine risers, and subsea pipelines [13,14].
The evolution characteristics of internal solitary waves on slope topography are very complicated, including various forms, such as breaking, fission, and polarity reversal. The evolution characteristics of internal solitary waves on slope topography have been studied extensively using experiments and numerical simulations aimed at changing the wave profile and flow field characteristics [15,16,17,18,19,20,21,22]. The breaking types of ISWs are studied using experiments and numerical simulations aimed at changing the wave profile and flow field characteristics [23,24,25]. However, ISWs can propagate over mild slopes without breaking, such as fission, polarity reversal, and the formation of trailing waves. Polarity inversion, wave fission and the forming of trailing waves are typical phenomenon while ISWs propagating over a gentle slope bottom. Most ISWs are depression waves due to stratification properties in the ocean, but the depression ISWs can change to elevation waves on the slope when the depth of upper layer is larger than that of the lower layer. Helfrich et al. conducted numerical simulations supplemented by inverse-scattering theory to investigate the change in polarity of the incident waves as they pass through the turning point of approximately equal layer depths, and the separation of the leading waves was observed [26]. Orr and Mignerey observed the conversion of nonlinear internal depression solitons to elevation internal waves through high-frequency acoustic flow visualization [27]. Meanwhile, the trailing waves following the initial waves can appear due to the dispersion effect while ISWs passing the slope topography. Shroyer et al. observed nonlinear internal waves propagating to the New Jersey coast and found the trailing face of the initial depression wave [28]. Zhi et al. found a trailing wave train when ISWs transforms over the slope using asymptotic theory and numerical simulation [29]. Lamb and Xiao conducted high-resolution two-dimensional numerical simulations of incompressible Euler equations to study the evolution of internal solitary waves shoaling onto a shelf, and the shoaling internal solitary waves generally fission into several waves [30]. The previous numerical studies on the evolution of ISWs propagating over slope bottom were mainly based on CFD method, and the boundary element method was rarely used to calculate these topics based on potential flow theory.
As an efficient numerical method, the boundary element method (BEM) is widely used in the calculation of water wave problems based on potential flow theory, which has excellent adaptability to complex boundaries due to the fact that only the boundary of the computational domain needs to be discretized. Longuet-Higgins and Cokelet introduced the boundary element method for the simulation of steep free surface waves [31]. Since then, BEM has been widely used for simulating the surface wave [32,33,34,35,36]. Meanwhile, comparisons of two-dimensional numerical results with laboratory experiments have shown that the potential theory can predict the characteristics of wave shoaling over slopes accurately [37,38,39]. Koo simulated the interaction of internal linear periodic waves with linear free surface waves using the BEM [40]. Gou et al. studied wave diffraction in a two-layer fluid using the BEM with linear boundary conditions [41]. Evans and Ford studied steady ISWs using an integral equation approach, assuming the rigid-lid condition at the top surface [42]. The existing investigations on internal waves using the BEM are mainly for linear periodic waves or steady solitary waves.
In this study, the evolution characteristics of ISWs propagating over slope bottom in a stratified fluid were investigated using a nonlinear numerical model based on the potential flow theory. The numerical simulations were conducted using multi-domain boundary element method which is an effective method to calculate evolution of water waves. The evolution of ISWs on variable bottom was rarely investigated using boundary element method in the existing investigation. A series of numerical cases were calculated with different slope parameters and initial wave amplitudes to study the relationship between the wave evolution characteristics and slope topography. The variations in wave amplitude, wave profile, and tail waves over different slope topographies were discussed.
2. Numerical Simulation
2.1. Physical Model
A system of two-layer fluids whose densities are denoted by and thicknesses by , with k = 1 for the upper fluid layer and k = 2 for the lower layer, is shown in Figure 1. The bottom of the fluid system is a rigid slope seabed with different geometric parameters. Cartesian coordinates are defined with the x-axis at the mean position of the interface between the two liquid layers. The surface at the top of the upper layer is denoted as , and the interface between the two liquid layers is .
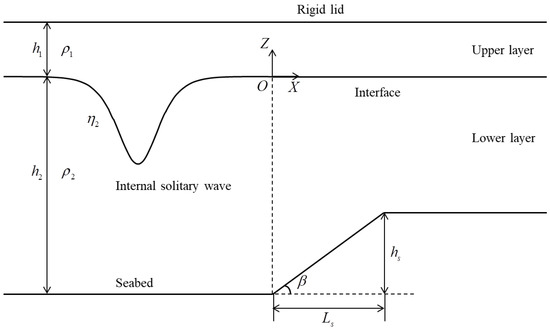
Figure 1.
Schematic of the numerical simulation domain, where the fluid of density and depth overlies the fluid of density and depth . Height of the slope is , and horizontal length of the slope is .
The flows in the two layers are assumed to be irrotational and incompressible. The fluid velocities for the two fluid layers can, thus, be expressed as the gradient of the potentials , that is, . The velocity potentials satisfy the Laplace equation:
The kinematic boundary conditions at the interface are that the normal velocity is continuous at the interface.
where n is the unit-outward normal of the domain considered.
The dynamic boundary condition is that the pressure is continuous at the interface. Using the Bernoulli equation, this can be expressed as:
The impenetrable boundary condition at the rigid seabed requires:
The top of the upper liquid layer is set as a rigid lid:
Using Green’s second identity, the velocity potentials in the upper and lower fluid layers can be expressed as the line integrals along their boundaries and , respectively.
where r is the field point, q is the source point, G (r, q) = −1/(2π)ln∣r − q∣ is the Green function, and c(r) is the solid angle of the boundary at r. Equation (6) can be further denoted as:
where .
2.2. Numerical Model
The boundary integral equation is solved using the boundary element method. Both boundaries and are discretized into n constant line elements from point to . Equation (7) are discretized are discretized using the constant elements as follows:
With the constant elements used, we consider , in Equation (8), and we have . In addition, we denote .
The two fluid layers have different densities such that the multi-domain boundary element method [43] should be adopted. For the two-layer computation domain, the boundary elements can be divided into two types, which are self nodes and common nodes, as shown in Figure 2. The boundary integral Equation (9) can be expressed as Equation (10).
where the superscript s and c denote self nodes and common nodes, respectively.
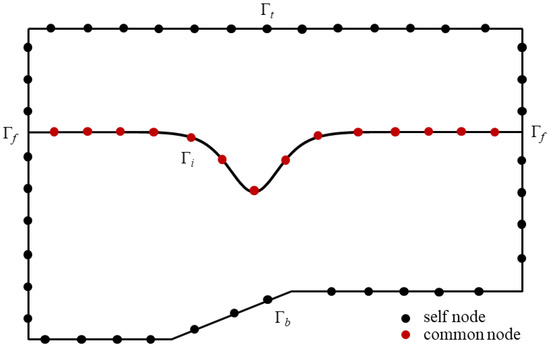
Figure 2.
Two types of element nodes of calculation domain boundaries, where black and red dot denote self and common nodes, respectively.
The boundary conditions of the left and right boundaries Γf are that fluid flux is zero as there is enough distance from solitary waves to the two boundaries. For the rigid-lid surface Γt and bottom Γb, impenetrable conditions are applied so the normal velocity is zero. Based on the pressure continuity and normal velocity continuity conditions at the interface, the two regions can be connected to solve the problem, and the multi-domain boundary element method is introduced to develop numerical model for the problem of internal solitary waves propagation and evolution. A specific calculation procedure can be found in the literature [44].
In fact, the normal velocity is continuous, but velocity potential of two-layer fluid is not continuous at the interface. Therefore, the interface between the two liquid layers is updated by Equation (11) because the interface displacement is mainly produced by the flow of the upper layer according to the literature [45].
For the interface, is introduced to update the velocity potential expressed explicitly. Therefore, the time-stepping scheme of the velocity potential at the interface can be derived from Equation (3) and is expressed as:
The interface and their potential distribution are updated using the fourth-order Runge–Kutta method. The initial solitary waves are given based on analytical theory, and the propagation processes are then calculated using fully nonlinear numerical models. For small-amplitude solitary waves, the initial condition is provided by the KdV theory solutions for a two-layer fluid [46]. The numerical simulations are performed using calculation codes developed based on MATLAB, and the flowchart which numerical simulations followed in the present study is shown in Figure 3.
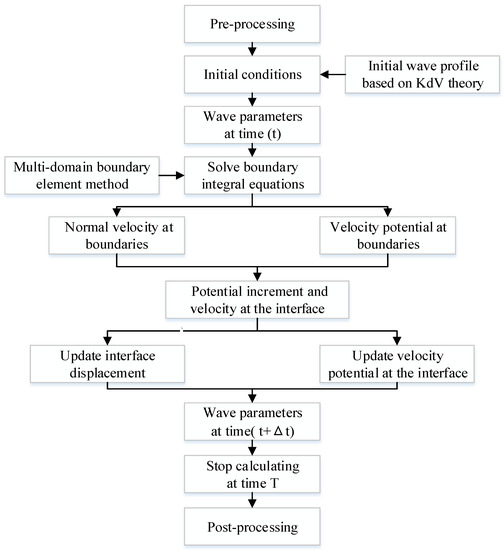
Figure 3.
The flowchart which numerical simulations followed in the current study.
3. Results
3.1. Numerical Model Validation
The verification of convergence in grid size and time step was conducted, and a comparison of the interfacial profiles simulated by the multi-domain boundary element method with various grid sizes is shown in Figure 4. It was found that the computational results converge when the grid size is along the length of the computational domain and the time step is , grid size of , and time step are adopted in the present numerical simulations. To evaluate the BEM model, we compared the time history of the displacement of the interface between the two liquid layers obtained from the computations with that of the experiments [47], as shown in Figure 5. Wave profiles are non-dimensionalized using the top layer thickness and the calculated wave speed . The computational results were obtained using BEM with a rigid lid boundary condition at the free surface, and the computational results of the BEM are in good agreement with the experimental data.
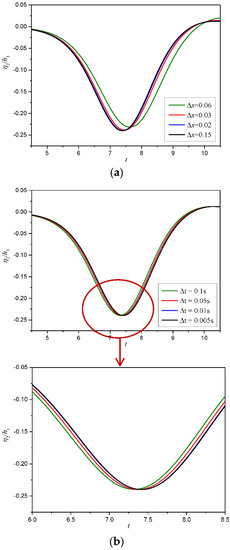
Figure 4.
Convergence verification of profile in regard to mesh sizes (a) and time step (b).
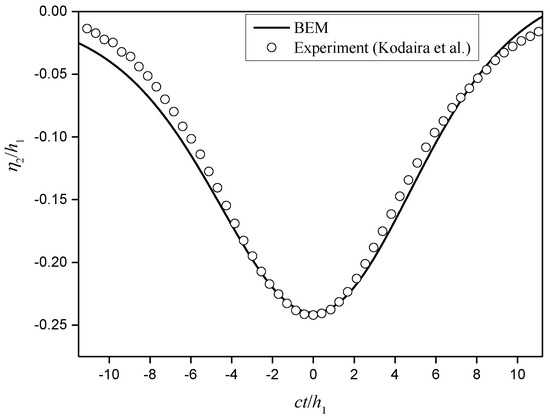
Figure 5.
Comparison of the computations and experiments [47] for the time history of the interface displacement of the internal wave.
In order to further verify the accuracy of the numerical model, the fluid velocity in the inner region was calculated using the present method. The velocity potential in the inner region can be expressed as integral Equation (13).
The fluid velocity in the inner region can be expressed as Equation (14) by differentiating Equation (13).
where, , .
The velocity of fluid in two layers region is obtained by solving Equation (14) using boundary element method, and the results agree well with the data in literature [48], as shown in Figure 6.
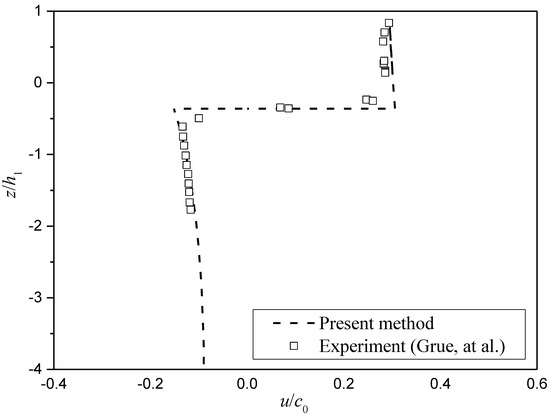
Figure 6.
The fluid horizontal velocity distribution in the inner region of internal solitary waves flow field and the comparison with literature [48].
c0 is the long wave speed defined by .
To investigate the effect of a slope on the evolution of ISWs, a series of numerical simulation cases for different slope bottoms and wave parameters were conducted, as shown in Table 1. The densities of two layer fluids are set as , , and the depths are set as , .

Table 1.
Main parameters of performed simulation cases.
3.2. Wave Evolution
The evolution of internal solitary waves was conducted, and the validation of amplitude variation while ISWs propagating over slope bottom in regard to mesh sizes is exhibited in Figure 7. It can be found that the convergence of present method to calculate the wave evolution can be ensured for the mesh scale . The wave amplitude variations for different slope heights and initial amplitudes when slope angle β = 20° are plotted in Figure 8. In the first stage (horizontal location x from −1 m to 0), the amplitude is nearly constant when the ISWs propagates above the flat bottom before slope topography, which is the natural attribute of solitary waves. In the second stage (from the slope start point x = 0 to the slope shoulder), the amplitude increases sharply for the up-slope topography and reaches a maximum at the shoulder of the slope, which can explain why the ISWs are observed around the offshore and coastal areas frequently. In the third stage (after the slope shoulder), the amplitude decreases significantly when the ISWs passes the shoulder and propagates over the plateau. The maximum amplitude increases with an increase in the slope height and can reach a nearly 20% increase from the original amplitude for the slope height hs = 0.18 m and initial dimensionless amplitude a0/h1 = 0.4. The amplitude decreases more sharply and reaches a smaller value after the location nearly x =1.25 m (Figure 4b) for a larger slope height owing to the energy reassignment while shoaling along the plateau because the wave suffers more energy rearrangement on the large height slope bottom.
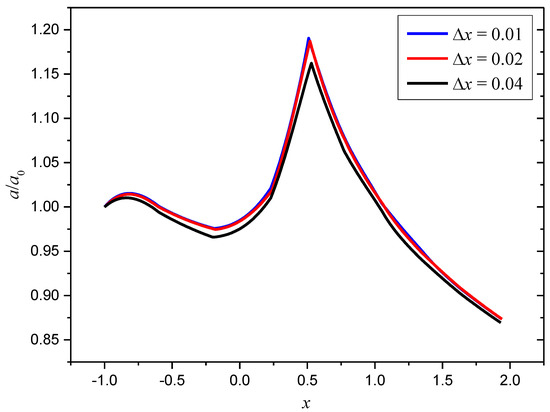
Figure 7.
Validation of amplitude variation while ISWs propagating over slope bottom in regard to mesh sizes for the case a0/h1 = 0.4 and hs = 0.18.
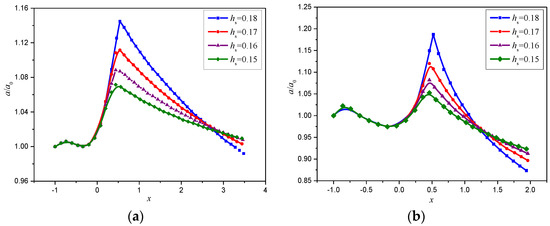
Figure 8.
Variation in dimensionless amplitude for different initial amplitudes and slope height along the propagation direction. The cases for the initial dimensionless amplitudes a0/h1 = 0.2 (a) and 0.4 (b), angle β = 20°, respectively.
The wave amplitude variations at different initial amplitudes are shown in Figure 9. It can be seen from the figure that the dimensionless maximum amplitude with respect to a0 increases with an increase in the initial amplitude, and a more notable decrease can be found for large wave heights above the slope bottom. Meanwhile, internal solitary waves with different initial amplitudes reach the maximum displacement at a similar location (the slope shoulder nearly horizontal location x = 0.5 m). Figure 10 shows the change of internal solitary wave amplitude under different slope angles (the slope angle β = 5°, 10°, 15°, 20°, respectively). The maximum dimensionless amplitudes increase with the increasing of slope angles, and the attenuation of the internal solitary wave is more obvious for a steeper slope.
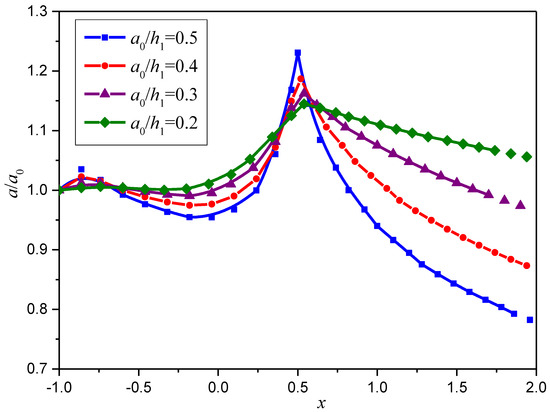
Figure 9.
Variation in dimensionless amplitude for different initial amplitudes and slope height hs = 0.18.
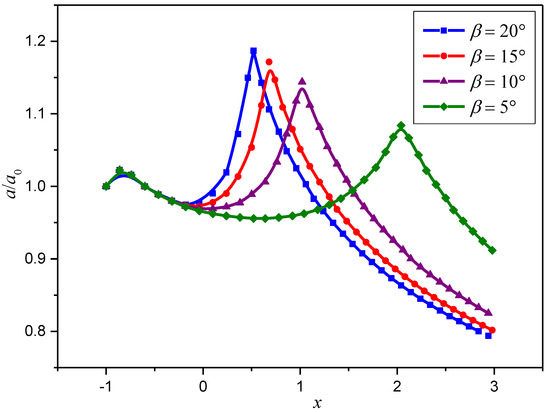
Figure 10.
Variation in dimensionless amplitude for different slope angles with initial wave amplitude a0/h1 = 0.4.
The variation of ISWs amplitudes versus different densities jump of two-layer fluids is shown in Figure 11, and it can be found that ISWs reach a larger value of amplitude for the larger densities jump. Meanwhile, the degree of attenuation is not affected by densities jump obviously, which is different with the effect of slope parameters and initial amplitude. Figure 12 shows the variation in the dimensionless maximum wave amplitude am/a0 for different slope heights, which indicates that the amplitude maximum increases with an increase in the slope height owing to the strong interaction between the wave and the bottom of the slope with a larger height. The increase in the maximum amplitude becomes sharper for the higher slope, which also indicates the apparent effect of slope topography on the evolution of internal solitary waves.

Figure 11.
Variation in dimensionless wave amplitude for different densities jump of two-layer fluids with initial wave amplitude a0/h1 = 0.4.
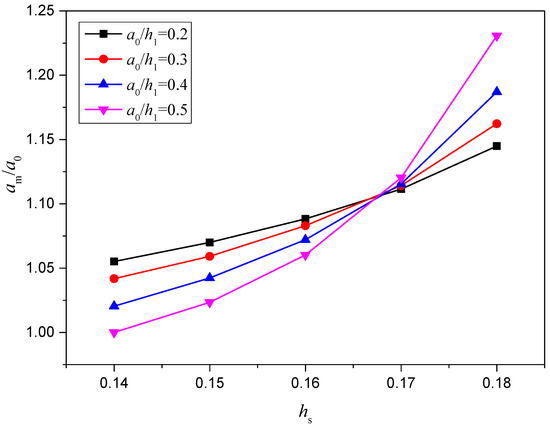
Figure 12.
Variation in dimensionless maximum wave amplitude for different slope heights with initial dimensionless wave amplitude a0/h1 = 0.2, 0.3, 0.4, and 0.5.
3.3. Tail Waves
In addition to the change in the wave height, the waveform of the internal solitary wave changes when it propagates on a slope terrain at different moments at t = 2 s, 4 s, 5 s, 7 s, as shown in Figure 13. In the process of climbing the slope, the lower-layer water continues to become shallower, which decreases the particle velocity of the leading face and results in a steeper waveform. When it passes the top of the slope, the leading edge of the internal solitary wave accelerated, causing the front face to broaden.
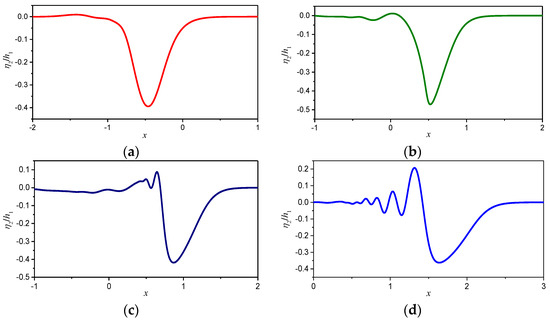
Figure 13.
The change in the internal solitary wave profile as it propagates along the slope topography for the case a0/h1 = 0.4 at moments t = 2 s (a), t = 4 s (b), t = 5s (c), t = 7s (d).The start point of the slope is located at x = 0, and the shoulder of the slope is at x = 0.5 with height hs = 0.18.
When internal solitary waves propagate on the slope, in addition to changes in waveform and amplitude, after passing the shoulder of the slope, the front face broadened, whereas the trailing face remained steep and the periodic trailing waves of the initial depression wave formed. This is because the lower water depth of the stratified fluid becomes shallower when passing through the slope terrain, resulting in the redistribution of energy to produce periodic tail waves. Therefore, the original wave is redistributed to a new prominent wave following a trailing wave.
The morphological characteristics of the tail waves’ time history profile at the observation point (horizontal location x = 1 m) under different slope height conditions are shown in Figure 14. Meanwhile, the moment when wave trough reaches the observation point is set to zero for the intuitional comparison. It was found that the higher the slope height, the more apparent the tail wave, which has a larger wave amplitude and a higher frequency. The maximum displacement of tail waves can reach 50% of ISWs amplitude for the case hs = 0.18 and a0/h1 = 0.4. The characteristics of the tail wave under different initial wave amplitude conditions at the horizontal location (x = 1 m) for the slope height hs = 0.18 and slope angle β = 20° are shown in Figure 15. It was found that the characteristics of the tail waves are also closely related to the value of the initial wave amplitude. The larger the initial wave amplitude, the more apparent the tail wave, which has a larger wave amplitude. However, the tail waves generated under different initial amplitude conditions had the same frequency. Meanwhile, it was also found that the larger the initial wave amplitude, the more apparent the asymmetry of the evolved waveform, and the smoother the front face.
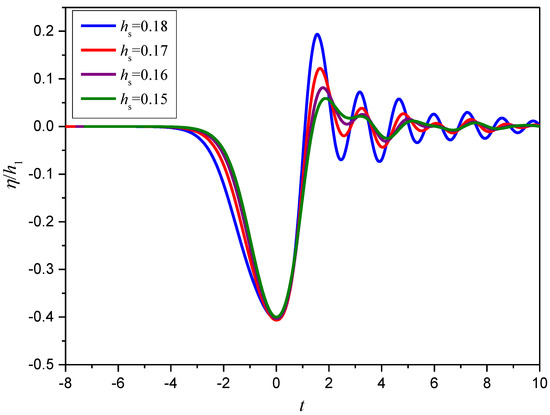
Figure 14.
Characteristics of the tail waves under different slope height conditions.
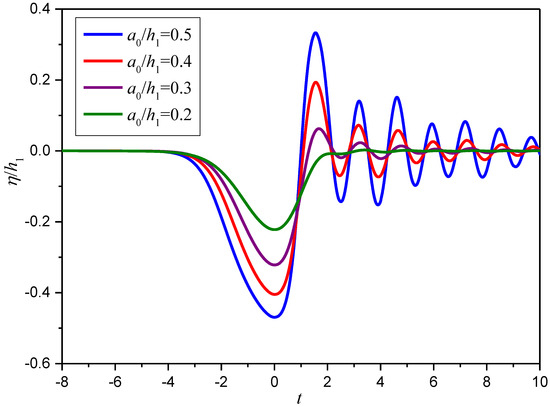
Figure 15.
Characteristics of the tail waves for different initial wave amplitudes.
4. Conclusions
In this study, we developed a numerical model to calculate the propagation and evolution of internal solitary waves on slope topography, and a series of calculations were performed for different slope geometrical parameters, initial amplitudes, and densities jump of two-layer fluid. The influence of different slope heights and slope angles on the evolution characteristics of internal solitary waves was discussed, and the following conclusions were obtained.
In the process of internal solitary waves propagating over slope topography, the dimensionless wave amplitude first increased from the slope start point and reached its maximum value at the shoulder of the slope. Then, the amplitude decreased while propagating over the plateau. The maximum amplitude increased with the height and angle of the slope, and the attenuation of amplitude was more apparent after passing the steeper slope. Meanwhile, the larger initial amplitude and densities jump can induce larger wave amplitude above the shoulder of the slope topography. In the process of climbing the slope, the lower water continues to become shallower, which decreases the particle velocity of the leading face and results in a steeper waveform.
When it passes the top of the slope, the leading edge of the internal solitary wave accelerated, causing the front face to broaden. After passing the slope, the redistribution of energy promoted the generation of periodic tail waves, and the original wave is redistributed to a new prominent wave following a trailing wave. The greater the initial amplitude of the internal solitary wave, the more apparent the tail wave produced. Meanwhile, when the slope height is larger, the tail wave produced also had a larger amplitude and higher frequency. The period of the tail wave is unrelated to the size of the initial wave amplitude; however, it has a closer relationship with the slope height and angle.
Author Contributions
Methodology, Y.H., L.Z.; validation, X.M., Z.S. and A.W.; investigation, Y.H., L.Z.; writing—original draft preparation, Y.H.; writing—review and editing, L.Z., T.S.; funding acquisition, L.Z. All authors have read and agreed to the published version of the manuscript.
Funding
The present work is supported by the National Key Research and Development Program of China (2019YFC0312400), (2019YFC0312402). National Natural Science Foundation of China (52071056).
Conflicts of Interest
The authors declare no conflict of interest.
References
- Helfrich, K.R.; Melville, W.K. Long Nonlinear Internal Waves. Annu. Rev. Fluid Mech. 2006, 38, 395–425. [Google Scholar] [CrossRef]
- Stanton, T.P.; Ostrovsky, L. Observations of highly nonlinear internal solitons over the continental shelf. Geophys. Res. Lett. 1998, 25, 2695–2698. [Google Scholar] [CrossRef]
- Magalhaes, J.M.; Da Silva, J.C.B. Internal Solitary Waves in the Andaman Sea: New Insights from SAR Imagery. Remote Sens. 2018, 10, 861. [Google Scholar] [CrossRef] [Green Version]
- Li, Y.; Wang, C.; Liang, C.; Li, J.; Liu, W. A simple early warning method for large internal solitary waves in the northern South China Sea. Appl. Ocean Res. 2016, 61, 167–174. [Google Scholar] [CrossRef]
- Jia, T.; Liang, J.; Li, X.-M.; Fan, K. Retrieval of Internal Solitary Wave Amplitude in Shallow Water by Tandem Spaceborne SAR. Remote Sens. 2019, 11, 1706. [Google Scholar] [CrossRef] [Green Version]
- Magalhaes, J.M.; Alpers, W.; Santos-Ferreira, A.M.; Da Silva, J.C.B. Surface wave breaking caused by internal solitary waves effects on radar backscattering measured by SAR and radar altimeter. Oceanography 2021, 34, 14–24. [Google Scholar] [CrossRef]
- Ledwell, J.R.; Hickey, B.M. Evidence for enhanced boundary mixing in the Santa Monica Basin. J. Geophys. Res. Space Phys. 1995, 100, 20665–20679. [Google Scholar] [CrossRef]
- Wüest, A.; Piepke, G.; Van Senden, D.C. Turbulent kinetic energy balance as a tool for estimating vertical diffusivity in wind-forced stratified waters. Limnol. Oceanogr. 2000, 45, 1388–1400. [Google Scholar] [CrossRef]
- Aghsaee, P.; Boegman, L.; Lamb, K.G. Breaking of shoaling internal solitary waves. J. Fluid Mech. 2010, 659, 289–317. [Google Scholar] [CrossRef] [Green Version]
- Nakayama, K.; Sato, T.; Shimizu, K.; Boegman, L. Classification of internal solitary wave breaking over a slope. Phys. Rev. Fluids 2019, 4, 014801. [Google Scholar] [CrossRef] [Green Version]
- Tian, Z.; Guo, X.; Qiao, L.; Jia, Y.; Yu, L. Experimental investigation of slope sediment resuspension characteristics and influencing factors beneath the internal solitary wave-breaking process. Bull. Int. Assoc. Eng. Geol. 2017, 78, 959–967. [Google Scholar] [CrossRef]
- Lamb, K.G. Particle transport by nonbreaking, solitary internal waves. J. Geophys. Res. Space Phys. 1997, 102, 18641–18660. [Google Scholar] [CrossRef]
- Cai, S.; Long, X.; Wang, S. Forces and torques exerted by internal solitons in shear flows on cylindrical piles. Appl. Ocean Res. 2008, 30, 72–77. [Google Scholar] [CrossRef]
- Zhu, H.; Lin, C.; Wang, L.; Kao, M.; Tang, H.; Williams, J.J.R. Numerical investigation of internal solitary waves of elevation type propagating on a uniform slope. Phys. Fluids 2018, 30, 116602. [Google Scholar] [CrossRef]
- Lamb, K.G.; Nguyen, V.T. Calculating Energy Flux in Internal Solitary Waves with an Application to Reflectance. J. Phys. Oceanogr. 2009, 39, 559–580. [Google Scholar] [CrossRef]
- Chen, W.; Wang, D.; Xu, L.; Lv, Z.; Wang, Z.; Gao, H. On the Slope Stability of the Submerged Trench of the Immersed Tunnel Subjected to Solitary Wave. J. Mar. Sci. Eng. 2021, 9, 526. [Google Scholar] [CrossRef]
- Li, J.; Zhang, Q.; Chen, T. ISWFoam: A numerical model for internal solitary wave simulation in continuously stratified fluids. Geosci. Model Dev. 2021. preprint. [Google Scholar] [CrossRef]
- Bourgault, D.; Blokhina, M.D.; Mirshak, R.; Kelley, D.E. Evolution of a shoaling internal solitary wave train. Geophys. Res. Lett. 2007, 34, L03601. [Google Scholar] [CrossRef] [Green Version]
- Ali, L.; Makhdoom, N.; Gao, Y.; Fang, P.; Khan, S.; Bai, Y. Metocean Criteria for Internal Solitary Waves Obtained from Numerical Models. Water 2021, 13, 1554. [Google Scholar] [CrossRef]
- Deepwell, D.; Sapède, R.; Buchart, L.; Swaters, G.E.; Sutherland, B.R. Particle transport and resuspension by shoaling internal solitary waves. Phys. Rev. Fluids 2020, 5, 054303. [Google Scholar] [CrossRef]
- Cheng, M.-H.; Hsu, J.R. Effect of frontal slope on waveform evolution of a depression interfacial solitary wave across a trapezoidal obstacle. Ocean Eng. 2013, 59, 164–178. [Google Scholar] [CrossRef]
- Chen, C.-Y.; Hsu, J.R.-C.; Chen, H.-H.; Kuo, C.-F.; Cheng, M.-H. Laboratory observations on internal solitary wave evolution on steep and inverse uniform slopes. Ocean Eng. 2007, 34, 157–170. [Google Scholar] [CrossRef]
- Helfrich, K.R. Internal solitary wave breaking and run-up on a uniform slope. J. Fluid Mech. 1992, 243, 133–154. [Google Scholar] [CrossRef]
- Michallet, H.; Ivey, G.N. Experiments on mixing due to internal solitary waves breaking on uniform slopes. J. Geophys. Res. Space Phys. 1999, 104, 13467–13477. [Google Scholar] [CrossRef]
- Cavaliere, D.; la Forgia, G.; Adduce, C.; Alpers, W.; Martorelli, E.; Falcini, F. Breaking Location of Internal Solitary Waves Over a Sloping Seabed. J. Geophys. Res. Oceans 2021, 126, e2020JC016669. [Google Scholar] [CrossRef]
- Helfrich, K.R.; Melville, W.K.; Miles, J.W. On interfacial solitary waves over slowly varying topography. J. Fluid Mech. 1984, 149, 305–317. [Google Scholar] [CrossRef] [Green Version]
- Orr, M.H.; Mignerey, P.C. Nonlinear internal waves in the South China Sea: Observation of the conversion of depression internal waves to elevation internal waves. J. Geophys. Res. Space Phys. 2003, 108. [Google Scholar] [CrossRef]
- Shroyer, E.L.; Moum, J.N.; Nash, J. Observations of Polarity Reversal in Shoaling Nonlinear Internal Waves. J. Phys. Oceanogr. 2009, 39, 691–701. [Google Scholar] [CrossRef] [Green Version]
- Zhi, C.; Chen, K.; You, Y. Internal solitary wave transformation over the slope: Asymptotic theory and numerical simulation. J. Ocean Eng. Sci. 2018, 3, 83–90. [Google Scholar] [CrossRef]
- Lamb, K.G.; Xiao, W. Internal solitary waves shoaling onto a shelf: Comparisons of weakly-nonlinear and fully nonlinear models for hyperbolic-tangent stratifications. Ocean Model. 2014, 78, 17–34. [Google Scholar] [CrossRef]
- Longuet-Higgins, M.S.; Cokelet, E.D. Deformation of steep surface-waves on water. Proc. R. Soc. A Math. Phys. Eng. Sci. 1976, 350, 1–26. [Google Scholar]
- Liu, P.L.-F.; Hsu, H.-W.; Lean, M.H. Applications of boundary integral equation methods for two-dimensional non-linear water wave problems. Int. J. Numer. Methods Fluids 1992, 15, 1119–1141. [Google Scholar] [CrossRef]
- Sun, Z.; Pang, Y.; Li, H. Two dimensional fully nonlinear numerical wave tank based on the BEM. J. Mar. Sci. Appl. 2012, 11, 437–446. [Google Scholar] [CrossRef]
- Jiang, S.-C.; Teng, B.; Gou, Y.; Ning, D.-Z. A precorrected-FFT higher-order boundary element method for wave–body problems. Eng. Anal. Bound. Elem. 2012, 36, 404–415. [Google Scholar] [CrossRef]
- Riesner, M.; el Moctar, O. A time domain boundary element method for wave added resistance of ships taking into account viscous effects. Ocean Eng. 2018, 162, 290–303. [Google Scholar] [CrossRef]
- Abbasnia, A.; Soares, C.G. Fully nonlinear simulation of wave interaction with a cylindrical wave energy converter in a numerical wave tank. Ocean Eng. 2018, 152, 210–222. [Google Scholar] [CrossRef]
- Grilli, S.T.; Subramanya, R.; Svendsen, I.A.; Veeramony, J. Shoaling of Solitary Waves on Plane Beaches. J. Waterw. Port Coast. Ocean Eng. 1994, 120, 609–628. [Google Scholar] [CrossRef] [Green Version]
- Grilli, S.T.; Svendsen, I.A.; Subramanya, R. Breaking Criterion and Characteristics for Solitary Waves on Slopes. J. Waterw. Port Coast. Ocean Eng. 1997, 123, 102–112. [Google Scholar] [CrossRef] [Green Version]
- Guyenne, P.; Grilli, S.T. Numerical study of three-dimensional overturning waves in shallow water. J. Fluid Mech. 2006, 547, 361–388. [Google Scholar] [CrossRef] [Green Version]
- Koo, W. Free surface simulation of a two-layer fluid by boundary element method. Int. J. Nav. Archit. Ocean Eng. 2010, 2, 127–131. [Google Scholar] [CrossRef] [Green Version]
- Gou, Y.; Chen, X.-J.; Bin, T. A Time-Domain Boundary Element Method for Wave Diffraction in a Two-Layer Fluid. J. Appl. Math. 2012, 2012, 686824. [Google Scholar] [CrossRef]
- Evans, W.A.B.; Ford, M.J. An integral equation approach to internal (2-layer) solitary waves. Phys. Fluids 1996, 8, 2032–2047. [Google Scholar] [CrossRef]
- Gao, X.-W.; Guo, L.; Zhang, C. Three-step multi-domain BEM solver for nonhomogeneous material problems. Eng. Anal. Bound. Elem. 2007, 31, 965–973. [Google Scholar] [CrossRef]
- Zou, L.; Hu, Y.; Wang, Z.; Pei, Y.; Yu, Z. Computational analyses of fully nonlinear interaction of an internal solitary wave and a free surface wave. AIP Adv. 2019, 9, 035234. [Google Scholar] [CrossRef] [Green Version]
- Camassa, R.; Choi, W.; Michallet, H.; Rusås, P.-O.; Sveen, J.K. On the realm of validity of strongly nonlinear asymptotic approximations for internal waves. J. Fluid Mech. 2006, 549, 1–23. [Google Scholar] [CrossRef] [Green Version]
- Kakutani, T.; Yamasaki, N. Solitary Waves on a Two-Layer Fluid. J. Phys. Soc. Jpn. 1978, 45, 674–679. [Google Scholar] [CrossRef]
- Kodaira, T.; Waseda, T.; Miyata, M.; Choi, W. Internal solitary waves in a two-fluid system with a free surface. J. Fluid Mech. 2016, 804, 201–223. [Google Scholar] [CrossRef] [Green Version]
- Grue, J.; Jensen, A.; Rusås, P.-O.; Sveen, J.K. Properties of large-amplitude internal waves. J. Fluid Mech. 1999, 380, 257–278. [Google Scholar] [CrossRef] [Green Version]
Publisher’s Note: MDPI stays neutral with regard to jurisdictional claims in published maps and institutional affiliations. |
© 2021 by the authors. Licensee MDPI, Basel, Switzerland. This article is an open access article distributed under the terms and conditions of the Creative Commons Attribution (CC BY) license (https://creativecommons.org/licenses/by/4.0/).