Abstract
The International Maritime Organization (IMO) Guidelines for Determining Minimum Propulsion Power to Maintain the Maneuverability in Adverse Conditions is the sole regulation imposed on the routine design and approval of all new-built ships as a part of EEDI requirements. This study reviews the development of the guidelines and summarizes the recent amendments of MEPC76(2021). The present assessment is conducted for a new VLCC design following the new guidelines aiming at investigating the influence of alternative wave added resistance evaluation methods and the propeller design features on the assessment results. It is found that the most simple empirical formula method proposed by MEPC76 is not conservative enough, as could have been expected. On the other hand, spectral analysis methods based on empirically obtained and properly validated wave added resistance responses can produce consistent results. Moreover, discussions are made from the perspective of propeller design to meet the regulatory requirements. It is pointed out that the light running margin is a key design parameter, and propellers with larger light running margins are more advantageous for satisfying the minimum propulsion power regulation, thus ensuring the navigation safety in adverse conditions. These obtained insights and know-how can support the engineers in obtaining optimal design solutions.
1. Introduction
In the course of development of IMO’s framework for the Energy Efficiency Design Index (EEDI) regulations to reduce GHG emissions from shipping, serious concerns were expressed by the maritime industry that when the EEDI regulations came into force, the safety of ships when operating in adverse conditions may be compromised, namely, designers and shipowners may opt for a reduction of ship’s design speed to achieve the required EEDI, which in turn would result in a reduced installed power. However, these ships may have insufficient power to navigate safely in adverse conditions. As safety should have priority, provisions ensuring ship’s safety should be, and were finally, established within the EEDI regulatory framework. On this background, the International Association of Classification Societies (IACS) proposed that a ship should be able to maintain a minimum speed (and have a minimum power) to maintain the maneuverability for safe navigation in adverse conditions as a necessary safeguard [1,2]. This concept was further developed, and, finally, several practical methods were recommended to form the 2013 Interim Guidelines as IMO’s important instrument to ensure the navigational safety of newly designed EEDI-compliant ships [3].
The 2013 interim minimum power guidelines address tankers and bulk carriers, as these ship types normally have a low design speed (thus relatively low installed power) and are most at risk when optimized for even lower EEDI values. As the scientific problem of maneuverability in waves is highly demanding, further, in-depth research efforts were devoted to the subject to examine the new guidelines as well as to enhance the understanding of the complex problem [4,5,6,7,8]. The most extensive study should be credited to projects SHOPERA and JASNAOE [9], which led to the draft revisions for the 2013 interim guidelines [10,11]. At MEPC 71 in 2017, the validity of the 2013 Interim Guidelines was extended to EEDI phase 2 [12]. As the Interim Guidelines were the only regulation imposed on the routine design and approval of all new-built ships as a part of EEDI requirements, it was urgently required to be finalized, while the planned extension to all existing ships poses additional problems in view of the industry’s tendency to use engine power limitation as the main method to meet the EEXI requirement [13]. Thus, an intersessional working group was formed by IMO-MEPC to work on the guidelines based on the submission of SHOPERA [14]. After extensive discussions, this working group recently submitted the proposed amendments to the guidelines [13]. MEPC 76 (2021) approved these amendments to the guidelines for determining minimum propulsion power to maintain the maneuverability of ships in adverse conditions [15]. At this stage, as the guidelines are being finalized, case studies based on proven engineering designs can be conducted following the newly amended guidelines, to provide timely feedback to the regulators to further validate the regulations and revise them if necessary.
This study first summarizes the major amendments of the newly approved guidelines. Then, the minimum propulsion power assessments are conducted for a VLCC to show the impact of the new guidelines on the ship powering requirement. For this new design, the impact of using different methods for predicting added resistance, and of selecting different propellers and engines, are discussed. The insights gained from the assessment results are also presented and discussed.
2. Major Amendments
The amendments are detailed in MEPC 76/5/1 (2021) [13]. The major revisions are summarized as follows:
A. Revised definition of adverse conditions (wave and wind conditions).
The definition of “adverse conditions” for the assessment of ship of different sizes has been strengthened, as shown in Table 1.

Table 1.
Definition of the ship-size-dependent adverse conditions.
B. The “simplified assessment” method in the 2013 Interim Guidelines is discarded and is replaced by a new “minimum power assessment” method, which is built upon the methodology of “maximum total resistance in the longitudinal ship direction over wind and wave directions from head to 30 degrees off-bow”, rather than the previous level 2 methodology of “course-keeping of the ships in waves and wind from all directions”. For this reason, the navigational speed of the ship for assessment is defined to an even-lower 2 knots.
C. Default conservative estimates of thrust deduction factor t and wake fraction w.
In the new guidelines, default conservative estimates are t = 0.1 and w = 0.15, respectively. In contrast, the default conservative estimates given in the 2013 Interim Guidelines were, for CB > 0.8, the wake fraction w = 0.35, and the thrust deduction fraction t = 0.245. This change of t will lead to significant change of the required thrust, and apparently it will also change the resultant hull efficiency .
D. New methods recommended for the prediction of added resistance in waves.
In the finalized guidelines, several practical methods are recommended to facilitate the minimum propulsion power assessment.
(1) A simple formula is defined in Article-15.1, herein it will be denoted as Method-A:
where d (m) is the draft at the maximum summer load condition; B (m) is ship breadth; U (m/s) is ship speed.
(2) Spectrum method as defined in Article-15.2. This method requires the use of added resistance in regular waves of various headings, which can be supplied either by conducting experiments or applying the recommended numerical methods.
where
| (N/m2) | is the quadratic transfer function of the added resistance in regular waves and A is the wave amplitude. |
| is the seaway spectrum specified as JONSWAP spectrum with the peak parameter 3.3. | |
| is the spreading function of wave energy with respect to mean wave direction specified as cos2-directional spreading. | |
| (rad/s) | is the wave frequency of component. |
| (rad) | is the encountered angle between ship and wave. |
| (rad) | is the direction of the wave component. |
(3) The new guidelines recommend a semi-empirical formula for determining the quadratic transfer functions of added resistance in regular waves .
(4) The range of peak wave periods applied in the assessment is from to the greater one of or 12.0 s. For a ship with LPP > 250, = 6.0 m, this results in the range of to be [8.82, 12.25] s.
(5) The guideline also allows experiments in regular waves to be conducted to derive the mean value in irregular waves. The extent of the experiments varies from head wave condition only, to head waves and up to 120 degrees off-bow.
(6) Table 2 summarizes the methods for calculating the mean added resistance used for the assessment.
Table 2.
Methods for wave added resistance calculation.
E. Introduction of maximum added rudder resistance due to maneuvering in seaway = 0.03∙Ter, where Ter is the propeller thrust excluding from T.
F. Modified requirements on the determination of aerodynamic resistance coefficient X’w for the calculation of added resistance due to wind, as specified by Articles 13 and 14.
3. On the Recommended Methods for Added Resistance Prediction
One major amendment is the introduction of numerical methods for the prediction of added resistance in waves. This is in contrary to the previous version interim guideline, which requires the execution of seakeeping tests.
For the Method-1, only the main particulars L, B, and d are involved in calculation, and its execution is straightforward. This is not unusual in a preliminary assessment, as long as the simple method delivers a conservative result.
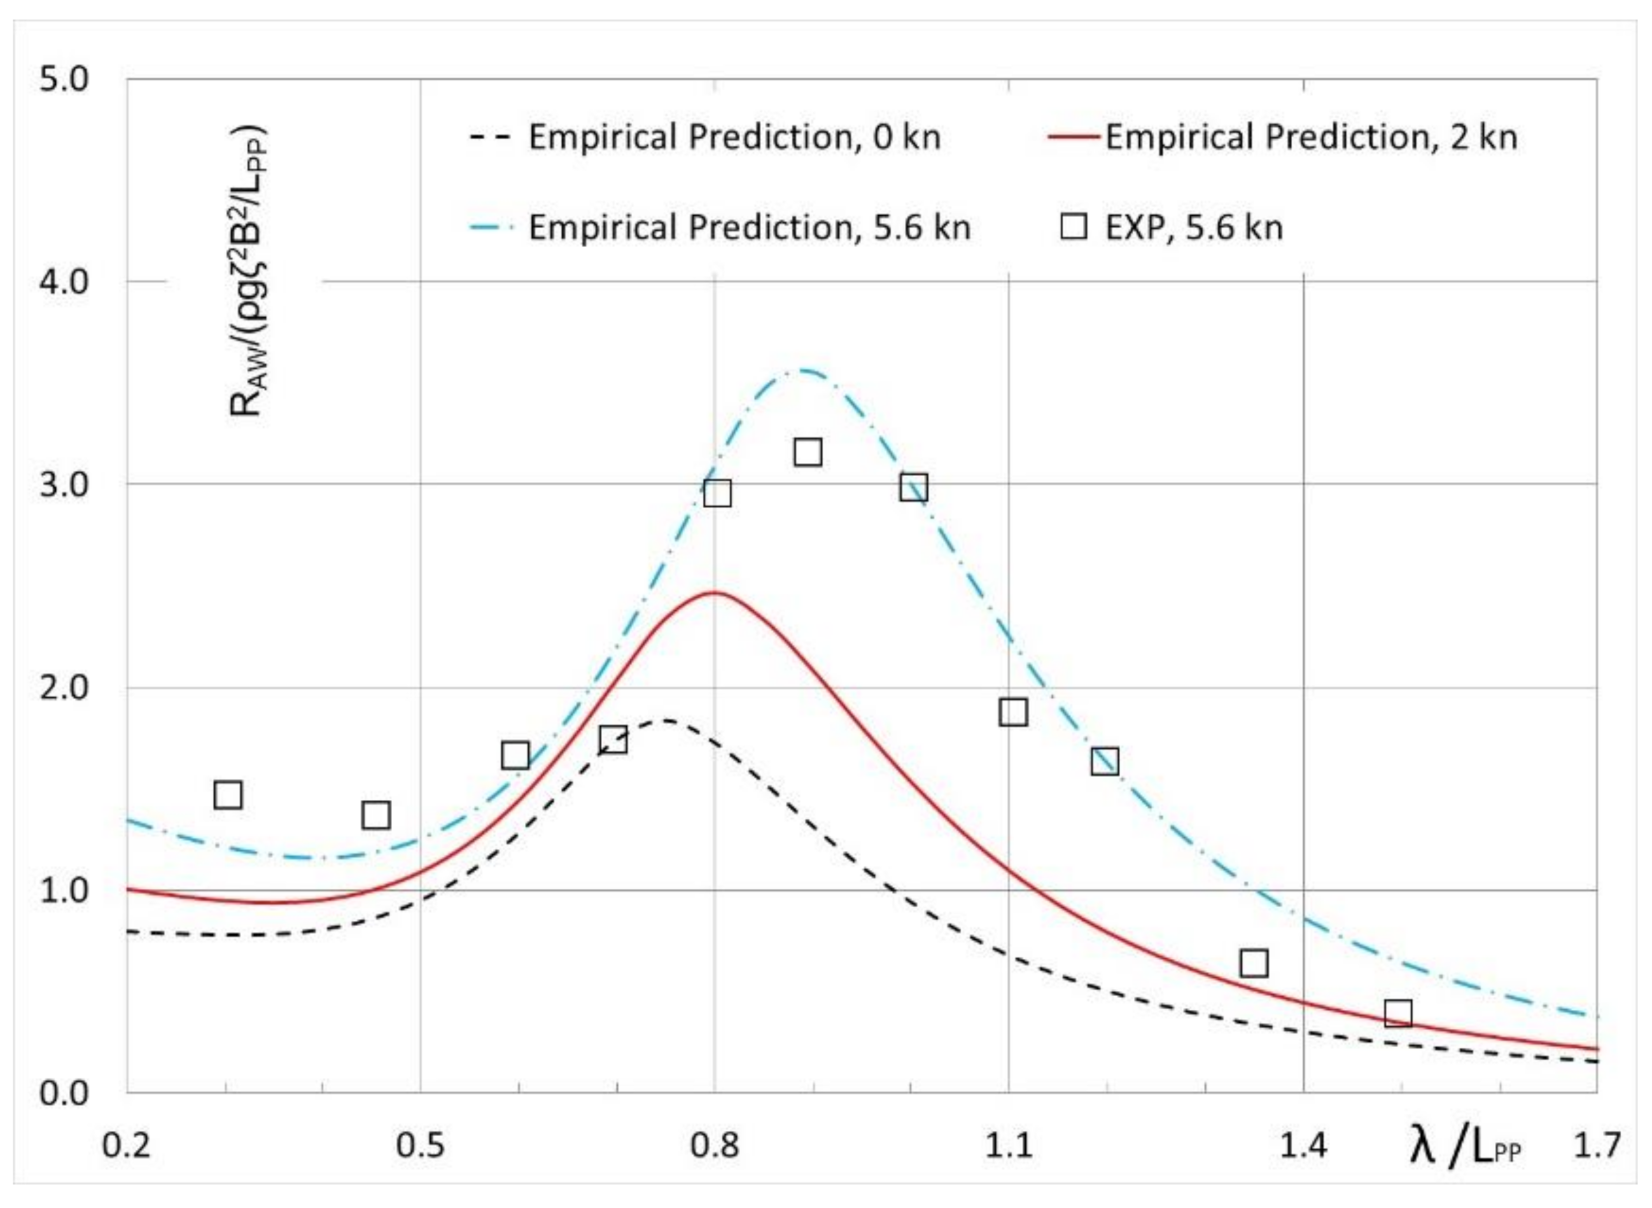
For the Methods 2–4 in Table 2, a semiempirical method is recommended to generate the quadratic transfer function of the added resistance in regular waves. Figure 1 shows the predicted added resistance of the VLCC design in regular head waves at several low speeds, together with available experimental results at 5.6 knots, which is the required ship advance speed for minimum propulsion assessment according to the previous version interim guideline, which was still in effect when the test was performed. The experiment is performed in the towing tank of MARIC (280 m long, 10 m wide, and 5 m deep) using a ship model of about 4 m in length. At the speed of 5.6 knots, the agreement between numerical and experimental results is, in general, satisfactory. More validations of the semi-empirical method can be found in previous publications [16].
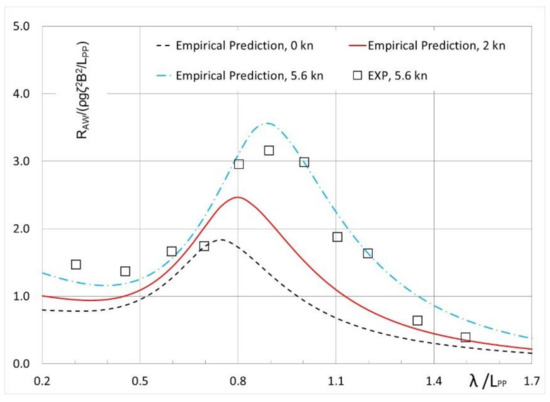
Figure 1.
Added resistance of the VLCC design at low speeds in regular head waves at scantling draft, T = 22 m.
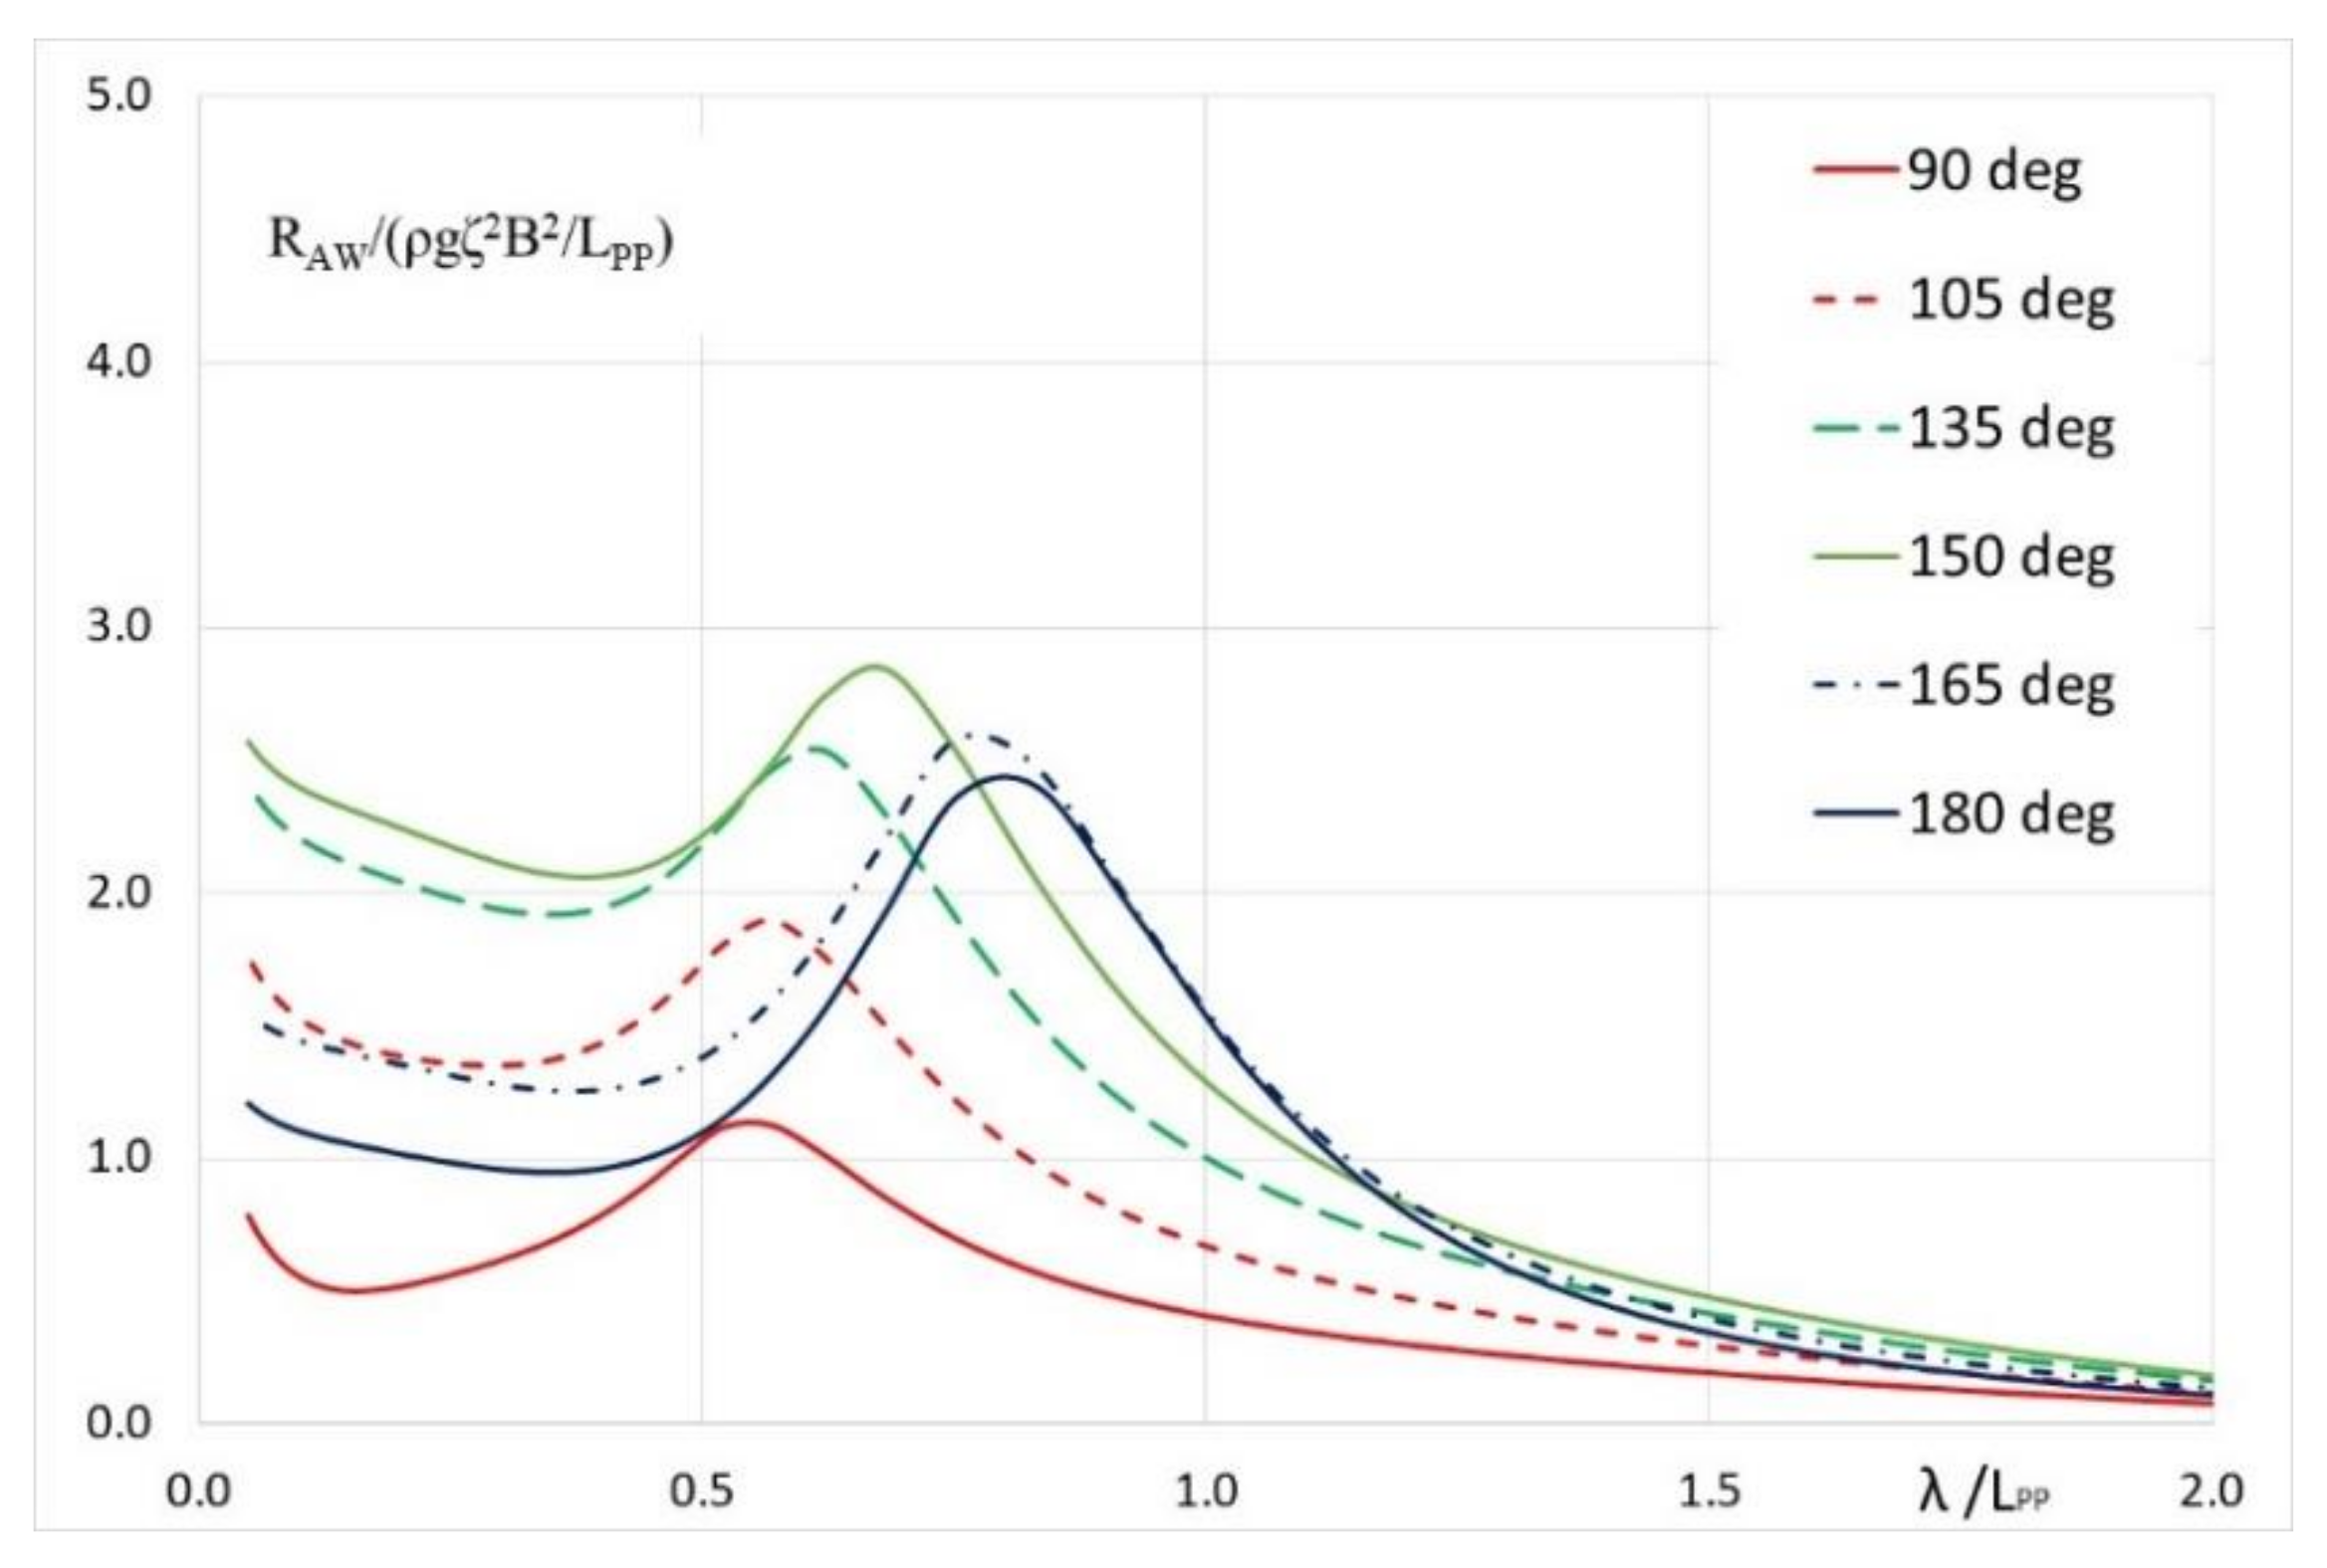
Figure 2 shows the predicted added resistance of the VLCC design in regular waves of various directions at 2 knots, which follows the newly amended guidelines. From this graph, it is observed that the maximum of the wave added resistance responses does not correspond to the head wave direction (180 deg case), which is in line with the guidelines (Article 18).

Figure 2.
Added resistance of the subject VLCC at 2 knots in regular waves of various directions.
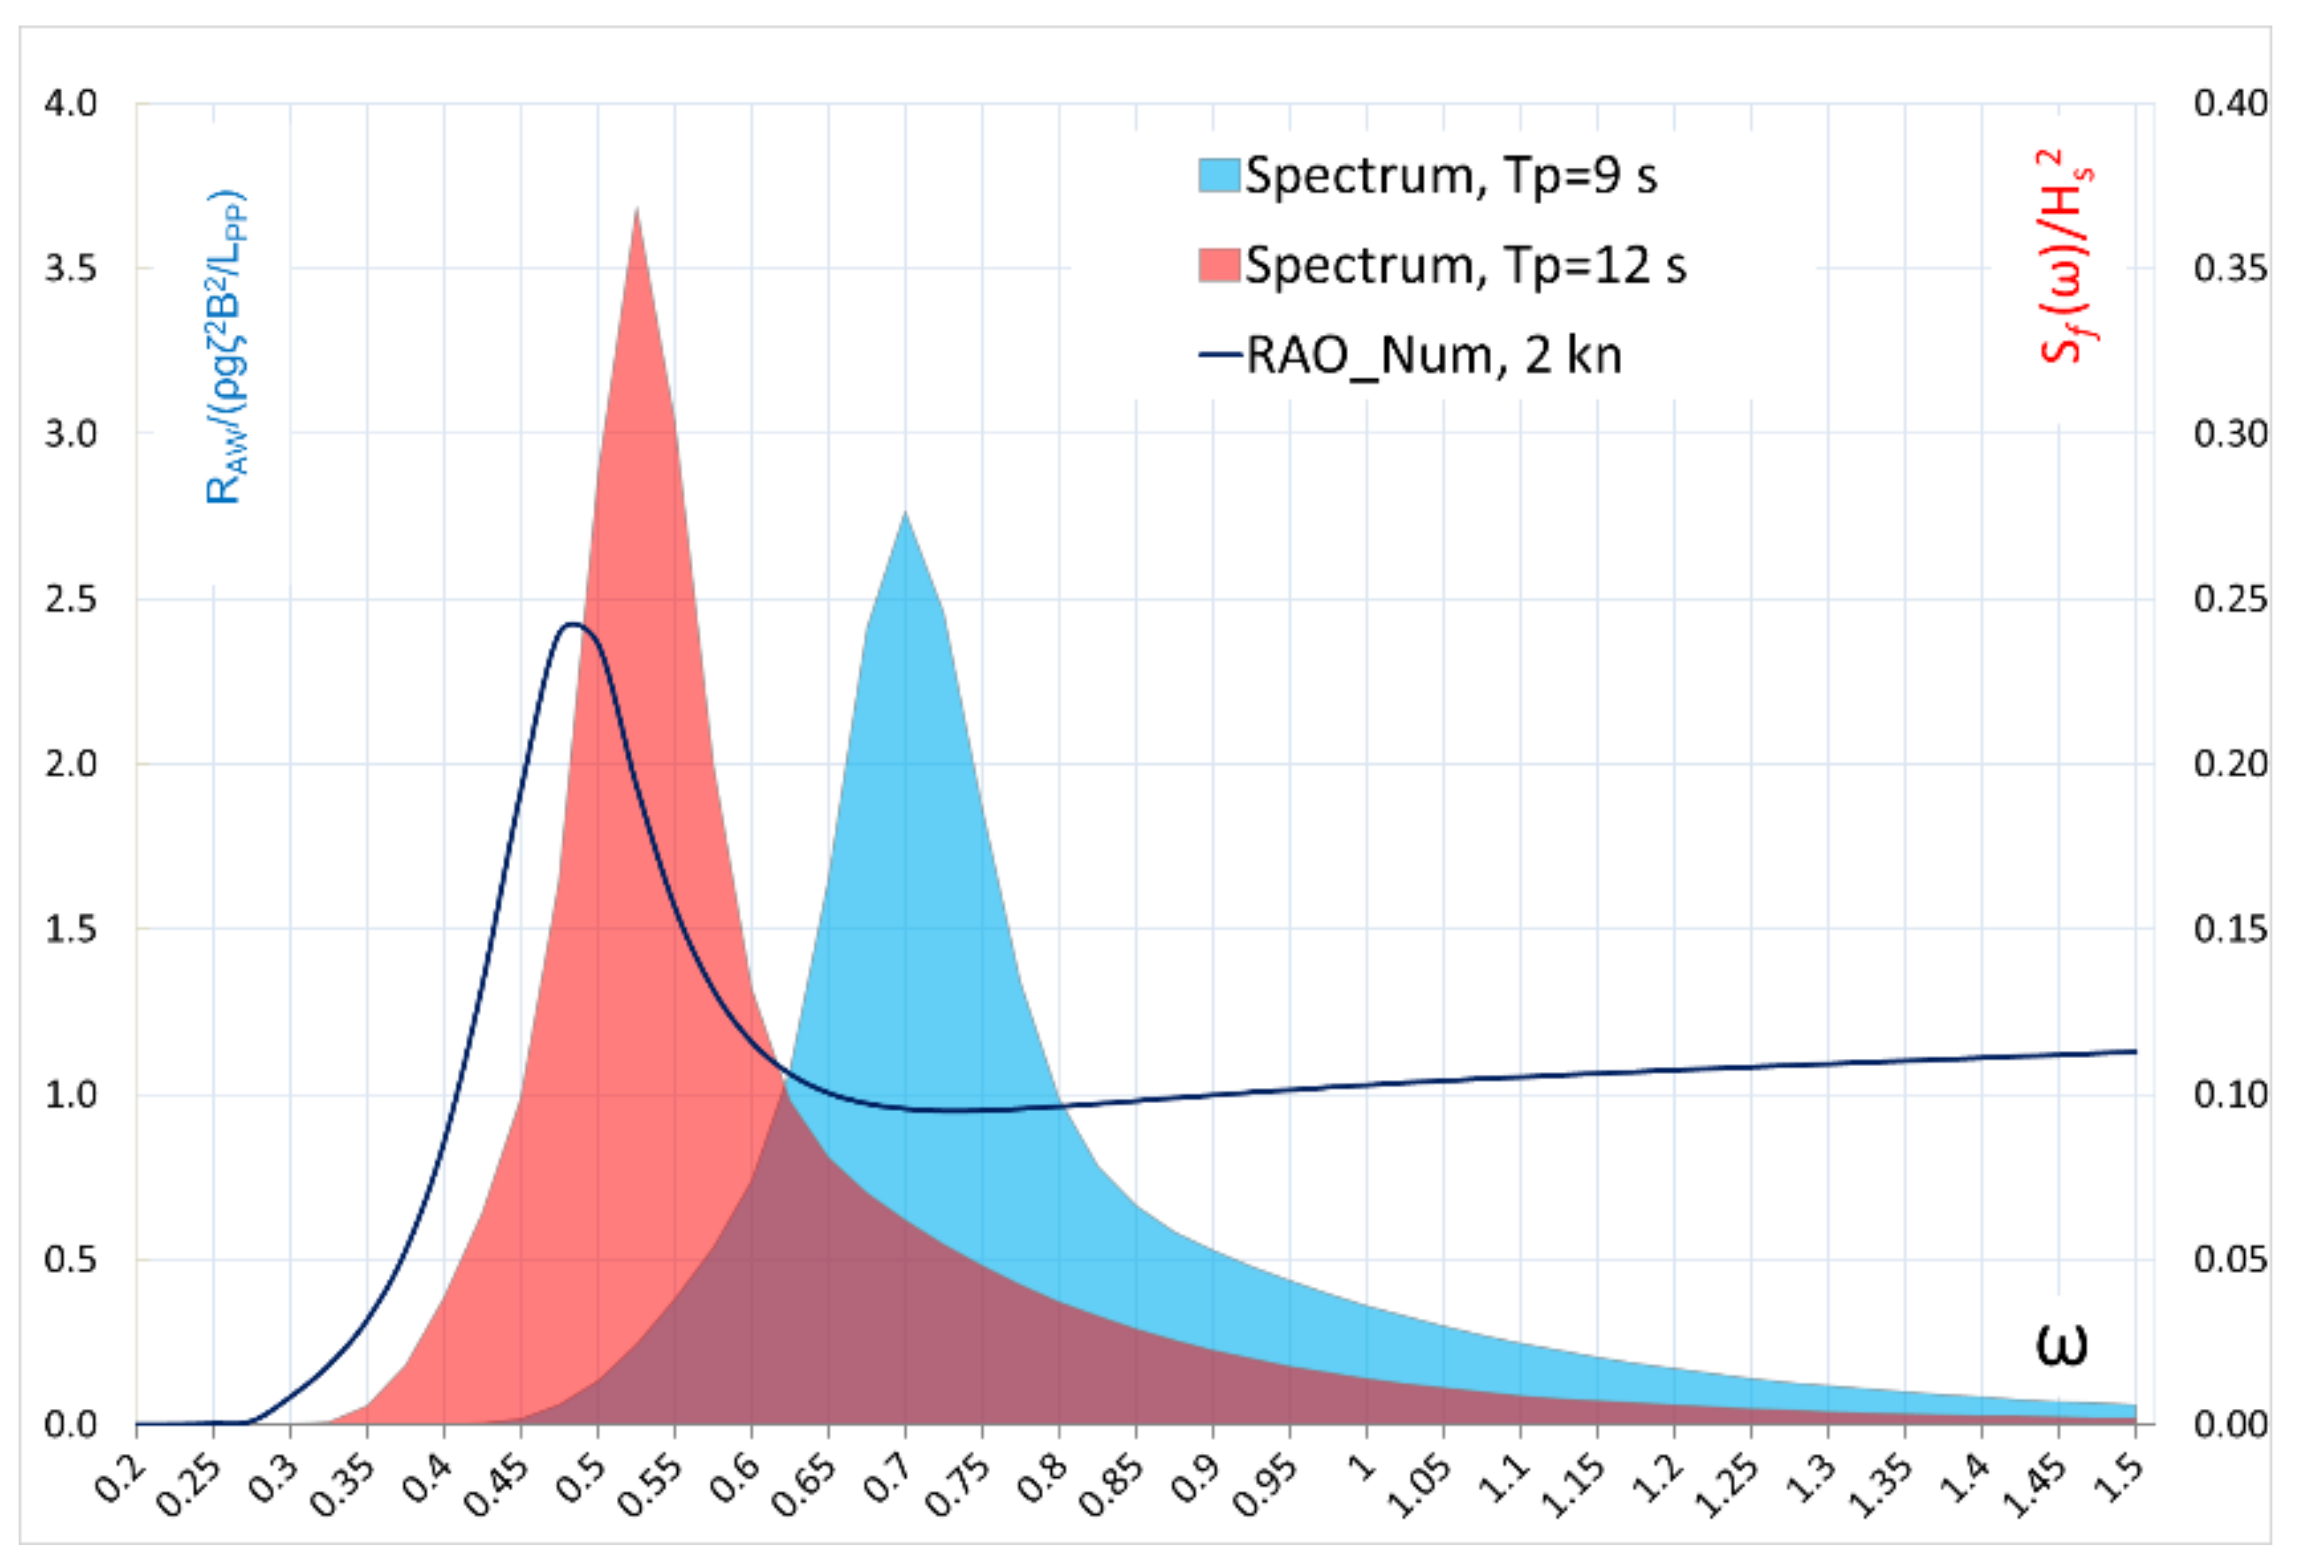
Figure 3 shows the transfer functions of the added resistance in regular head waves of the ship at 2 knots plotted against 2 JONSWAP spectra of unit significant wave height but of different peak periods. When these quantities are plotted against wave frequency, the importance of the prediction of the added resistance in short regular waves (high-frequency region) for estimating the total mean added resistance in seaways represented by a spectrum is clearly demonstrated, particularly for smaller peak frequency. The contribution of relatively short, or higher frequency waves, is very important for the accurate prediction of the mean added resistance in a seaway, as discussed by Minsaas et al. [17], Liu and Papanikolaou [18], and Liu et al. [19], particularly for this low-speed problem, where the resonance is shifted to higher frequency region, when compared with the problem at service/design speed.

Figure 3.
The added resistance in regular head waves together with two spectra.
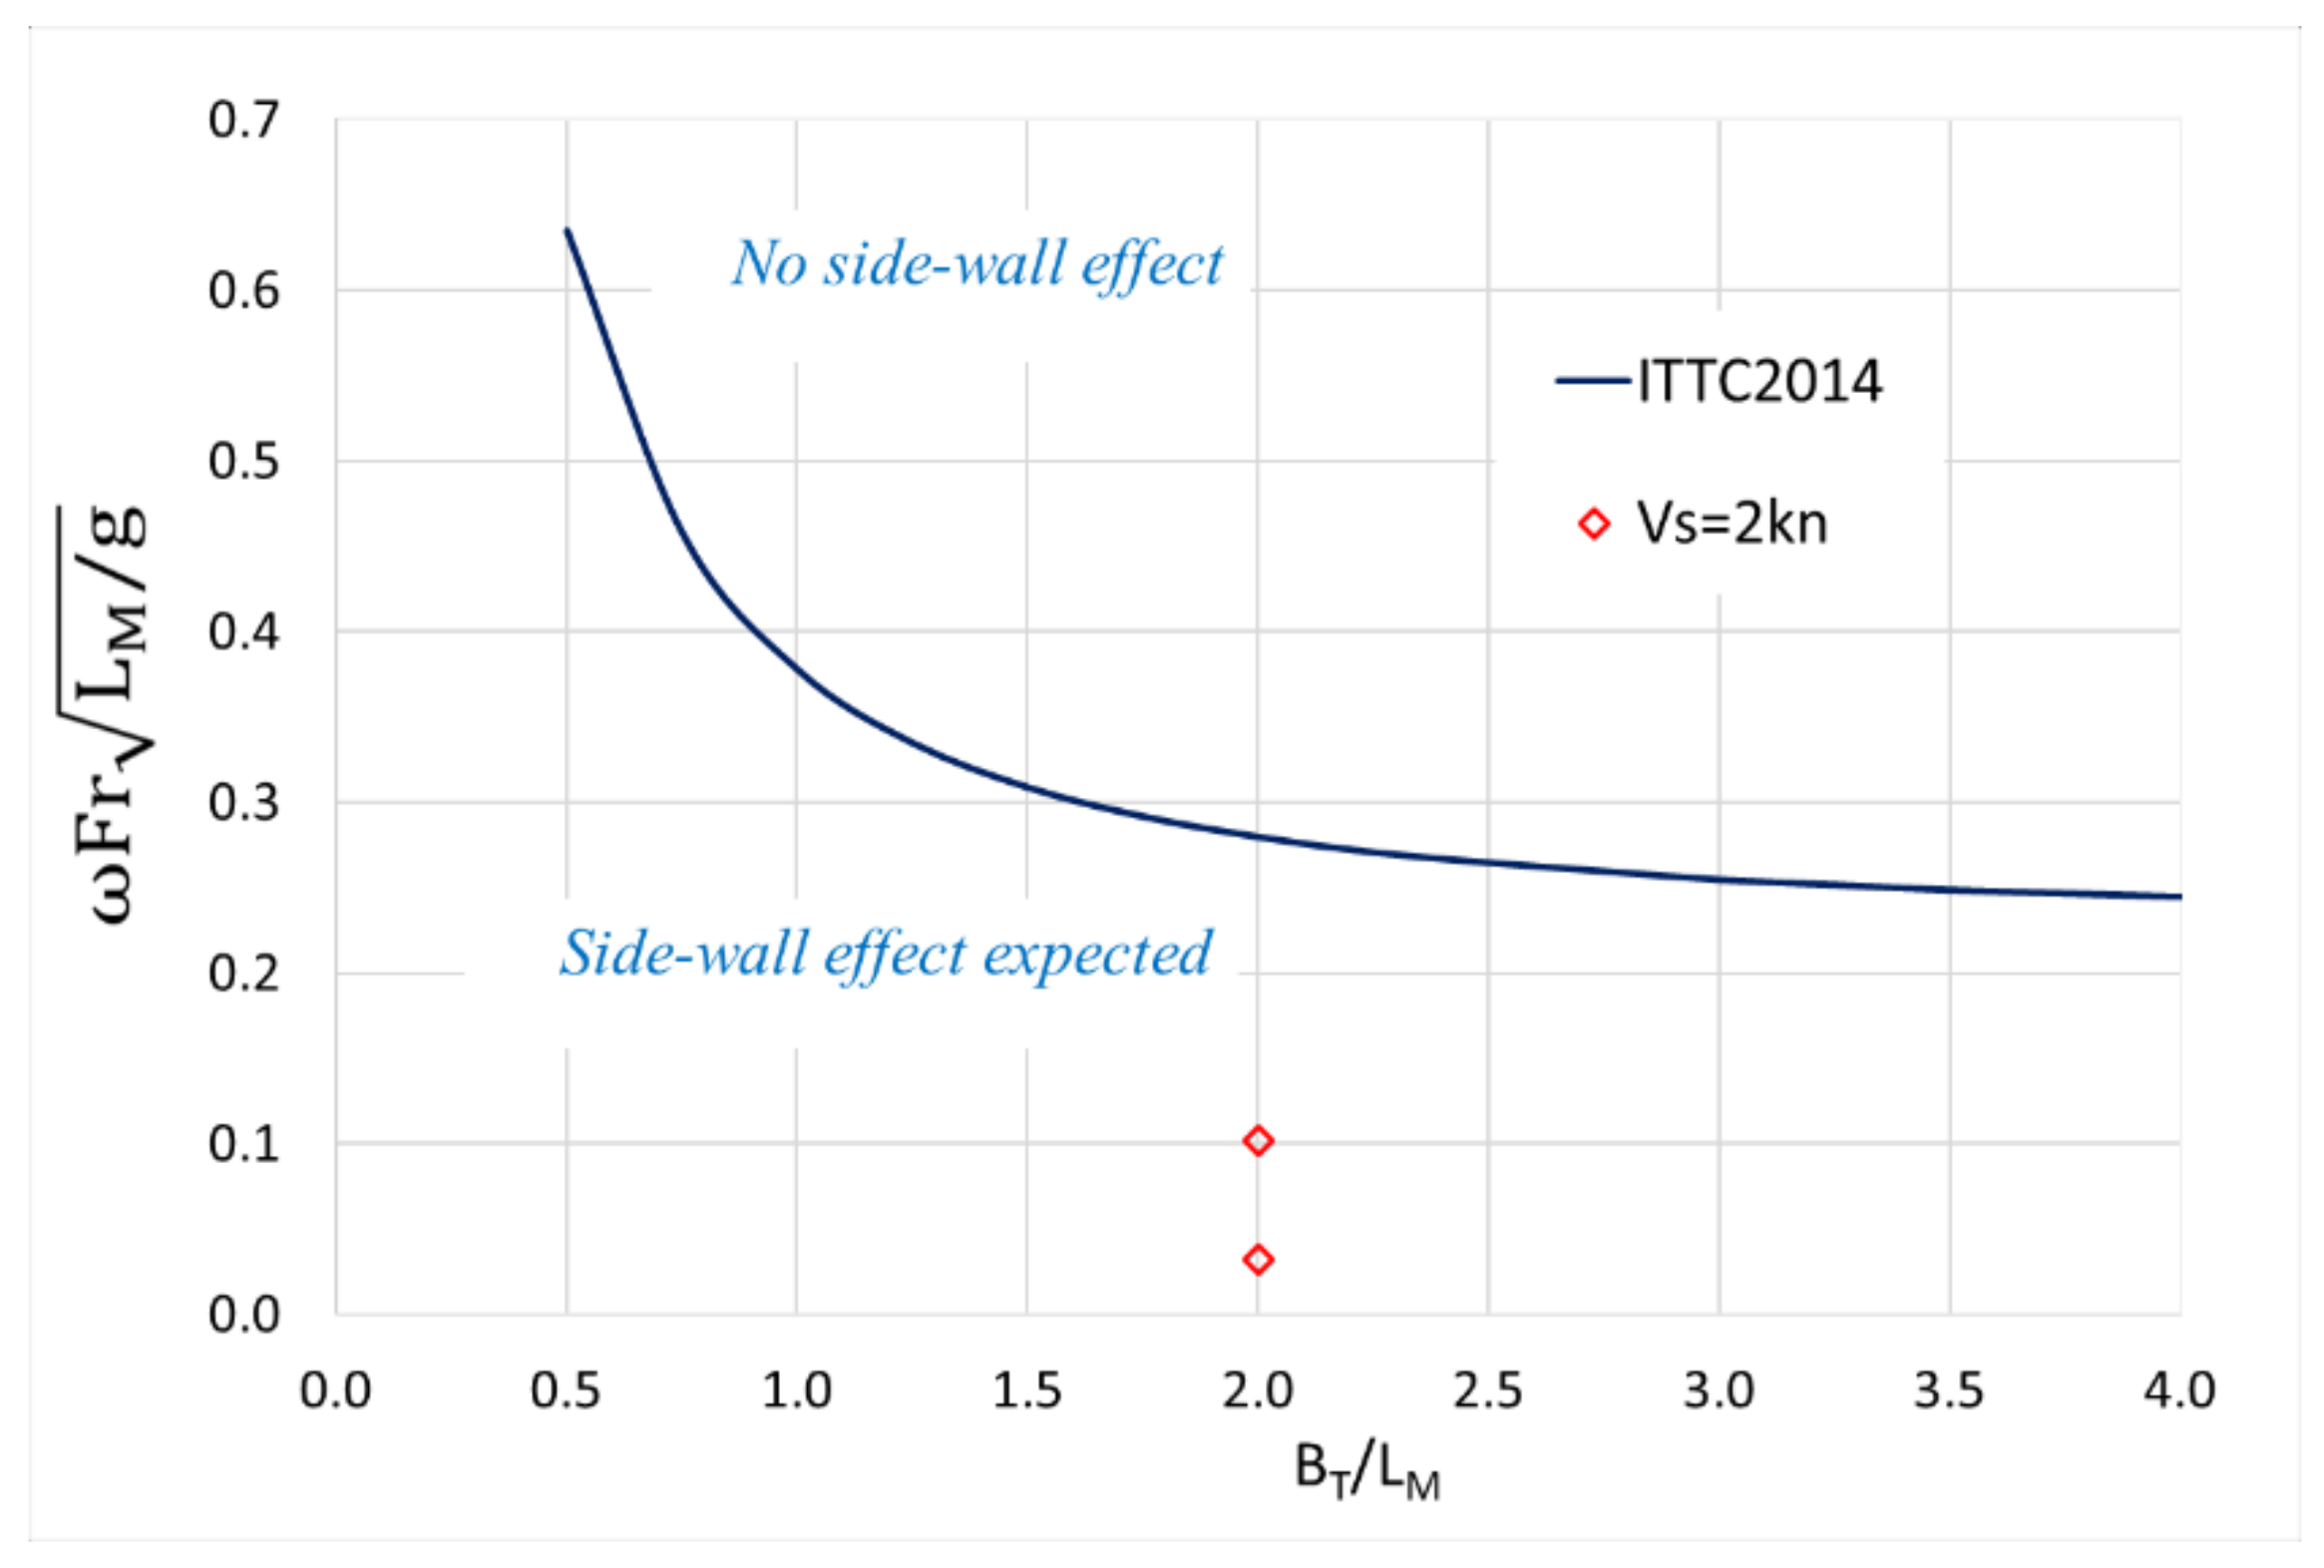
The guideline also permits experiments to be conducted in regular waves. As numerical methods are already recommended, experiments are required only when a design does not pass the assessment using available methods, which will be a very challenging scenario. This can be due to a very innovative design, so that existing empirical methods do not accurately capture the added resistance, and experiments are expected to provide some gain. It may also be due to the selection of a relatively small engine. However, the execution of tank tests at low speeds is not an easy task. Technically, added resistance in waves is obtained by measuring the still-water resistance at speeds of interest and the resistance in waves at the same speeds, and finding the difference between them [20]. For both resistance and seakeeping tests, the setup of the tests must be carefully designed to avoid significant blockage or tank wall effect [21,22]. These requirements are not easy to meet. Figure 4 shows the two points corresponding to λ/LPP = 0.2 and λ/LPP = 2.0 regular wave condition of a 5 m long model to be tested at 2 knots for the seakeeping experiments in a 10 m wide tank. Apparently, these points are well below the ITTC recommended boundary for avoiding tank wall effect. The tank wall effect during measuring added resistance at low speeds has been well reported [7,23]. Besides, as shown in Figure 3, for the spectrum with Tp = 9 s, most of the contribution is from relatively short waves, where the target measured value is rather small and much uncertainty is involved in the experiments [24,25]. The error may lead to significant difference in dimensional values. Lastly, if only head wave tests are conducted and the mean wave added resistance value is calculated in long-crested head waves, then a factor of 1.3 should be multiplied to the result value. This is rather conservative, thus is not expected to provide much “gain” to the designer. When conducting testing in various headings, extensive resources must be allocated, and the cost can be rather high.
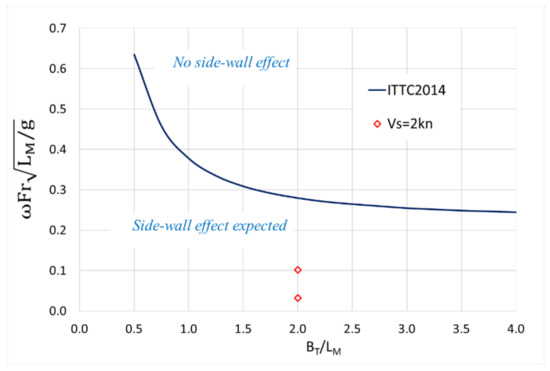
Figure 4.
Frequency at which tank interference occurs in head waves.
4. Minimum Propulsion Power Assessment (MPPA) Following the Newly Adopted Guideline
In this session, we follow the amended IMO guideline to determine the minimum propulsion power. A new 310 kTon VLCC design of MARIC is chosen in this case study. Two alternative engine selections are subject to the assessment:
SMCR = 22,000 kW at 62.5 rpm
SMCR = 18,600 kW at 59.0 rpm
4.1. Minimum Power Lines Assessment
The “minimum power line” method uses deadweight and ship type as input. The minimum power line values of total installed MCR are calculated as
where DWT is the deadweight of the ship in metric tons, and a and b are two coefficients recommended by the guideline:
MCRmin = a·DWT + b
a = 0.0652 kW/t
b = 5960.2 kW
For the concerned VLCC, which features a 310,000 t deadweight,
MCRmin = a·DWT + b = 26,172.2 kW
The selected two engines are both below the minimum power line value. The requirement according to the “minimum power lines” method is not fulfilled.
4.2. Minimum Power Assessment
The new minimum power assessment is based on the solution of a one-degree-of-freedom maneuvering equation in longitudinal direction to demonstrate that the ship can move with the speed of 2.0 knots through water in wind and wave directions from head to 30 degrees off-bow for a situation of weathervaning.
The maximum total resistance is defined as sum of the resistance in calm water at the 2.0 knots forward speed U, and the maximum added resistance in seaway Xa over wind and wave directions from head to 30 degrees off-bow.
The calm-water resistance of the VLCC at 2.0 knots is calculated by
where ρ is density of seawater, S is the wetted surface area, vs. is the ship speed, k is the form factor, and CFS is the frictional coefficient of the ship according to the ITTC-1957 ship-model correlation line.
For the subject ship, the form factor k is estimated empirically using hull form parameters, including the block coefficient CB, draft at midship TM, etc., as follows:
Using the recommended aerodynamic resistance coefficient of = 1.1, and the wind speed of Vw = 22.6 m/s, the maximum wind resistance of the VLCC advancing at 2.0 knots is predicted as follows:
where ρa is the density of air, AF is the frontal windage area of the hull and superstructure, and is the relative wind speed.
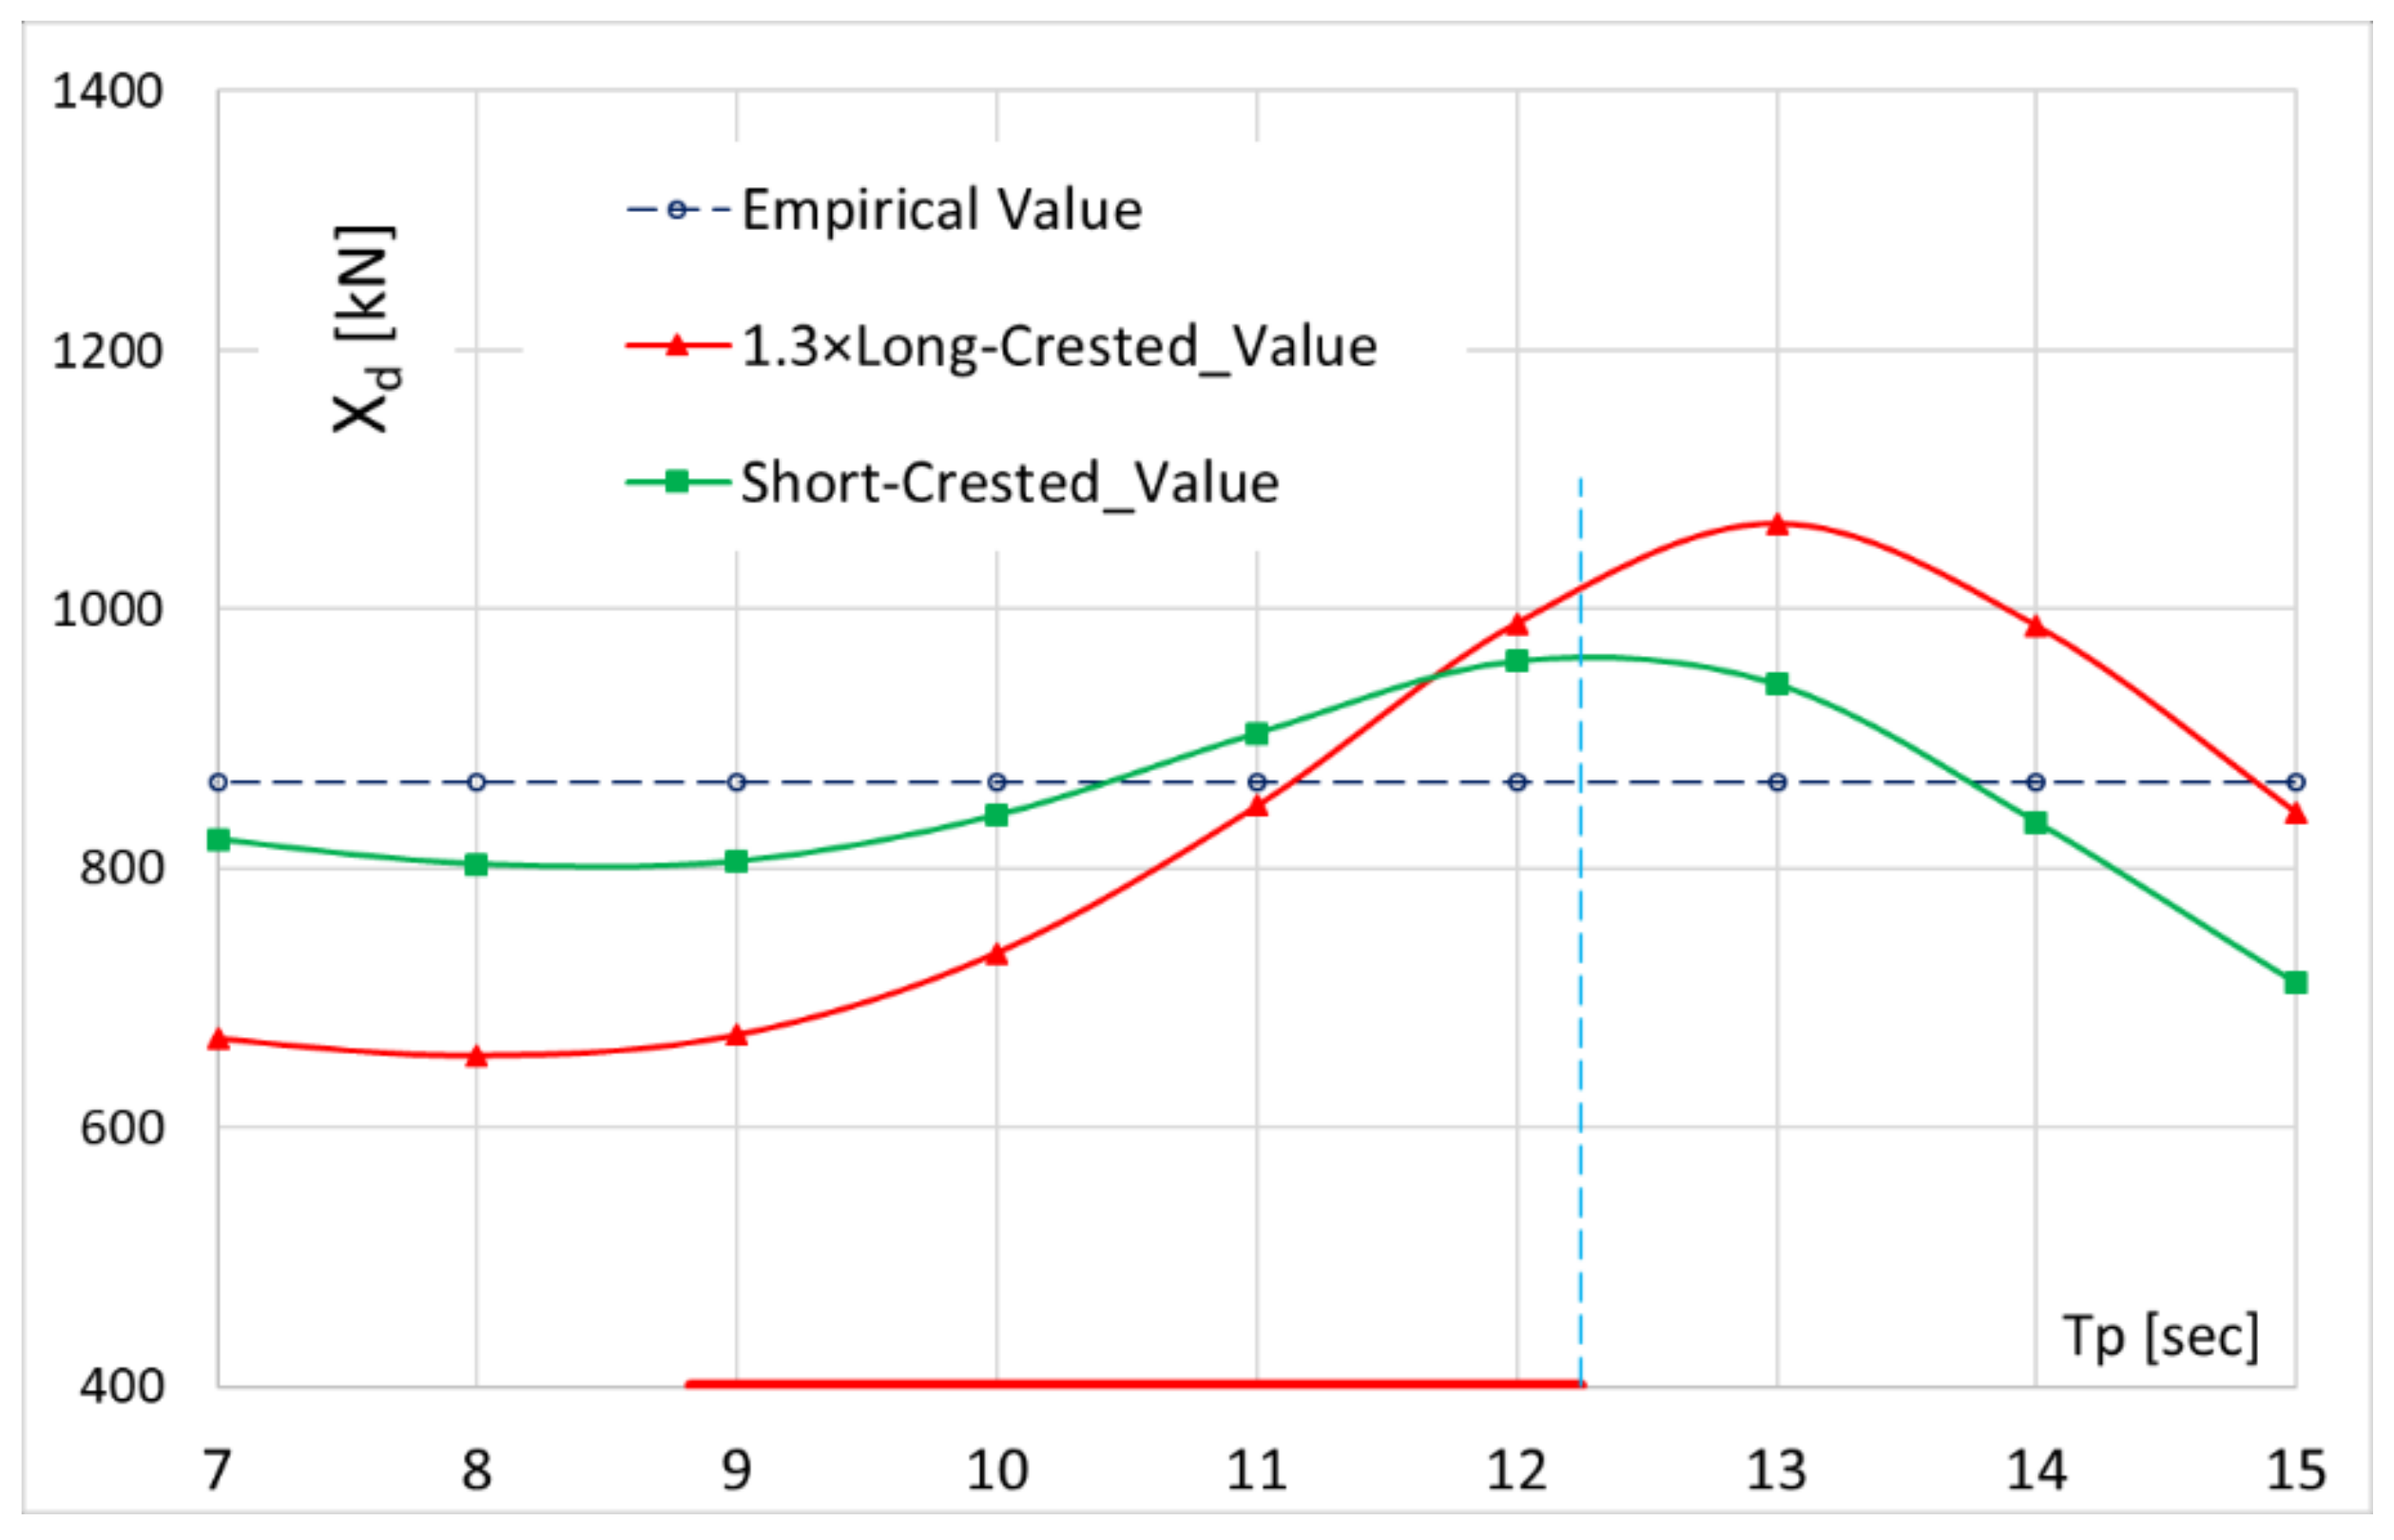
A third resistance component refers to the maximum mean added resistance due to waves, for which the guideline specifies several options, as elaborated in the previous section. Figure 5 shows the predicted mean added resistance using three alternative methods. For Method-1, the maximum value is 866.9 kN. For Method-3a, the maximum value is 959.9 kN, observed at the peak period of 12.0 s. For Method-4a, the maximum value is 1008.4 kN, observed at the peak period of 12.25 s.
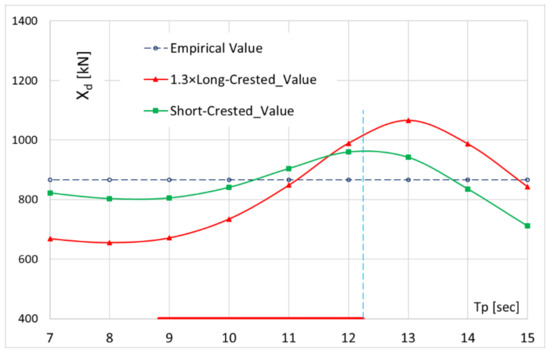
Figure 5.
Predicted mean added resistance using recommended methods.
The maximum additional rudder resistance due to maneuvering in seaway Xr may be calculated for practicality in a simplified way, as
where Ter is the propeller thrust, excluding Xr from T.
Following the guideline to set thrust deduction fraction t = 0.1, the following expression is obtained:
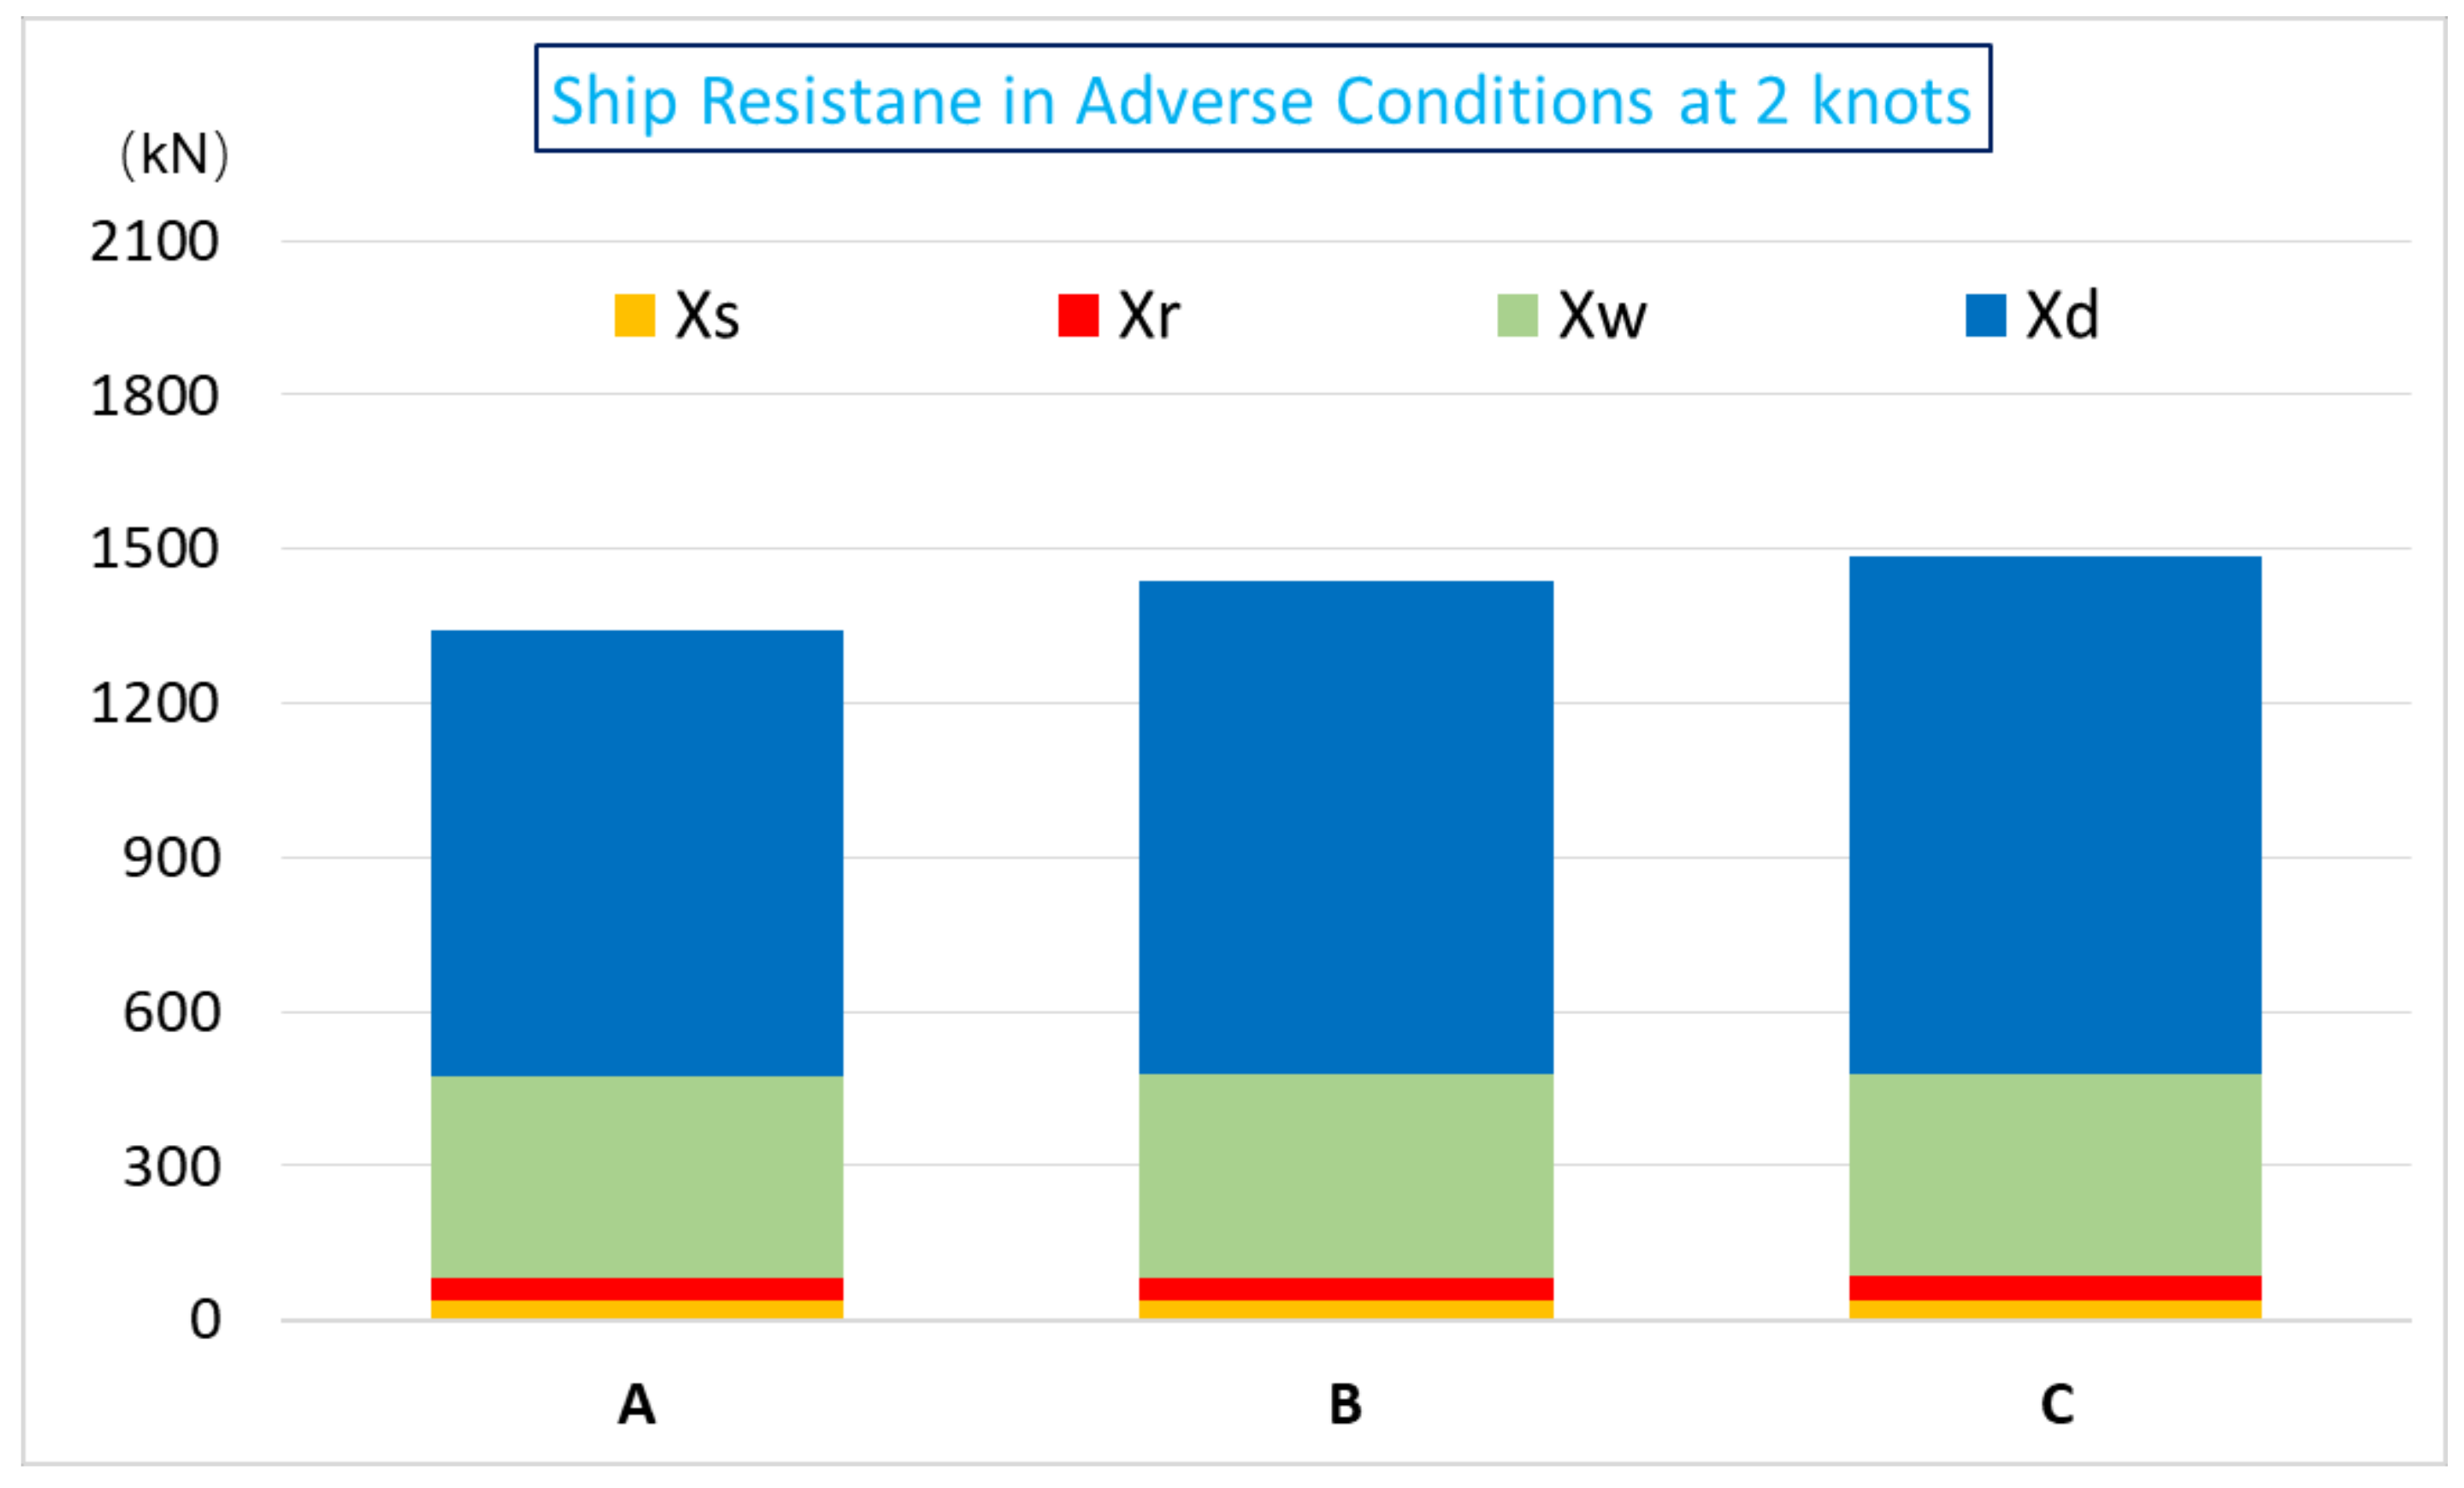
Figure 6 shows the obtained maximum resistance of the VLCC in adverse conditions using alternative methods. With the amendments referring to higher sea states and lower ship speed, the mean added resistance due to waves is the most significant component, and the wind resistance secondary, while the resistances in calm water and due to rudder action are rather minor. In the next section, the required thrust T for the case study is calculated, as shown in Table 3. With the new default value of thrust deduction factors t = 0.1, the required propeller thrust estimated is lower than what would be estimated by 2013 Interim Guidelines.
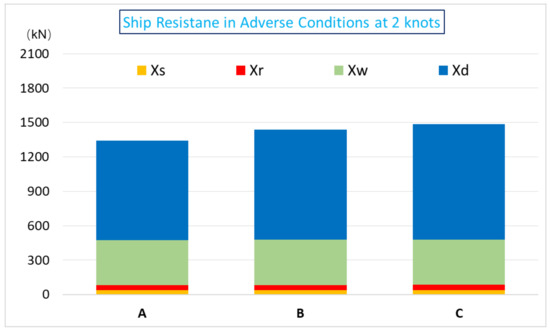
Figure 6.
Components of the total resistance of the VLCC design at 2 knots in adverse conditions as defined by the IMO Guideline.
Table 3.
Resistance components and required propeller thrust (kN)
It is demonstrated from Table 3 that using different wave added resistance evaluation methods will lead to different required thrust T, which is the key input for the assessment. For this VLCC, the empirical method is not conservative at all, which offers the smallest value among the three studied methods. The values from the other two methods are close, with method M-4a producing the largest value of 1652.8 kN.
Considering that the empirical method (M-1) violates a basic principle of regulatory developments, namely that recommended simpler methods should be the most conservatives, it proves that (M-1) may not be appropriate, or it needs adjustment. On the other hand, experiments in a towing tank at very low speed are inherently influenced by the tank wall effect, and the accuracy of such tests is very hard to ensure; hence, spectral analysis methods M3-a and M4-a should be preferred. Between the two, M4-a is easier to implement, while M3-a can consider the characteristics of wave added responses in all directions.
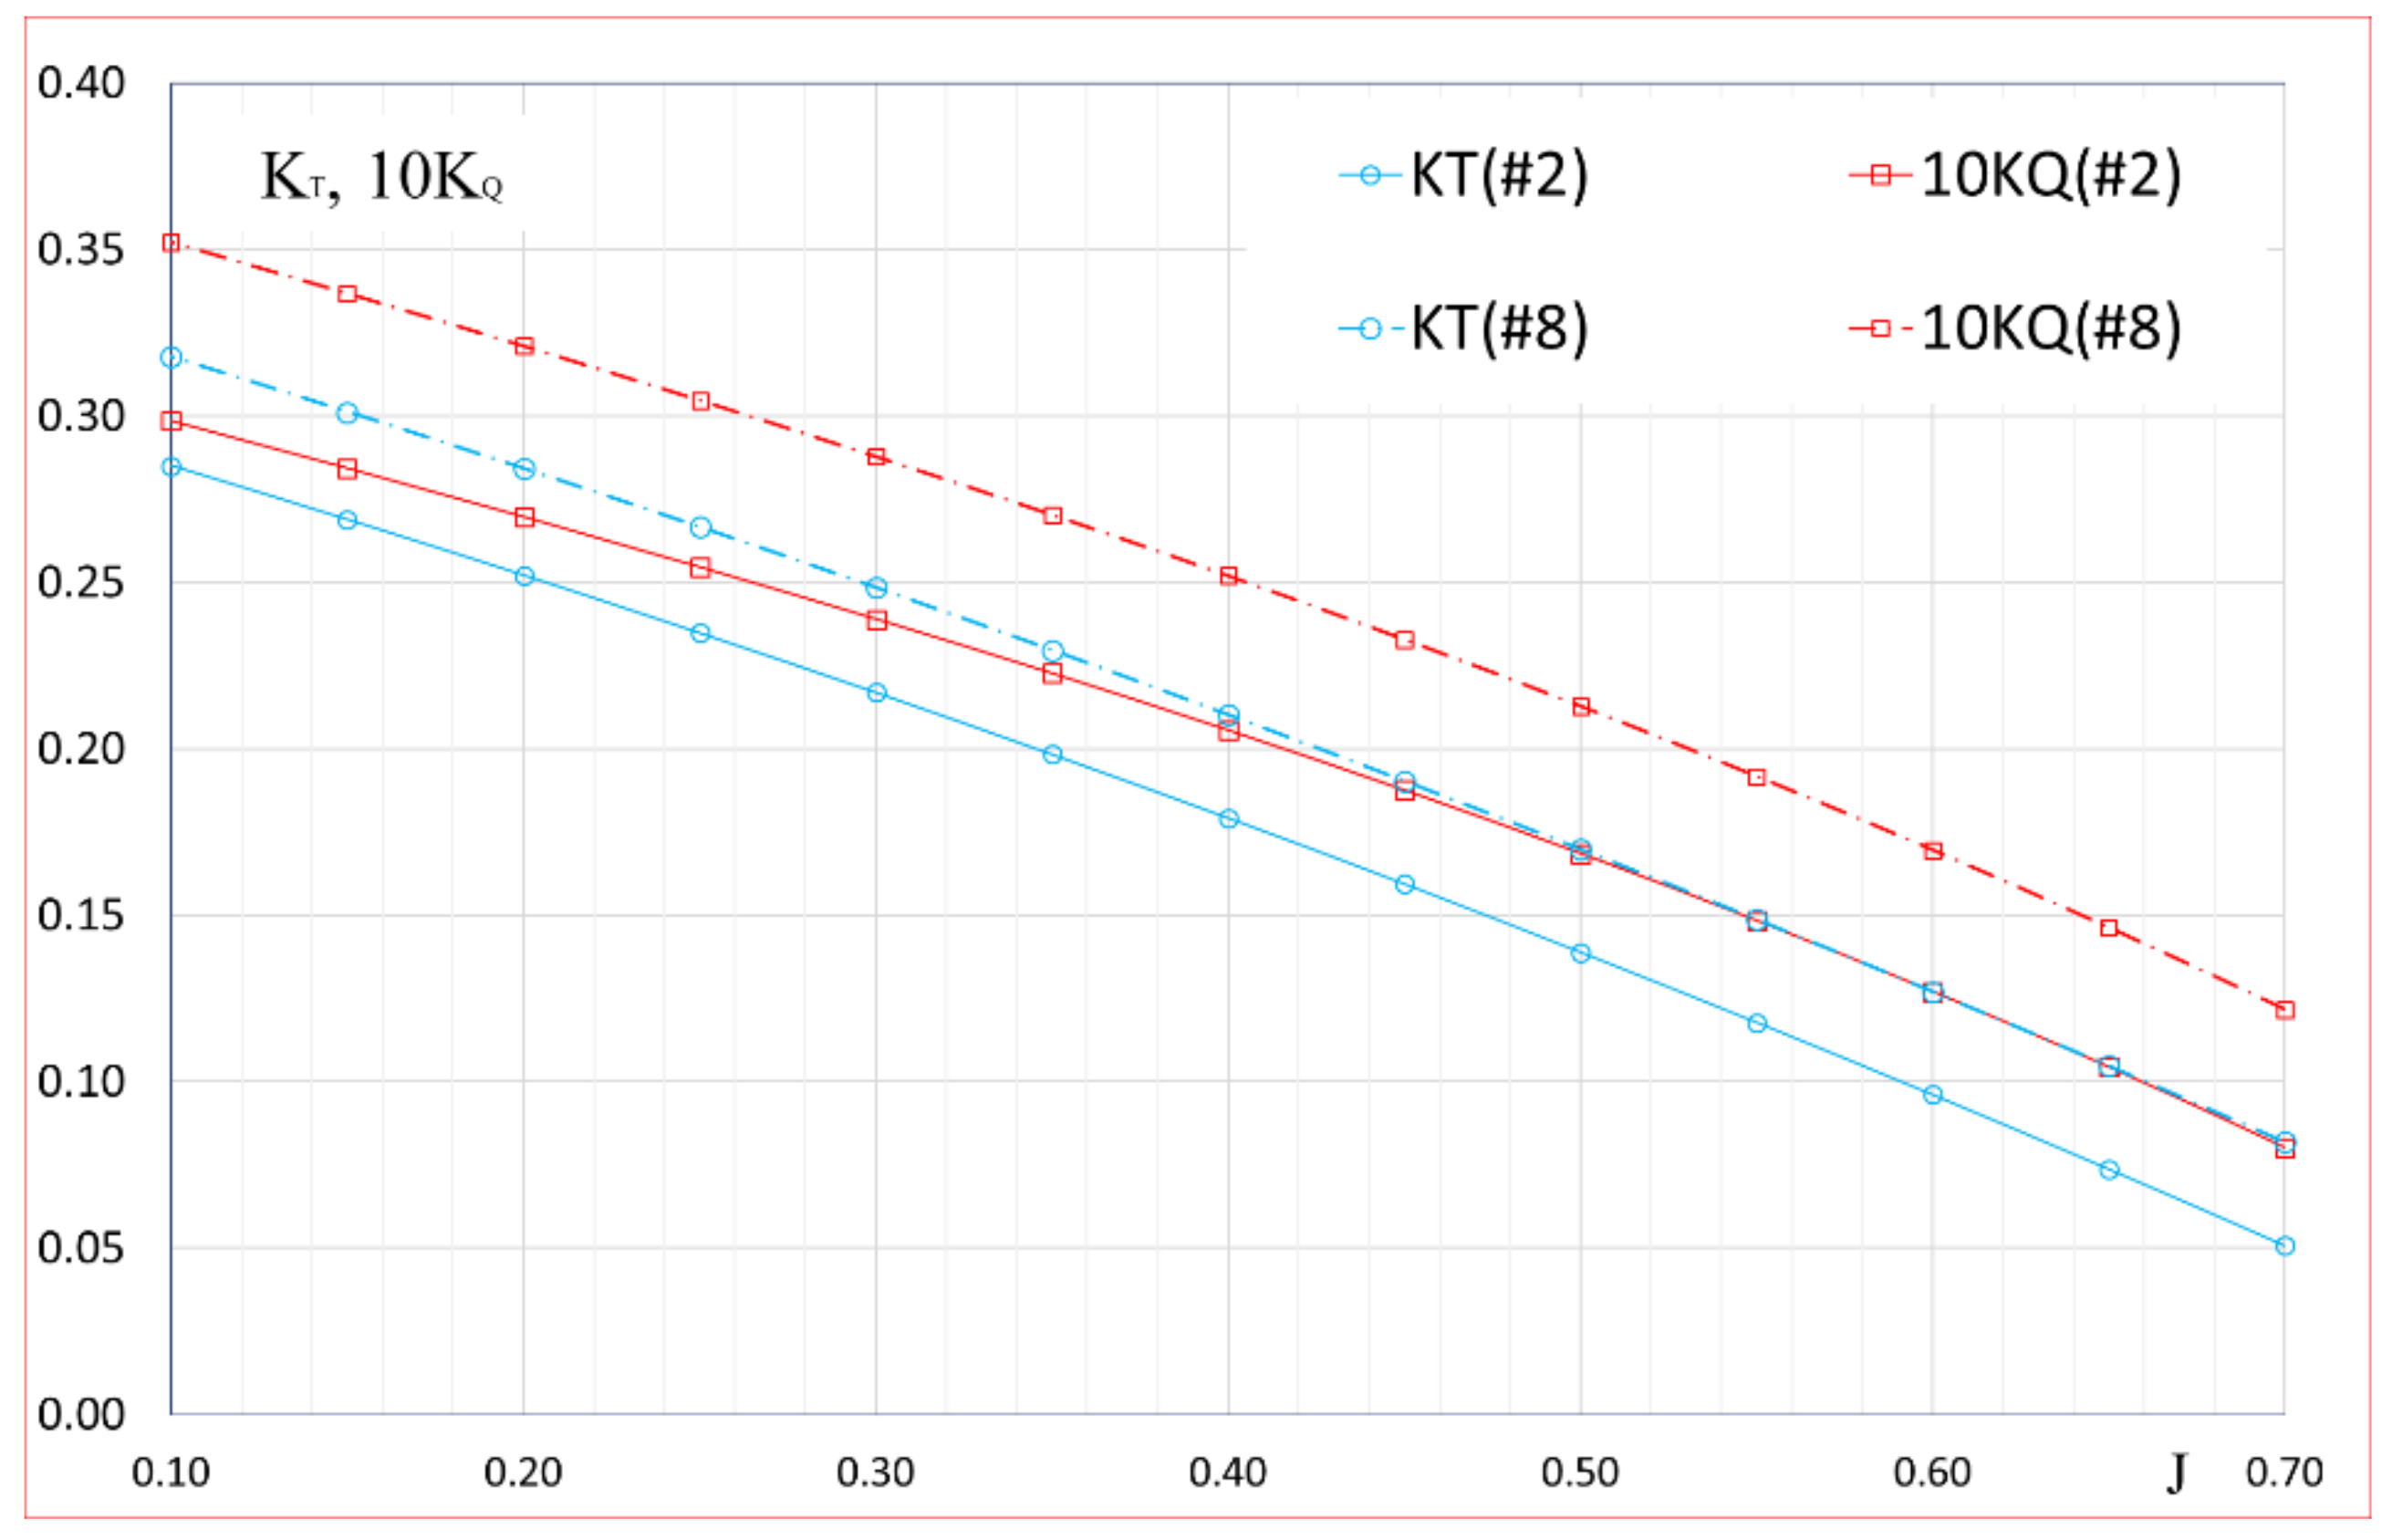
Figure 7 above shows the open-water characteristics of the two candidate propellers. For the required thrust T, the operational point of the propeller can be read off from the or be determined by plotting the parabolas into the open-water characteristics and finding the intersect.
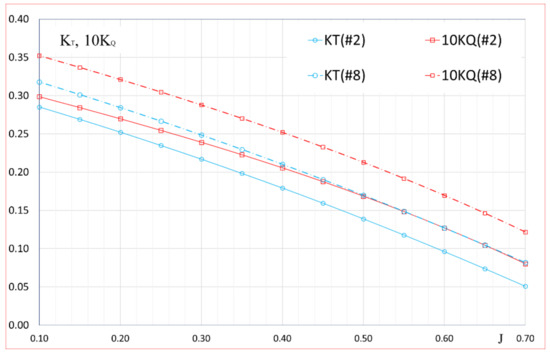
Figure 7.
Open-water characteristics of two candidate propellers.
Then, the propeller rotational speed is calculated as
The delivered power of the propeller is calculated as
Finally, the required minimum break power can be obtained by considering the transmission efficiencies:
The concerned VLCC has a stern-engine type without gearbox, thus, ηS = 0.98, and ηg = 1. The relative rotative efficiency is assumed to be unit.
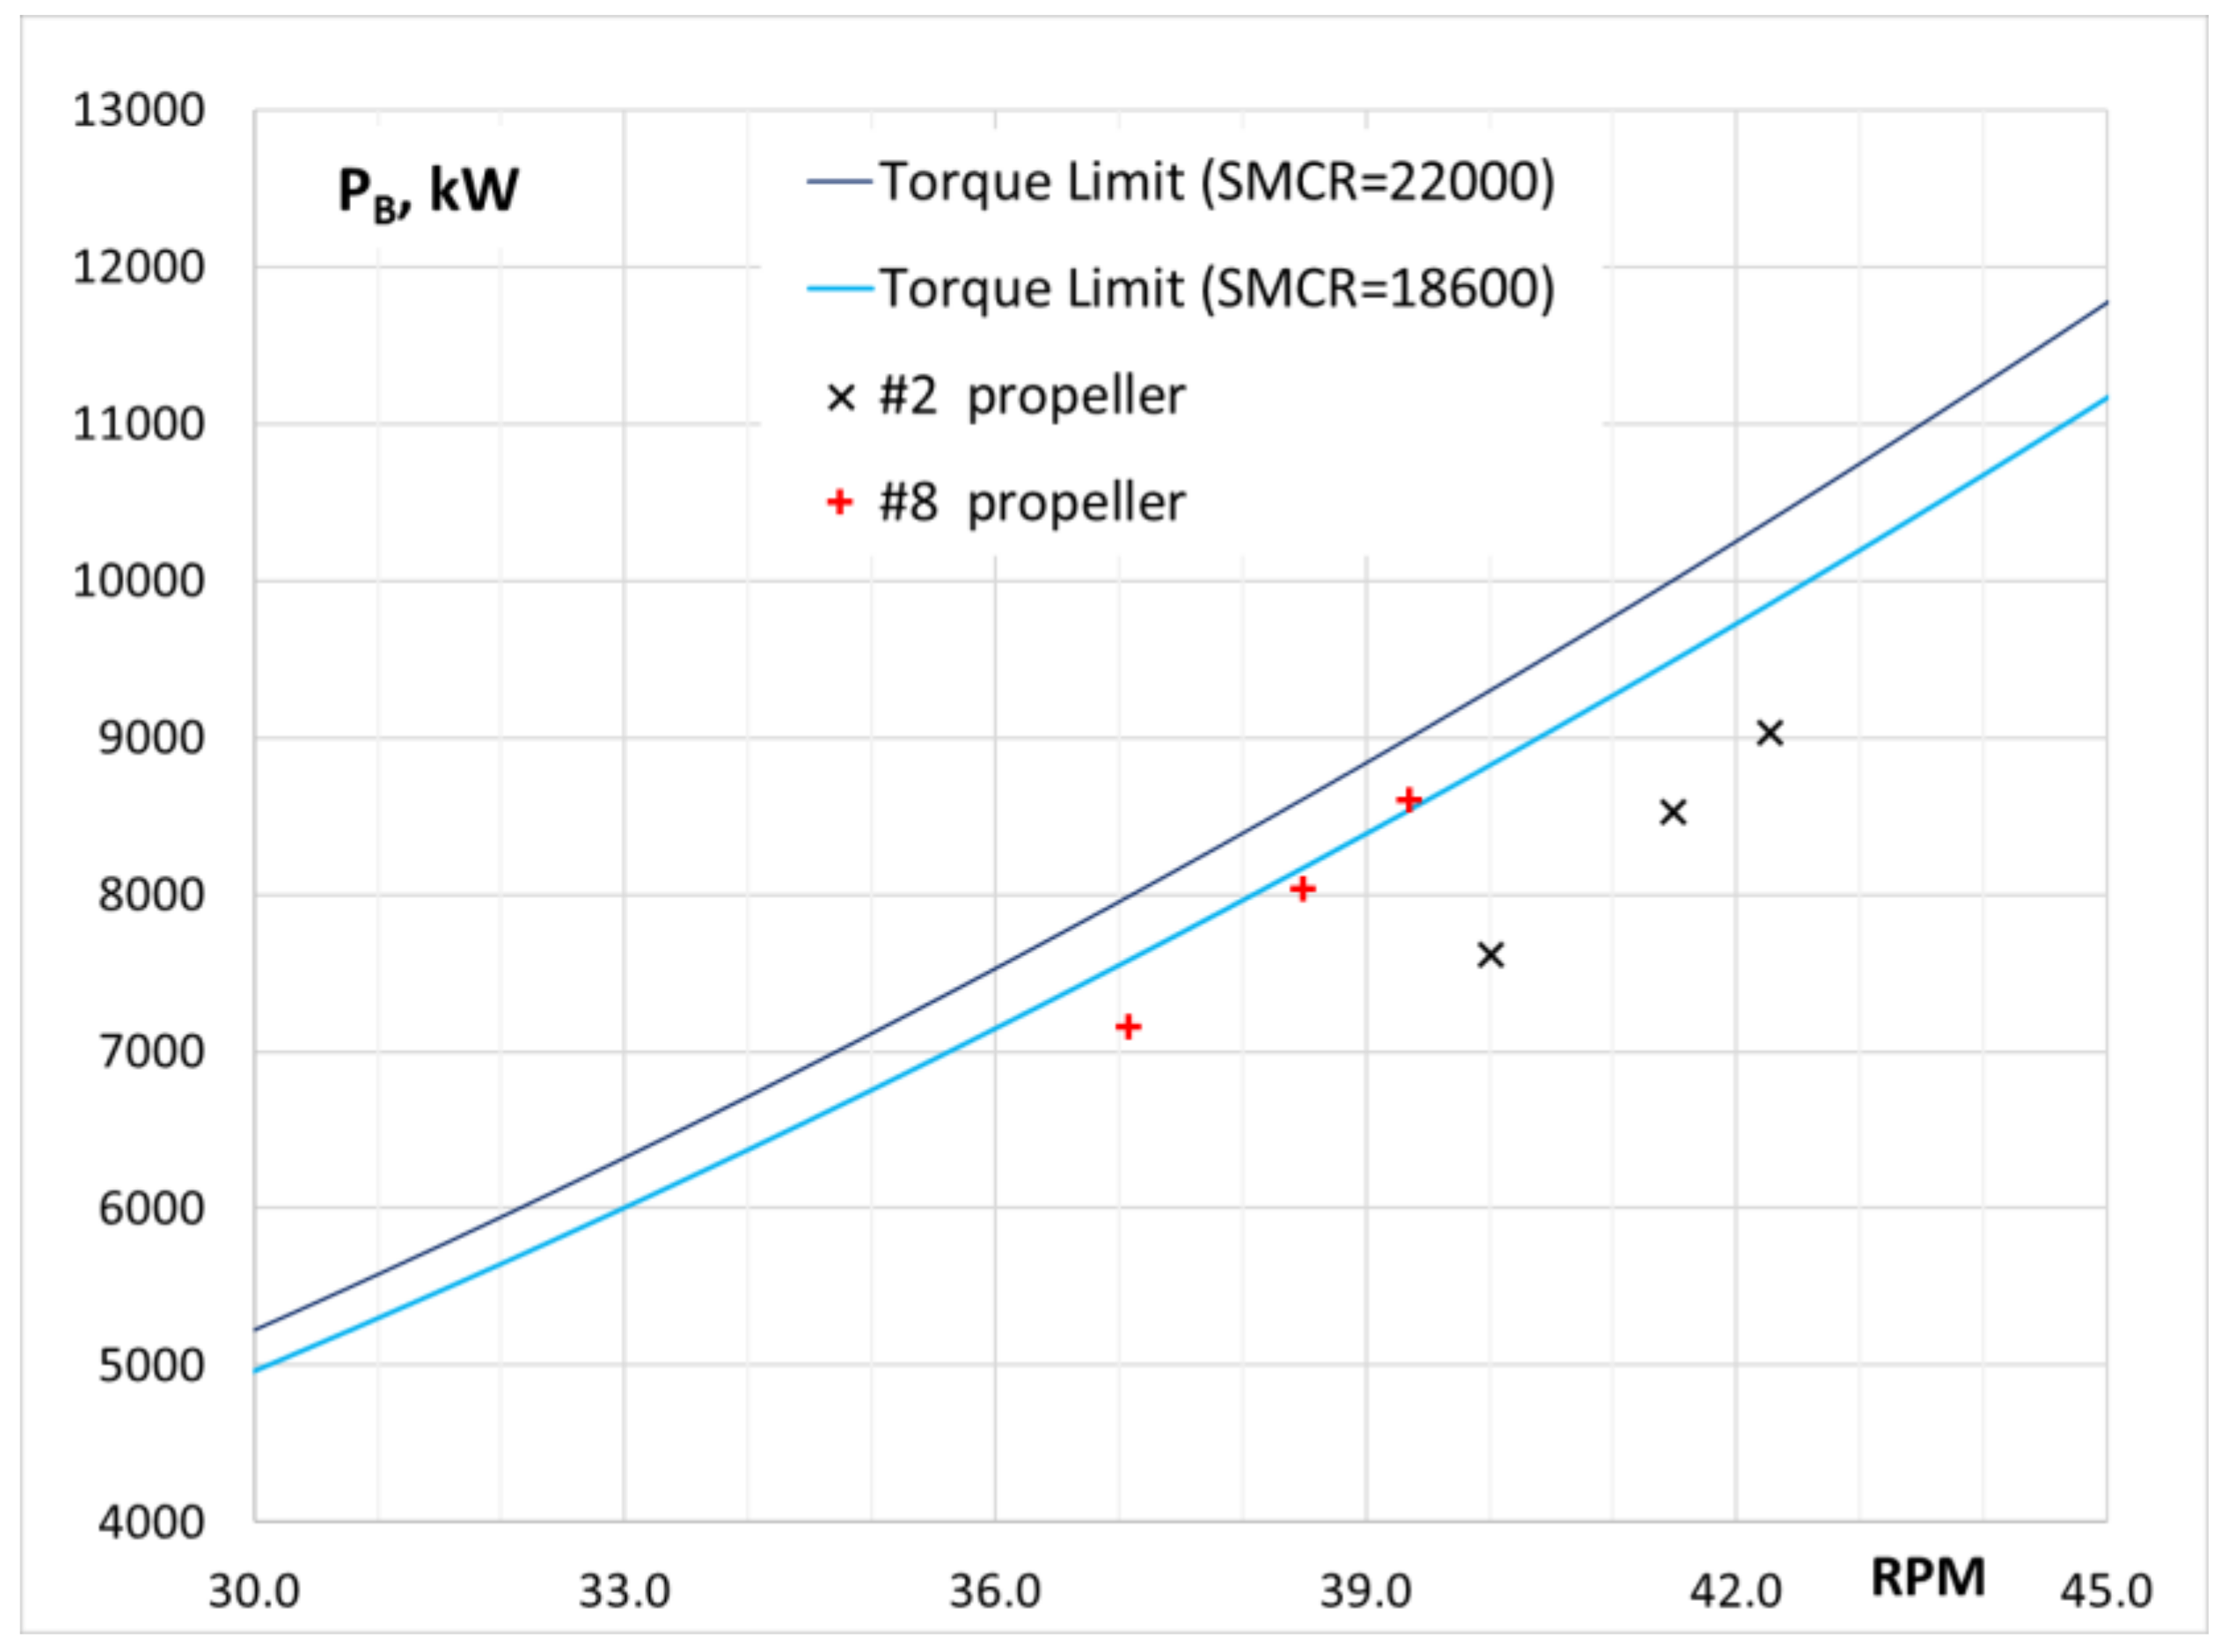
Finally, the required engine power and speed using two candidate propellers can be calculated, as shown in above Table 4 and Table 5. These operational points are plotted in Figure 8, together with torque limit of the selected engines [26]. When using #2 propeller, the three operational points, obtained using alternative methods, are below the torque limit of both engines. When using #8 propeller, the three operational points are below the torque limit of the larger engine but are rather close to the torque limit of the smaller engine. Subsequently, the larger engine is preferred if #8 propeller is used.
Table 4.
Prediction of required propulsion power using #2 propeller.
Table 5.
Prediction of required propulsion power using #8 propeller.
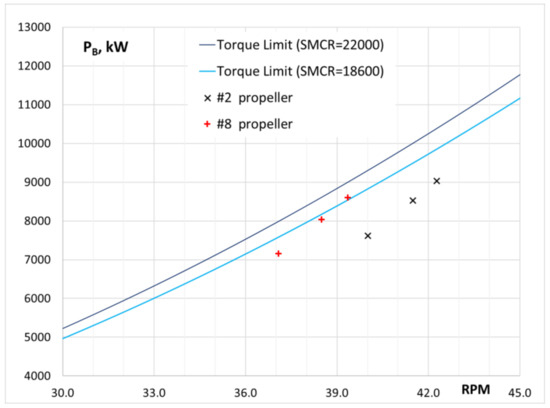
Figure 8.
The operating points in adverse conditions predicted using alternative methods, shown in the engine load diagram.
In this case, the #2 propeller’s light running margin (LRM) is 9.6%, while the #8 propeller’s LRM is only 4.2%. From the minimum propulsion assessment point of view, the #2 propeller is more favorable. This leads to a very important design insight, i.e., propellers with larger LRM are more advantageous in terms of satisfying the minimum propulsion power regulation.
5. Conclusions
This study first reviews the development of the IMO guidelines for the minimum propulsion power assessment and summarizes recent amendments of MEPC76, including the definition of the adversity of the weather conditions and of the navigation speed used in the assessment, the recommended methods for predicting the added resistance in waves, the recommended thrust deduction fraction and wake fraction, etc. From the view of the completeness of the guideline, it shows that:
- With the introduction of recommended numerical methods for calculating added resistance, the assessment can now be conveniently conducted by engineers without the necessity of carrying out experiments, which makes the design and approving processes smoother.
- The navigational speed used in the assessment changed from 4–9 knots to 2 knots. This change makes the execution of experiments in a towing tank very challenging due to the wall effect. Note that the ITTC guideline for avoiding tank wall effect has been derived for design/service speed only. Its validity at such low speed needs to be re-examined.
- Carrying out experiments to predict the added resistance in short-crested head waves also requires the tests in regular head to beam waves. This cannot be executed in a towing tank, but only in an ocean basin. Besides, such experiments are very costly.
- The method of calculating Xr is not clearly defined, while its influence on the results is consider minor due to its limited contribution to the total resistance.
A minimum propulsion power assessment was conducted following the new guideline for a new VLCC design. From the point of view of ship design to meet the requirement:
- The calm-water resistance at 2 knots is very small and its influence on MPPA is negligible.
- The newly introduced item, namely, the rudder resistance, is small.
- A ship’s hull form at the ends is important in the calculation of the added resistance in short waves and it may be effectively considered in empirical formulas through the use of lengths of entrance and run. For the added resistance in long waves, main dimensional ratios are more important.
- Higher resistance leads to higher thrust, which can be supplied by the propeller at a lower advance coefficient J, where lower propeller efficiency is observed.
- For the studied VLCC, the employed empirical method proves not conservative in comparison to available model experiments, while the maximum wave added resistances evaluated by methods M-3a and M-4a are close.
- As demonstrated in the case study, propeller design with larger light running margin is an effective way to improve the propulsive performance of a ship in adverse conditions.
The problem of ship maneuverability in adverse conditions is an extremely complicated and highly demanding subject. Recommended future studies include the further validation of the wave added resistance prediction methods, especially in non-head waves and in short waves conditions, the determination of limiting parameters of tank wall effect for performing the wave added resistance tests under the extreme low speed condition, and more detailed studies concerning the flow interactions between the propeller and the hull, the wake and thrust deduction fractions under wave actions, etc.
Author Contributions
Conceptualization, S.L., B.S., P.F. and A.P.; methodology, S.L., B.S., P.F. and A.P.; formal analysis, P.F., S.L. and B.S.; investigation, S.L., P.F. and B.S.; resources, S.L., B.S., P.F. and A.P.; writing—original draft preparation, P.F. and S.L.; writing—review and editing, B.S. and A.P. All authors have read and agreed to the published version of the manuscript.
Funding
This research is partly funded by the Ministry of Education, Singapore, under its Academic Research Fund Tier 1 (Award Number: #020211–00001; Award Title: “Investigation of the self-propulsion factors for determining minimum propulsion power to ensure safe ship operation at low speeds”).
Informed Consent Statement
Not applicable.
Conflicts of Interest
The authors declare no conflict of interest. The funders had no role in the design of the study; in the collection, analyses, or interpretation of data; in the writing of the manuscript, or in the decision to publish the results.
References
- IMO. EE-WG 1/1/1, Annotations to the Provisional Agenda. 2010. Available online: https://docs.imo.org/ (accessed on 15 August 2021).
- IMO. MEPC 61/5/32, Consideration of the Energy Efficiency Design Index for New Ships—Minimum Installed Power to Maintain Safe Navigation in Adverse Conditions. 2010. Available online: https://docs.imo.org/ (accessed on 15 August 2021).
- IMO. Interim Guidelines for Determining Minimum Propulsion Power to Maintain the Maneuverability in Adverse Conditions London, International Maritime Organization. Resolution MEPC 232(65). 2013. Available online: https://wwwcdn.imo.org/localresources/en/KnowledgeCentre/IndexofIMOResolutions/MEPCDocuments/MEPC.232(65).pdf (accessed on 15 August 2021).
- Shigunov, V. Manoeuvrability in adverse conditions: Rational criteria and standards. J. Mar. Sci. Technol. 2018, 23, 958–976. [Google Scholar] [CrossRef] [Green Version]
- Shigunov, V.; Guo, B.; Reddy, D.N.; Lalovic, I. Manoeuvrability in adverse conditions: Case studies. Ocean. Eng. 2019, 179, 371–386. [Google Scholar] [CrossRef]
- Yasukawa, H.; Hirata, N.; Matsumoto, A.; Kuroiwa, R.; Mizokami, S. Evaluations of wave-induced steady forces and turning motion of a full hull ship in waves. J. Mar. Sci. Technol. 2019, 24, 1–15. [Google Scholar] [CrossRef]
- Gerhardt, F.C.; Kjellberg, M.; Korkmaz, B.; Ljungqvist, K.; Shiri, A. Determining the EEDI “Minimum Propulsion Power”. In Influence of EEDI on Ship Design & Operation; Royal Institution of Naval Architects: London, UK, 2020; pp. 1–15. [Google Scholar]
- Liu, S.; Papanikolaou, A.; Bezunartea-Barrio, A.; Shang, B.G.; Sreedharan, M. On the Effect of Biofouling on the Minimum Propulsion Power of Ships for Safe Navigation in Realistic Conditions. J. Biofouling 2021, 37, 194–205. [Google Scholar] [CrossRef] [PubMed]
- IMO. MEPC 69/INF.23, Progress Report of SHOPERA and JASNAOE Projects for Development of the Revised Minimum Propulsion Power Guidelines. 2016. Available online: https://docs.imo.org/ (accessed on 15 August 2021).
- IMO. MEPC 70/INF.30, Supplementary Information on the Draft Revised Guidelines for Determining Minimum Propulsion Power to Maintain the Maneuverability of Ships in Adverse Conditions. 2016. Available online: https://docs.imo.org/ (accessed on 15 August 2021).
- IMO. MEPC 71/INF.28, Draft Revised Guidelines for Determining Minimum Propulsion Power to Maintain the Maneuverability of Ships in Adverse Conditions. 2017. Available online: https://docs.imo.org/ (accessed on 15 August 2021).
- IMO. (Resolution MEPC.1/Circ.850/Rev.2). 2017. Available online: https://docs.imo.org/ (accessed on 15 August 2021).
- IMO. MEPC 76/5/1, Report of the Correspondence Group on Air Pollution and Energy Efficiency. 2021. Available online: https://docs.imo.org/ (accessed on 15 August 2021).
- IMO. MEPC 75/6/3, Finalization of the Revised 2013 Interim Guidelines for Determining Minimum Propulsion Power to Maintain the Maneuverability of Ships in Adverse Conditions. 2019. Available online: https://docs.imo.org/ (accessed on 15 August 2021).
- IMO. Guidelines for Determining Minimum Propulsion Power to Maintain the Manoeuvrability of Ships in Adverse Conditions; MEPC.1/Circ.850/Rev.3; International Maritime Organization: London, UK, 2021. [Google Scholar]
- Liu, S.; Papanikolaou, A. Regression analysis of experimental data for added resistance in waves of arbitrary heading and development of a semi-empirical formula. Ocean. Eng. 2020, 206, 107357. [Google Scholar] [CrossRef]
- Minsaas, K.; Faltinsen, O.M.; Persson, B. On the Importance of Added Resistance, Propeller Immersion and Propeller Ventilation for Large Ships in a Seaway, PRADS’83—The 2nd Int Symp. on practical Design in Shipbuilding, Tokyo and Seoul. 1983. Available online: https://trid.trb.org/view/418624 (accessed on 15 August 2021).
- Liu, S.; Papanikolaou, A. On the Prediction of Added Resistance of Large Ships in Representative Seaways. Ships Offshore Struct. 2017, 12, 690–696. [Google Scholar] [CrossRef]
- Liu, S.; Shang, B.; Papanikolaou, A. On the resistance and speed loss of full type ships in a seaway. Ship Technol. Res. 2019, 66, 161–179. [Google Scholar] [CrossRef]
- International Towing Tank Conference. Recommended Procedures and Guidelines Prediction of Power Increase in Irregular Waves from Model Test. 7.5-02-07-02.2, Effective Date 2014. Revision 05. 2014. Available online: https://www.ittc.info/downloads/archive-of-recommended-procedures/ (accessed on 15 August 2021).
- International Towing Tank Conference. Recommended Procedures and Guidelines Resistance Test. 7.5-02-02-01, Effective Date 2011. Revision 03. 2011. Available online: https://www.ittc.info/downloads/archive-of-recommended-procedures/ (accessed on 15 August 2021).
- International Towing Tank Conference. Recommended Procedures and Guidelines Seakeeping Experiments. 7.5-02-07-02.1, Effective Date 2014. Revision 04. 2014. Available online: https://www.ittc.info/downloads/archive-of-recommended-procedures/ (accessed on 15 August 2021).
- Liu, S.; Sprenger, F.; Papanikolaou, A.; Dafermos, G.; Zaraphonitis, G. Experimental and Numerical Studies on Linear and Nonlinear Seakeeping Phenomena of the DTC Ship in Regular Waves. Ship Technol. Res. 2020, 68, 41–61. [Google Scholar] [CrossRef]
- Papanikolaou, A.; Liu, S. On the Uncertainties in the Estimation of the Added Resistance of Ships in Waves in View of Practical Applications. In Proceedings of the 5th Joint ISSC-ITTC International Workshop on Uncertainty Modelling in Wave Description and Wave Induced Responses, Virtual, 1–3 June 2021. [Google Scholar]
- De Jong, P.; Sharnke, J.; Drummen, I.; van Essen, S. Variability of Waves Generated in a Basin and Their Effect on Ship Responses. In Proceedings of the 5th Joint ISSC-ITTC International Workshop on Uncertainty Modelling in Wave Description and Wave Induced Responses, Virtual, 1–3 June 2021. [Google Scholar]
- MAN Diesel & Turbo. Basic Principles of Ship Propulsion, Copenhagen. 2011. Available online: https://www.man-es.com/docs/default-source/marine/tools/basic-principles-of-ship-propulsion_web_links.pdf?sfvrsn=12d1b862_10 (accessed on 15 August 2021).
Publisher’s Note: MDPI stays neutral with regard to jurisdictional claims in published maps and institutional affiliations. |
© 2021 by the authors. Licensee MDPI, Basel, Switzerland. This article is an open access article distributed under the terms and conditions of the Creative Commons Attribution (CC BY) license (https://creativecommons.org/licenses/by/4.0/).