Article

A Coupled Hydrodynamic-Equilibrium Type Beach Profile Evolution Model

1
Alfred Wegener Institute, Helmholtz Centre for Polar and Marine Research, 27570 Bremerhaven, Germany
2
School of Civil Engineering, University of Queensland, St Lucia, QLD 4072, Australia
*
Author to whom correspondence should be addressed.
J. Mar. Sci. Eng. 2021, 9(4), 353; https://doi.org/10.3390/jmse9040353
Submission received: 17 February 2021 / Revised: 19 March 2021 / Accepted: 19 March 2021 / Published: 24 March 2021
(This article belongs to the Special Issue Recent Advances in Coastal Sediment Dynamics and Transport)

Abstract

:
An equilibrium beach profile model is developed and coupled with a parametric hydrodynamic model to provide feedback between the evolving morphology and the hydrodynamics. The model is compared to laboratory beach profiles evolving toward equilibrium conditions under constant forcing. The equilibrium model follows the classical approach but uses the bulk sediment transport as the governing model parameter. This approach is coupled with empirically derived and normalised sediment transport functions and a parametric surf zone wave transformation model. The dissipation predicted by the surf zone model controls the cross-shore position of the maxima in the sediment transport functions and hence the cross-shore evolution of the beach profile. Realistic beach profile shapes are generated for both erosive (barred) and accretive (bermed) beach profiles, and predictions of bar and berm position are satisfactory. With more complex normalised sediment transport functions, the model can be applied to conditions with a cyclical wave climate. However, the model concept is better associated with erosive wave conditions and further work is required to improve the link between the modelled dissipation and local transport for accretive conditions.

1. Introduction

The understanding of the impact of cyclic erosion/recovery sequences on beach profiles is crucial to design appropriate sustainability plans. Process-based models can fairly well represent sandbar migration episodes [1] but fail to describe the beach face evolution. Moreover, there is still little evidence that such models perform well for cyclic erosion/recovery sequences or for clustered storms conditions. A range of equilibrium (strictly disequilibrium) models have successfully managed to reproduce mean shoreline evolution under seasonal cyclic wave conditions [2]. Shoreline change is a good proxy to quantify subaerial beach erosion or accretion rates but gives no information about profile shape or submerged sandbars. Such models are also not coupled with the hydrodynamics and therefore the beach profile evolution and bar morphology do not influence the shoreline evolution. To some extent this has been addressed by using the history of the wave climate, through the Gourlay number, [3], as a proxy for the antecedent beach profile conditions, which then modifies the equilibrium model [4,5,6]. Davidson and Turner [7] extended the disequilibrium model approach to include set of beach profile templates for erosive and accretive conditions. The evolution between the profile types was governed by the disequilibrium in the Gourlay number and shape functions for the beach profile between the depth of closure, runup limit, including a bar-trough function. This model produced realistic bar shapes, but was not compared to beach profile data, and did not include a hydrodynamic model.
The present paper builds on these two model approaches, and the disequilibrium model of Birrien et al. [8], which modelled the bulk sediment transport and the shoreline change, as well as the non-dimensional bar crest depth. Two significant changes are made to the previous models to develop the new coupled morphological model. Firstly, the beach profile evolution is controlled by defined dynamic (in both amplitude and cross-shore position) cross-shore sediment transport rates. These have a normalised shape, with the magnitude of the transport controlled by the disequilibrium model. Secondly, the hydrodynamic coupling is obtained through the location of the maxima in the local sediment transport rates, which is controlled by and linked to the maxima in the surf zone energy dissipation over the evolving beach profile. The energy dissipation rate is calculated from a parametric beach profile model following the established approaches of Janssen and Battjes [9] and Alsina and Baldock [10]. The model transport functions are derived from laboratory data from experiments previously described in Baldock et al. [11] and the disequilibrium model is that of Birrien et al. [8]. Those papers and Davidson and Turner [7] and Yates et al. [2] provide extensive descriptions of the prior disequilibrium model approach and the many variants, and that literature is not summarized further here.

2. Materials and Methods

2.1. Model Concepts

The coupled hydrodynamic-equilibrium type beach profile evolution model describes the beach profile response to erosion and/or recovery sequences. Overall, the model steps are relatively straightforward. The disequilibrium model is based on the conceptual approach for the bulk net sediment transport, (Q(t), [12,13], which provides a robust measure of overall beach erosion or accretion. In the model, the bulk transport at equilibrium Qeq (m3/m) is defined as:
Q e q = A ( Ω e Ω ) Ω n
where A (m3/s) and n are respectively a constant and some power, which need to be calibrated. Ω is the Gourlay number (or dimensionless fall velocity) which is presently the most reliable parameter to discriminate between erosive and accretive profile behaviour (e.g., Gourlay [3], Wright et al. [4], Yates et al. [2], Davidson and Turner [7] and many others) and Ωe is its equilibrium value, when no net bulk sediment transport occurs. The evolution, calibration and modelling of the bulk transport over time, Q(t), for a range of laboratory experiments and wave climates using equation (1) is described fully in Birrien et al. [8].
Here, given an initial profile and a wave climate (Hs, Tp) the Qeq-Ω curve defines the response of the bulk transport and is linked to the beach profile evolution to equilibrium in term of the cumulative transport, Q(t), as a function of time (see Figure 1). Sediment is automatically conserved in the profile since Q(t) is the bulk net sediment transport and governs the magnitude of the local sediment transport (q(x)) that controls the beach profile evolution.
The hydrodynamic coupling is inspired by the concept that the maximum absolute rate of local sediment transport occurs at the location where the wave energy dissipation is a maximum. The inspiration for this concept arises from the authors’ reading of the work by R.G. Dean on equilibrium beach profile modelling (e.g., Dean (1991)), but do not have a definitive reference that states this concept. For an evolving active breaker bar, it can be expected that the maximum in the transport rate (which, from the sediment continuity equation, is where sequential profiles intersect) is close to the bar crest. This is also where the dissipation from wave breaking is expected to be maximum (as illustrated below). Hence, this is a well-founded concept. Feedback between the hydrodynamics, morphology and the sediment transport rates then occurs through the influence of the bathymetry on the wave transformation process.
The model is composed of three main steps, with a schematic of the model steps illustrated in Figure 1a,b.
  • Given an initial profile and incident wave conditions, a parametric wave hydrodynamic model (here Alsina and Baldock [10]) provides the wave dissipation, D, across the profile, with Qeq defined by (1). Other wave models could be adopted instead. D is defined in equation (9) of Alsina and Baldock [10]).
  • Predefined normalised dynamic local sediment transport functions define the transport rate at any location. The sediment transport functions are constrained to match the maxima (minima for erosion) of transport with the location of the maxima in the dissipation obtained from the parametric wave model. The transport rates are then non-normalized according to the Q(t) curve and the time discretization to provide the required dimensional local sediment transport rates.
  • The beach profile is then updated in the usual manner by using the sediment continuity equation to obtain the bed elevation change from the dimensional local sediment transport function, q(x).
The model steps and calculations are illustrated further below with examples based on the experimental data. The experiments and experimental apparatus have been extensively described in the prior work described above [8,11], so a very brief summary is given here.

2.2. Experimental Setup

The beach comprised of well-sorted natural beach sand, d50 = 0.3 mm, and was constructed with a wide berm at the back of the beach and an initially uniform plane slope of gradient 1:10. Beach profiles were measured using an eight-component laser profiler enabling accurate estimates of local and net bulk transport rates to be derived from morphological changes. The sampling interval varies, with higher frequency at the start (1 h) and lower (4 h) at the end (when almost no bed elevation changes occur). In addition to the initial and final profiles, 9 intermediate profiles were surveyed.
The test series discussed here are three random wave cases from Baldock et al. [11], Table 1. Within each test, wave and water level conditions were held constant until the beach profile reached an equilibrium condition (no significant profile change). Run times required to achieve equilibrium conditions varied, from 4 h to 58 h. Scale effects in the physical model compared to natural beaches are discussed at length in the prior papers, but the model scale here is the same as the experimental scale, so there are no scale distortions between model and data.
Sediment transport rates are calculated from the beach profiles and the sediment continuity equation. The local total solids sediment transport rate (bed load and suspended load) per unit width of beach between any two time periods (interval ∆t) is determined from the sediment continuity equation:
q ( x i ) = q ( x i 1 ) + x i 1 x i N Δ z Δ t dx
where positive values of q (m2/s/m) represent onshore transport, xi is the cross-shore location, Δz is the change in bed elevation (m), Δt is the time difference, and N is the solid fraction, taken as 0.6 following previous work (e.g., Birrien et al., 2018). The bulk cross-shore solids sediment transport, Q, across the whole profile between any two time periods is determined from integrating the local transport volume along the profile over the same closure limits:
Q = Δ t x m i n x m a x q ( x ) d x
Q represents the bulk cross-shore solids sediment transport (m3/m representing the bulk transport per unit width) moved either shoreward (positive) or offshore (negative), and has previously been adopted to categorise overall beach response as erosive (Q < 0), accretionary (Q > 0) or balanced (Q ≈ 0) [12,13].

2.3. Model Development

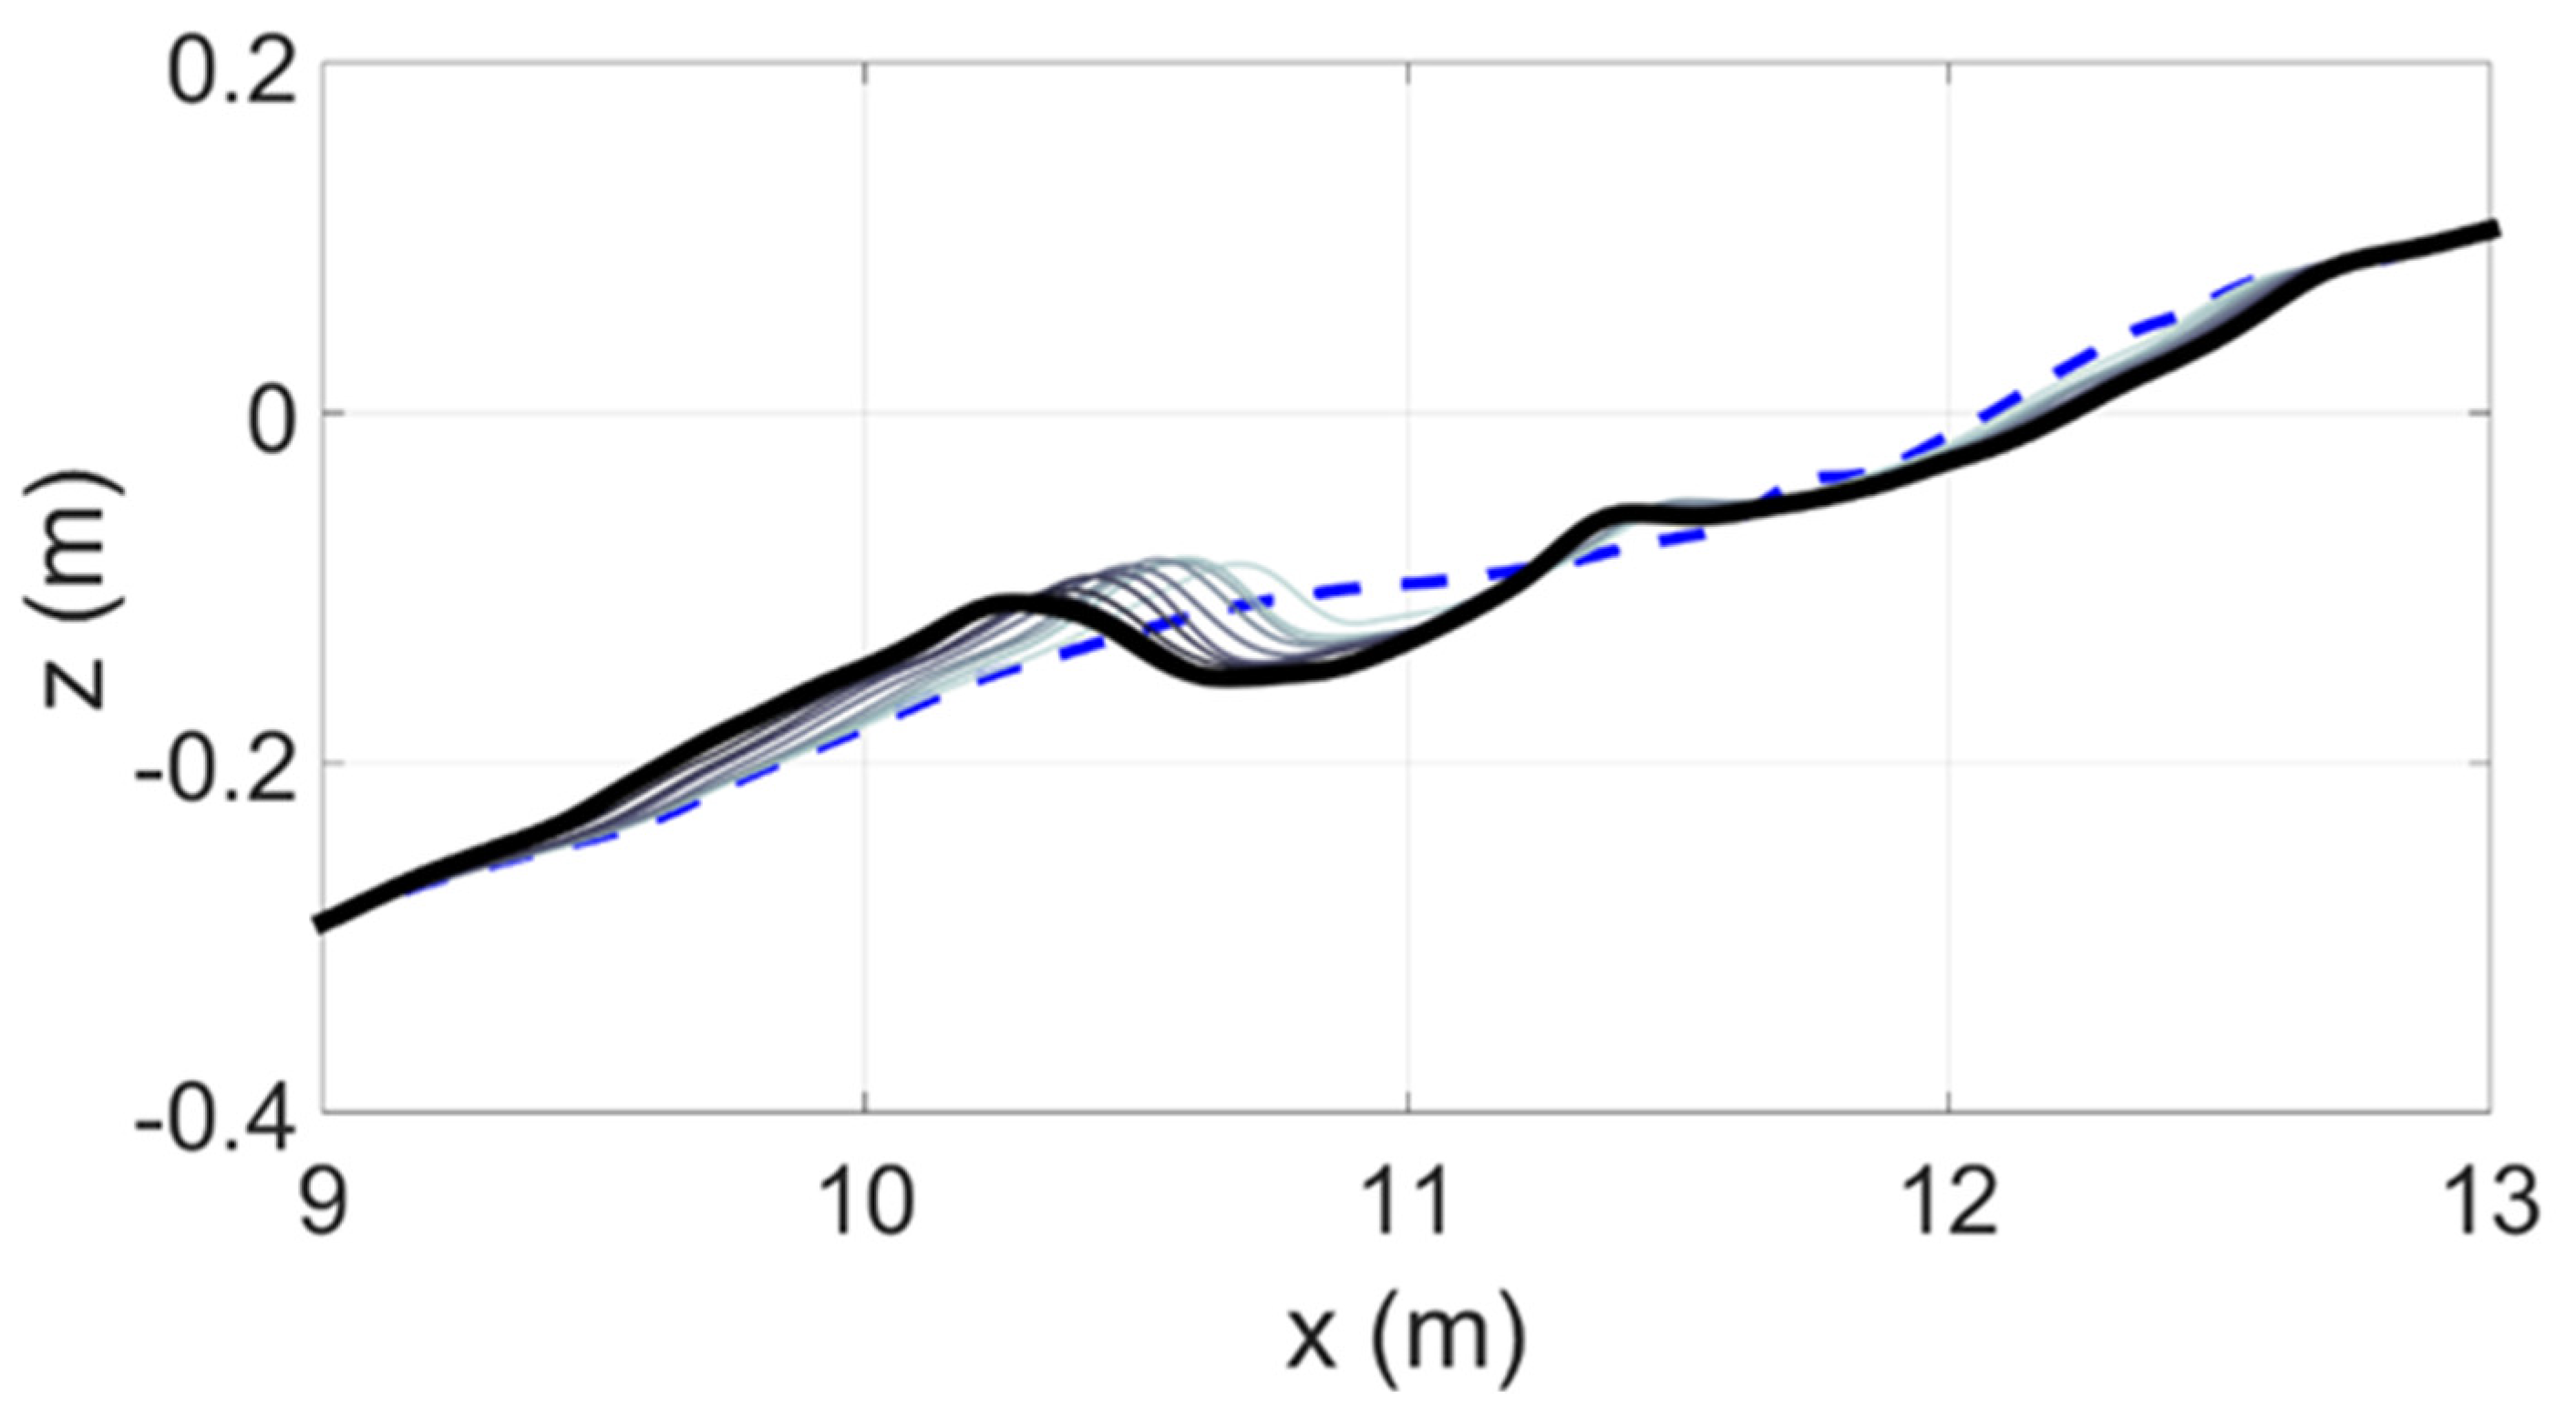
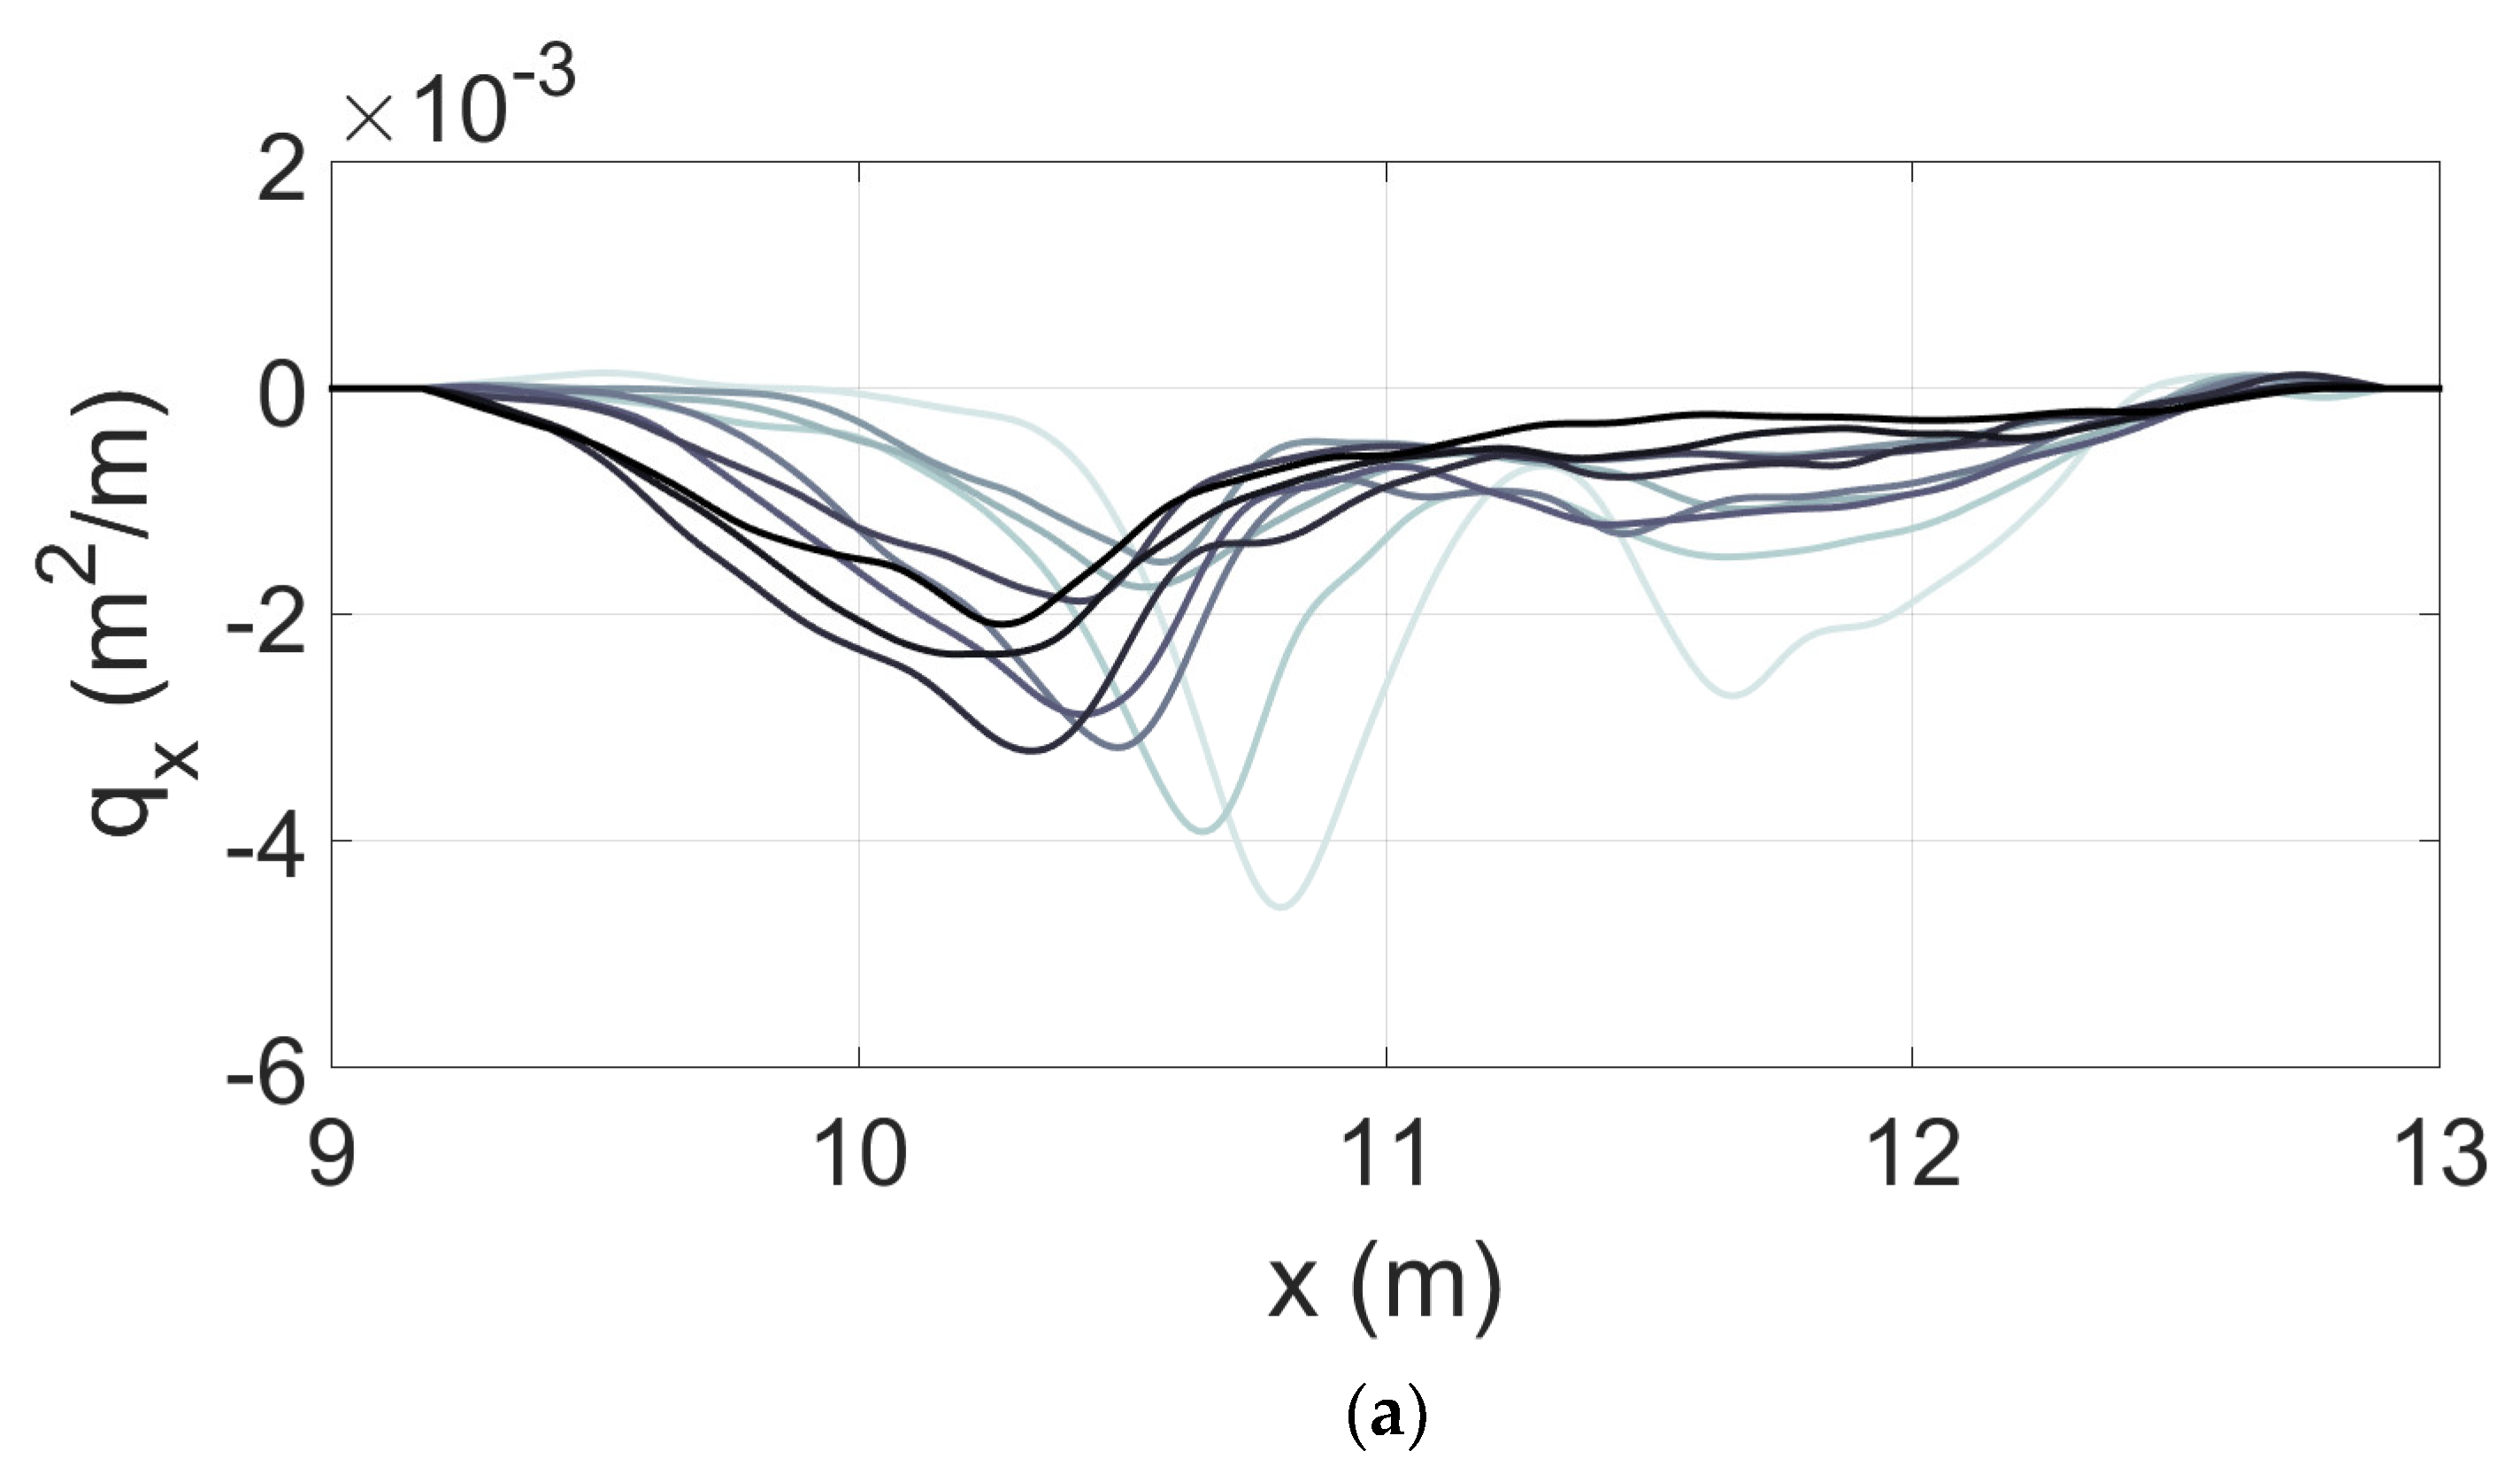
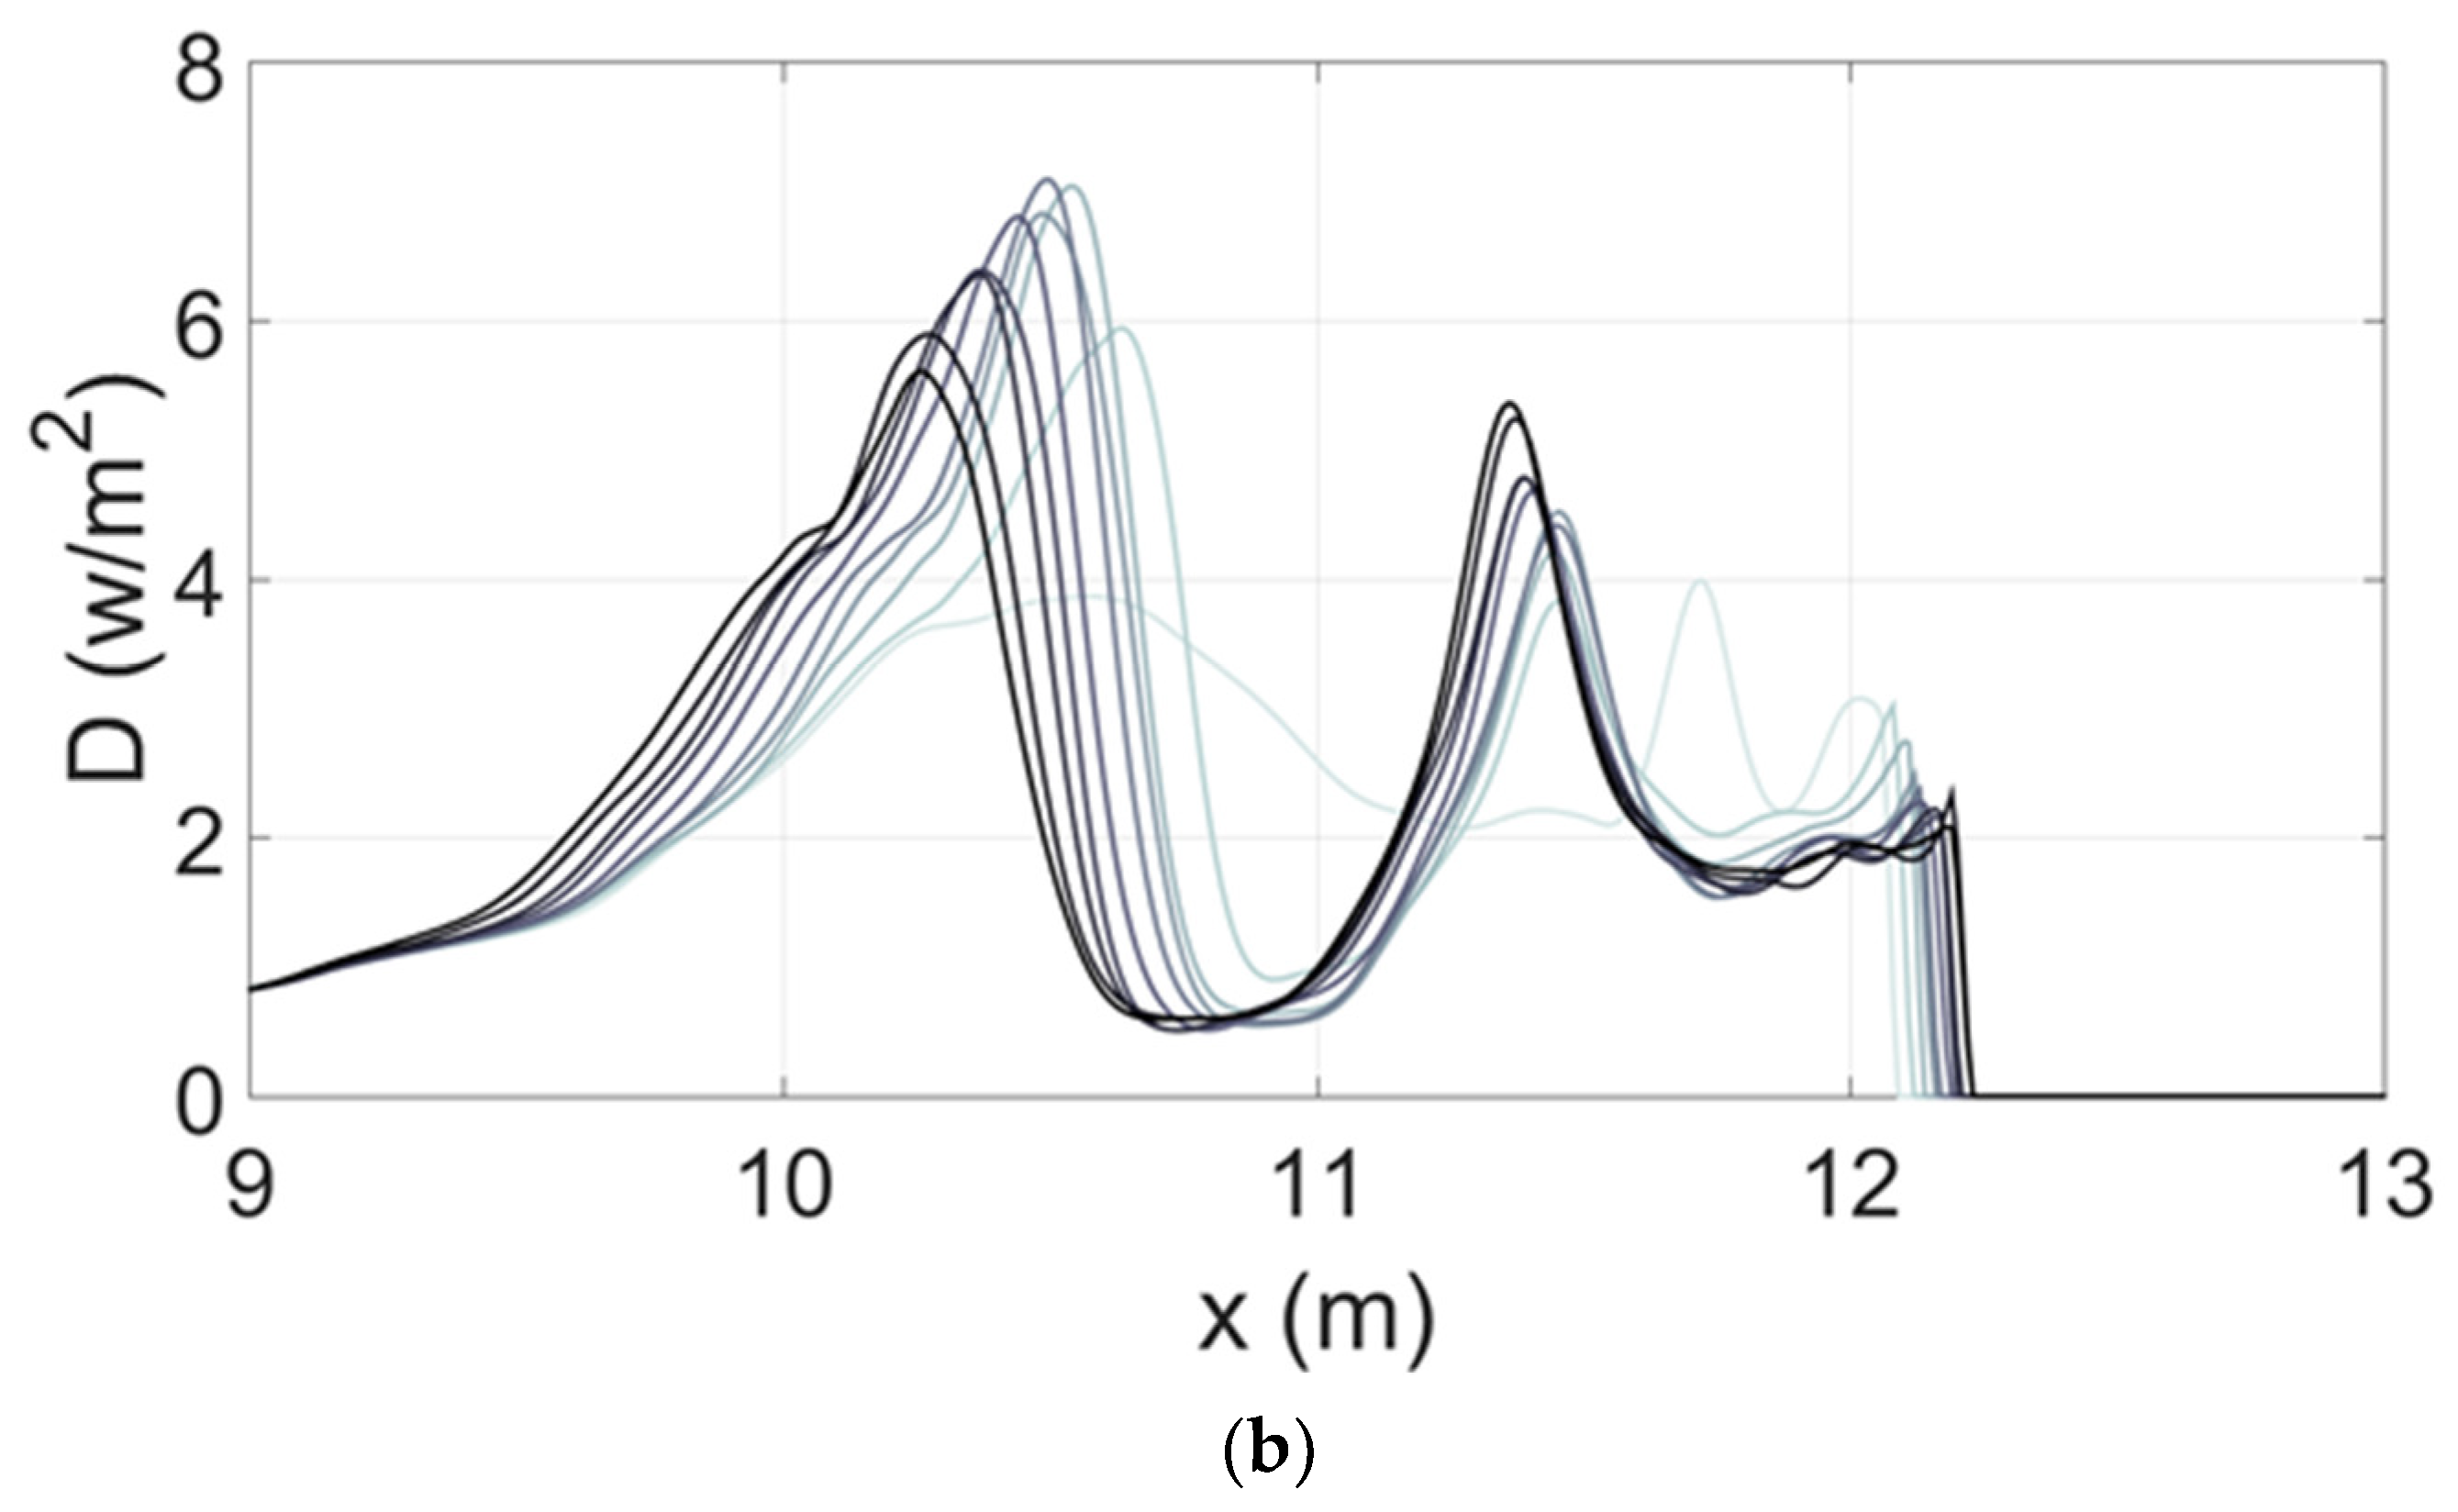
Figure 2 illustrates the profile evolution for case A, which evolves from a planar beach to a barred beach. The associated sediment transport curves (q(x)) are provided in Figure 3a, calculated using Equation (2), but with Δt = 1 (−) so the curves represent the transport between the successive profiles, not transport rates. This is because the shapes of the curves are not easily observed at later timesteps as the transport per second tends to zero as the beach profile tends toward equilibrium. The feedback between the hydrodynamics and bathymetry, which drives the seaward progression of the bar, is obtained by linking the dissipation from the hydrodynamic model to the maximum (absolute) rate of local sediment transport.
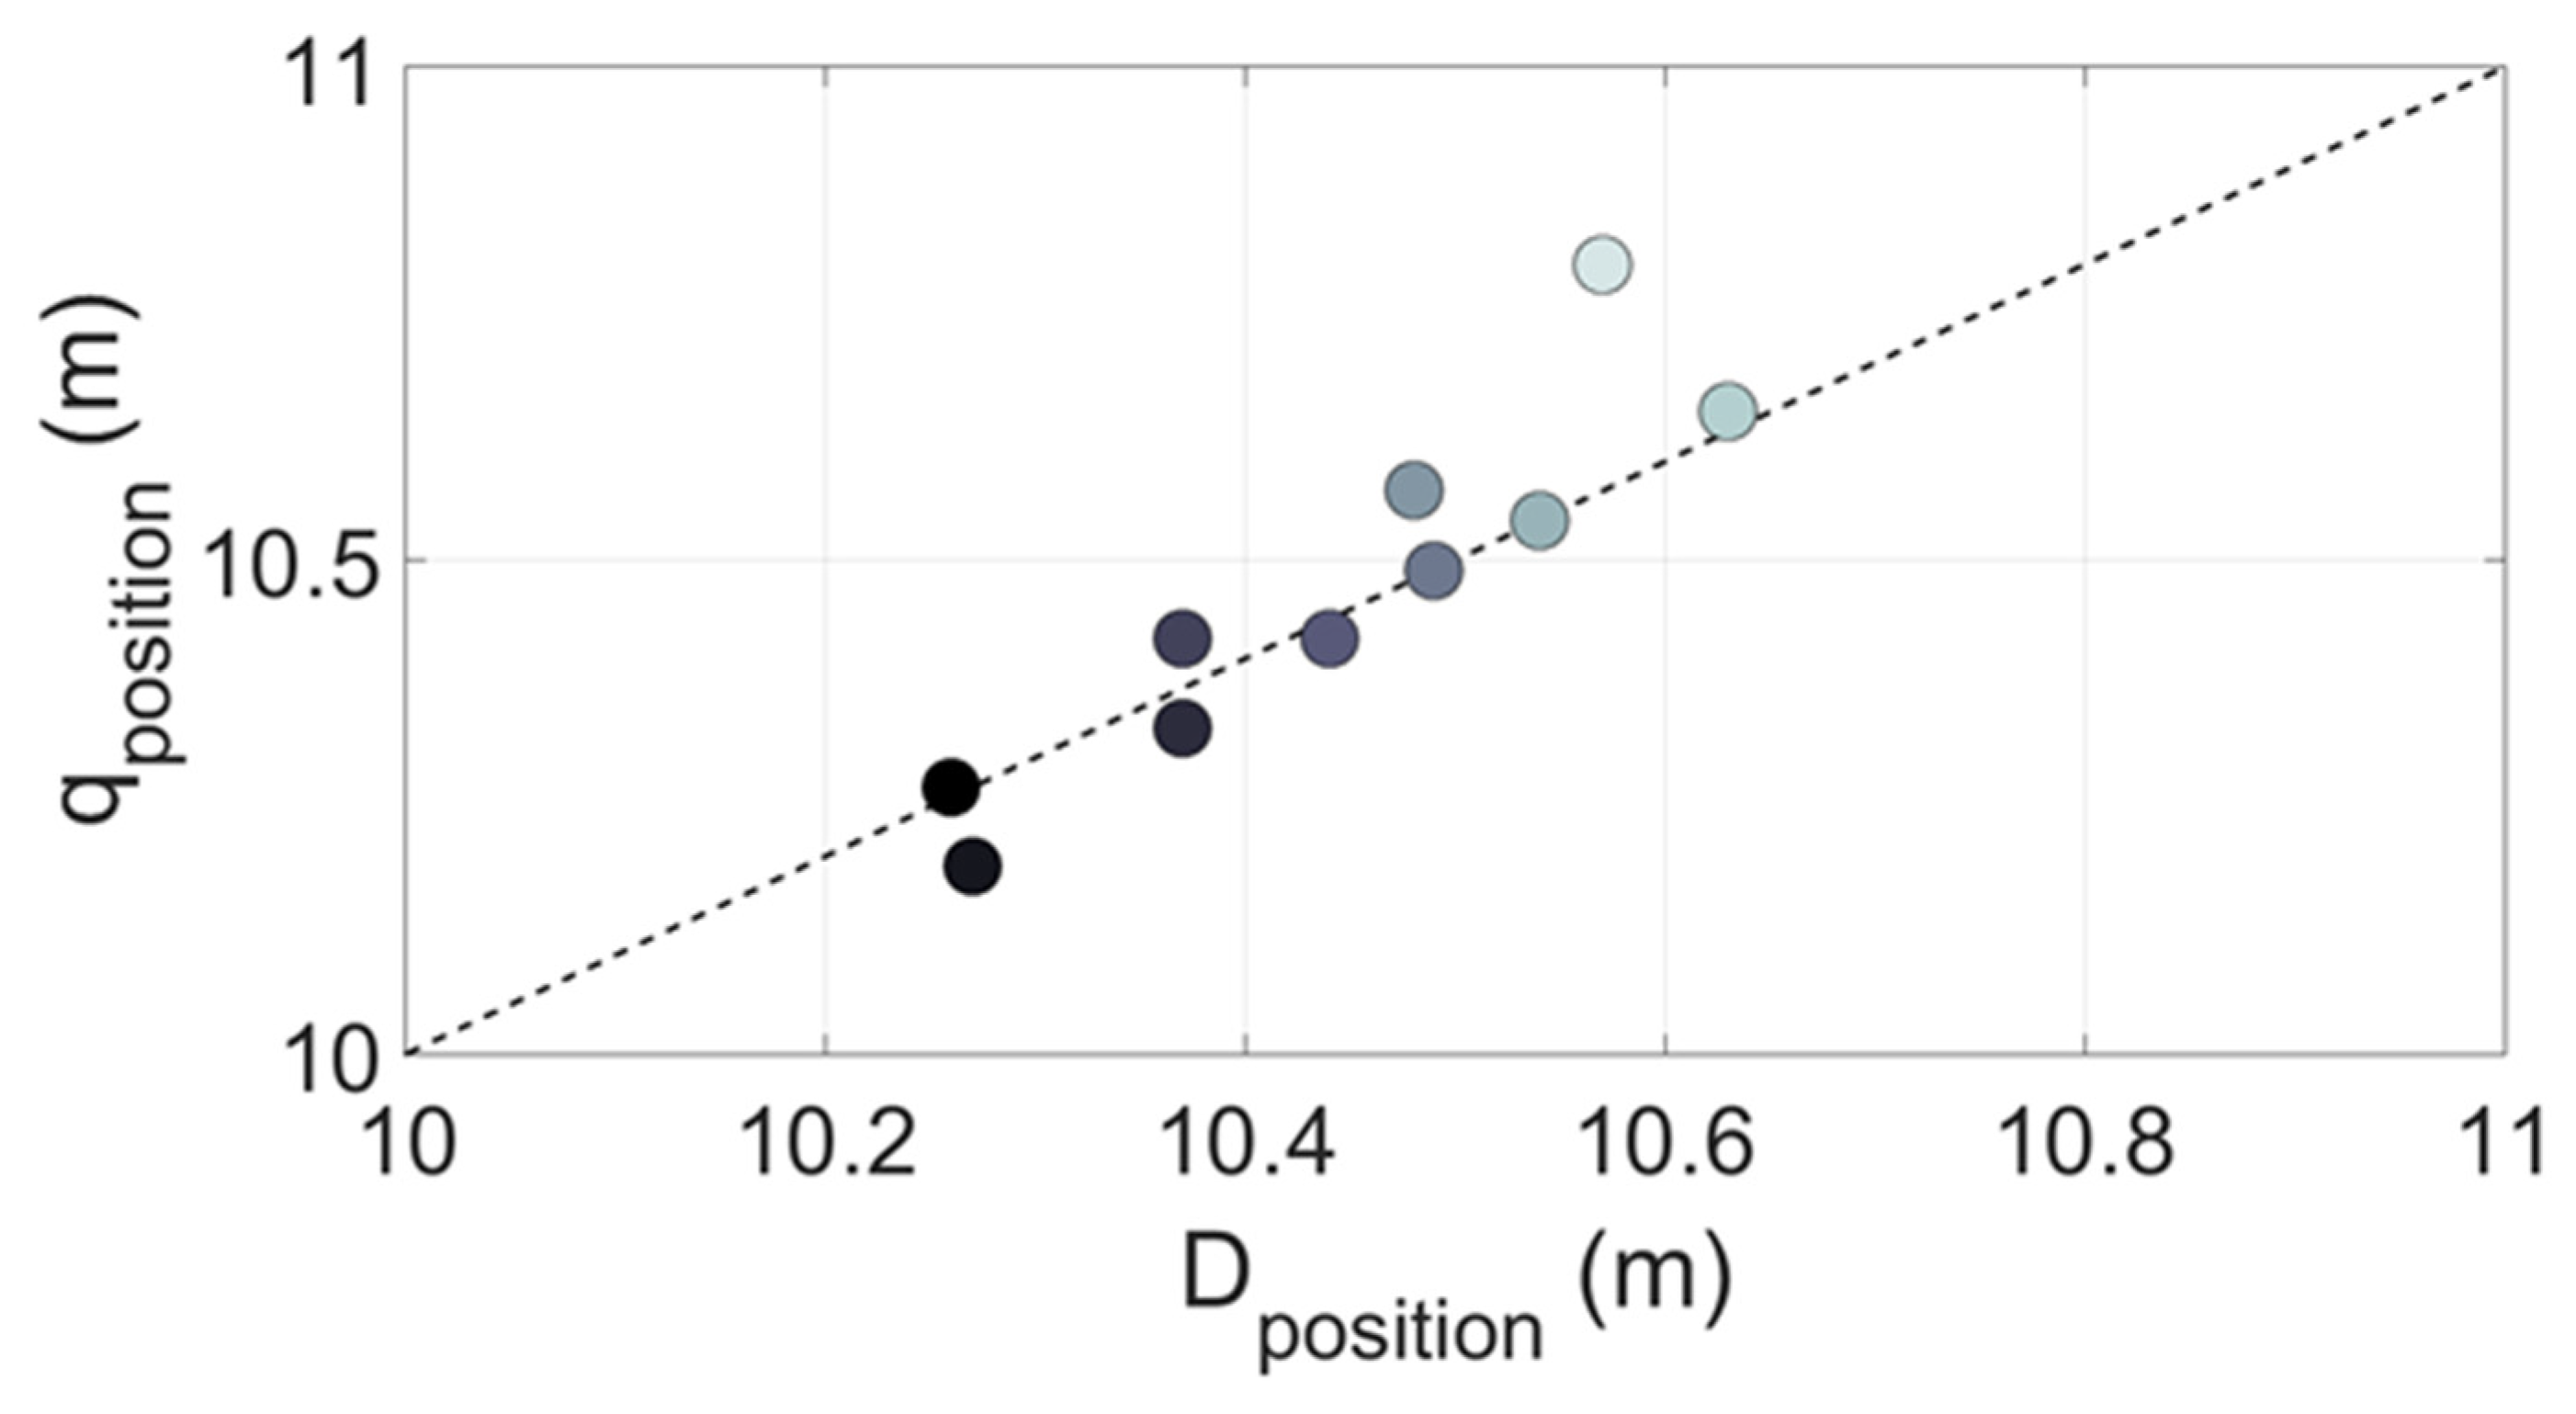
The dissipation rates calculated for the prior profiles are illustrated in Figure 3b, which indicate the peak transport occurs in the vicinity of the offshore bar. Figure 4 correlates the location of the (absolute) maximum in local sediment transport (Figure 3a) and the location of the peak in wave energy dissipation (Figure 3b). The vicinity of all the points to the one-to-one equivalence line confirm the underlying assumption of collocated dissipation/transport peaks.
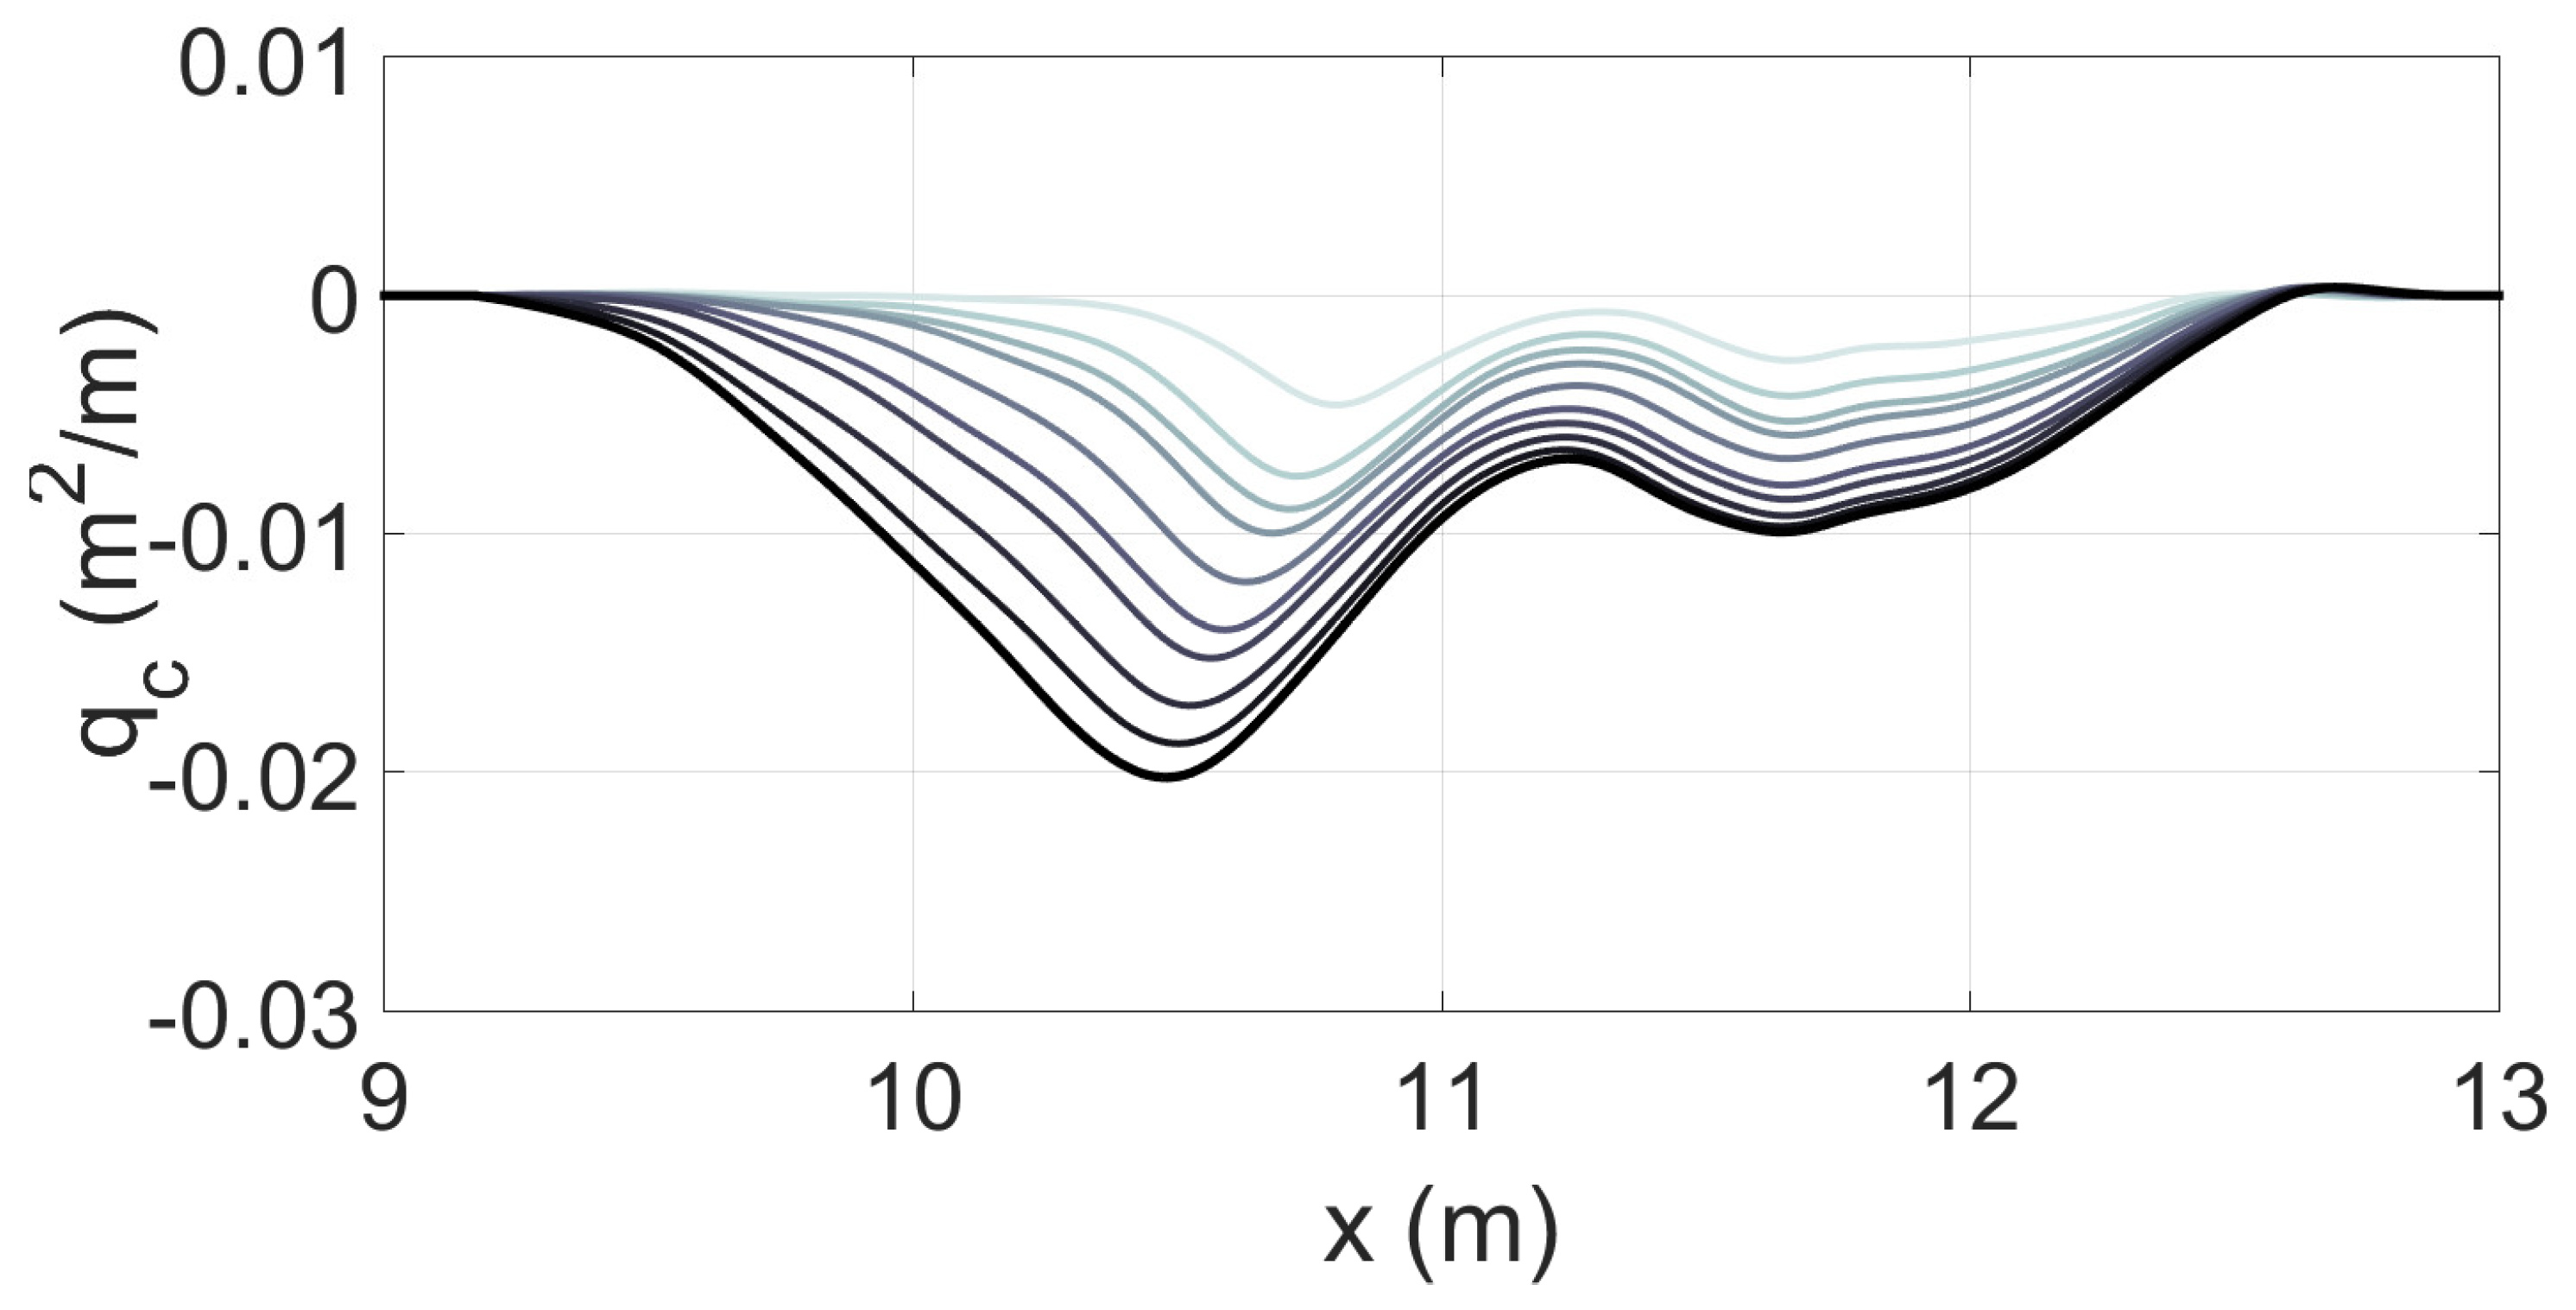
Clearly, in Figure 3a, not all the local transport patterns are identical. However, at a macro scale, the patterns are very similar, and the pattern shown is very typical of erosive beach profiles in 2D laboratory experiments at small and large scales [11,12,14]). The mean local transport pattern from Figure 5 is obtained by centring each curve in Figure 3a on the maxima and normalising by the maximum values. The robustness of this approach is illustrated in Figure 6, which shows the cumulative local transport curves as the beach profile evolves. The individual curves have the same shape as the mean transport pattern, and hence adopting the mean sediment transport pattern provides an accurate representation of the profile evolution (see results).
Note that while the cumulative transport patterns are less ‘noisy’, normalising and using the mean of the cumulative transport rates leads to a shift in the maximum transport away from the location of the peak in the dissipation. This is because the cumulative rate contains a lag effect from the preceding history of the beach evolution. Therefore, the local transport is averaged to determine the mean transport pattern.
The mean and local sediment transport patterns are also similar to those observed in the field, see Patterson [15], his Figure 5.8, where the maxima in sediment transport also occurs in the vicinity of the wave break point. Here, the model is illustrated using laboratory data. For a given beach in the field, we expect that the transport patterns do not vary significantly, since beach profiles cycle between different beach states, but may well vary for different beaches. This remains to be investigated, but the same model concepts can be applied with either bespoke or a generic local transport pattern.
The mean normalised local transport pattern in Figure 5 corresponds to a typical erosive shape. It is used as the standard transport shape for the erosive model in the present paper. The same pattern is easily scaled for a different wave condition by normalising the profile extent using the run-up limit and the depth of closure. The magnitude of the sediment transport rate is obtained by from the Q-Ω model developed Equation (1) developed by Birrien et al. [8]. That model is analogous to the shoreline models of Yates et al. [2] and Splinter et al. [6], but estimates the bulk transport rate, rather than the shoreline position. It requires calibration with data in the same manner as the other disequilibrium models. The cross-shore location in (absolute) space of the location of the peak transport is obtained from the surf zone dissipation model.
The non-normalised transport rates are obtained as follows. The net bulk transport represented by the normalised mean q(x) curve in Figure 5 is obtained from Equation (3), again with Δt = 1 (−), and is then constant over time. This value is then scaled according to the required value of Q(t) given by the Q-Ω model and the model timestep, to provide non-normalised transport rates that correspond to the expected (actual) transport rates. The required new beach profile is then simply obtained from the sediment continuity Equation (2).
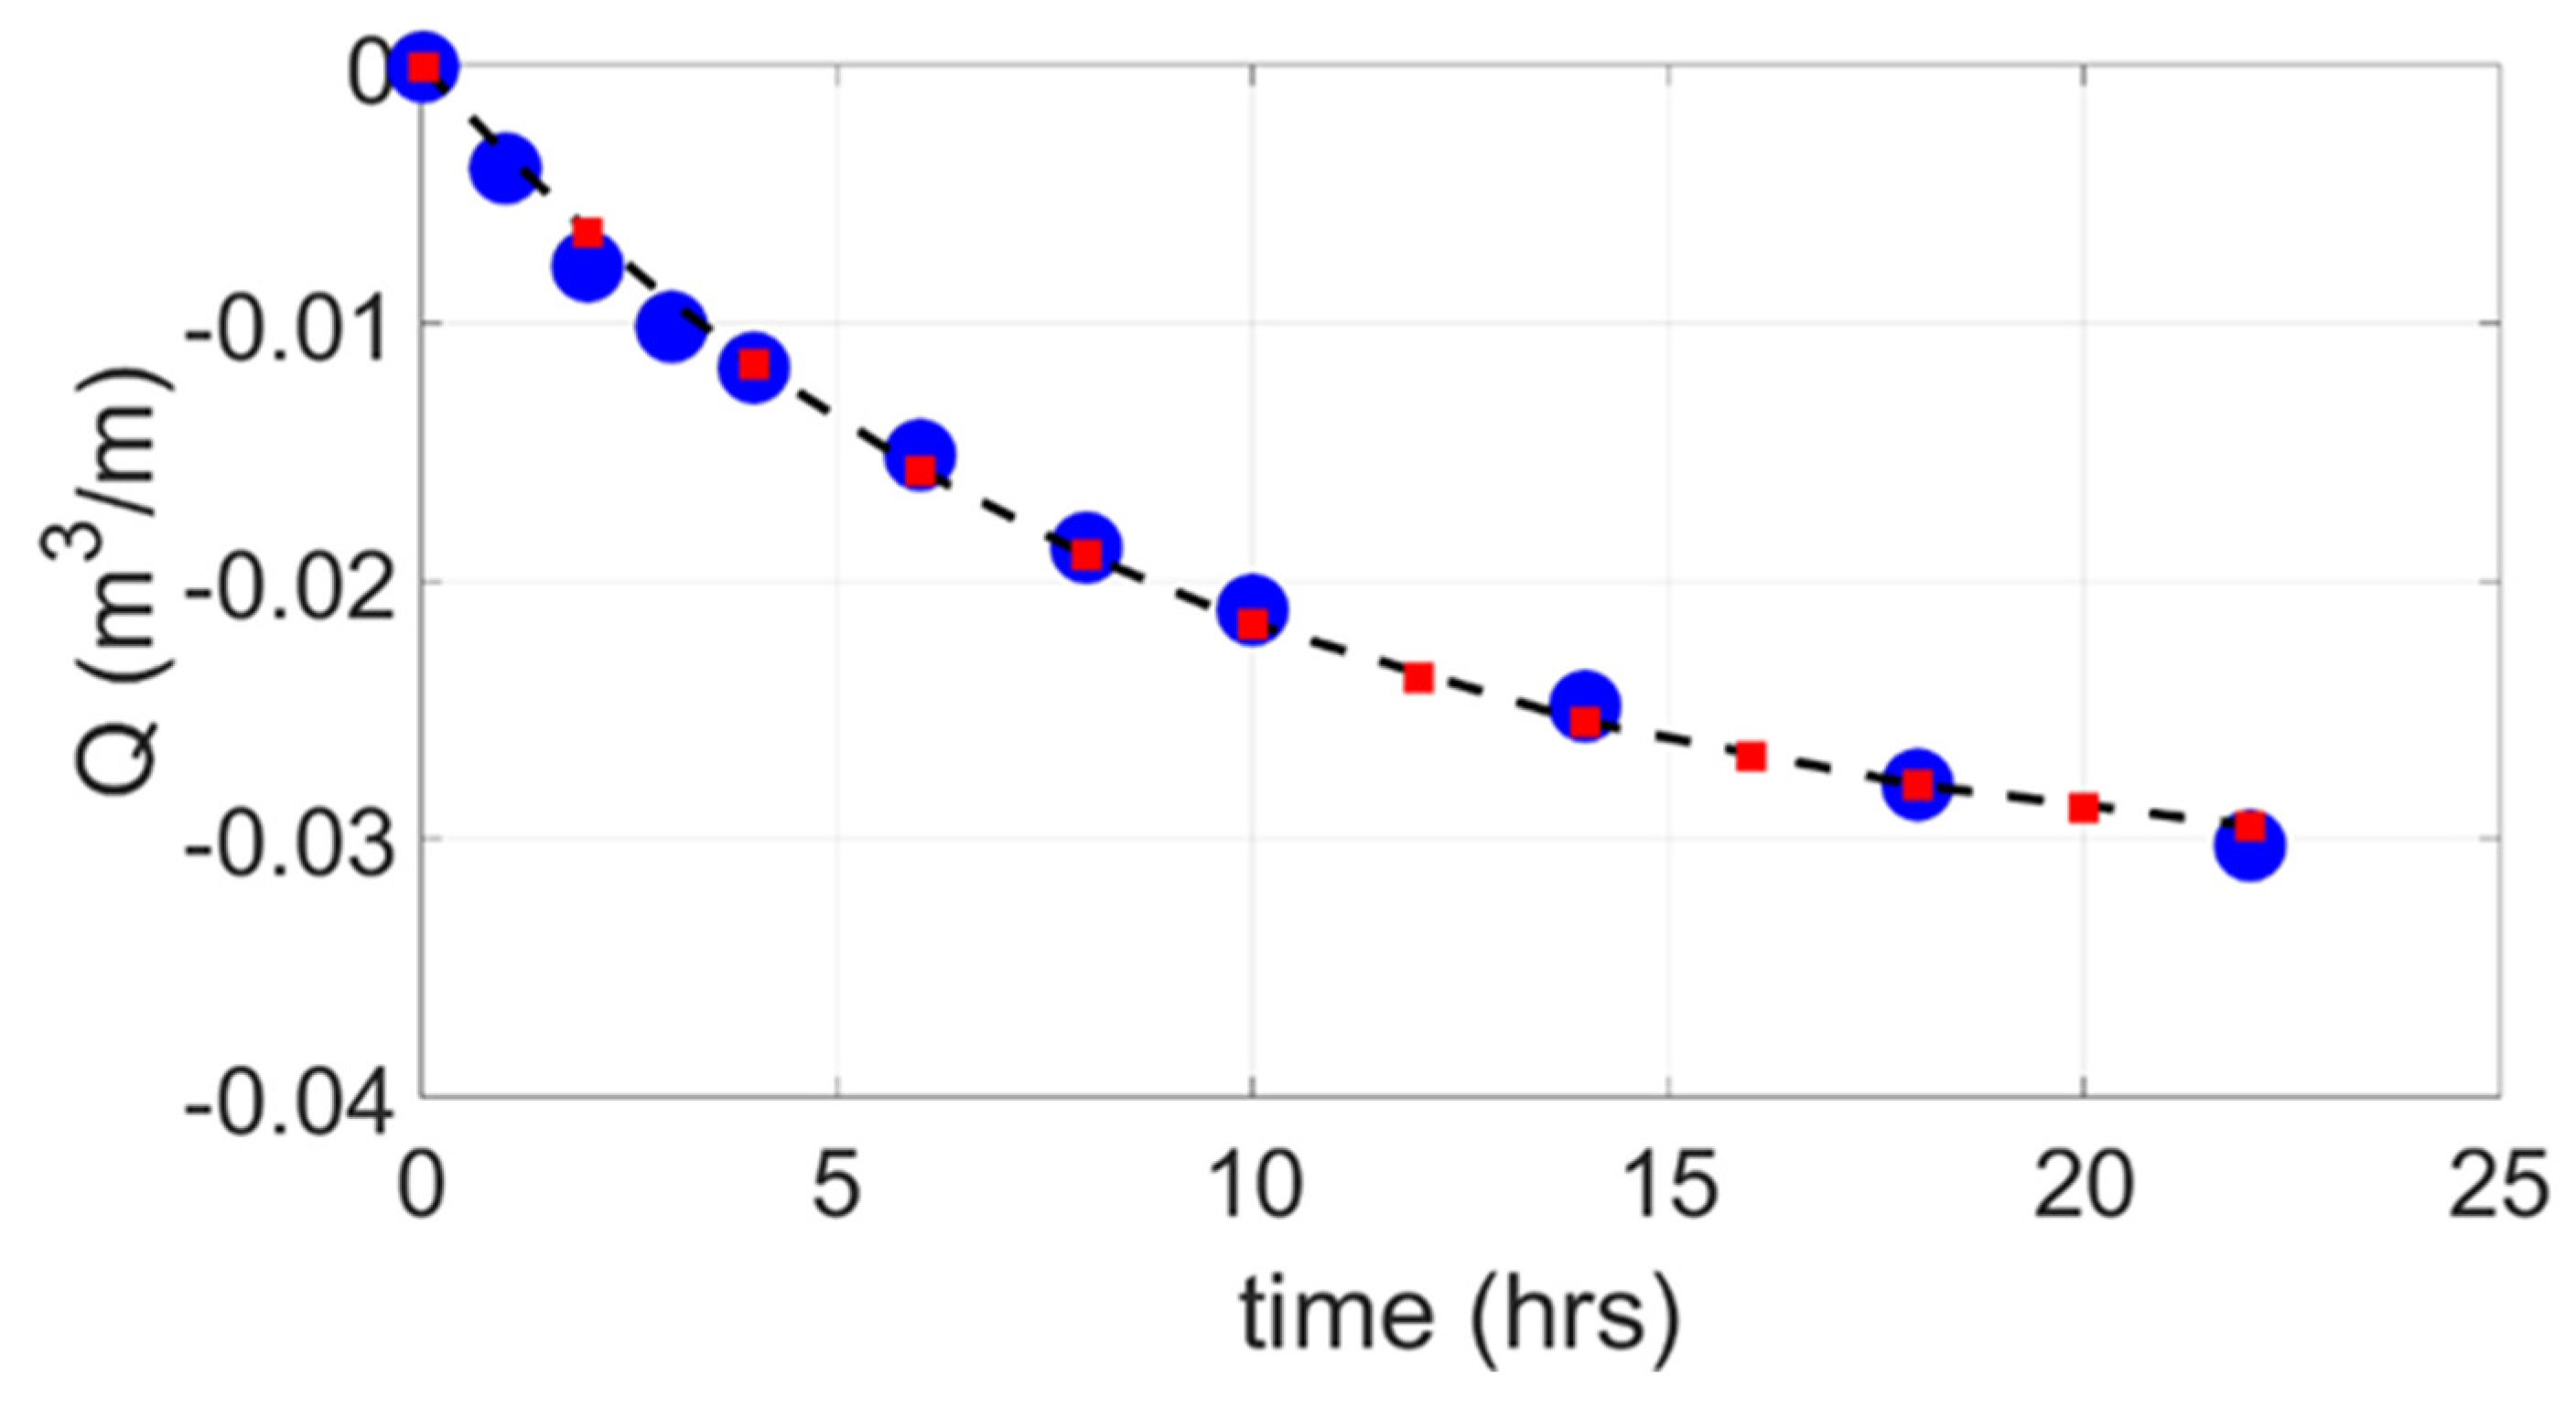
A typical output from the Q-Ω model provides the magnitude of the net bulk transport over time, Q(t), which is used to calculate the cumulative transport up to a given instant in time, or the difference in the net bulk transport over individual model timesteps, Figure 7. Here, at each time step, the difference in between 2 consecutive discrete transport points is used to normalize the local standard transport rate. The same model approach is used for accretive conditions, but with a different normalised transport function and different Q(t) relationship (see results).

3. Results

3.1. Erosive Conditions, Case A

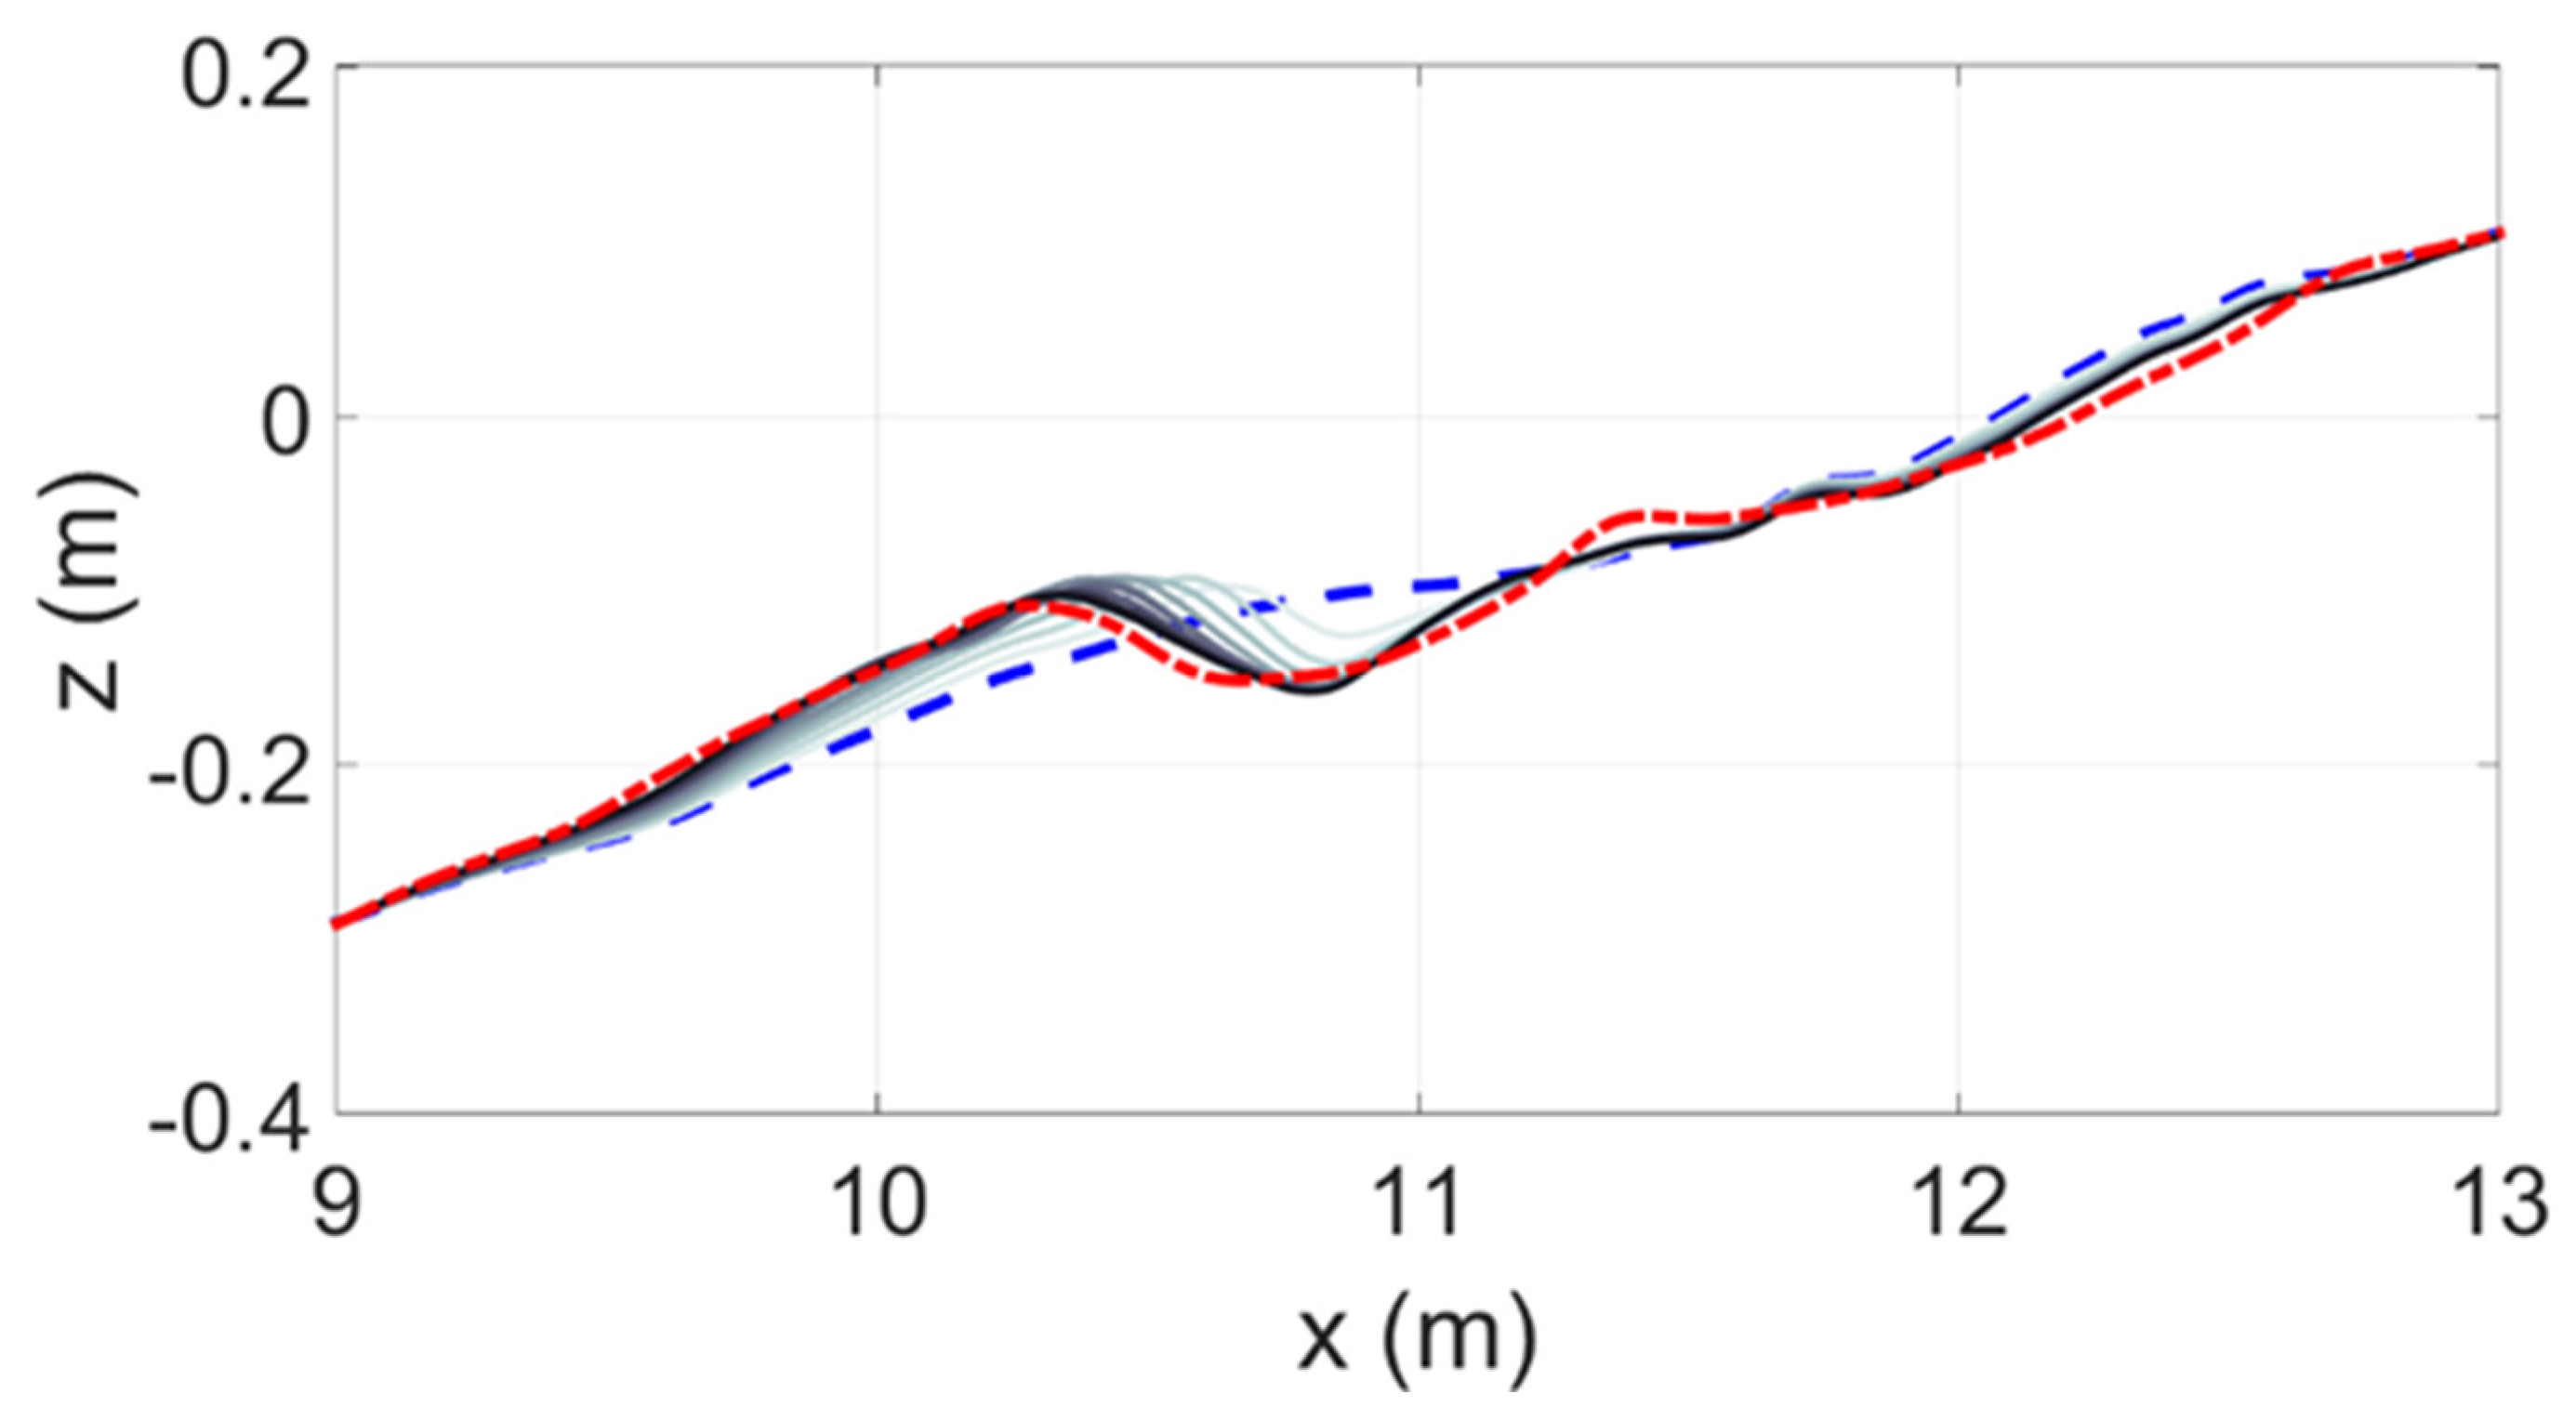
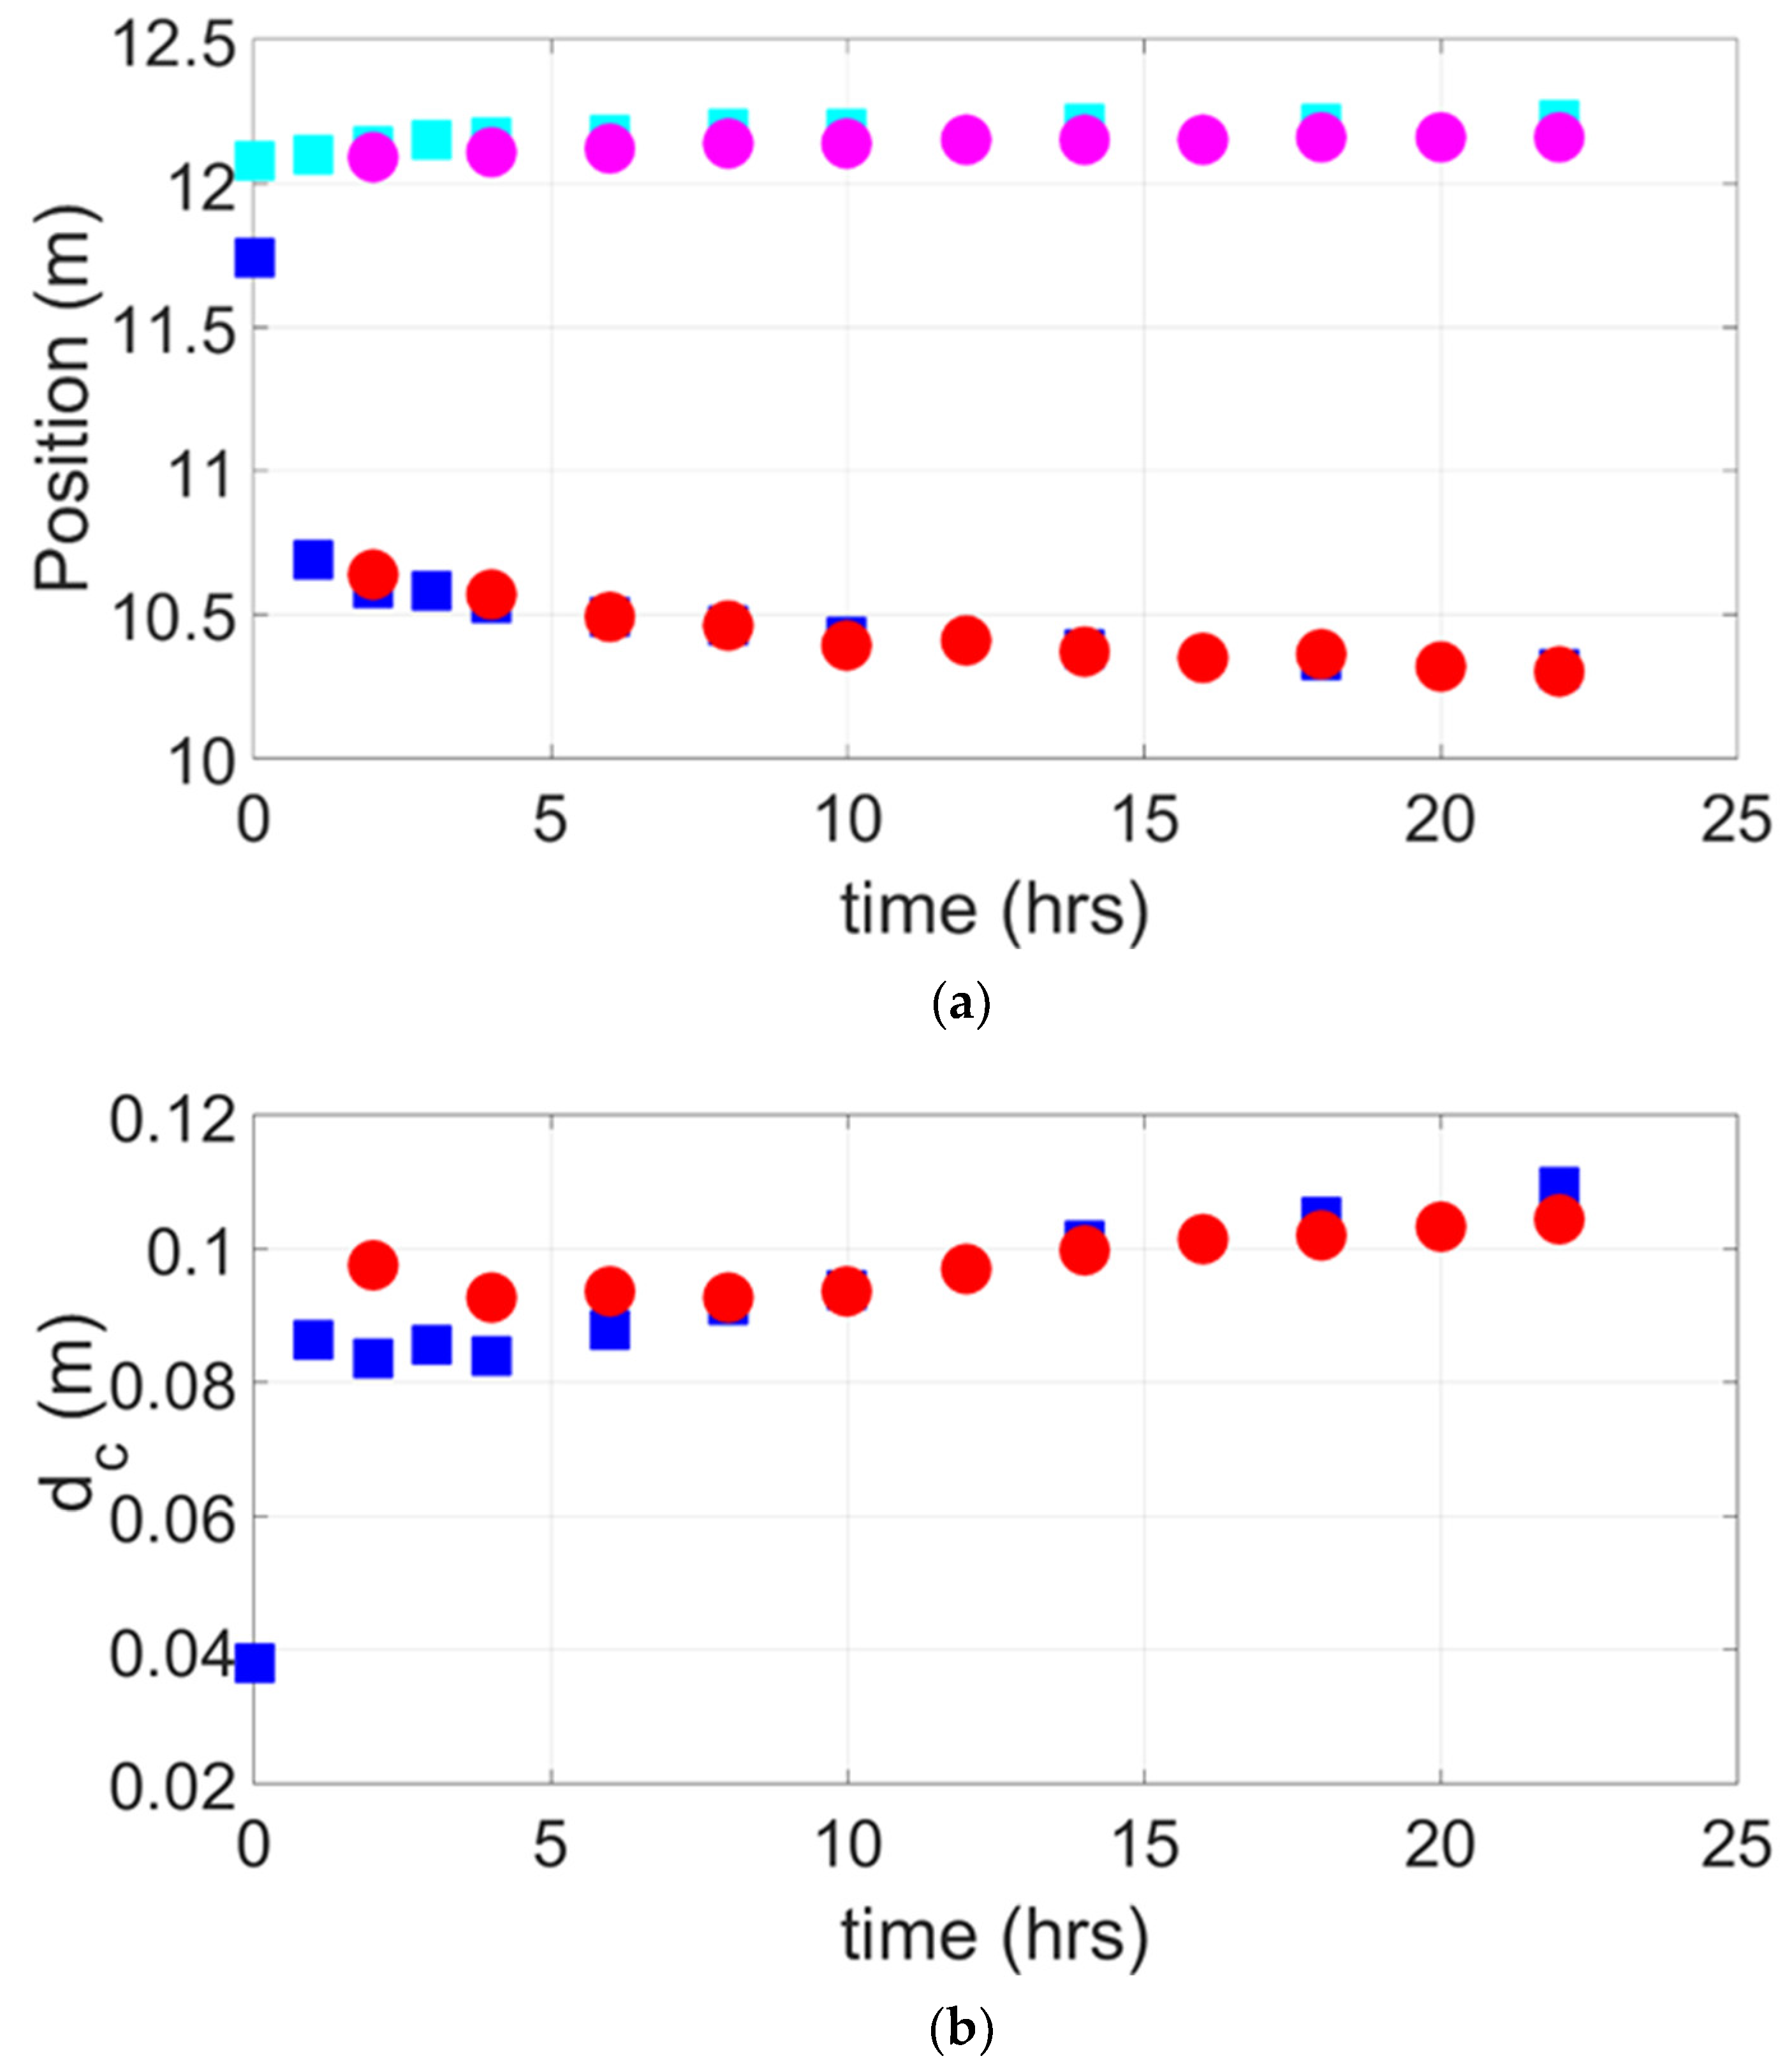
Figure 8 illustrates the profile evolution for the erosive case A. The bar position and shape are reproduced well, including the offshore flank of the bar and the bar trough. Erosion occurs on the upper beach face, and the limit of erosion near the run-up limit is reproduced accurately, but the shoreline erosion is slightly under predicted. Figure 9a,b compare the modelled and observed location of the shoreline (SWL position), the elevation of the bar crest and the depth over the bar crest, with generally good agreement in terms of the timescale of the changes and the magnitude of the changes. The errors are quantified in Table 2, which gives the root-mean-square errors between modelled and observed values. There is not an obvious parameter with which to non-dimensionalise the error in each variable and hence the Brier Skill Score [16] is used as an overall estimate of model fit. The estimated model skill based on the Brier Skill Score, which compares the modelled profile as a predictor with the initial profile, i.e., the gain in skill compared to using the initial profile as a predictor, is BSS = 1 − (0.0075)2/(0.0221)2 = 0.89.

3.2. Accretive Conditions, Case B

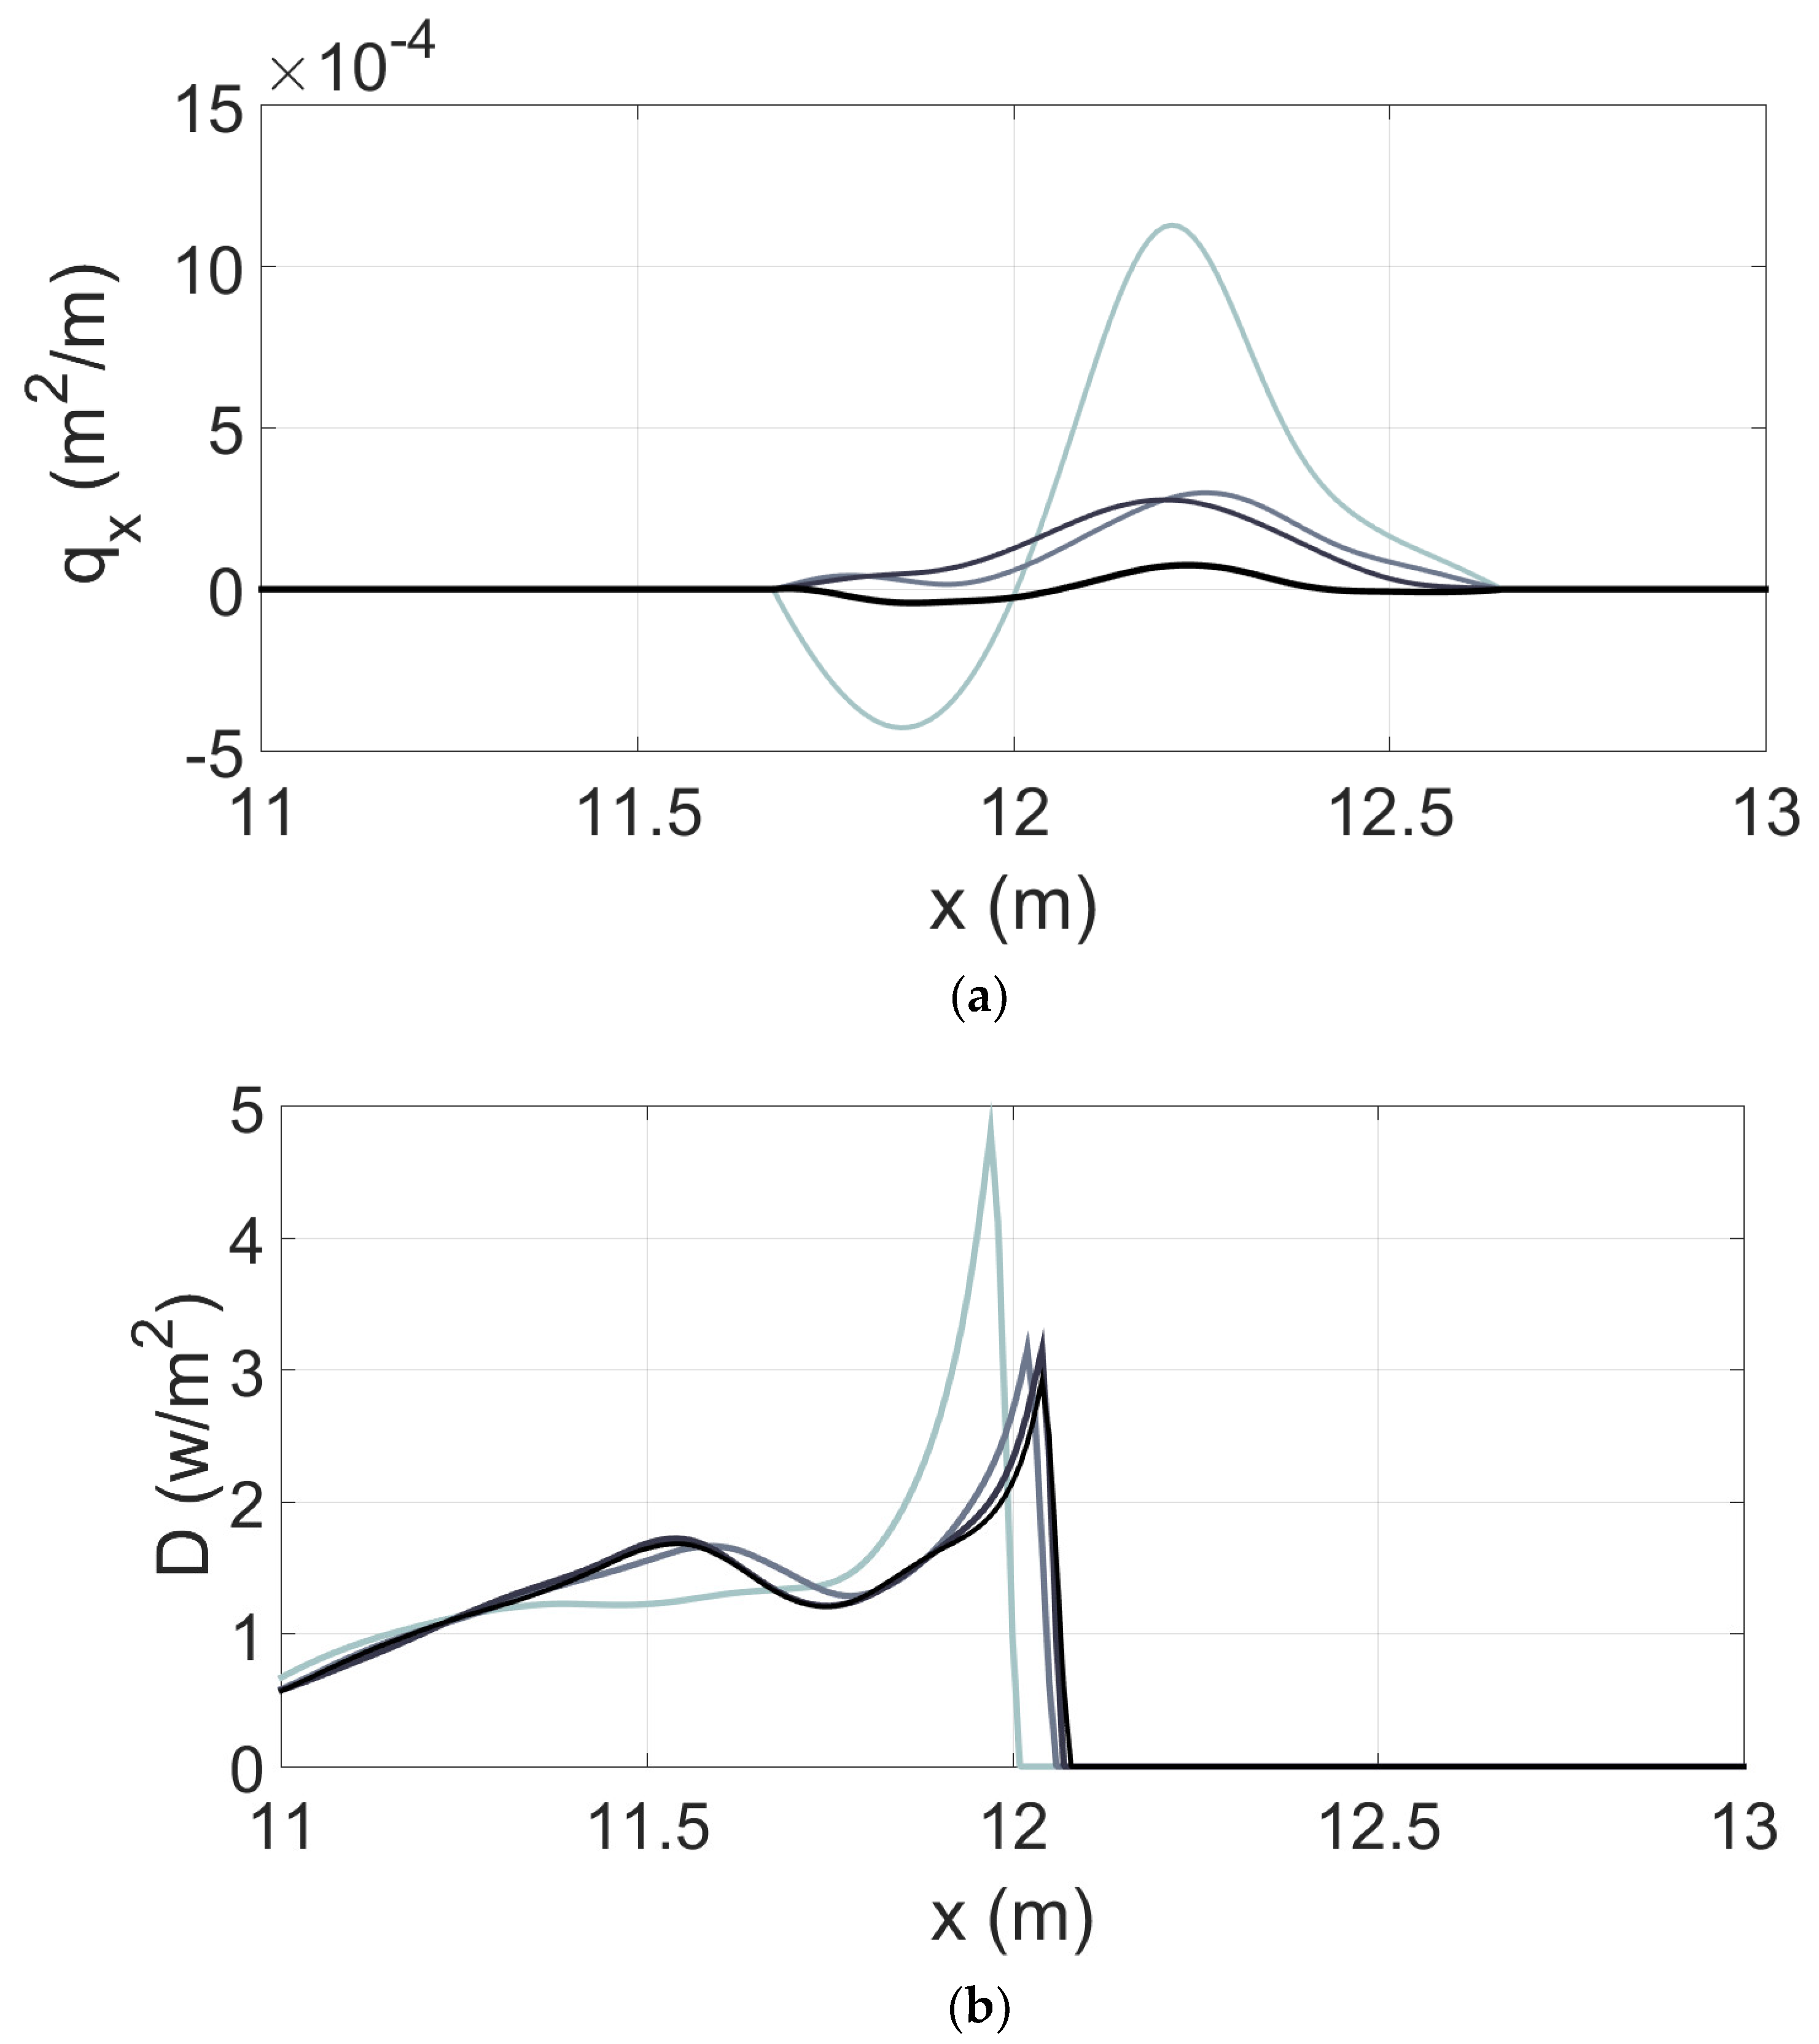
A similar set of results for an example of an accretive beach, case B, is illustrated in Figure 10. In this case, a pre-existing beach berm (at an equilibrium condition that was reached with smaller waves of the same period) is transported higher on the beach face by larger accretionary wave conditions. Figure 11a,b illustrate the corresponding local sediment transport and dissipation from the surf zone model. In this case, it is clear the two maxima are less well correlated. The transport maximum occurs close to the crest of the berm, where sequential profiles cross, but the surf zone model produces maximum dissipation near the SWL for accretionary waves. The surf zone dissipation model does not have a swash zone function and the wave height tends to zero as the mean depth becomes zero. A small setup correction (approximately 0.1 Hb) would not shift the location of the dissipation peak significantly for these wave conditions, only about 0.04 m. Therefore, in this case the model concept is less robust than for erosive conditions.
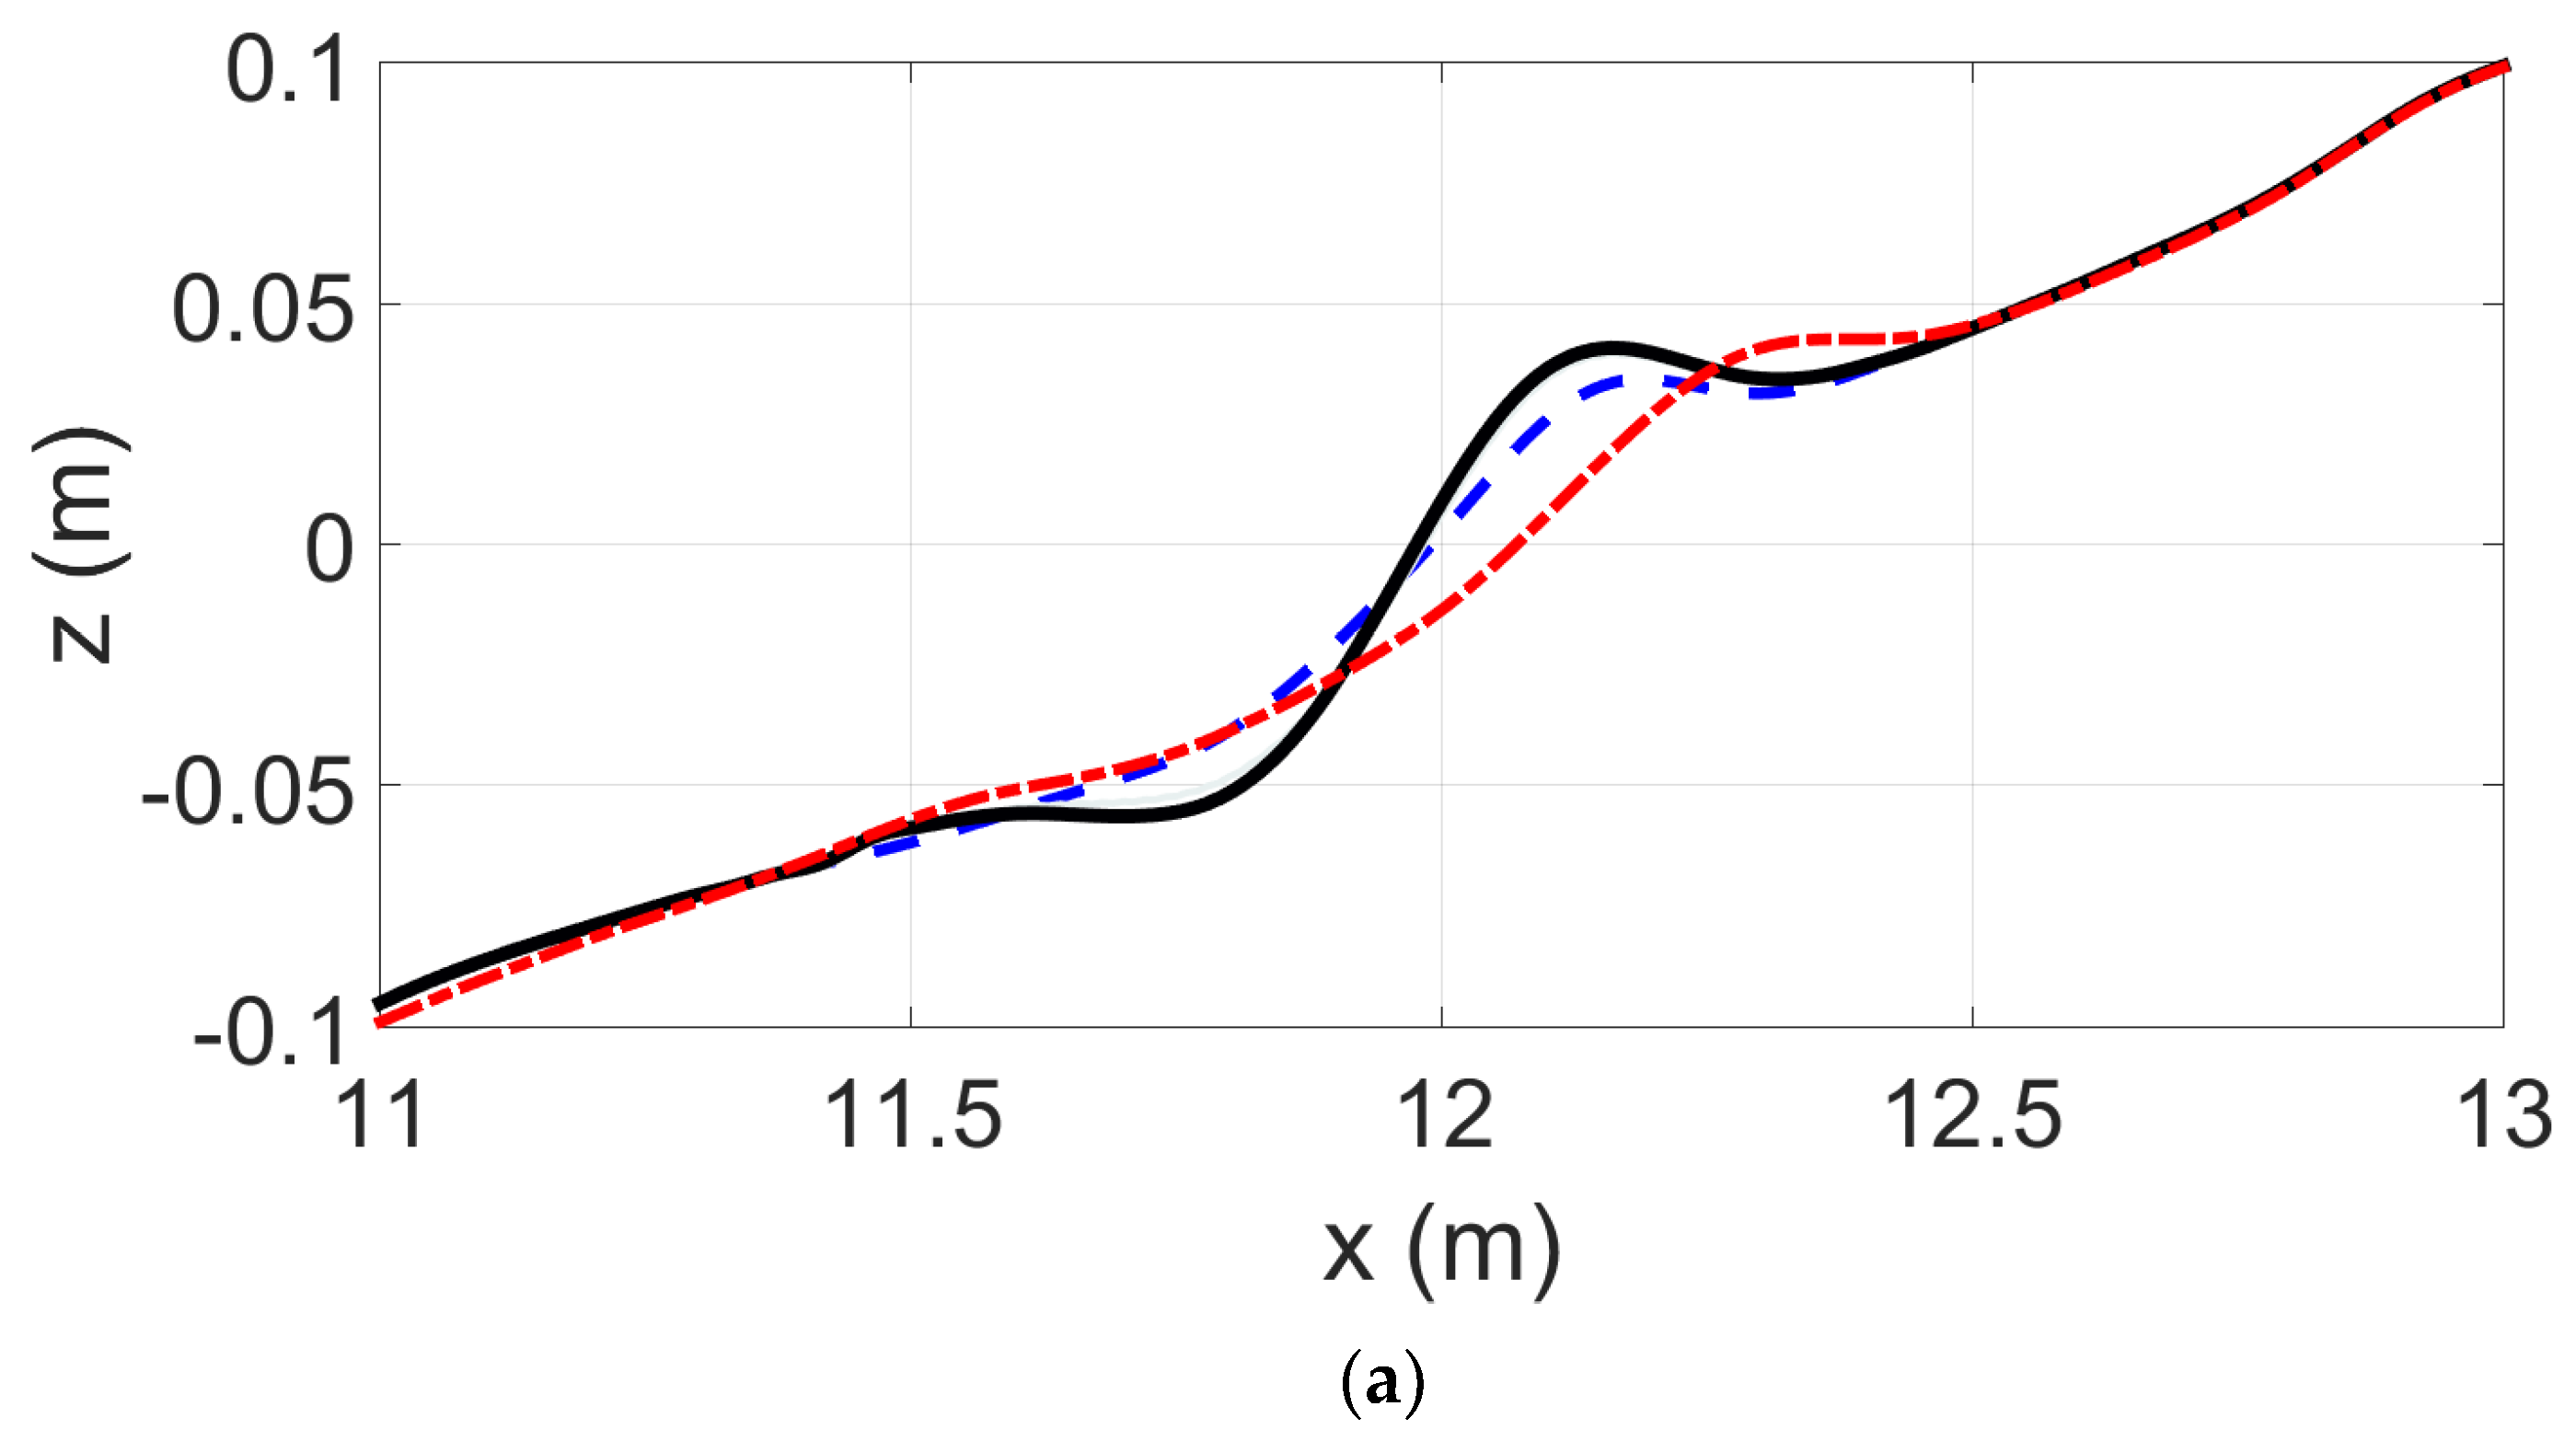
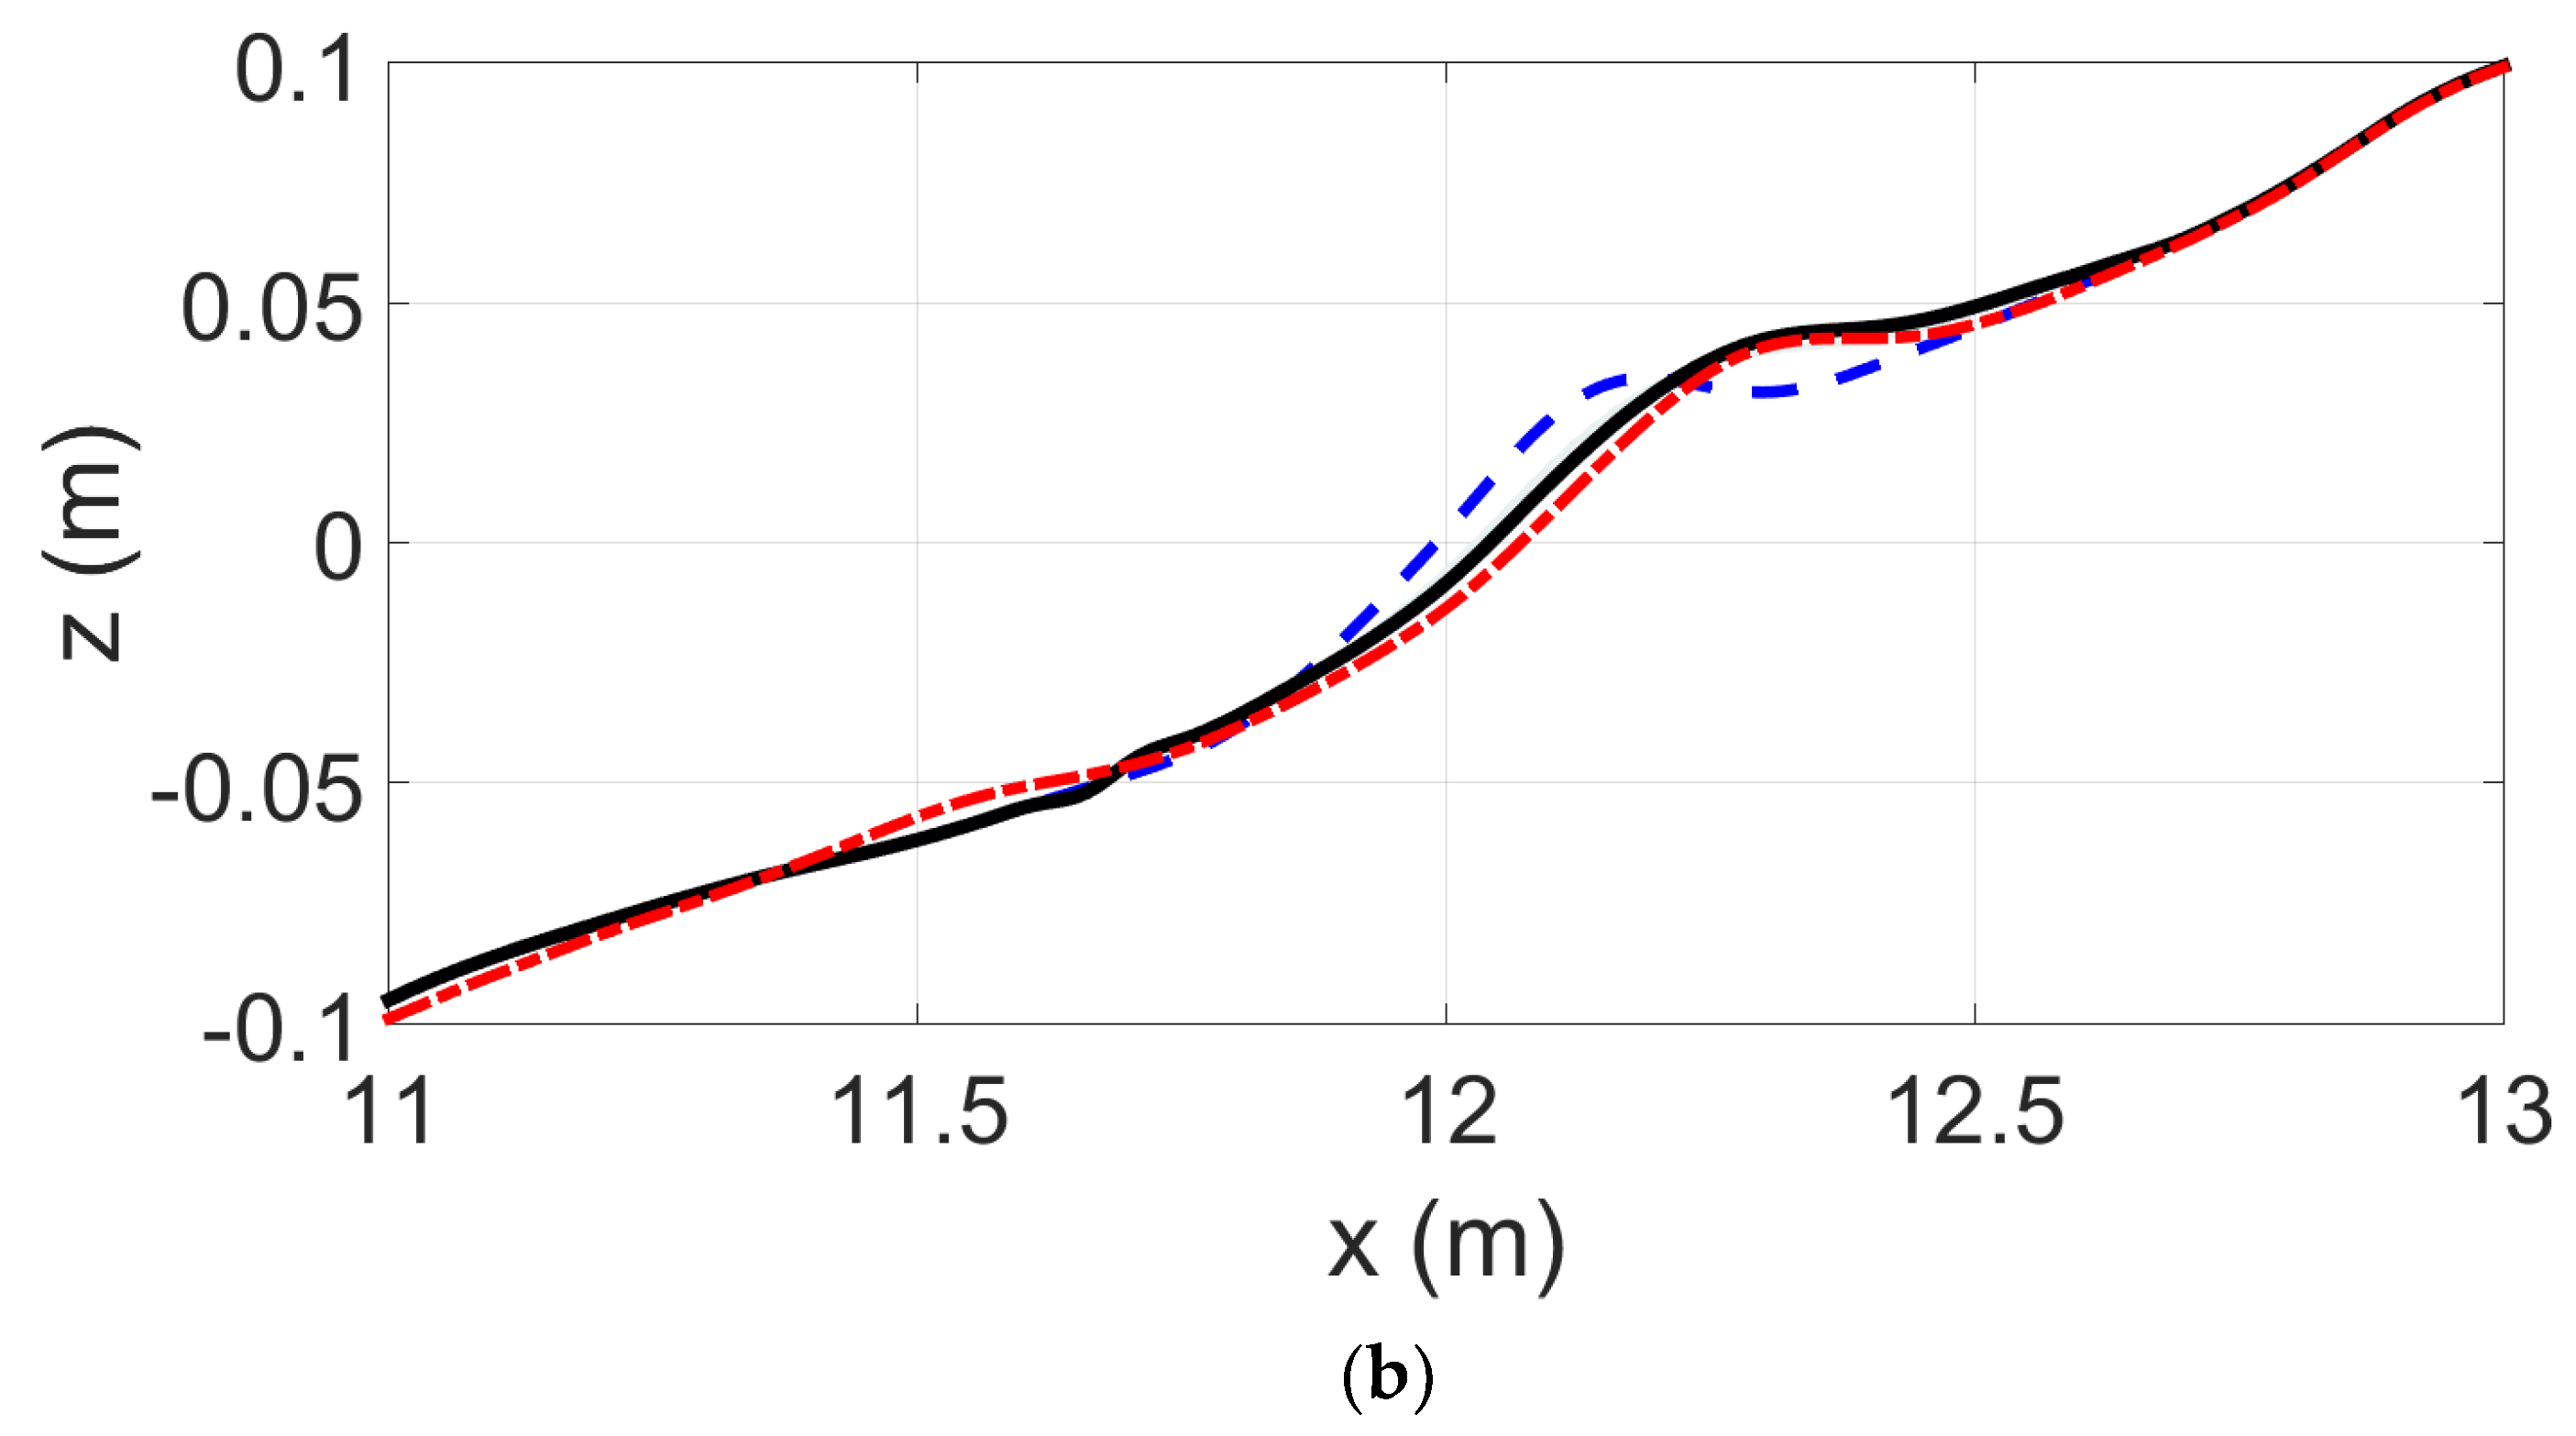
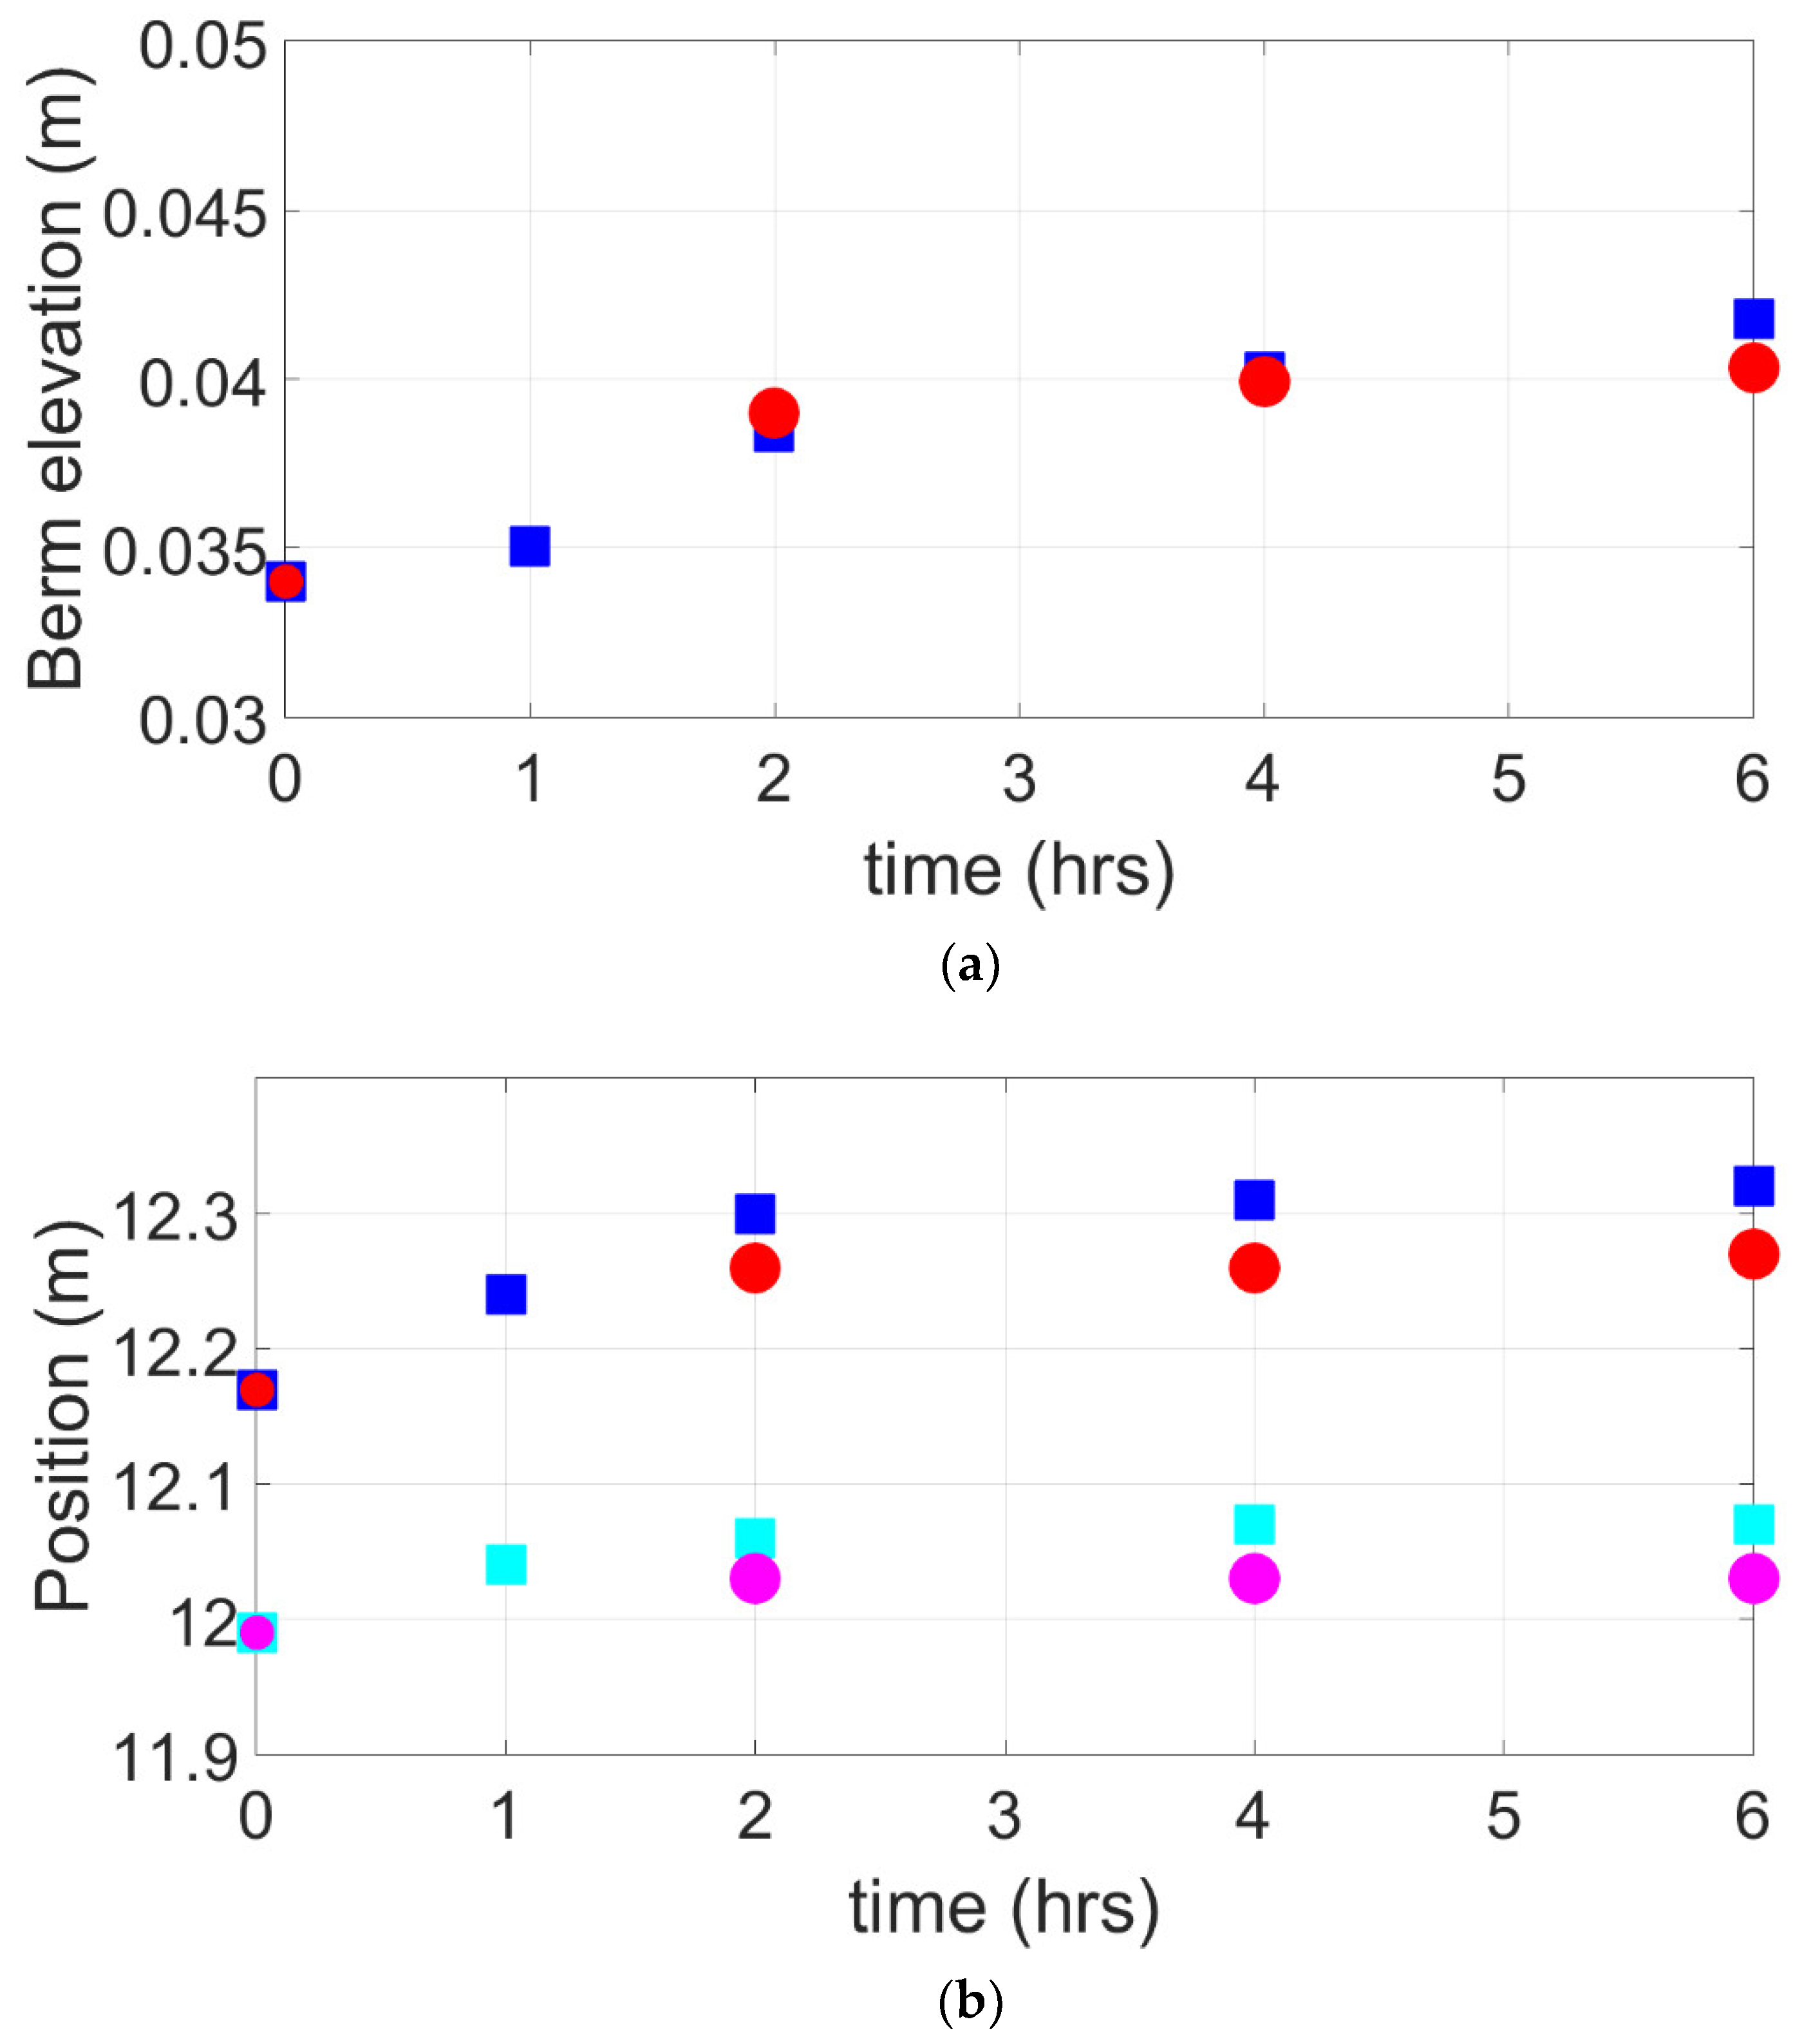
To account for this issue here, a constant shift is applied to the match the location of the maxima in dissipation and maxima in transport rates (Figure 11a,b), in this case a shift of 0.18 m. Without this shift, the total transport (Figure 12b) and the berm crest elevation are still modelled well, but the location is wrong. Figure 13a,b compares the model results with and without the added shift. This comparison illustrates that the model with the ad hoc shift provides a very good match to the data (Figure 14), and the profile is both translated and has a different shape with and without the shift. Nevertheless, the linking between the dissipation and the local transport still provides the feedback that allows the profile to adjust dynamically over time. Errors in selected profile features are given in Table 3. The estimated model skill is BSS = 1 − (0.0046)2/(0.0075)2 = 0.62, which is considerably lower than for the erosive conditions, but still fair.

4. Discussion

To our knowledge, this is the first equilibrium type beach profile model with dynamic feedback between the hydrodynamics and the morphology. The present paper seeks to illustrate the underlying concepts, but it is acknowledged that further testing with other data sets will be required. The concept that the maximum local transport is co-located with the peak dissipation rate in the surf zone appears robust for erosive conditions with an active breaker bar and provides a robust method to incorporate the hydrodynamic-morphodynamic feedback. This concept might be useful in other sediment transport modelling and can be readily further tested with other existing laboratory beach profile data. However, this concept requires refinement for accretive beach profiles and may require a separate parameterisation of the dissipation that includes the swash zone. One option could be to link the shoreline position with the peak in dissipation, which is the condition indicated in Figure 11. However, this may not necessarily provide a reliable feedback mechanism, since the beach profile often pivots about a position close to the surf-swash boundary, rather than translating [17]. This option will be explored in future work using a larger dataset. A further option is the inclusion of varying water levels (e.g., tide). In the first instance the same normalised functions could be used, and translated across the profile, with the beach profile changes outside of the local footprint of the transport function kept constant. However, different local sediment transport patterns could be expected at different tidal stages (e.g., nearshore waves are often smaller at low tides as a result of greater dissipation over the bar), so this approach may fail. Little high resolution data exists in this respect.
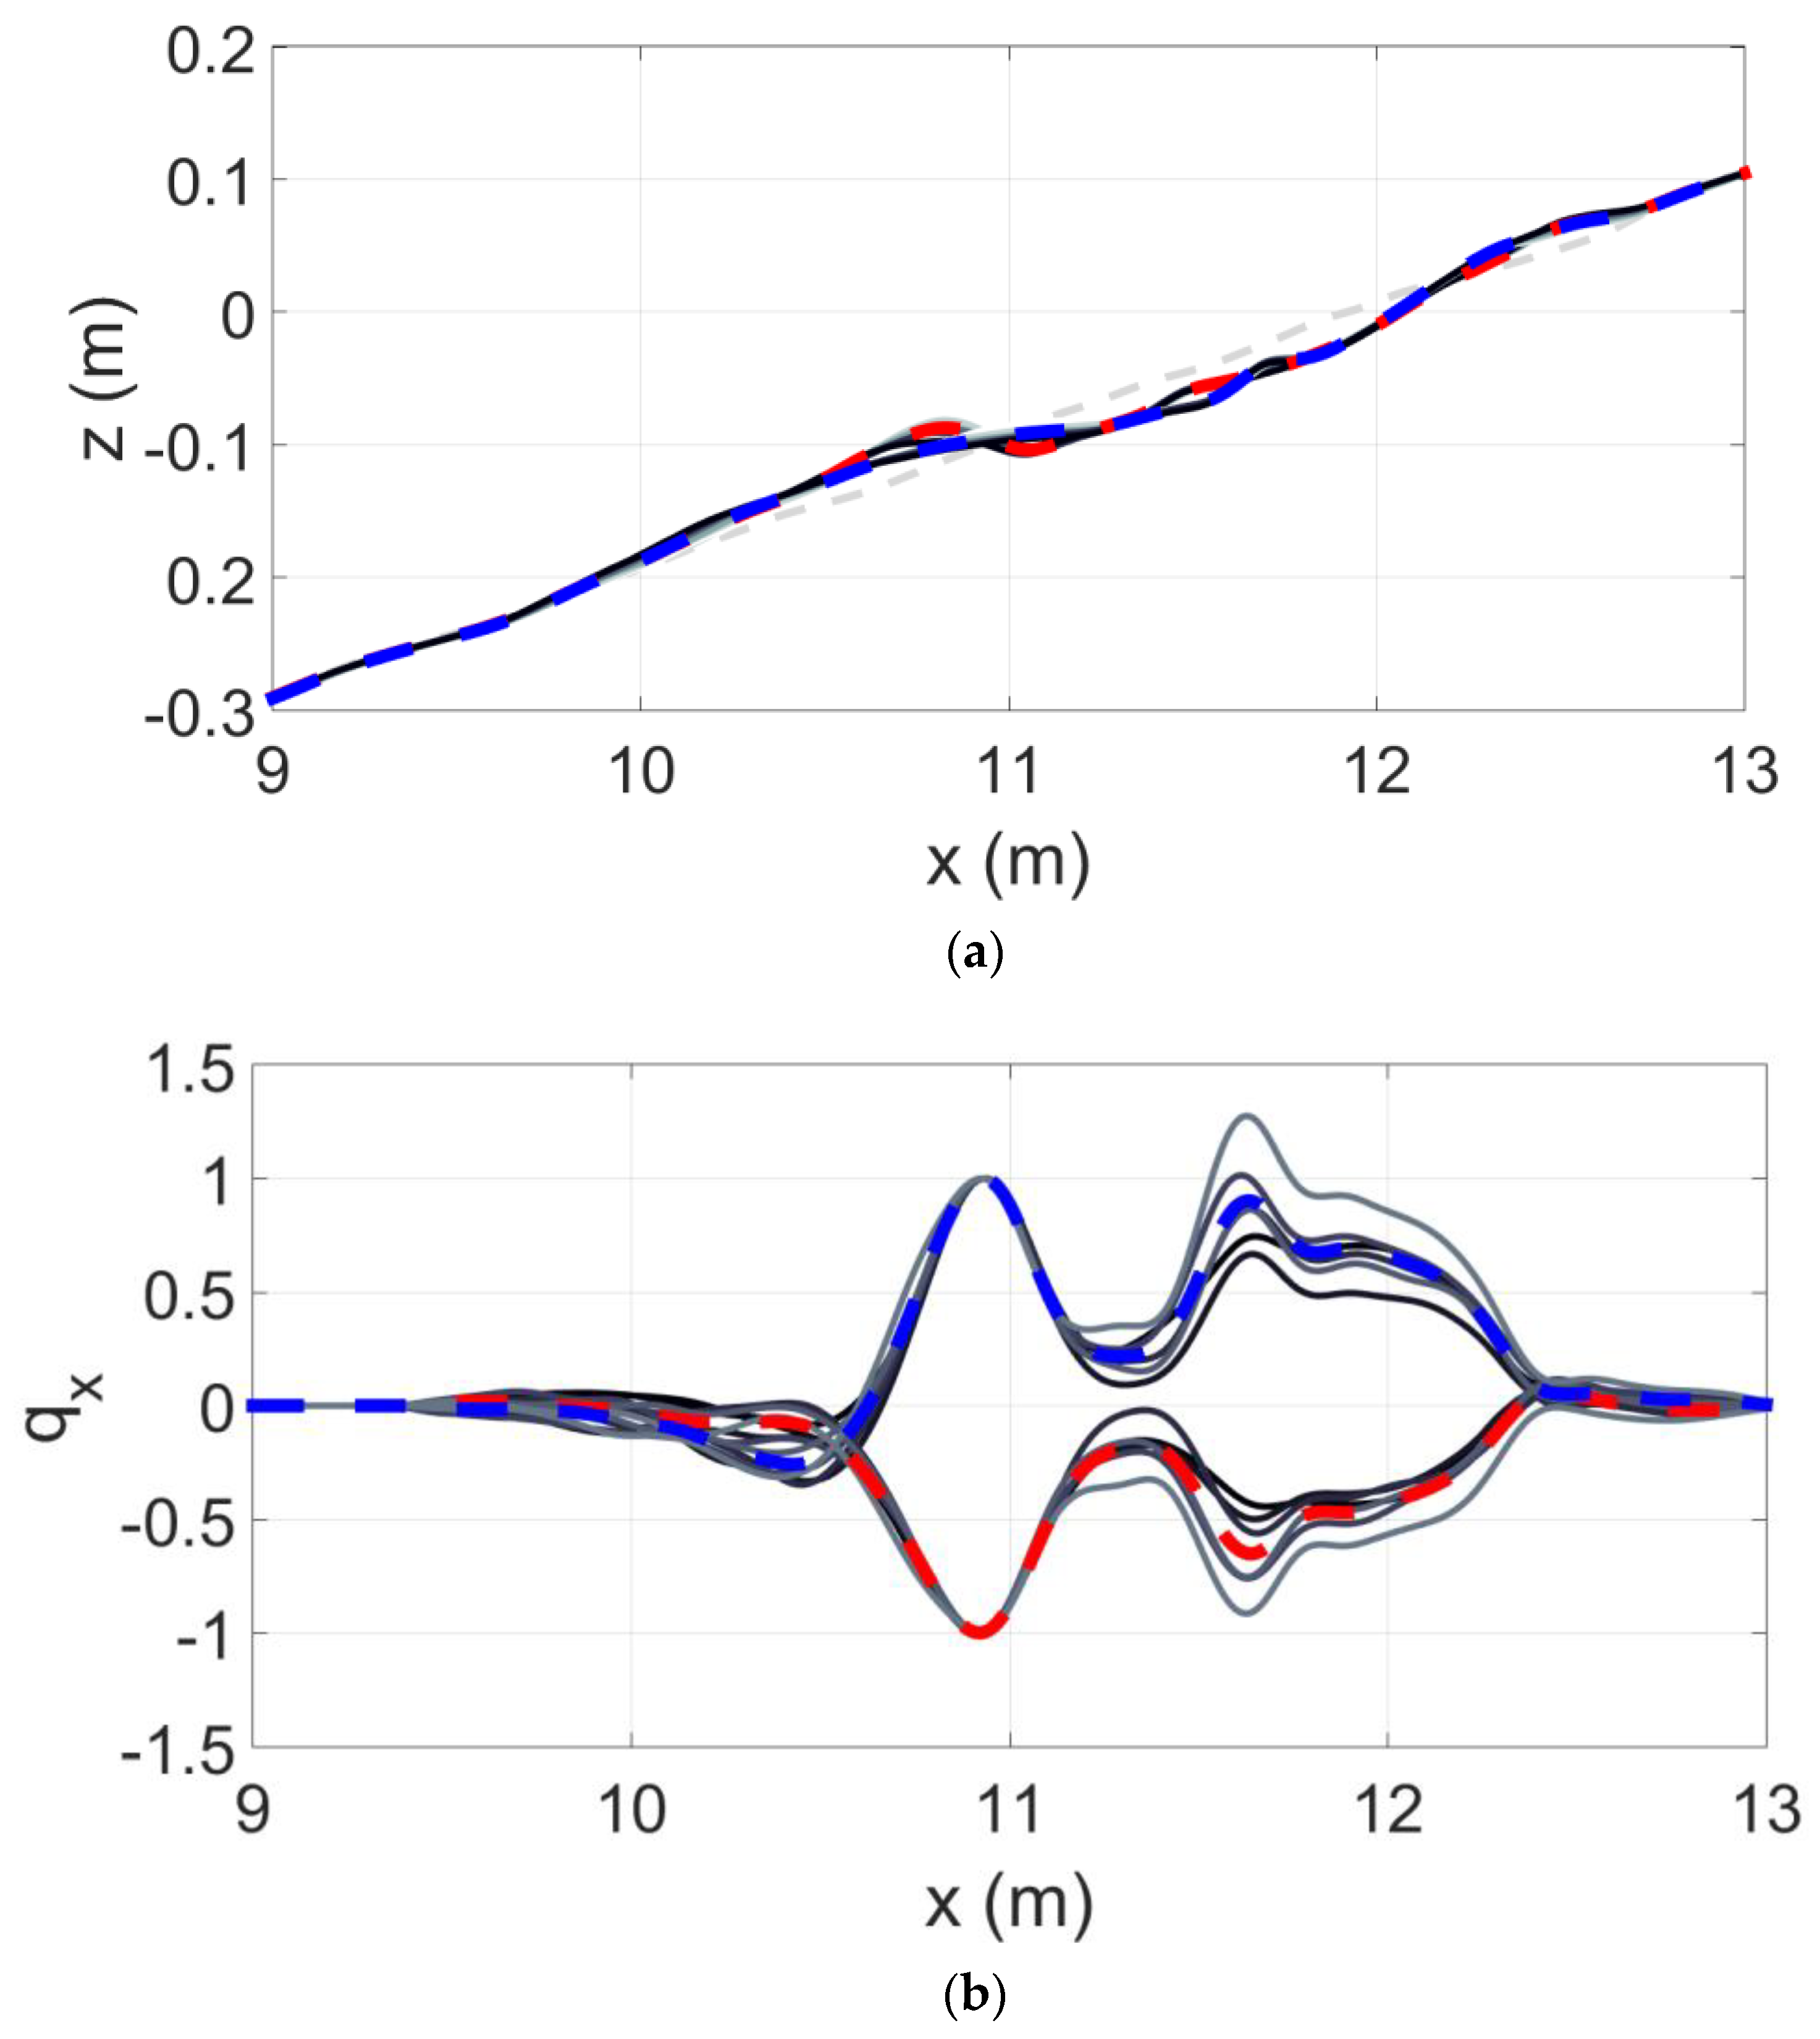
Despite the lower correlation between the peak of the dissipation and the maximum local transport for the accretive case illustrated here, beach erosion and recovery can still be simulated with the current approach if an active bar is maintained in the profile. Birrien et al. [8] demonstrated they could simulate cyclical offshore and onshore net bulk sediment transport with a Q-Ω equilibrium model during the cyclical onshore and offshore motion of a breaker bar under a repeating sequence of erosive and accretionary waves (see Figure 15a). In such a process, the onshore and offshore transport are approximately mirror images of each other (Figure 15b). Therefore, to cycle between the initial and final profiles in Figure 15a (or in Figure 8 for example) simply requires mirroring the erosive sediment transport function (or vice versa). Provided that the surf zone model generates a peak in the dissipation at the main active breaker bar, which in this case it does, the dynamic feedback will continue to work. This requires that the breaker bar remains active and is not stranded, i.e., the morphological hysteresis that can occur due to a change in wave conditions [11] does not in fact occur.
To apply the model in the field, the key requirement is a set of beach profiles from different erosion and recovery conditions, from which representative cross-shore local sediment transport functions can be derived and normalised between the run-up limit and the depth of closure. It is anticipated that a set of three transport functions would be required, one for barred profile evolution (similar to erosive case A), one for bermed profile development (similar to accretion case B), and a hybrid transport pattern that represents simultaneous generation of a berm and a bar (see e.g., Figures 8 and 9 in Baldock et al. [12]). However, such calculations will include profile changes from longshore sediment transport gradients, which must be estimated and removed. A method to do this is given in Atkinson et al. [18]. Alternatively, synthetic local sediment transport functions can be estimated from the observations. Baldock et al. [19] chose an alternate probabilistic approach to model the swash zone beach profile evolution, using calculated sediment transport rates and the difference between the local beach slope and a user-defined global equilibrium beach slope in the swash zone to factor the transport rates. Such an approach could also be included in the present model. These refinements will be considered in a later paper.

5. Conclusions

An equilibrium beach profile model has been developed and coupled with a parametric hydrodynamic model to provide feedback between the evolving morphology and the hydrodynamics. The coupling is achieved through linking the location of the maximum in the surf zone energy dissipation and the maximum transport rate. Data from physical model experiments show that this is a robust concept for an eroding beach with an active bar. The dissipation predicted by the surf zone model controls the cross-shore position of the maxima in the sediment transport functions and hence the cross-shore evolution of the beach profile. Realistic beach profile shapes are generated for both erosive (barred) and accretive (bermed) beach profiles, since they are derived from data, and predictions of bar and berm position are satisfactory. The model concept is not so well associated with accretive wave conditions and further work is required to improve the link between the modelled dissipation and the local transport for these conditions. A model for including dissipation in the swash zone, or adaptions to the surf zone models to correct for the rapid dissipation near the shore as the depth tends to zero, might provide a further improvement for accretionary conditions.

Author Contributions

Conceptualization, F.B. and T.B.; methodology, F.B. and T.B.; software, F.B.; validation, F.B.; formal analysis, F.B. and T.B.; investigation, F.B. and T.B.; resources, T.B.; data curation, F.B.; writing—original draft preparation, F.B. and T.B.; writing—review and editing, T.B.; supervision, T.B.; project administration, T.B.; funding acquisition, T.B. All authors have read and agreed to the published version of the manuscript.

Funding

This research was supported by the Australian Research Council grant DP14101302.

Informed Consent Statement

Not applicable.

Data Availability Statement

The data presented in this study are available on request from the corresponding author.

Acknowledgments

Alex Atkinson and Tomoko Shimamoto contributed to the data collected and published in Baldock et al. (2017) and Birrien et al. (2018), which is used again here.

Conflicts of Interest

The authors declare no conflict of interest. The funders had no role in the design of the study; in the collection, analyses, or interpretation of data; in the writing of the manuscript, or in the decision to publish the results.

References

  1. Ruessink, B.G.; Coco, G.; Ranasinghe, R.; Turner, I.L. Coupled and noncoupled behavior of three-dimensional morphological patterns in a double sandbar system. J. Geophys. Res. Space Phys. 2007, 112, 7. [Google Scholar] [CrossRef]
  2. Yates, M.L.; Guza, R.T.; O’Reilly, W.C. Equilibrium shoreline response: Observations and modeling. J. Geophys. Res. Space Phys. 2009, 114, 16. [Google Scholar] [CrossRef] [Green Version]
  3. Van Der Meulen, T.; Gourlay, M.R. Beach and Dune Erosion Tests; American Society of Civil Engineers (ASCE): New York, NY, USA, 1969. [Google Scholar]
  4. Wright, L.; Short, A.; Green, M. Short-term changes in the morphodynamic states of beaches and surf zones: An empirical predictive model. Mar. Geol. 1985, 62, 339–364. [Google Scholar] [CrossRef]
  5. Davidson, M.A.; Turner, I.L.; Guza, R. The effect of temporal wave averaging on the performance of an empirical shoreline evolution model. Coast. Eng. 2011, 58, 802–805. [Google Scholar] [CrossRef] [Green Version]
  6. Splinter, K.D.; Turner, I.L.; Davidson, M.A.; Barnard, P.L.; Castelle, B.; Oltman-Shay, J. A generalized equilibrium model for predicting daily to interannual shoreline response. J. Geophys. Res. Earth Surf. 2014, 119, 1936–1958. [Google Scholar] [CrossRef] [Green Version]
  7. Davidson, M.A.; Turner, I.L. A behavioral template beach profile model for predicting seasonal to interannual shoreline evolution. J. Geophys. Res. Space Phys. 2009, 114, 1. [Google Scholar] [CrossRef]
  8. Birrien, F.; Atkinson, A.; Shimamoto, T.; Baldock, T. Hysteresis in the evolution of beach profile parameters under sequences of wave climates—Part 2; Modelling. Coast. Eng. 2018, 133, 13–25. [Google Scholar] [CrossRef] [Green Version]
  9. Janssen, T.; Battjes, J. A note on wave energy dissipation over steep beaches. Coast. Eng. 2007, 54, 711–716. [Google Scholar] [CrossRef]
  10. Alsina, J.; Baldock, T. Improved representation of breaking wave energy dissipation in parametric wave transformation models. Coast. Eng. 2007, 54, 765–769. [Google Scholar] [CrossRef]
  11. Baldock, T.; Birrien, F.; Atkinson, A.; Shimamoto, T.; Wu, S.; Callaghan, D.; Nielsen, P. Morphological hysteresis in the evolution of beach profiles under sequences of wave climates—Part 1; observations. Coast. Eng. 2017, 128, 92–105. [Google Scholar] [CrossRef] [Green Version]
  12. Baldock, T.; Alsina, J.; Caceres, I.; Vicinanza, D.; Contestabile, P.; Power, H.; Sanchezarcilla, A. Large-scale experiments on beach profile evolution and surf and swash zone sediment transport induced by long waves, wave groups and random waves. Coast. Eng. 2011, 58, 214–227. [Google Scholar] [CrossRef]
  13. Jacobsen, N.G.; Fredsoe, J. Formation and development of a breaker bar under regular waves. Part 2: Sediment transport and morphology. Coast. Eng. 2014, 88, 55–68. [Google Scholar] [CrossRef]
  14. Bayle, P.M.; Beuzen, T.; Blenkinsopp, C.E.; Baldock, T.E.; Turner, I.L. A new approach for scaling beach profile evolution and sediment transport rates in distorted laboratory models. Coast. Eng. 2021, 163, 103794. [Google Scholar] [CrossRef]
  15. Patterson, D.C. Modelling as an Aid to Understand the Evolution of Australia’s Central East Coast in Response to Late Pleistocene-Holocene and Future Sea Level Change. Ph.D. Thesis, The University of Queensland, St Lucia, QLD, Australia, 2013. [Google Scholar]
  16. Brier, G.W. Verification of forecasts expressed in terms of probability. Mon. Weather. Rev. 1950, 78, 1–3. [Google Scholar] [CrossRef]
  17. Weir, F.M.; Hughes, M.G.; Baldock, T.E. Beach face and berm morphodynamics fronting a coastal lagoon. Geomorphology 2006, 82, 331–346. [Google Scholar] [CrossRef]
  18. Atkinson, A.L.; Baldock, T.E.; Birrien, F.; Callaghan, D.P.; Nielsen, P.; Beuzen, T.; Turner, I.L.; Blenkinsopp, C.E.; Ranasinghe, R. Laboratory investigation of the Bruun Rule and beach response to sea level rise. Coast. Eng. 2018, 136, 183–202. [Google Scholar] [CrossRef]
  19. Baldock, T.E.; Son, P.K.; Manoonvoravong, P.; Barnes, M.P.; Alsina, J.M. Probabilistic-Deterministic Modelling of Swash Zone Morphology. Coast. Sediments ‘07 2007, 272–285. [Google Scholar] [CrossRef]
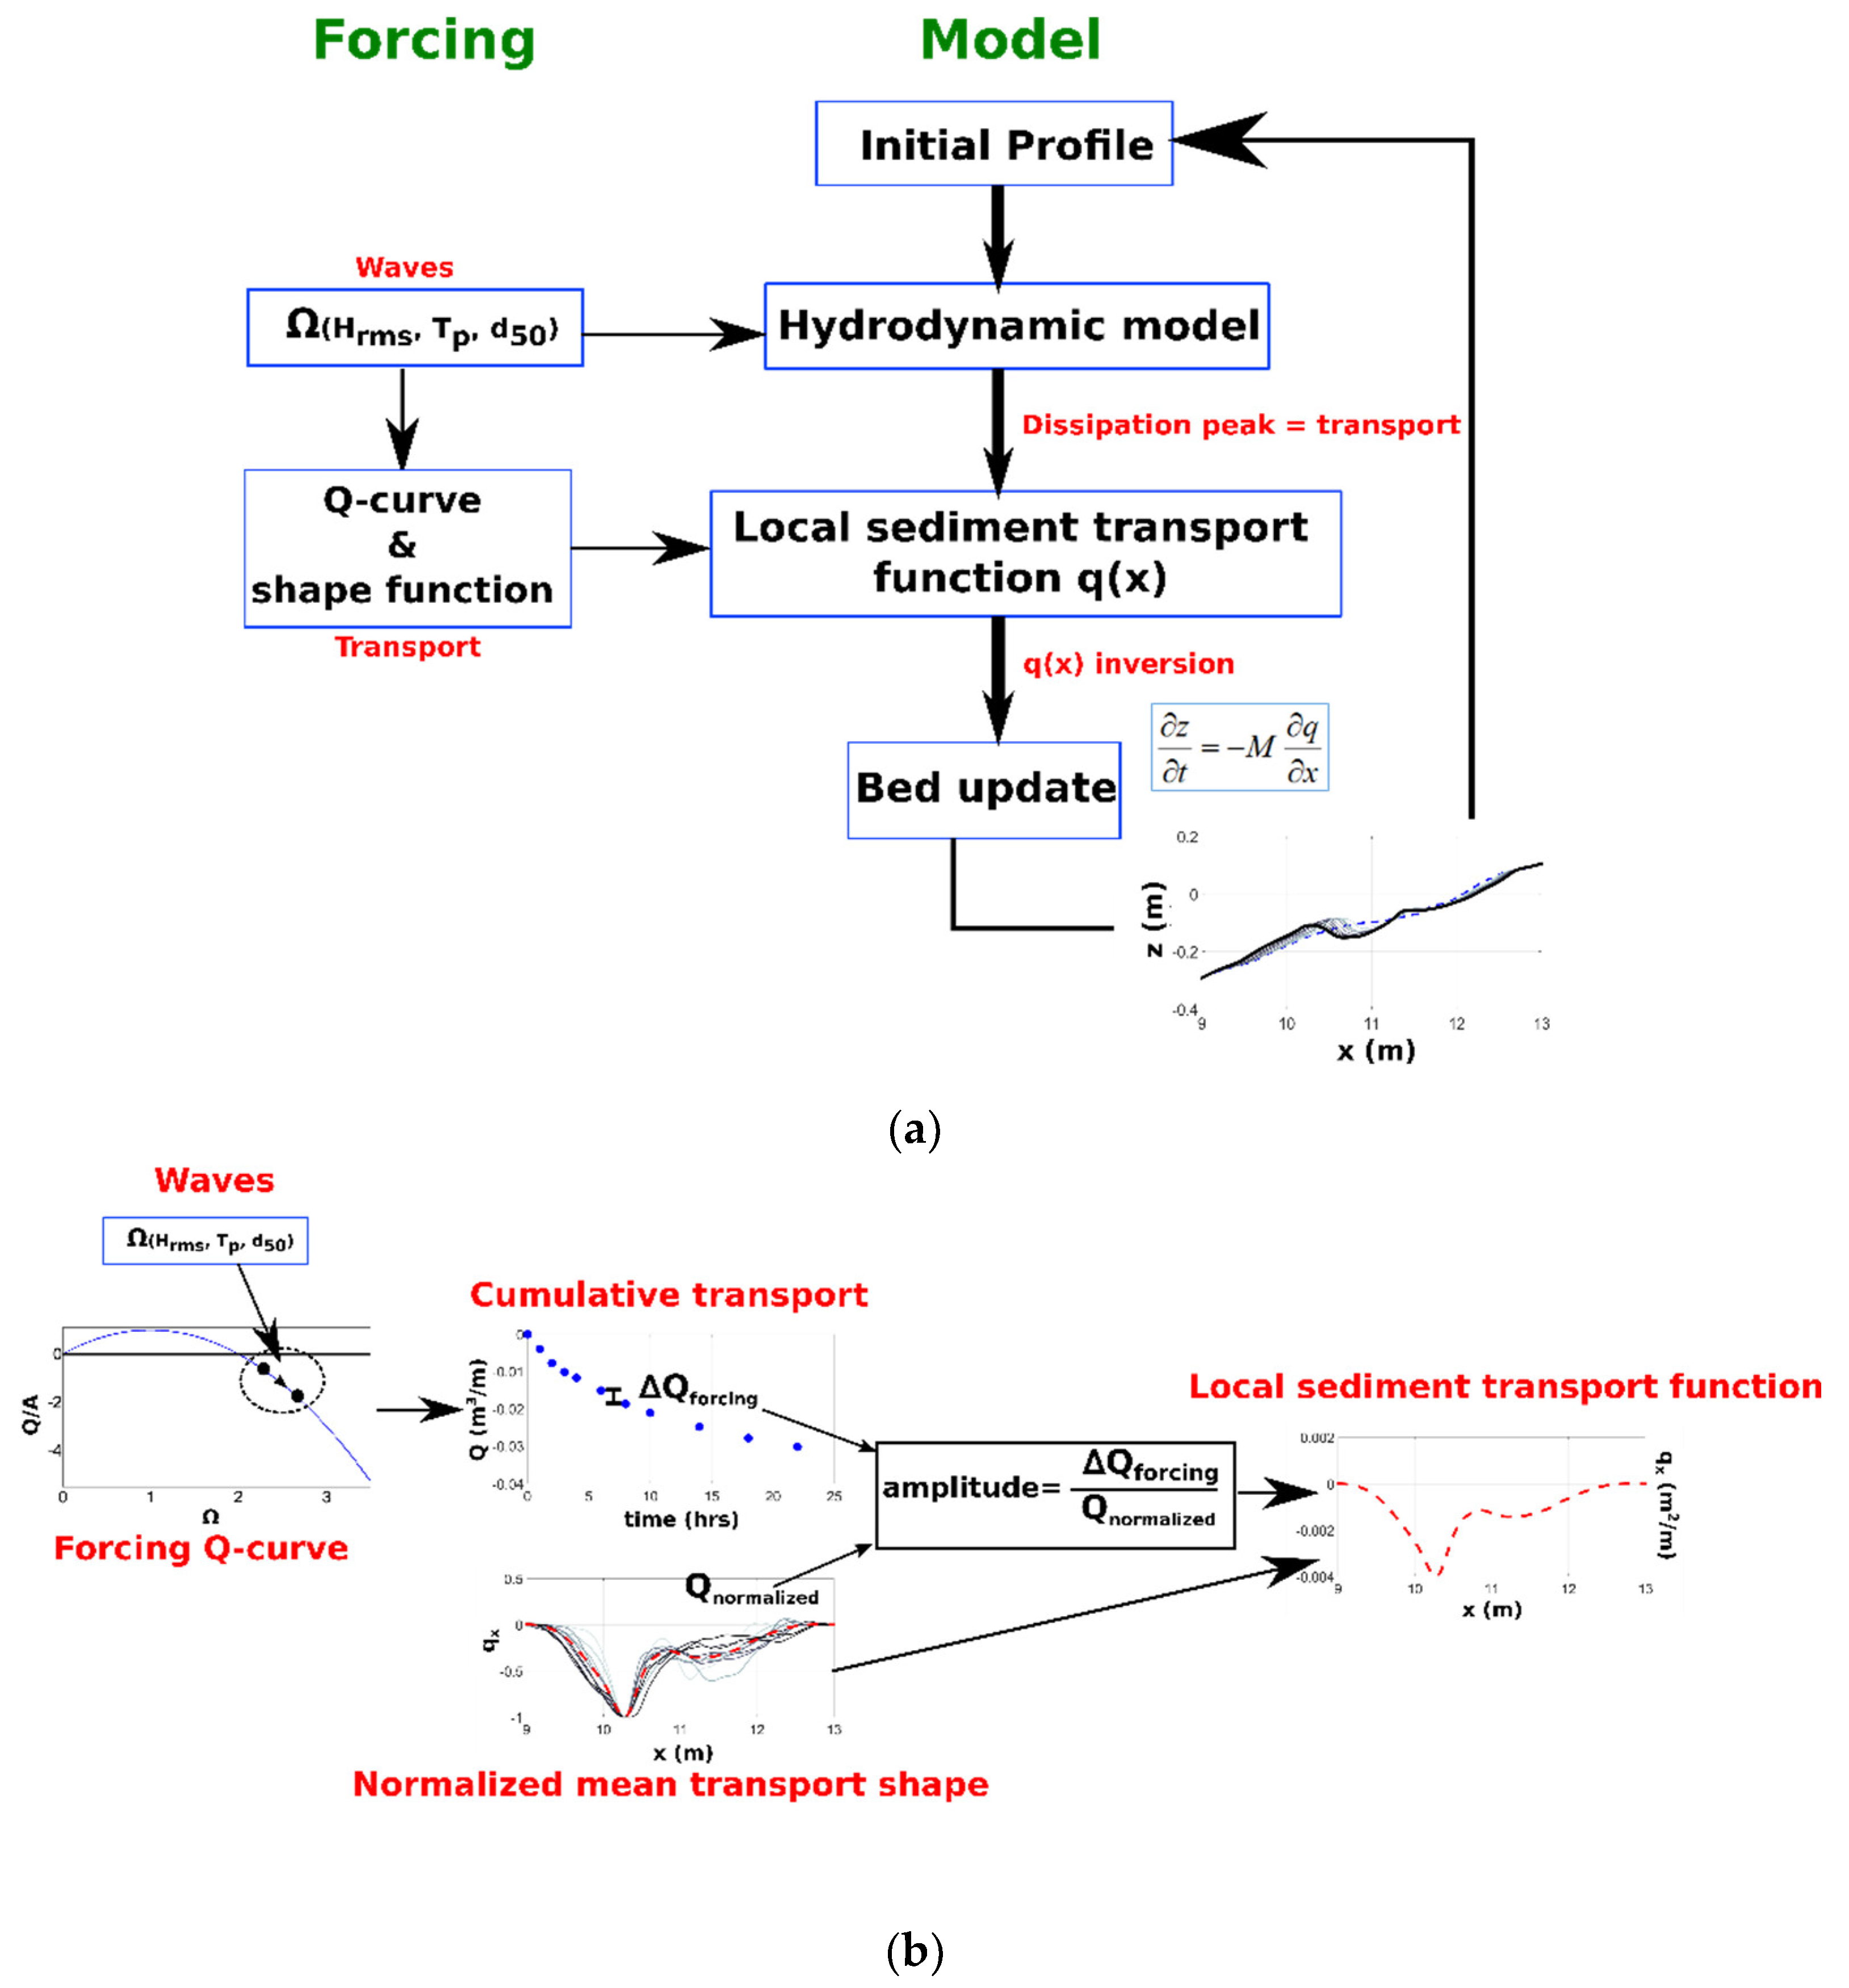
Figure 1. Model steps (a) and calculation of the local sediment transport (b).
Jmse 09 00353 g001
Figure 2. Profile evolution for the erosive wave case A. Initial (dashed blue), intermediate (thin grey) and final at t = 22 h (thick black) profiles. Note that small-scale sand ripples that are not resolved by the transport calculations have been filtered out from the profiles.
Jmse 09 00353 g002
Figure 3. (a). Corresponding series of local sediment transport for Figure 2, in chronological order from light grey (start) to dark grey (finish). (b) Wave energy dissipation for the beach profiles presented in Figure 2, in chronological order from light grey (start) to dark grey (finish).
Jmse 09 00353 g003aJmse 09 00353 g003b
Figure 4. Comparison between the location of the (absolute) maxima in local sediment transport and the location of the peaks in wave energy dissipation. Colour code as above.
Jmse 09 00353 g004
Figure 5. Local sediment transport as presented in Figure 3a, centred and normalized according to the peak in transport, together with the mean transport pattern (dashed magenta line).
Jmse 09 00353 g005
Figure 6. Cumulative local sediment transport rate for the erosive waves conditions from the initial beach state, in chronological order from light grey (start) to dark grey (finish).
Jmse 09 00353 g006
Figure 7. Cumulative net bulk sediment transport, Q, versus time for data (dots) and equilibrium model. For modelling purposes, the transport Q is first fitted to the exponential-based law Qeq(1 − exp(−t/τ)), with Qeq = −0.03 m3/m and τ = 9 h, and discretised with dt = 2 h.
Jmse 09 00353 g007
Figure 8. Comparison between the modelled (thick black) and observed mean beach (dashed red line) profile when equilibrium is reached at t = 22 h. The initial (dashed blue) and intermediate modelled (thin grey, in different shades) profiles are also plotted at 2 h intervals.
Jmse 09 00353 g008
Figure 9. (a). Comparison between the cross-shore location of the modelled (dots) and observed (squares) shoreline (magenta vs. cyan) and main breaker bar (red vs. blue). (b). Comparison between the modelled (red dots) and observed (blue squares) depth over the crest of the main breaker bar.
Jmse 09 00353 g009
Figure 10. Profile evolution for the accretive wave case B. Initial (dashed blue), intermediate (thin grey) and final at t = 6 h (thick black) profiles. Note that small-scale sand ripples that are not resolved by the transport calculations have been filtered out from the profiles.
Jmse 09 00353 g010
Figure 11. (a). Corresponding series of local sediment transport for Figure 10, in chronological order from light grey (start) to dark grey (finish). (b). Wave energy dissipation for the beach profiles presented in Figure 10, in chronological order from light grey (start) to dark grey (finish).
Jmse 09 00353 g011
Figure 12. (a). Local sediment transport as presented in Figure 11a, centred and normalized according to the peak in transport, together with the mean transport pattern (dashed magenta line). (b) Cumulative net bulk sediment transport, Q, versus time for data (dots) and equilibrium model. For modelling purposes, the transport Q is first fitted to the exponential-based law Qeq(1 − exp(−t/τ)), with Qeq = 5.10−4 m3/m and τ = 1.54 h, and discretised with dt = 2 h.
Jmse 09 00353 g012
Figure 13. Comparison between the modelled (thick black) and observed mean beach (dashed red line) profile when equilibrium is reached at t = 6 h. Original formulation (top panel, (a)) and with shift in the location of the transport maxima (bottom panel, (b)).
Jmse 09 00353 g013aJmse 09 00353 g013b
Figure 14. (a). Comparison between the modelled (red dots) and observed (blue squares) berm crest elevations. (b). Comparison between the modelled (dots) and observed (squares) shoreline (magenta vs. cyan) and berm crest positions (red vs. blue) positions.
Jmse 09 00353 g014
Figure 15. (a) Profile evolution (sequential beach profiles) for a cyclic wave climate, Case C, with initial (dashed blue), intermediate (thin grey) and final (thick black) profiles. The bar moves on and offshore as a result of wave height changes in a repeated cycle. (b) Local sediment transport centered and normalized according to the peak in transport at the active breaker bar, together with the mean transport patterns (dashed red and blue lines).
Jmse 09 00353 g015
Table 1. Modelled wave conditions.
CaseWave Height, Hrms (m)Wave Period, Tp (s)
Case A, erosive0.11
Case B, accretive0.041
Case C, cyclic0.04, 0.11
Table 2. Root mean square error between the final observed and modelled beach profile and between the observed and modelled beach features for all profiles for the erosive case A. Errors are calculated within the active transport zone (i.e., from depth of closure to the run up limit for the erosive wave conditions).
Compared FeatureRMSE (cm)
Modelled vs. observed profiles0.75
Observed (initial vs. final) profiles2.21
Shoreline position5.16
Sandbar position2.4
Sandbar depth to crest0.69
Table 3. Root mean square error between the final observed and modelled beach profile and between the observed and modelled beach features for all profiles for the accretive case B. Errors are calculated within the active transport zone (i.e., from depth of closure to the run up limit for the erosive wave conditions).
Compared FeatureRMSE (cm)
Modelled vs. observed profiles0.46
Observed (initial vs. final) profiles0.75
Shoreline position3.7
Sandbar position4.69
Sandbar depth to crest0.22
Publisher’s Note: MDPI stays neutral with regard to jurisdictional claims in published maps and institutional affiliations.