Abstract
On mixed sand–gravel beaches, impacts from gravel- and cobble-sized grains—mobilized by the energetic shorebreak—limit the utility of in situ instrumentation for measuring the small-scale response of the beach face on wave period time scales. We present field observations of swash zone morpho-sedimentary dynamics at a steep, megatidal mixed sand–gravel beach using aeroacoustic and optical remote sensing. Coincident observations of bed level and mean surficial sediment grain size in the swash zone were obtained using an array of optical cameras paired with acoustic range sensors. Lagrangian tracking of swash-transported cobbles was carried out using an additional downward-oriented camera. The principal objective of the study was to investigate linkages between sediment grain size dynamics and swash zone morphological change. In general, data from the range sensor and camera array show that increases in bed level corresponded to increases in mean grain size. Finer-scale structures in the bed level and mean grain size signals were observable over timescales of minutes, including signatures of bands of coarse-grained material that migrated shoreward with the leading edge of the swash prior to high tide berm formation. The direction and magnitude of cobble transport in the swash varied with cross-shore position, and with the composition of the underlying bed. These results demonstrate that close-range remote sensing techniques can provide valuable insights into the roles of cobble-sized versus sand-sized particle dynamics in the swash zone on mixed sand–gravel beaches.
1. Introduction
Inter-relationships between bed level change and sediment properties in the swash zone are difficult to establish due to the challenges inherent in obtaining observations of bed level and sediments on the time scale of the swash forcing. Applying novel in situ sensing techniques—based on multi-element conductivity insertion probes—has led to important advances in our understanding of swash zone sediment transport on sandy beaches [1,2]. However, such methods are not suitable for coarse-grained beaches, where the high velocity impacts from gravel- and cobble-sized grains mobilised by the energetic shorebreak pose a major hazard to instrumentation. Remote sensing methods provide a potential alternative. The recent application of remote sensing to the swash zone, including acoustic range sensors for observing bed level change [3] and image-based methods for estimating sediment grain size [4,5], has also advanced our understanding of sediment transport processes in the swash. However, previous efforts have been largely limited to pure sand or gravel beach types, with mixed sand–gravel (MSG) beaches receiving much less attention.
The use of ultrasonic range sensors to obtain remote observations of bed level in the swash zone has provided insight into the dynamics of beach profile change. An important result borne of swash timescale bed level monitoring during the last 15 years is that of the inter-swash timescale of net bed level change, wherein a tendency toward a dynamic equilibrium profile (see [6]) is achieved via a balance between onshore and offshore sediment fluxes over many swash events [3,7,8,9,10]. This is contrary to the previously prevailing notion that beach face equilibrium is the result of a balance between individual uprush and downrush events (i.e., intra-swash timescales). The use of arrays of bed level sensors has allowed for more comprehensive investigations of volume change across the beach profile, including the swash zone, than was previously possible [8,10]. Studies of bed level change at swash or near-swash timescales on MSG beaches are rare: Kulkarni et al. [11] used a manual post-and-ruler surveying method to examine bed level change on a MSG beach at time intervals of minutes; Horn and Walton [7] used a similar post-and-ruler method to measure bed level every 10–25 s over a three hour period spanning high tide. They reported increases in bed elevation on the rising tide and decreases on the falling tide, with high frequency (i.e., one time step) bed level variations being nearly as large as the overall bed level change. No MSG beach studies exist, to the knowledge of the authors, that make use of ultrasonic bed level sensors to obtain sub-swash timescale observations of bed level and swash height.
Digital grain sizing methods enable the collection of grain size data non-intrusively with high temporal resolution. There are many automated methods for estimating a grain size distribution from optical imagery. Under the scheme proposed by Buscombe et al. [12], these methods can be broadly classified as ‘geometrical’ or ‘statistical’. Geometrical methods [13] employ image processing techniques (e.g., segmentation, thresholding) to identify major and minor axis lengths of individual grains. Statistical methods (e.g., [4,5,14]) make use of time series analysis techniques (e.g., autocorrelation and Fourier or wavelet transforms) in the space domain to characterise texture in the image without attention to individual grains. Recent statistical methods [5,12], which characterise the grain size distribution in terms of Fourier or wavelet derived power spectra, do not require calibration specific to a sediment population. Using wavelet transforms has the benefit of not requiring the input data to be stationary, making wavelet-based grain sizing methods more suitable for applications involving inhomogeneous or poorly sorted sediments [5].
Though digital imaging techniques have been applied widely across the geological sciences, few studies have applied such methods to the swash zone. The only study to do so that the authors are aware of is that of Austin and Buscombe [15], who applied the Rubin [4] method to images captured in the subaerial swash zone of a meso-macrotidal gravel beach. Austin and Buscombe [15] used mean grain size data, collected at a minimum of 5 min sampling intervals from both subaerial digital imagery and subaqueous physical samples to compare with bed level change from a manual, in situ surveying method. The extent to which the image-derived grain size data were used in their analysis is unclear. Theirs is also the only study the authors are aware of in the gravel beach literature which includes simultaneous observations of bed level and sediment properties in the swash zone. Their cross-shore bed level and sediment sampling transects were separated by 2 m alongshore. Austin and Buscombe [15] observed that temporal changes in the grain size signal at several locations on the beachface were related to the morphological response: sediment coarsening being associated with accretion at the berm and step crest, and fining associated with accretion seaward of the step. They note, however, that distinct phases of the observed morphological change were not generally reflected in the grain size signal.
Lagrangian tracers have a long history of use for characterising sediment dynamics on beaches. In the gravel beach literature, particle tagging with fluorescent paint [16,17,18], or radio frequency identification tags (RFID; [19,20,21,22,23,24,25,26,27]) has lead to improved characterisations of transport dynamics on tide-to-tide timescales. No studies, to the authors’ knowledge, have made use of cobble-sized tracers to investigate transport in the swash on runup timescales on a coarse-grained or MSG beach.
Here, results are presented from a field study at Advocate Beach, Nova Scotia. The study made use of collocated observations of bed level and swash height using ultrasonic range sensors, and mean surficial grain size using digital imagery in the swash zone, at subsecond to several seconds resolution. The digital imagery and observations of bed and swash level were both obtained using low-cost, commercially available sensing equipment. The observations are presented in the context of berm formation and evolution over two high-tide cycles. The objectives of this study are: (1) to investigate the coevolution of bed level and mean surficial grain size, seeking insight into the phenomenological role of grain size on swash zone morphological evolution, (2) to investigate the dynamics of individual particles in swash flows using video-based Lagrangian particle tracking, and (3) to assess the utility of low cost range sensing and video-based methods for quantifying bed level and mean grain size change in the swash zone.
2. Methods
2.1. Site Description
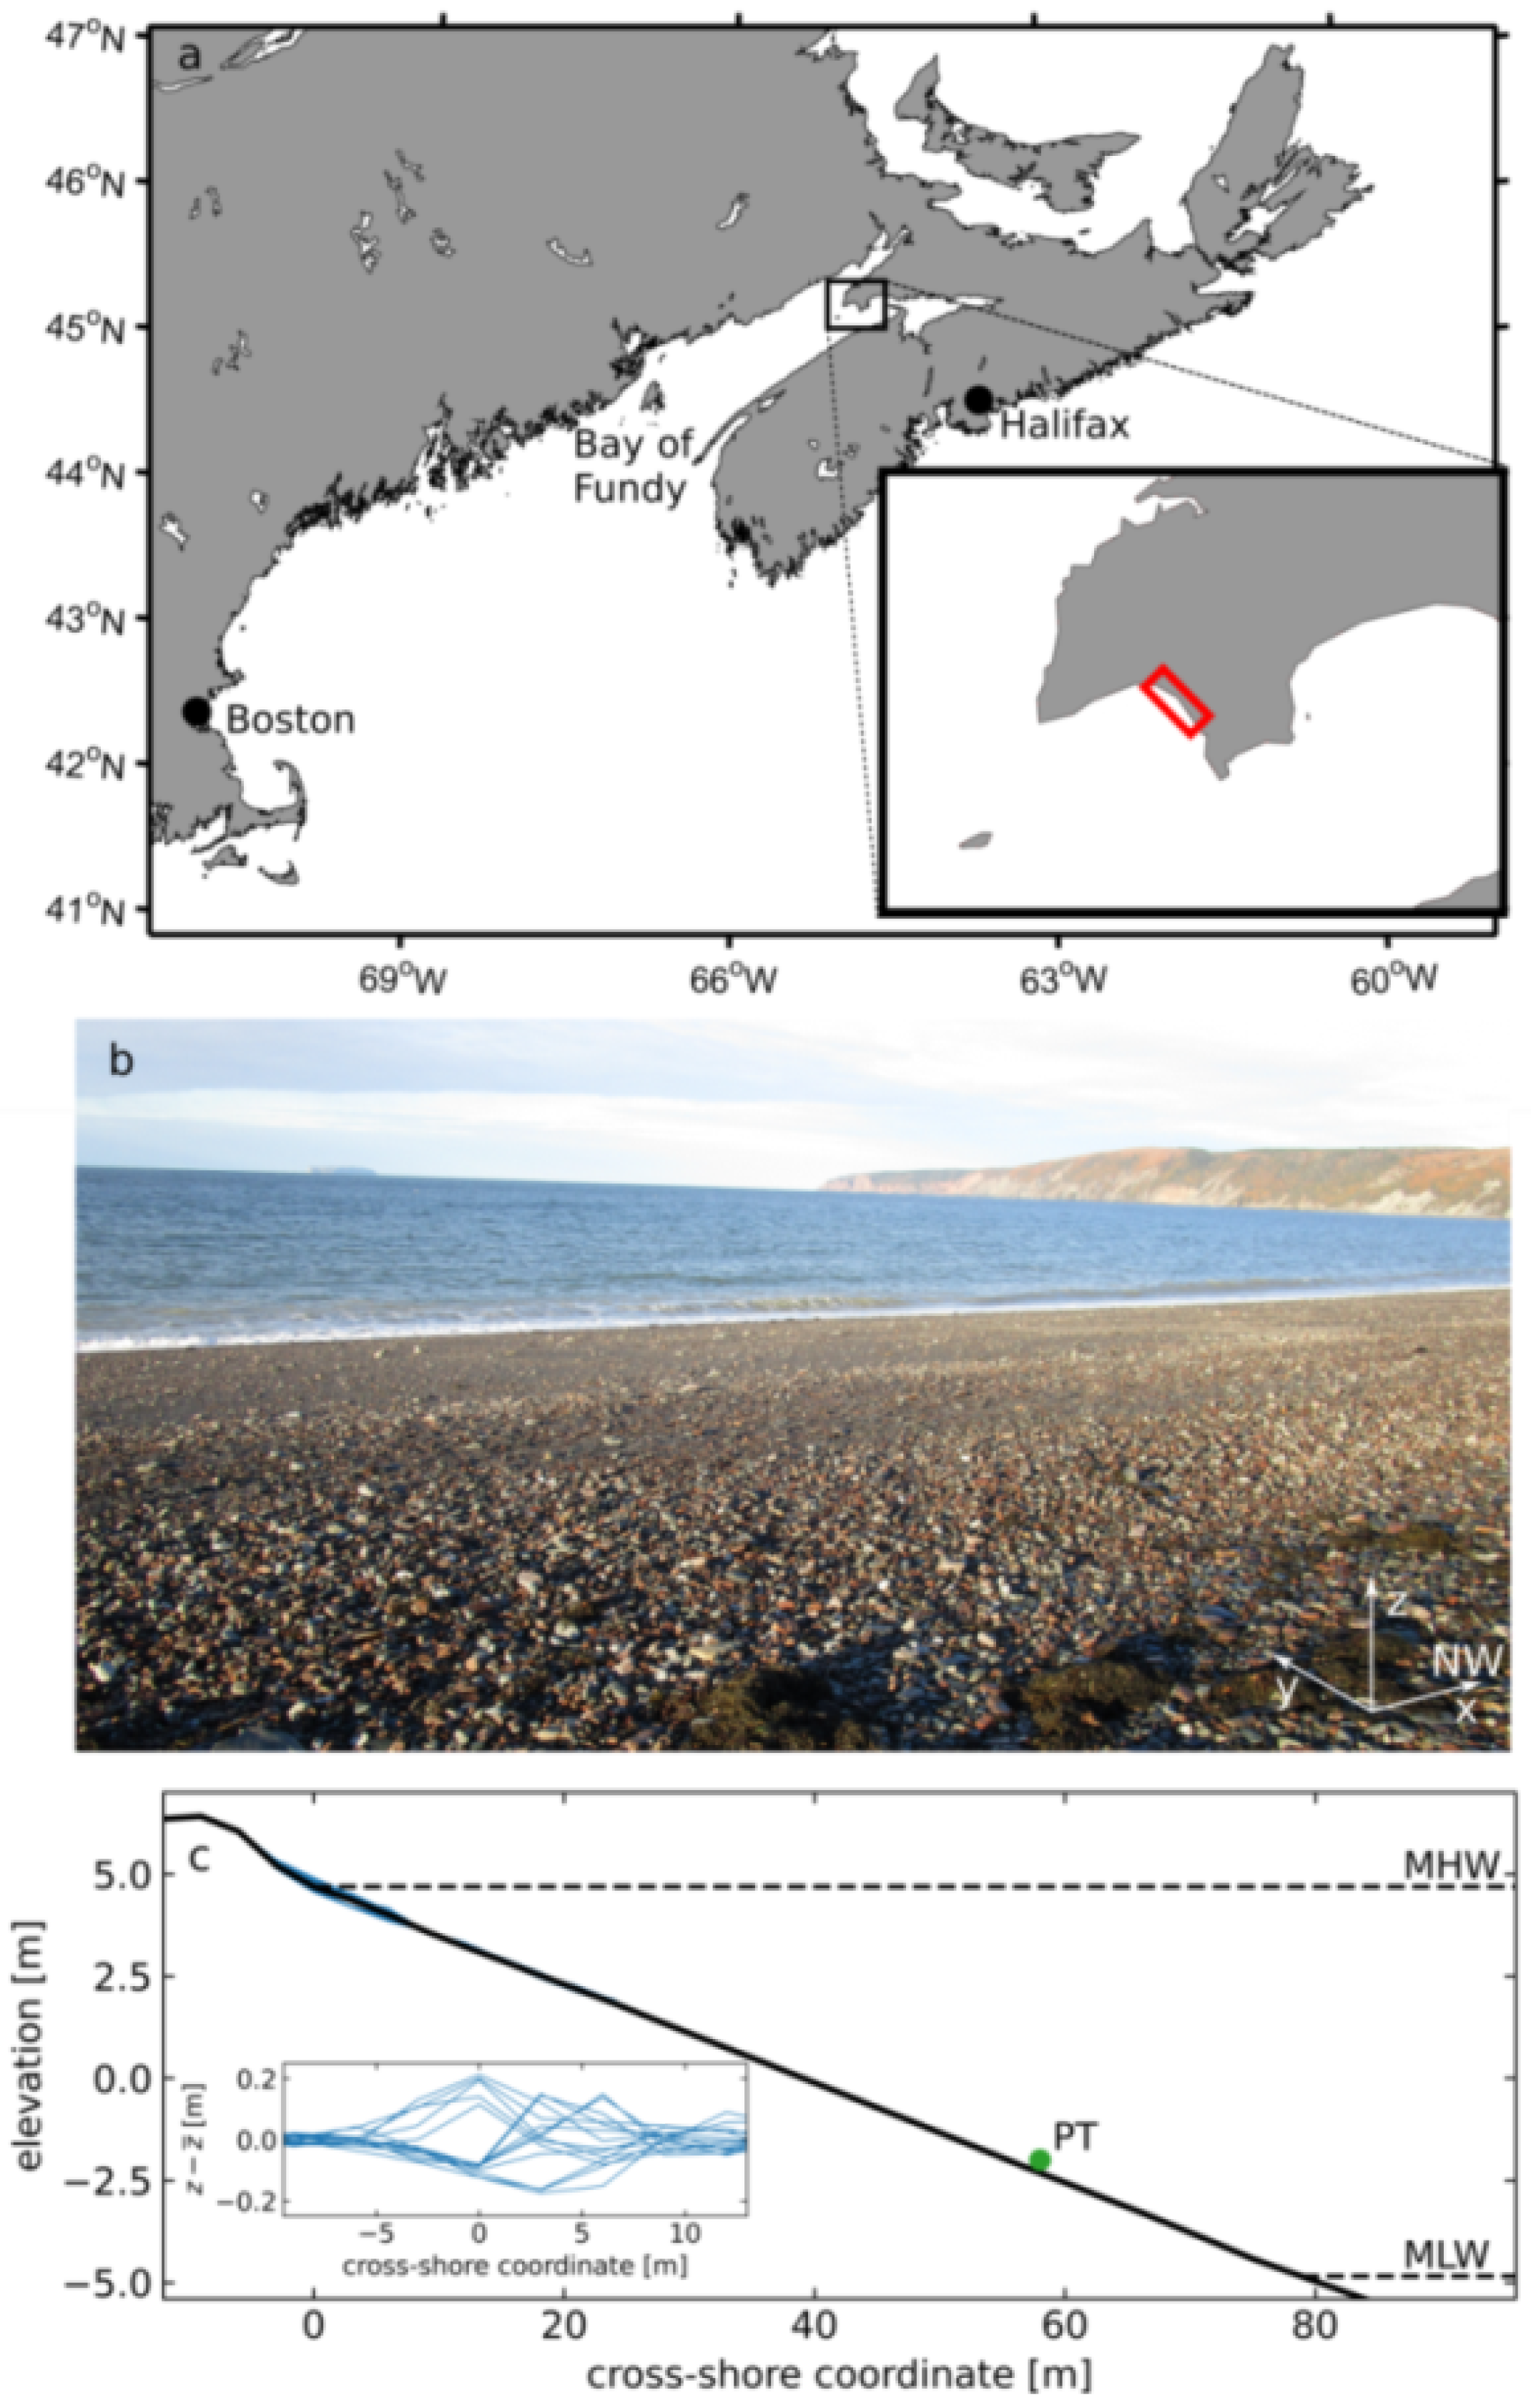
Advocate Beach is a mixed sand–gravel–cobble barrier beach located near the head of the Bay of Fundy in Nova Scotia, Canada (Figure 1). Based on the 8–12 m tidal range, Advocate beach can be classed as megatidal rather than macrotidal [28]. The beach separates the headlands of Cape Chignecto to the west and Cape D’Or to the southeast, and is 5 km long with a nearly linear shoreline. The beach face is steep (approximately 1 in 10 slope) and the sediments poorly sorted, ranging from medium sand to cobbles to boulders greater than 20 cm in diameter. From the lower beach face to beneath lowest low water, the sediment composition transitions from mixed sand–gravel–cobble to cobble and boulder-sized material. From the southwest, the beach is exposed to the full 500 km fetch of the Bay of Fundy and adjacent Gulf of Maine, but from other directions is more fetch-limited. At low tide, the beach is uniformly planar with crest to low water distance as much as 100 m in spring tides (see Figure 1c, and [29,30]). The large tidal range results in high rates of change in the shoreline position; during maximum flood or ebb, the rate of change of water level is as much as 3 m h−1, or roughly 0.5 m min−1 across-shore.
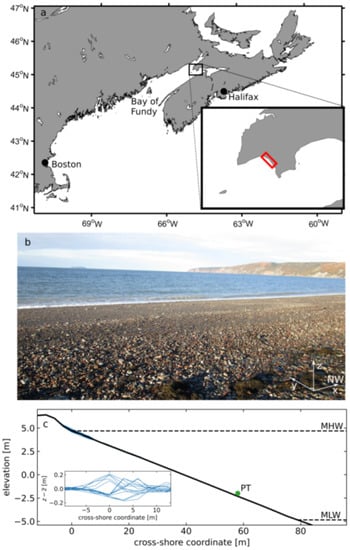
Figure 1.
(a) Map of the Maritimes region of Canada and the northeastern United States. The location of Advocate Beach is indicated by the red box in the map inset. (b) Photograph of Advocate Beach at mid-tide, taken from near the high tide level facing westward. Northwest is alongshore to the right, as indicated by the arrow at the bottom right of the photo. (c) The mean profile of the beach, averaged over the duration of the 2018 field experiment. Mean High Water (MHW) and Mean Low Water (MLW) are both indicated, also as averages over the experiment’s duration. The location of a pressure transducer (PT) used to obtain wave and tide data is indicated by the green dot. The inset plot shows the difference in each tide’s profile from the mean profile, highlighting the upper beach profile near the high water line as the region of greatest morphological change.
During and after fairweather forcing, an active high tide berm is commonly observed near the high water line. The berm composition is generally of coarser material than that found in the intertidal zone, consisting of relatively well sorted gravel and cobbles. Following periods of energetic wave forcing, the beach appears free of distinct morphological features, and when exposed at low tide the beach surface sediments are predominantly sandy. Conversely, the beach surface sediments are generally coarser following periods of low energy forcing. The combination of a steep beach slope and typically short period, wind-generated incident waves result in a highly energetic shore break for offshore significant wave heights of ca. 0.5 m and larger [30].
2.2. Experiment Overview
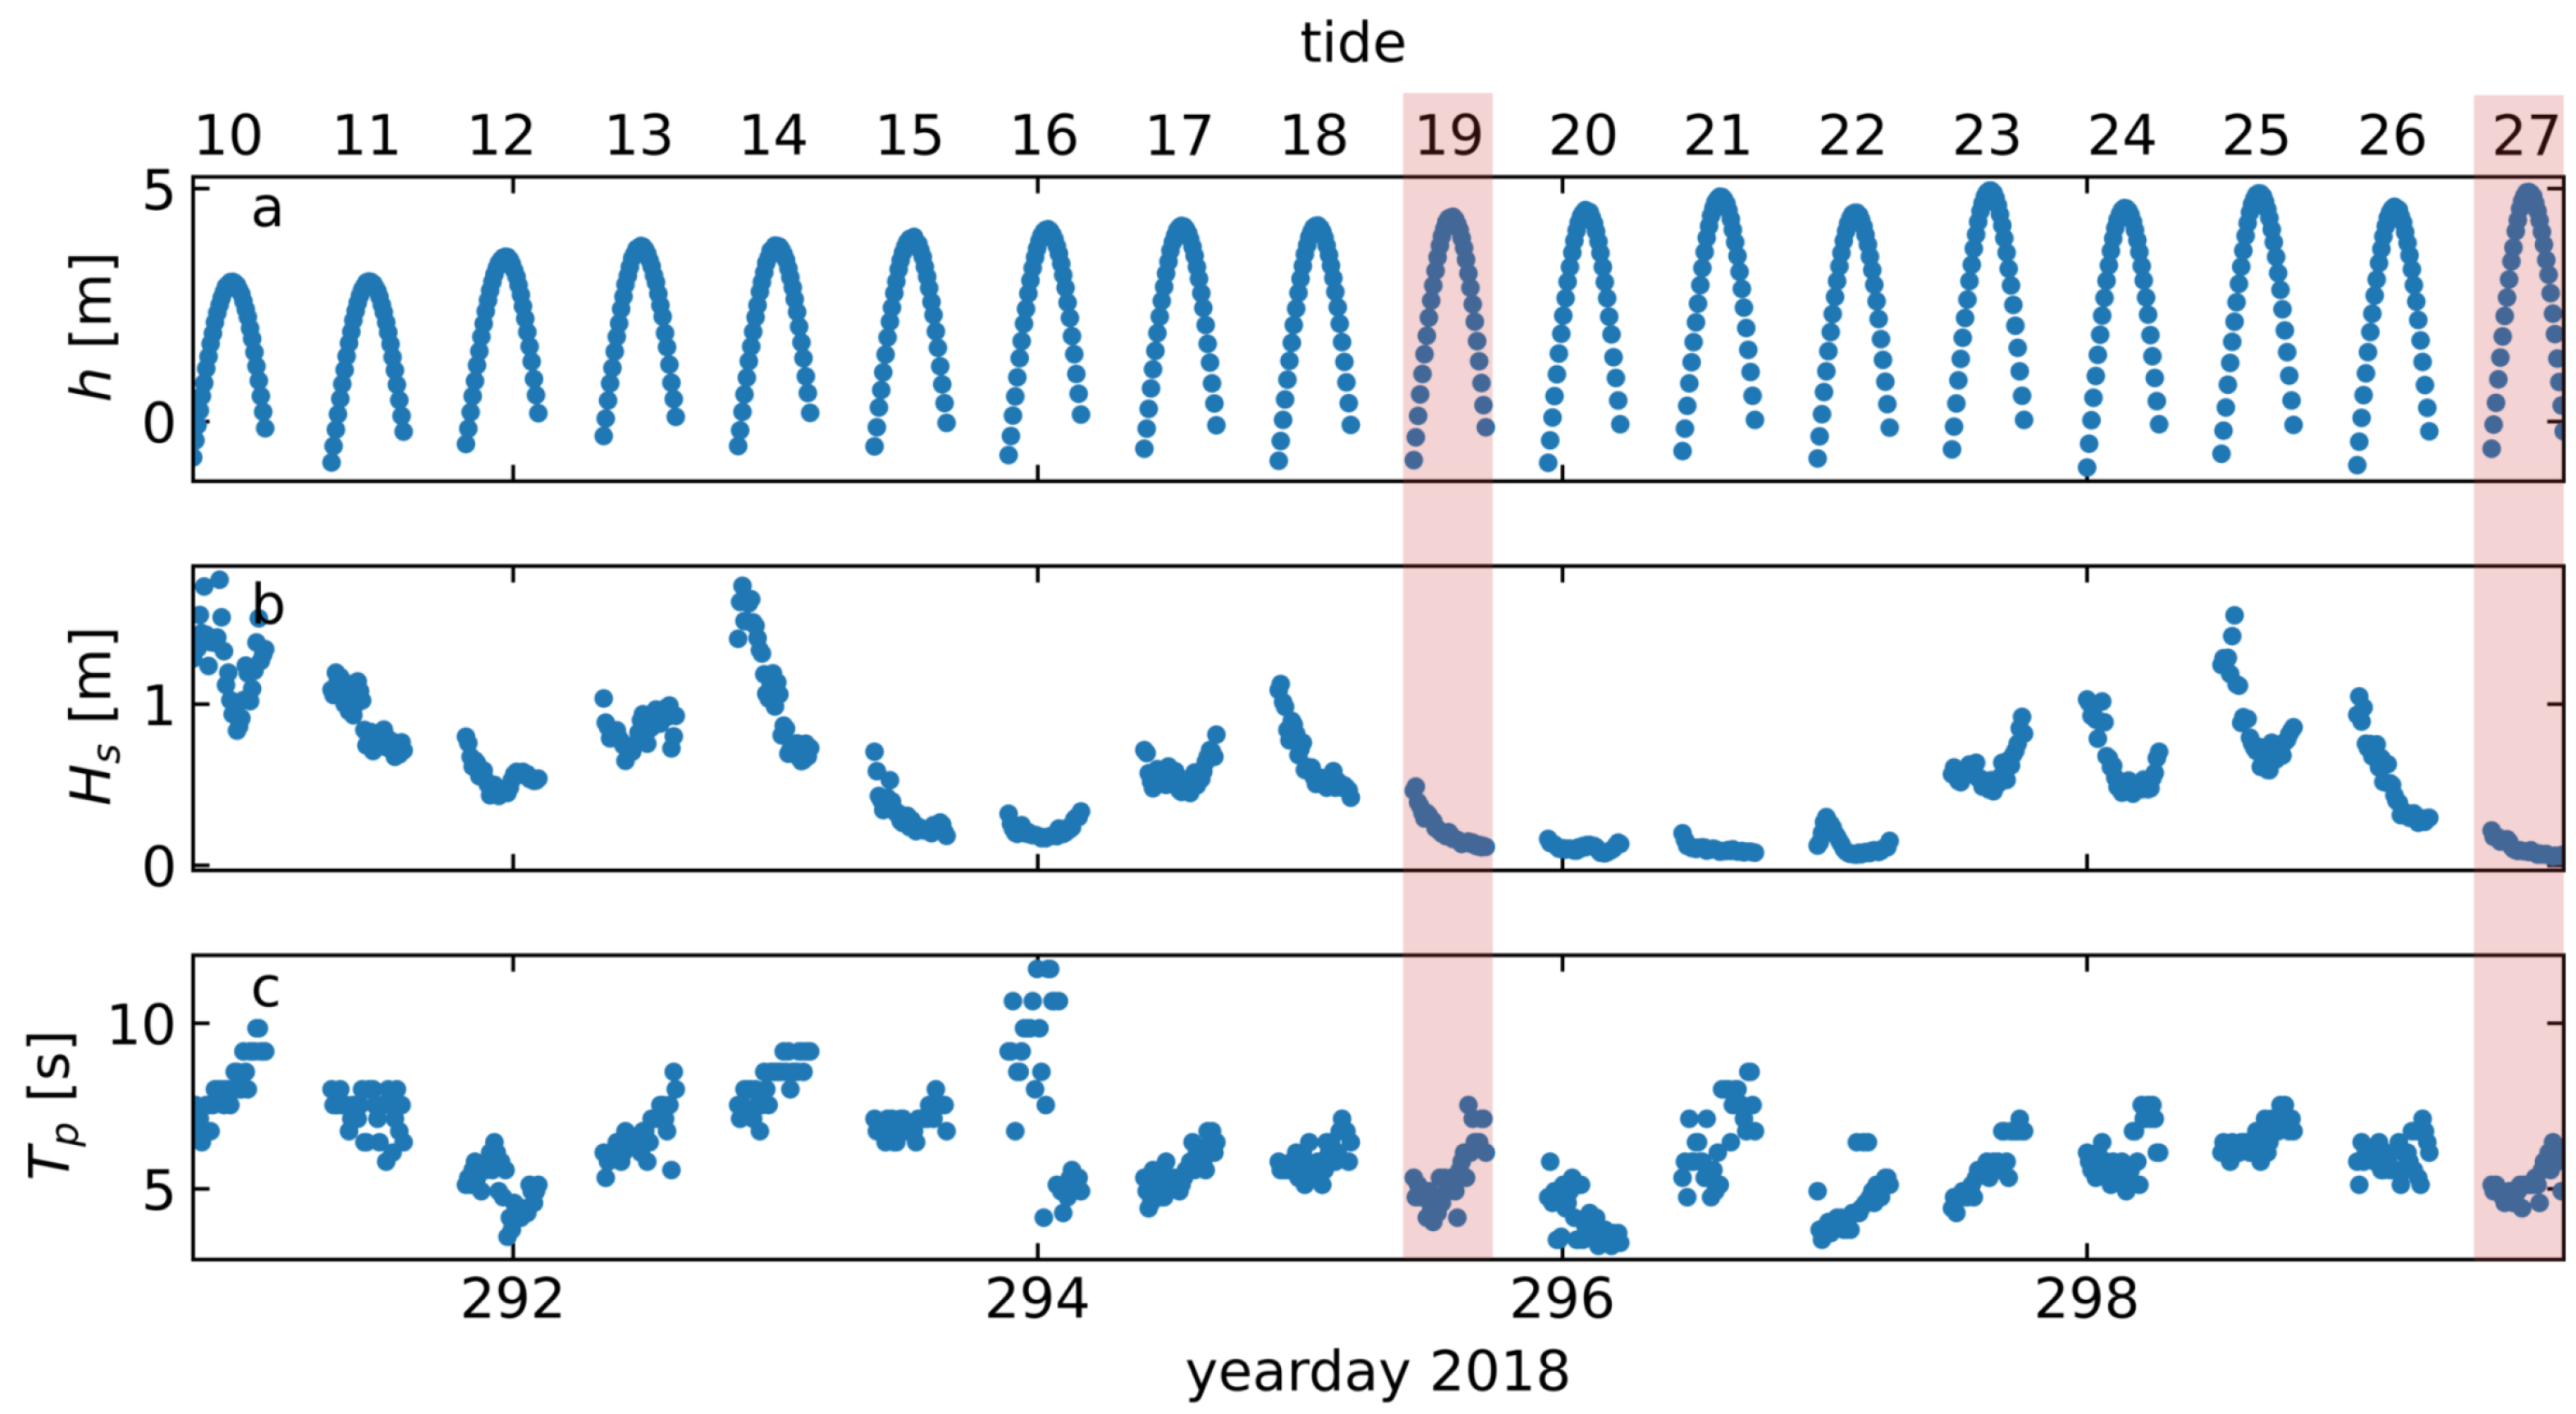
The field experiment was conducted between 14 and 27 October (yeardays 287–300), 2018. The experiment spanned 27 tides, which are hereafter referred to by their sequential low tide index, 1 through 27 (Figure 2). The goal of the experiment was to investigate the coevolution of bed level and mean surficial grain size, with an emphasis on swash zone processes. Data were collected using a four-element array of collocated ultrasonic range sensors and cameras, along with an overhead camera used for tracking the movements of tracer cobbles in the swash. Both systems were modular, and could be handled by two people. The frames were positioned immediately shoreward of the high water line during periods of low to moderate energy forcing conditions such that the instruments were suspended over the swash zone.
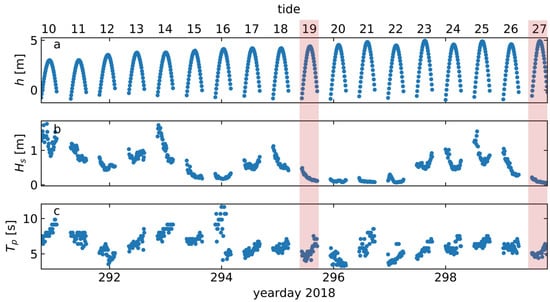
Figure 2.
Summary of (a) tidal elevation, (b) significant wave height, and (c) peak wave period during the experiment. Tides 19 and 27—the tides analysed in this paper—are indicated by the light red shading.
Wave and tide data were obtained using a pressure transducer located on the lower beach face between the mid-tide and mean low water levels (see Figure 1c). The pressure transducer housing was secured to a heavily weighted frame such that the sensing element was ca. 10 cm above bed level. A real-time kinematic (RTK) GPS receiver was used to survey the instrument locations, as well as for beach-scale surveying of bed level and grain size on a tide-to-tide basis. Results from the survey component are outside the scope of this paper, and are presented in Guest [31].
The local coordinate system is defined such that x is alongshore, positive to the northwest, y is across-shore increasing to seaward, and z is positive upward. Local longshore (x) and cross-shore (y) coordinates reported in this paper are relative to the intersection of the mean high water shoreline, computed for the tides encompassed by the 2018 experiment, and the fixed across-shore line along which the beach profile was surveyed each tide. Vertical coordinates are reported as orthometric elevations referenced to the vertical datum used by the RTK GPS (Figure 1c).
2.2.1. Range Sensor and Camera Array
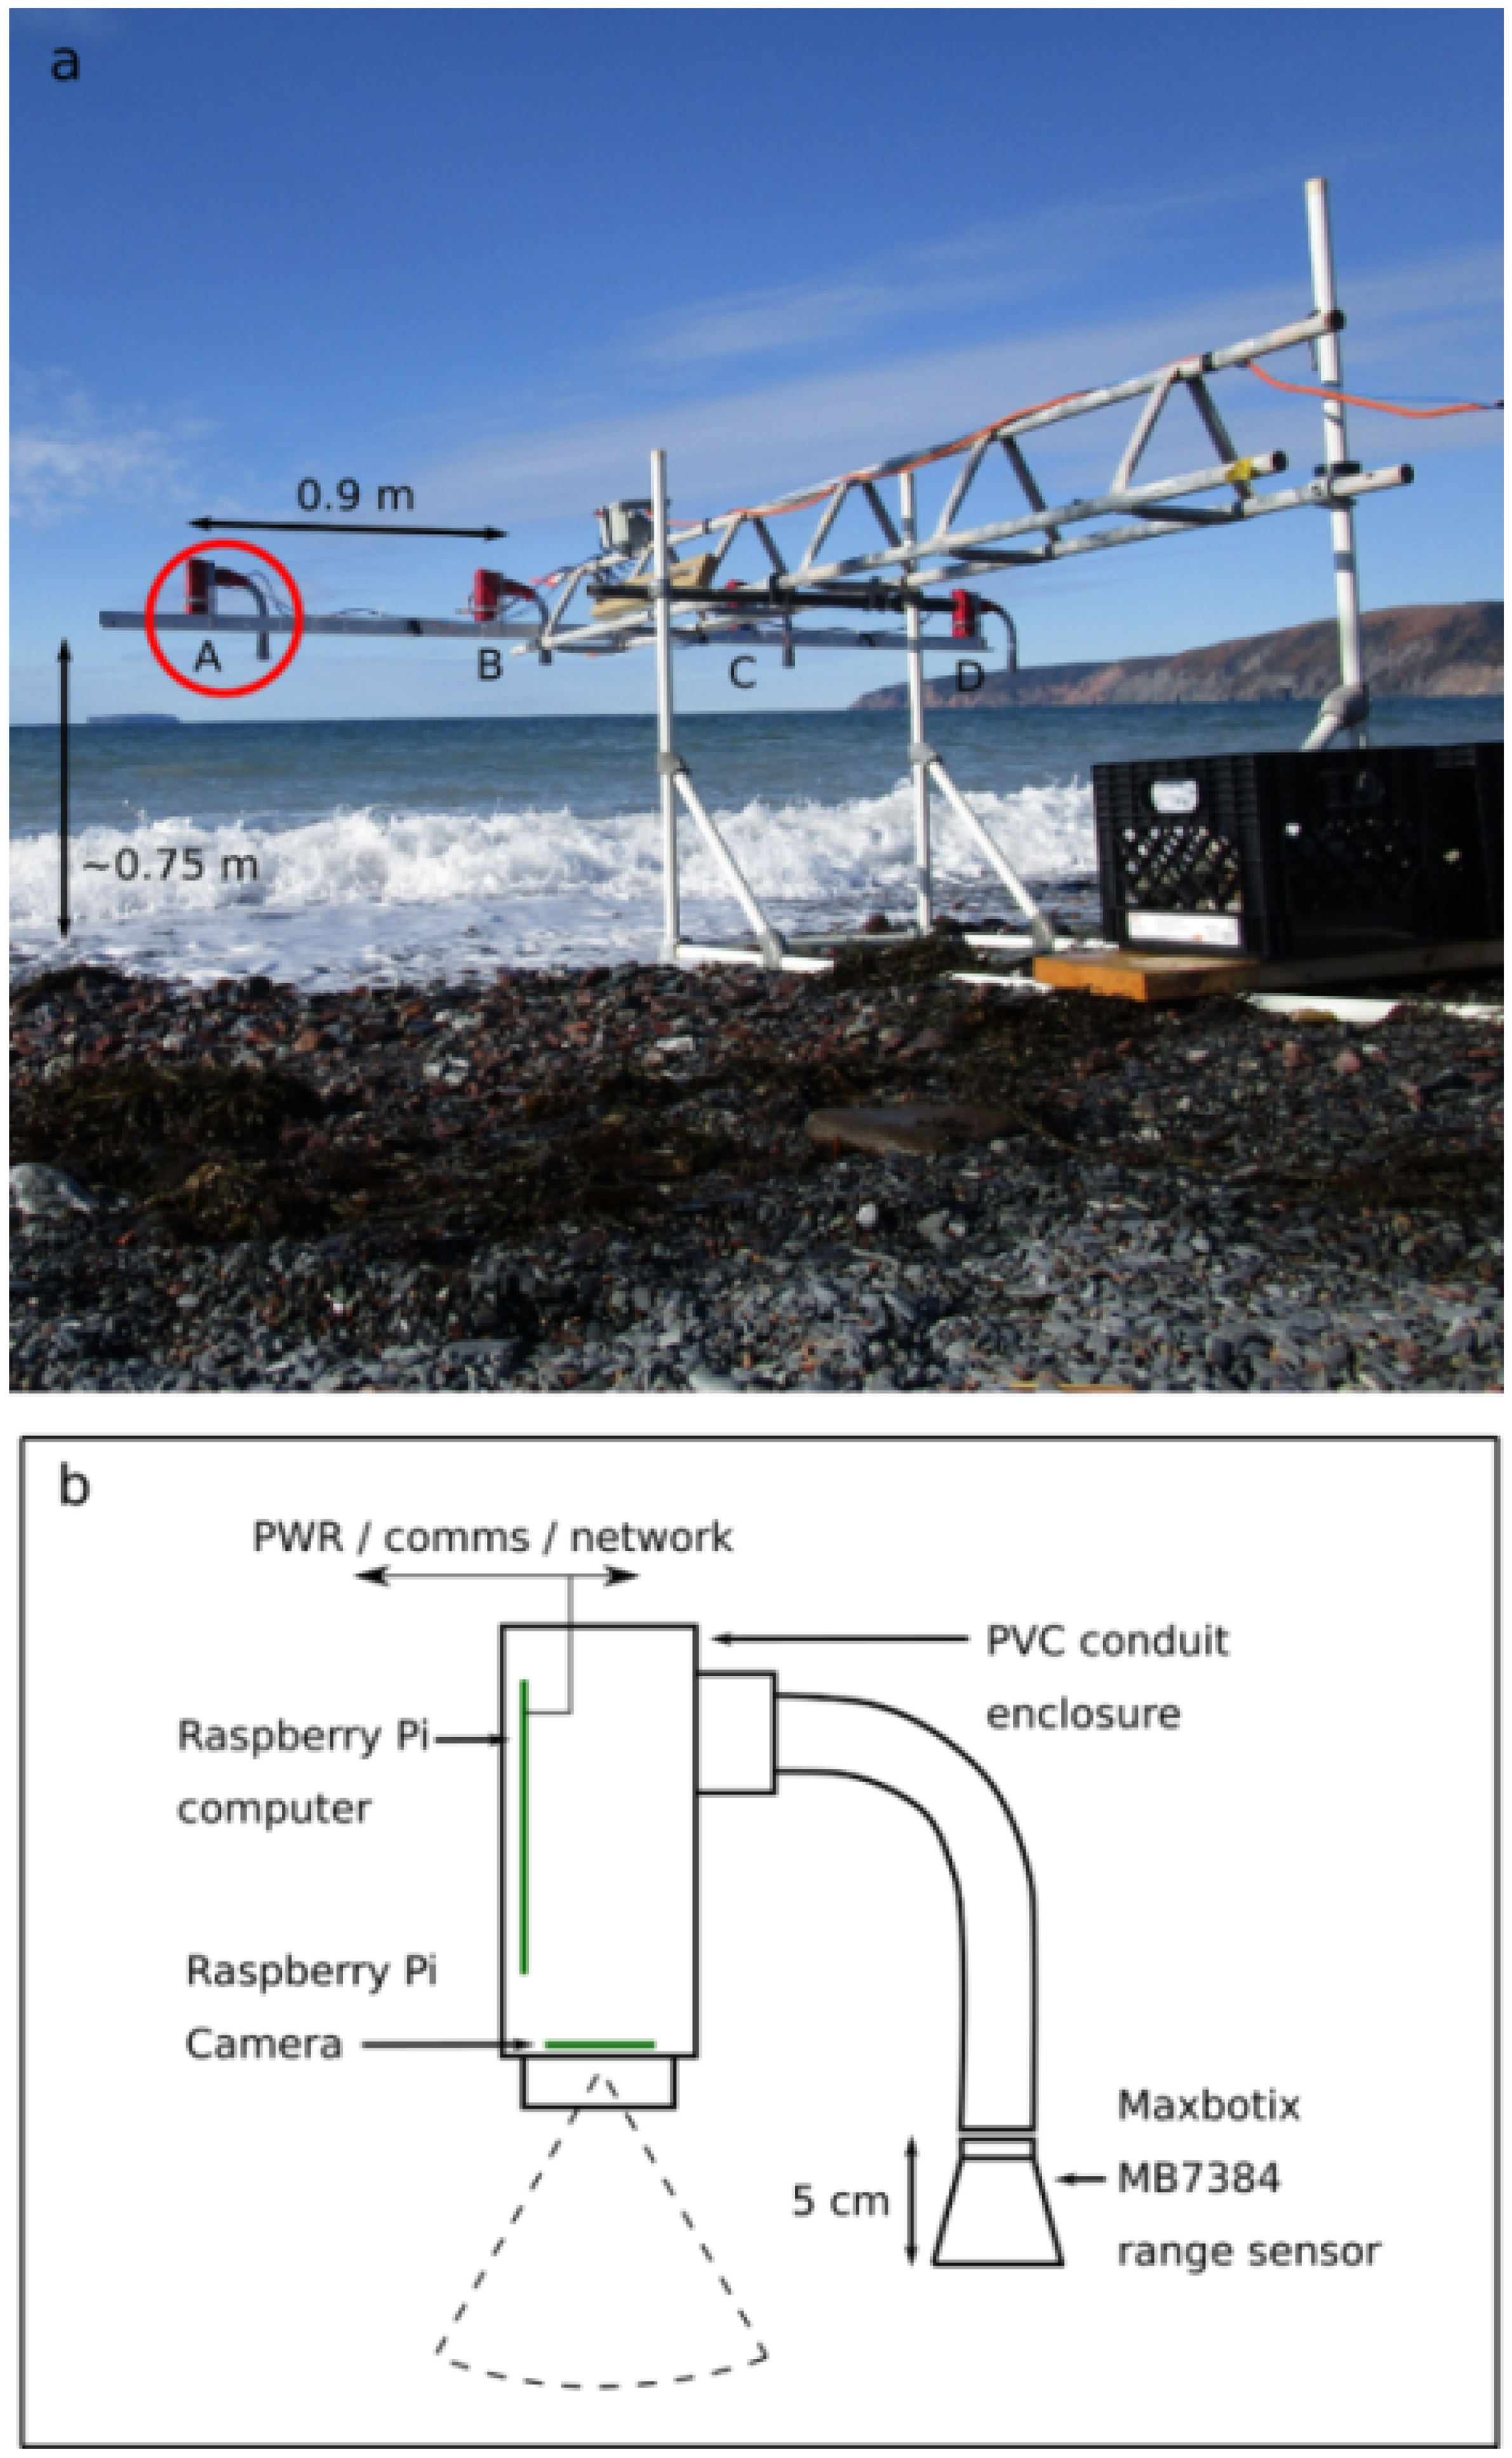
Coincident evolution of bed level and mean surficial grain size was investigated using an array of collocated Maxbotix MB7384 ultrasonic range sensors (range resolution of ca. 1 mm) and 5 megapixel Raspberry Pi cameras. The array consisted of four downward-facing range sensor and camera pairs, cantilevered approximately 2 m horizontally over the swash on an instrument frame that could be moved as shoreline position changed with the tide. The array frame and instrument configuration are shown in Figure 3. The four array elements are hereafter referred to as elements A through D, where A is the southernmost element of the array, and D the northernmost element. The pairs were separated by 0.9 m alongshore resulting in a 2.7 m total longshore span at a nominal elevation of 0.75 m above the bed. The range data were sampled at 6 Hz, and the video images at 0.2 Hz. Each of the four array element pairs were controlled by a Raspberry Pi single board computer, which also served as the data logger. A wireless router, connected to the Raspberry Pis via ethernet, enabled Wi-Fi communication with the Pis to initiate and terminate data logging. The four computers were time-synchronised using network time protocol (NTP), and powered from a 12 V marine battery.
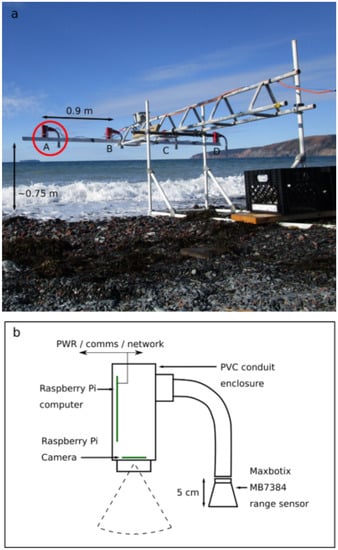
Figure 3.
The range sensor and camera array and frame. (a) Four array elements, labelled A through D, each containing a downward-oriented ultrasonic range sensor and a camera, were cantilevered over the swash to observe bed level change and mean grain size. Each pair was separated by 0.9 m in the alongshore from its nearest neighbour, at a nominal elevation of 0.75 m above the bed. (b) Drawing of a single array element, with positions of the range sensor and camera.
The alongshore orientation of the four range sensor-camera elements on the array frame was chosen to capture the development of incipient beach cusps and other three-dimensional morphology in the alongshore. The geometry of the frame (i.e., the field of view in relation to the base, which was in contact with the beach surface) was chosen so that the mid-swash zone could be sampled without the base of the instrument frame interfering either with the data collection, or with the swash processes being observed.
When conditions were favourable, the instrument frame was assembled and positioned near the high water line and data were collected during the transition from late flood tide to early ebb. Sampling was initiated prior to the maximum swash runup position passing beneath the array, and continued until the swash runup was no longer in the instruments’ field of view. The frame remained stationary thoughout. The aim of the deployments was to position the frame such that the mean shoreline position coincided with the instruments’ fields of view at high tide, such that bed level and grain size could be measured at the intermittently exposed bed. The position of each array element was recorded using RTK GPS during each deployment.
2.2.2. Overhead Camera
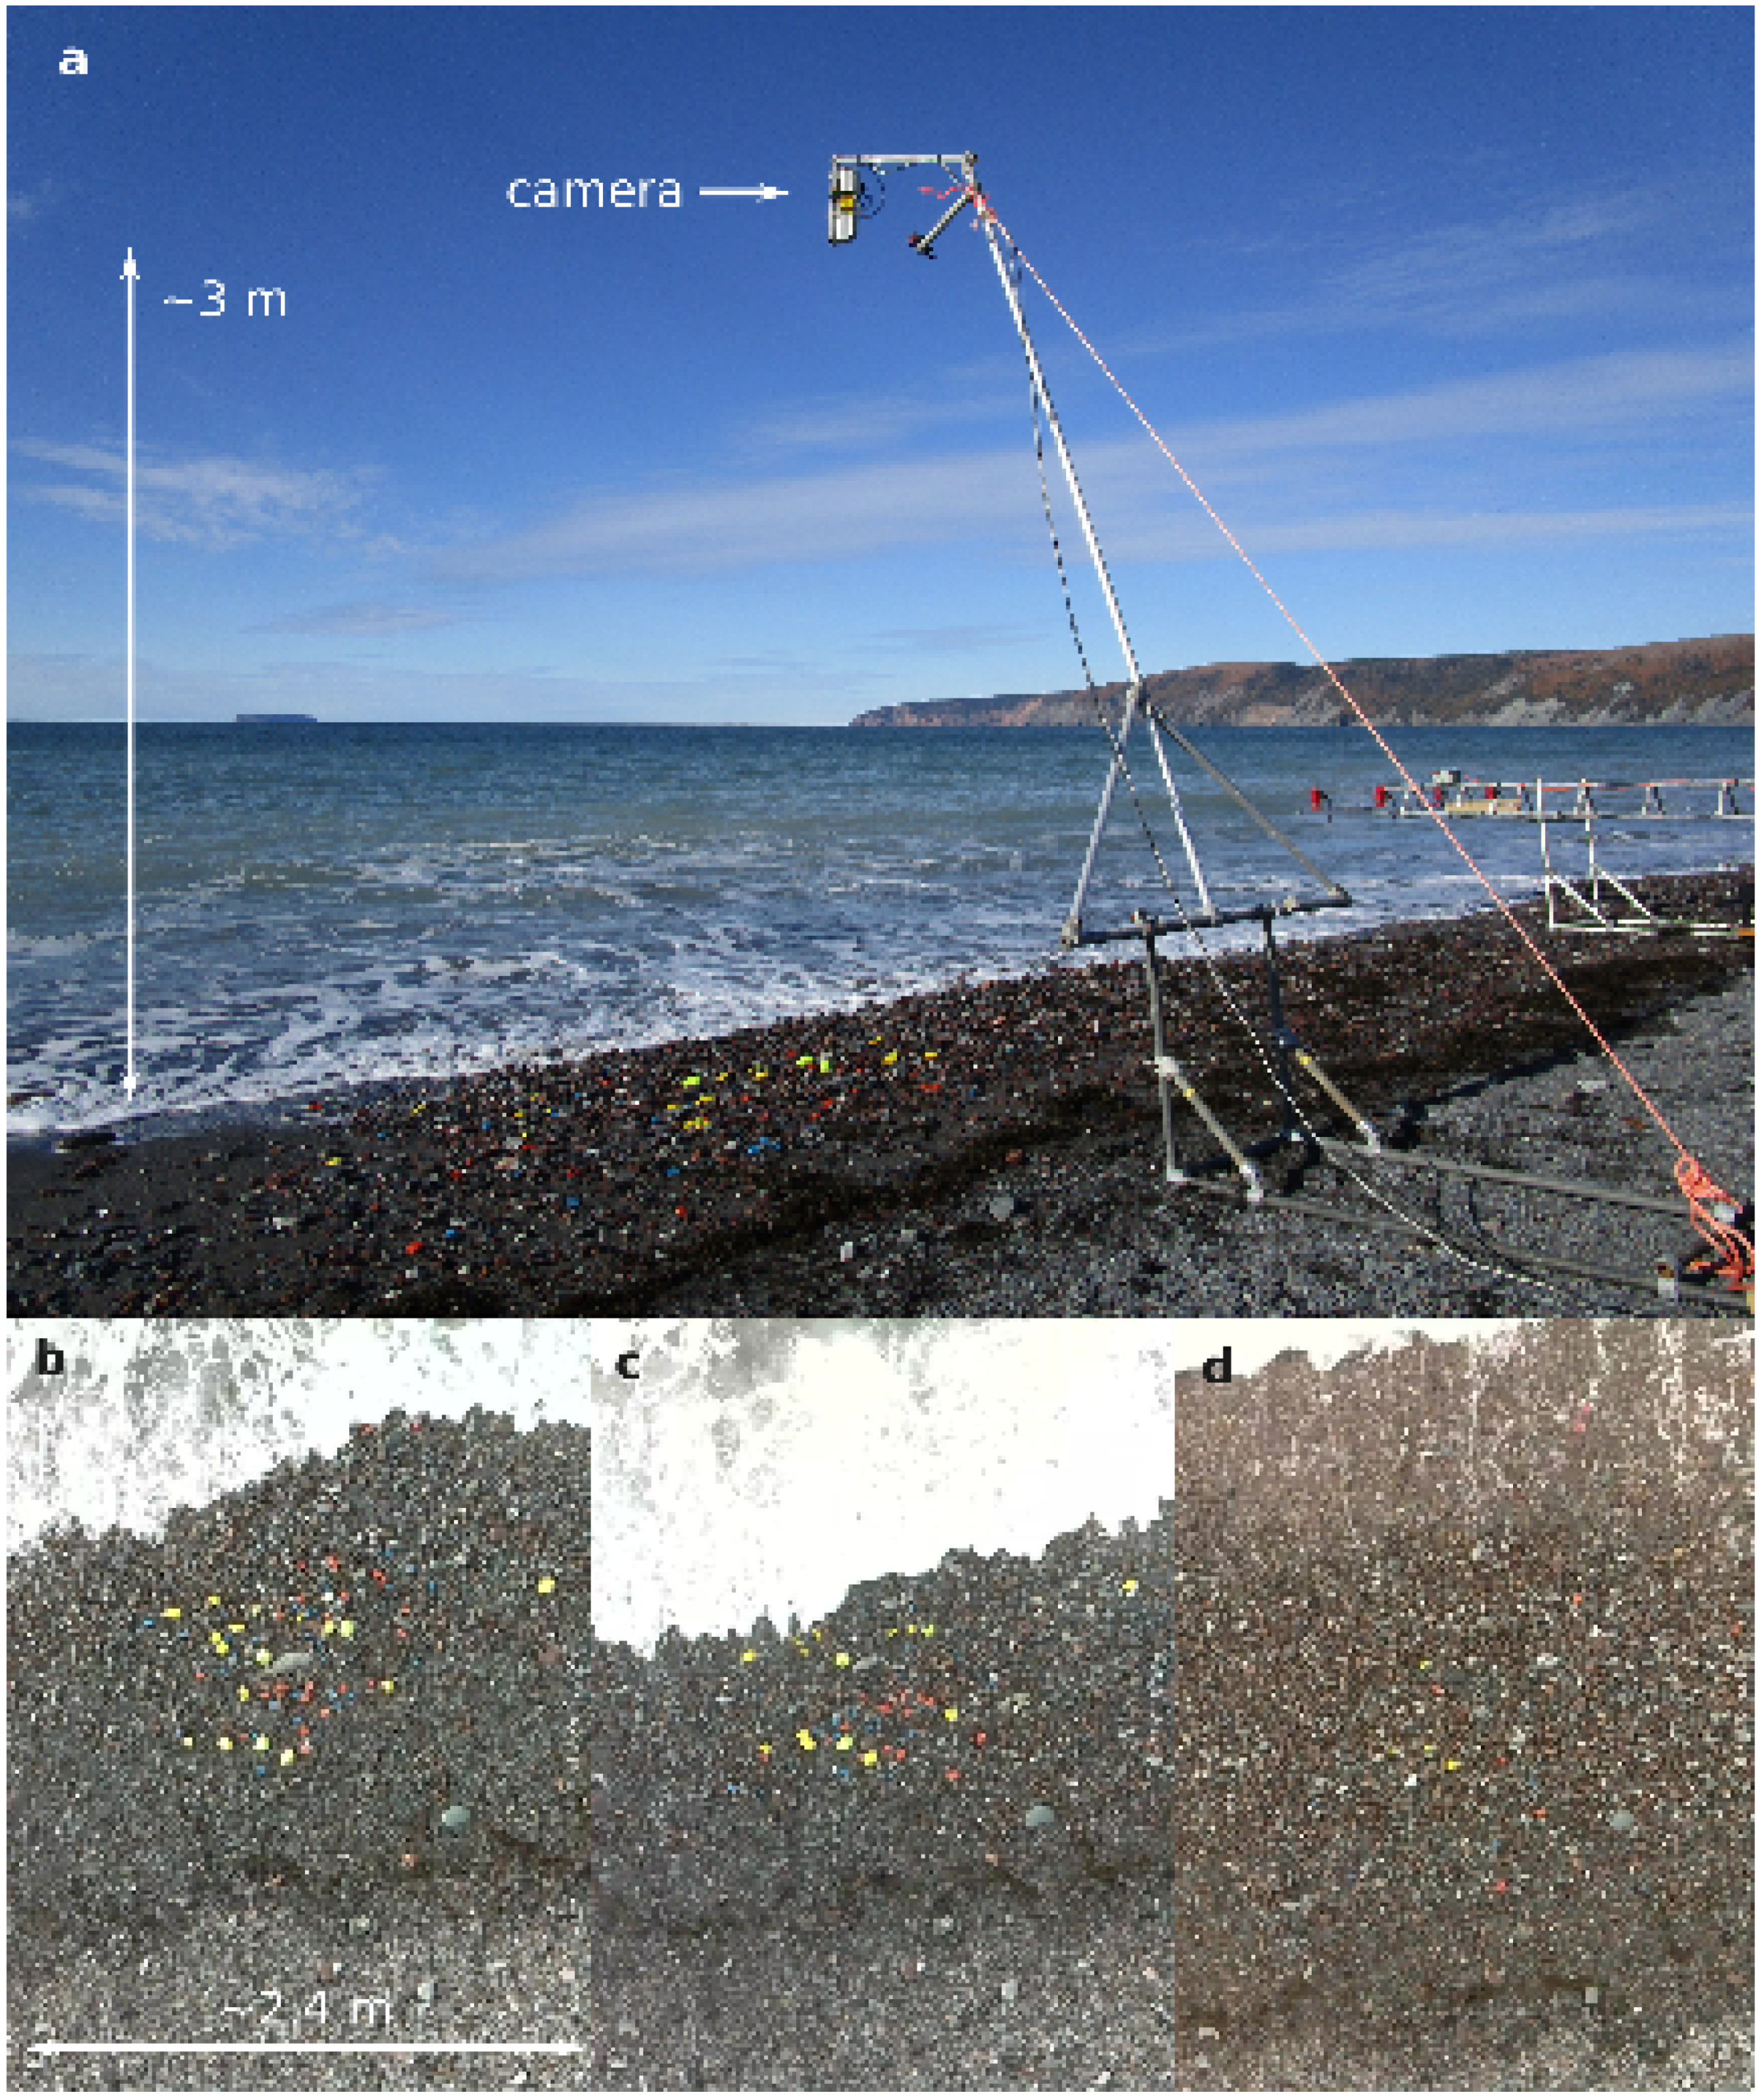
An overhead Raspberry Pi camera, also network-connected via the wireless router, was used for monitoring the positions of tracer cobbles in the swash. This camera was mounted to a second instrument frame, consisting of a stationary base which could be moved with the changing shoreline position, and a movable arm which supported the camera allowing it to view the swash zone from a height of ca. 3 m without the frame base being in the image. The frame and camera are shown in Figure 4. The camera field of view at the beach surface was approximately 2.4 by 4.3 m, longshore by cross-shore.
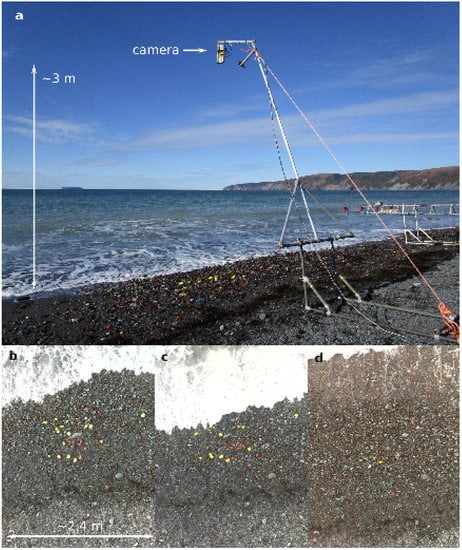
Figure 4.
(a) The overhead camera frame, with downward-looking camera to monitor the transport of painted tracer cobbles in the swash. The camera was elevated approximately 3 m above the bed. (b–d) Sample imagery captured by the camera during the development of a high tide berm (tide 19). The images represent intermediate and late stages of the berm’s development, beginning with the initial deployment of the cobble tracers. The decreased number of cobbles visible in (d) is a result of burial.
Prior to the initial deployment, cobbles were sieved into three different size classes: 22.4 to 31.5 mm, 31.5 to 45 mm, and 45 to 63 mm. The cobbles in these size classes were painted blue, orange, and yellow, respectively. The number of cobbles in each class varied from 10 to 30 in a given deployment, depending on how many were recovered during the previous deployment.
The overhead camera frame was generally deployed alongside the array frame during periods of fairweather forcing. As with the array frame, the overhead camera frame was assembled and positioned near the high water line during late flood tides. The bed within the camera’s view was ‘seeded’ with the painted tracer cobbles prior to the maximum swash runup position entering the camera’s field of view. Video was captured as the cobbles were redistributed by the swash. When the camera’s field of view no longer contained the mean shoreline position, the frame was moved to a more seaward ‘station’, and the cobbles that had been stranded by the translating shoreline were reintroduced to the swash. The overhead camera frame typically occupied 3 to 5 stations during a deployment. A minimum of three ground control points were captured at each station using RTK GPS to provide a scaling between pixel and ground coordinates.
2.3. Data Processing
2.3.1. Range Data: Bed Level and Swash Height
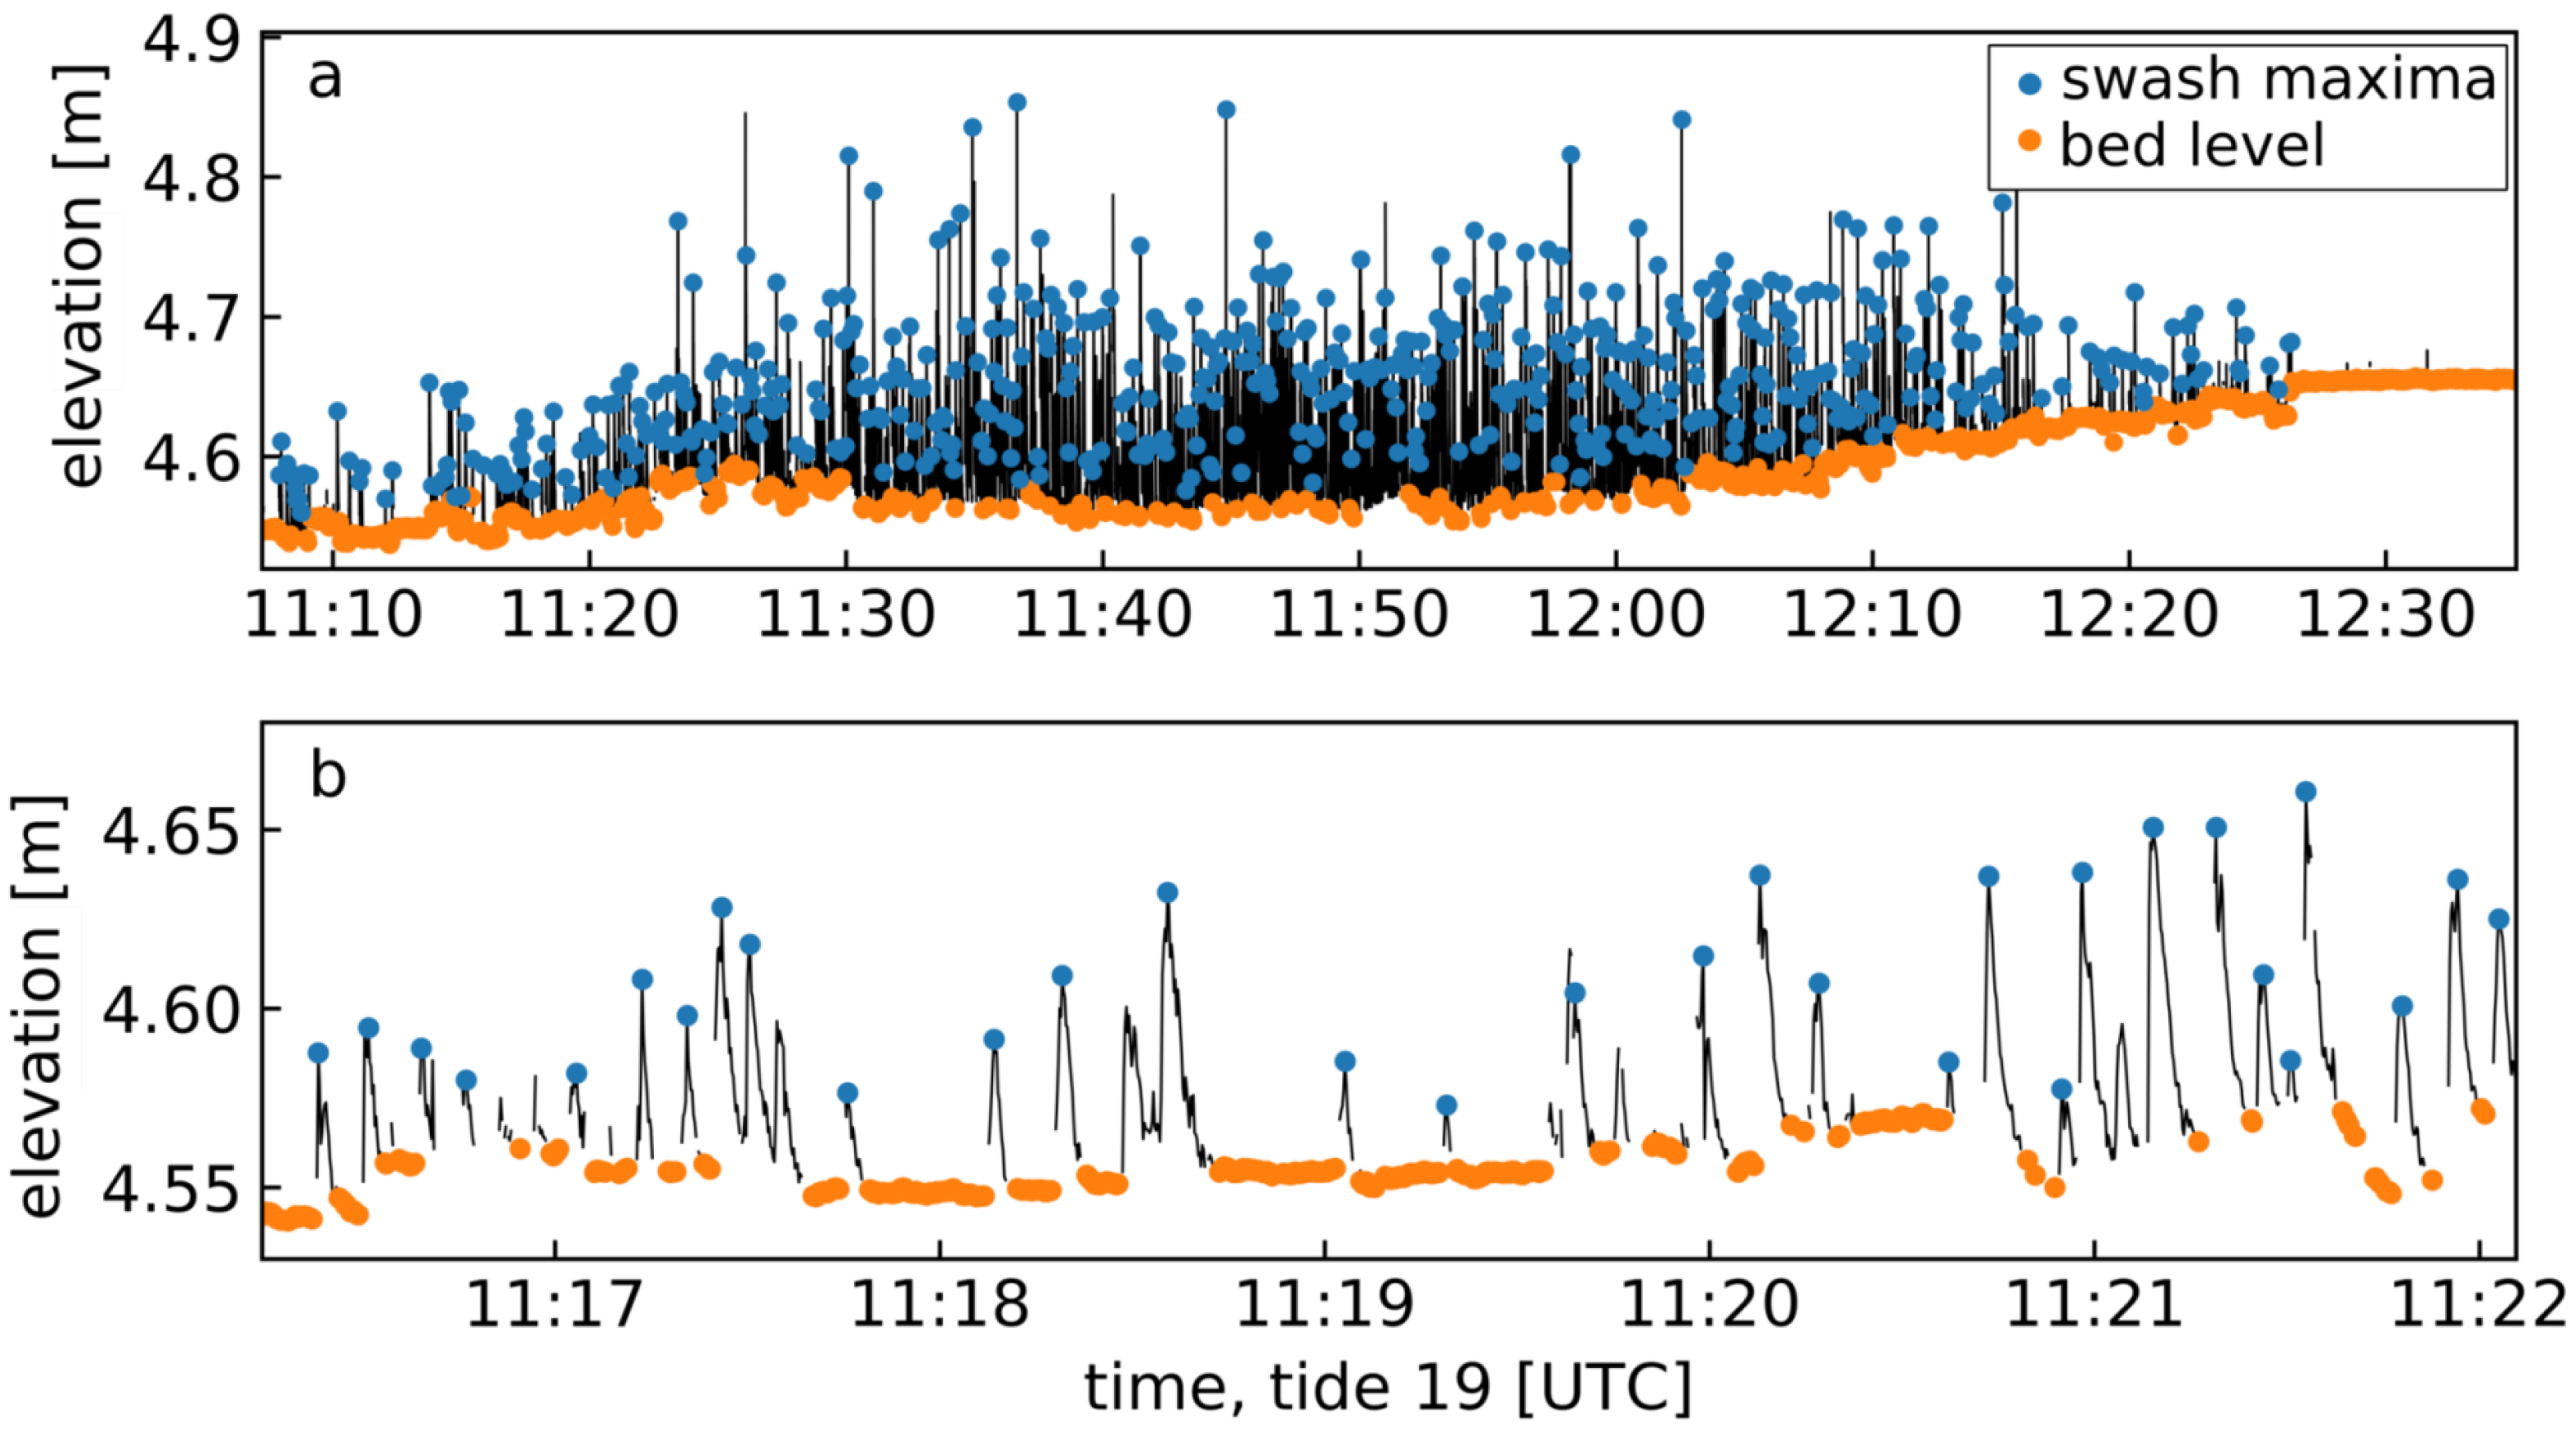
The data from the ultrasonic range sensors represent first returns (i.e., the distance to the nearest object within the O(10 cm) radius beam pattern), which were either from the exposed beach surface in the absence of swash, or from the water surface when swash was present. Processing of the range time series was carried out to isolate the bed level and swash signals. Spurious returns of 0.5 and 5 m—the sensors’ minimum and maximum sensing distances—made an additional processing step necessary. The spurious returns were attributed to diminished or scattered acoustic reflections from aerated swash at leading edge of the swash front. No return, or returns not within the 0.5–5 m sensing range of the instruments, result in range output of 0.5 or 5 m.
The bed level was extracted from the range time series by identifying sequences of N samples in which no sample differed from the first sample in the sequence by more than a predefined range threshold. N was set to 9 samples (1.5 s), and the range threshold set to 5 mm. For analysis applications requiring a uniformly sampled bed level time series, gaps in the series associated with swash were filled via linear interpolation.
The swash thickness was extracted from the range time series by isolating all values at ranges less than the range to the interpolated bed level, minus a buffering threshold of 2 mm to eliminate spurious low amplitude values due to instrument noise. The isolated segments were defined to be swash events if they had a minimum duration of 5 samples (0.83 s) and a local maximum within the segment (excluding the endpoints) at least 15 mm above the bed. These criteria were implemented to exclude spurious events in the swash time series that did not exhibit the anticipated shape of a runup event (i.e., a sequence of increase, maximum, and decrease in swash height). A sample elevation time series, with the extracted bed level and swash height maxima, is shown in Figure 5.
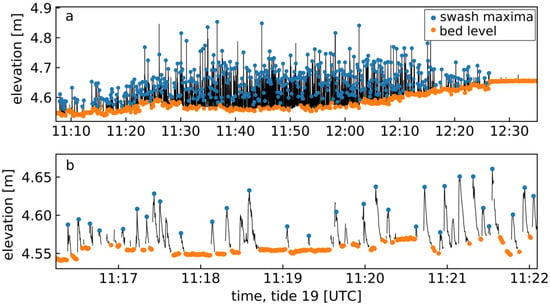
Figure 5.
(a) Time series of swash and bed elevation, from data recorded during high tide of tide 19 by the range sensor in array element A. Orange dots represent the extracted bed level, blue dots the swash height maxima. (b) Subset of the time series in (a).
Bed level change between swash runup events was computed by differencing the final values in each bed level segment in the (non-interpolated) bed level signal, where a segment consisted of contiguous points meeting the exposed bed criteria described above. This definition of bed level change was chosen to be conceptually consistent with the definition proposed by Blenkinsopp et al. [10].
2.3.2. Array Cameras: Digital Grain Sizing
A wavelet-based digital grain sizing (DGS) package [5], implemented in Python, was used to estimate grain size statistics from the camera array imagery. The DGS algorithm does not require calibration, and takes as input a grain-resolving image containing only sediment.
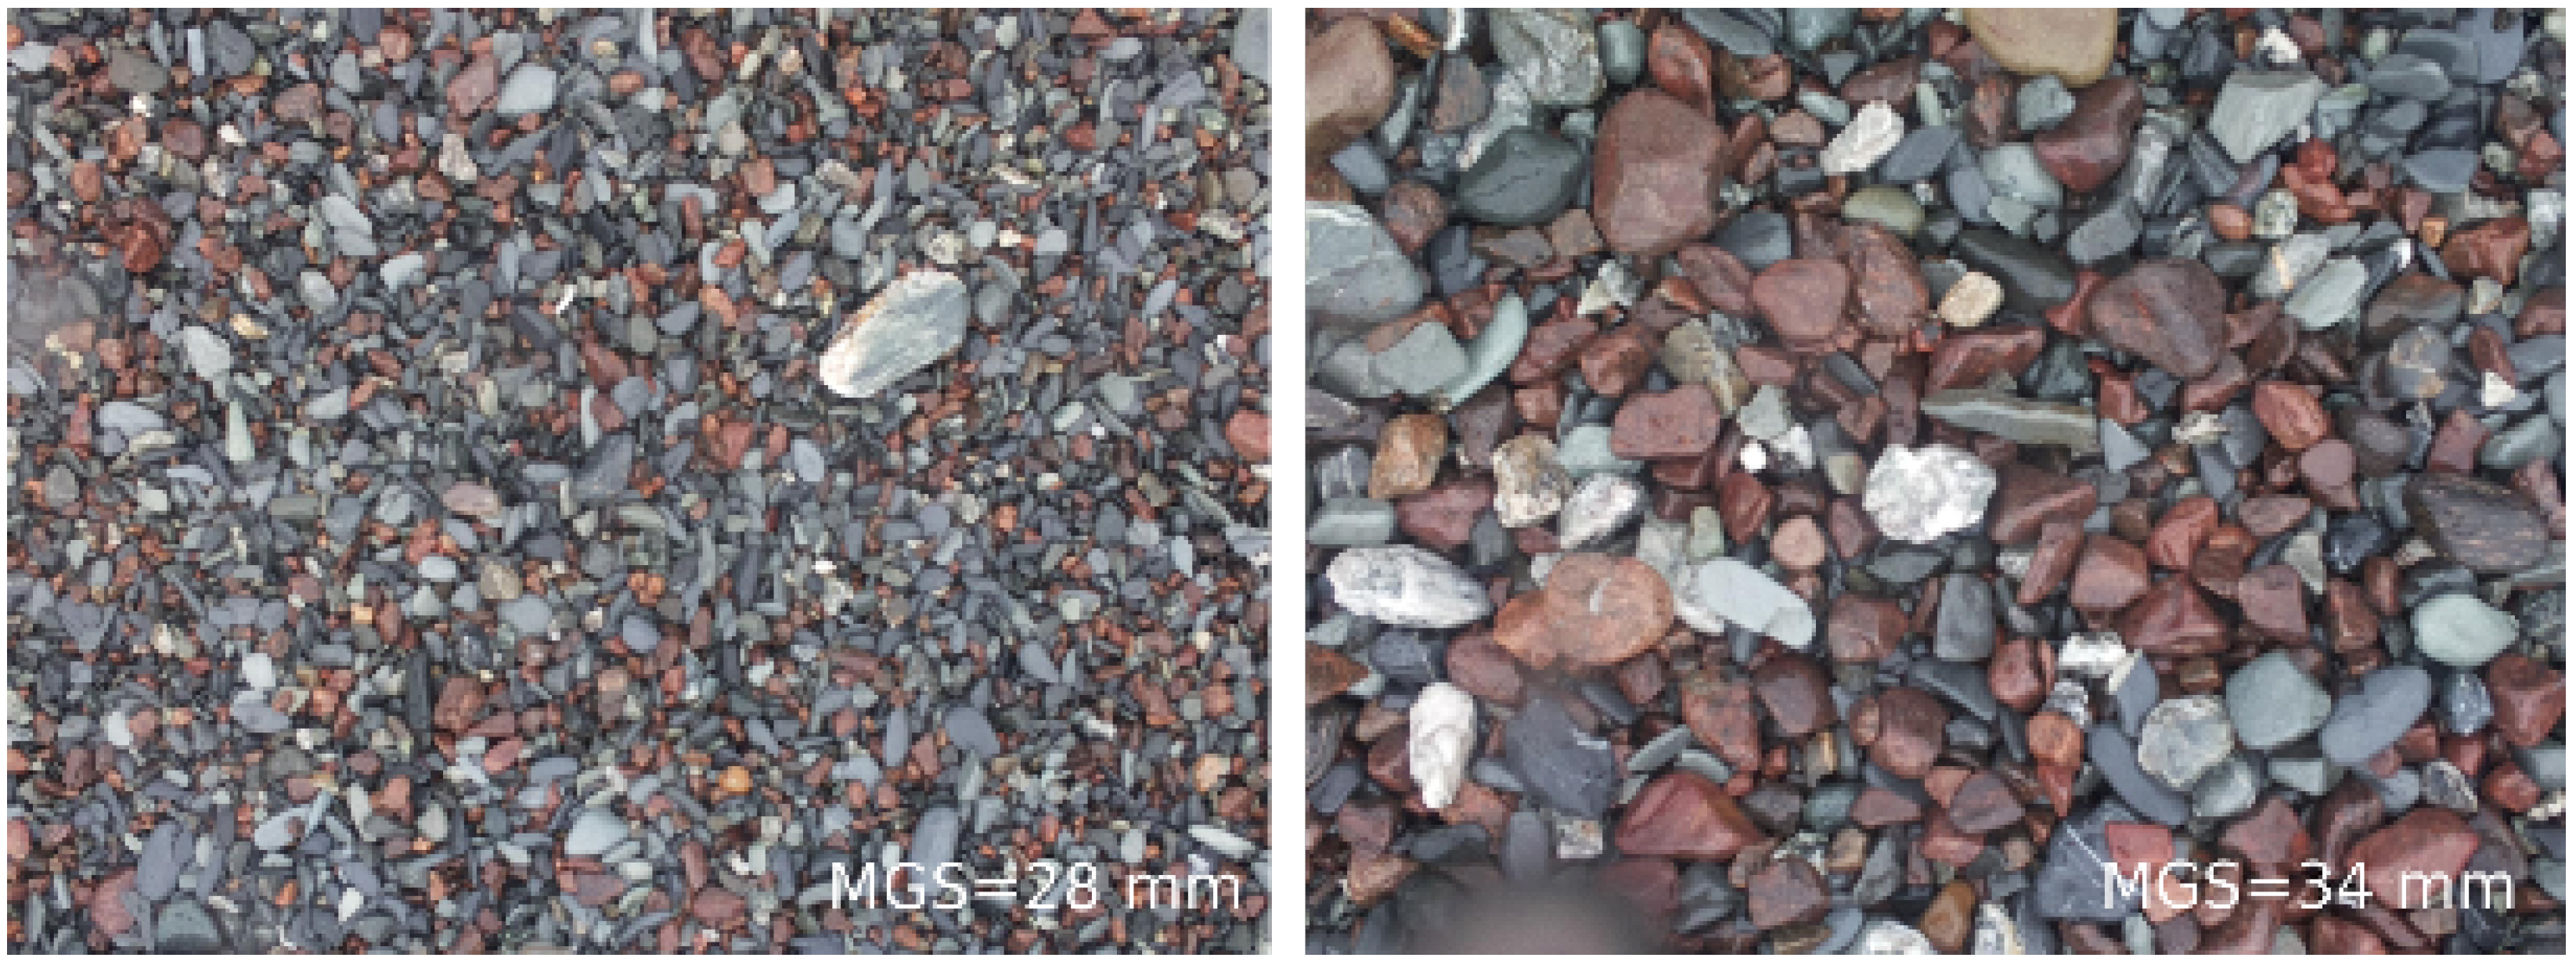
The image sets from the four array-frame cameras were manually curated to include only those images with fully exposed bed in the region of the image used for analysis. Each image was cropped to half width and height in the centre of the image, corresponding to a field of view at the bed of 1.42 × 0.85 m, for a 0.75 m camera height above the bed. Sample images processed by the DGS algorithm are shown in Figure 6. Input parameters for the algorithm include a pixel to physical unit scaling, a maximum feature diameter to be resolved, and a dimensional scaling factor. The bed-level signal extracted from the range sensor time series was used, along with the camera’s known field of view specifications, to establish the pixel to physical unit scale factor for each image. The bed level signal was smoothed to eliminate short period changes in bed level attributable to individual grain movements. The maximum feature diameter, defined as the inverse ratio of the pixel width to the width of the largest feature to be resolved, was also dynamically assigned to maintain a maximum feature resolution of 56 mm—a value chosen to balance output resolution at both small and large grain sizes. The dimensional scale factor was set as 0.8. See Appendix A for a discussion of the choice of dimensional scale factor and for more detailed descriptions of the remaining input parameters.
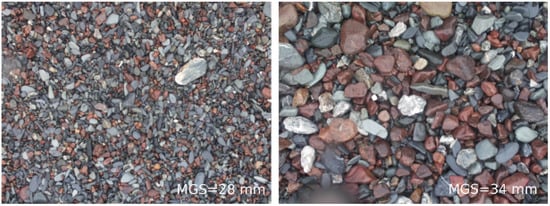
Figure 6.
Sample images processed using the wavelet-based digital grain sizing method. The mean grain size (MGS) of each is indicated. The images were captured by array camera A during tide 27. The fields of view at bed level are ca. 0.8 × 1.4 m. The left and right photos were captured at 14:26 and 14:45, respectively.
Though the algorithm is capable of returning a full grain size distribution, validation of the output against distributions from both sieve and manual point count analyses (see [12,32], or Appendix A for a description of the point count method) indicated that only the lowest moment of the grain size distribution (mean grain size) was captured with satisfactory accuracy. We attribute the algorithm’s poor representation of the higher order moments to the wide grain size distribution. See Appendix A for further discussion of the validation procedures.
2.3.3. Cobble Tracking
Cobble trajectories were manually extracted from the video image sets captured by the overhead camera. To mitigate the difficulties posed by the partial or full occlusion of cobbles by bubbles and foam in the swash, pixels with high white content (red, green, and blue channel intensity values all exceeding 175 out of 255) were subtracted from each image, then each image was averaged with the 10 preceding images. The resulting composite images showed a partially reconstructed bed, with more tracer cobbles being visible than in the original images. Due to the regular occlusion of the cobbles by the swash, the extracted trajectories are assumed to be accurate at swash forcing timescales (ca. 6 s), i.e., any transport occurring while the cobbles were submerged was not captured. The 45–63 mm (yellow) size class was most easily identified in the images. Reduced visibility of the other size classes meant that cobble identities could not be maintained with confidence between instances of occlusion. Thus, only trajectory data from the 45–63 mm size class is presented in this paper. Tracking of each cobble began immediately after it was deposited in the swash. Tracking was stopped when the cobble was buried or transported out of the field of view.
3. Results
3.1. Coevolution of Bed Level and Mean Grain Size
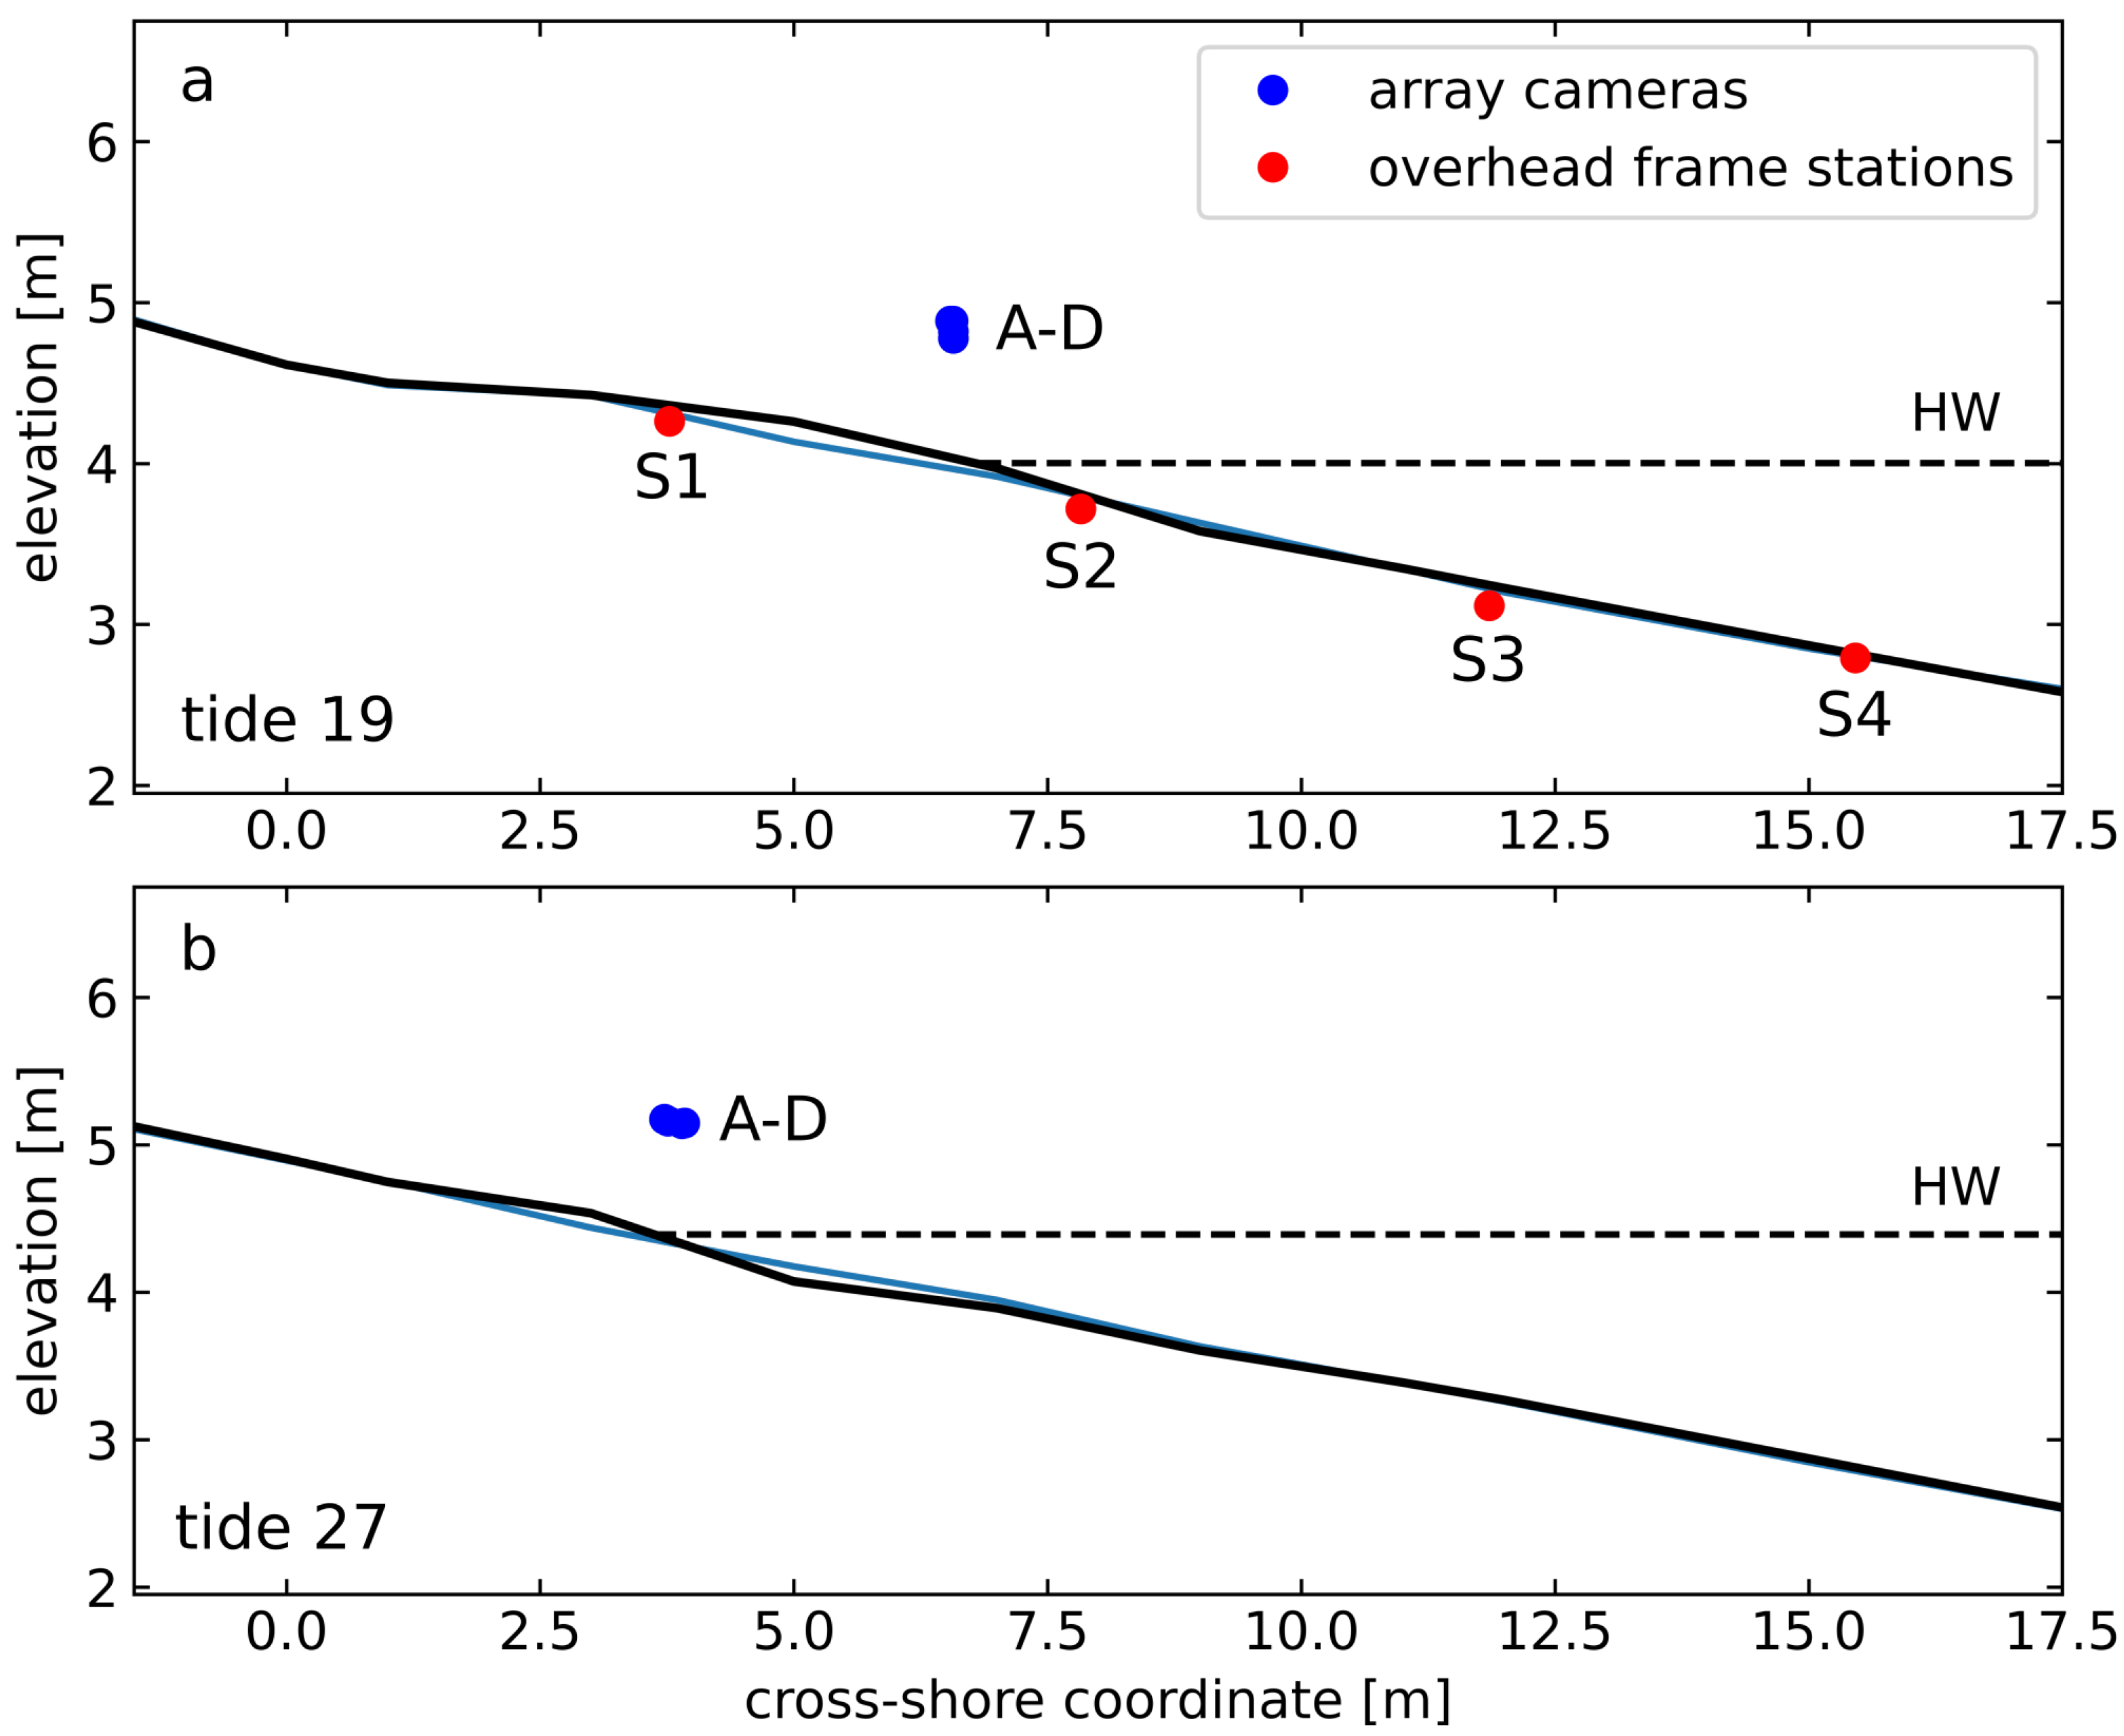
The frame bearing the array of range sensor and camera pairs was deployed during five high tides over the course of the experiment, each characterised by low to moderate energy forcing conditions (significant wave heights less than ca. 0.5 m; see Figure 2). The geometry of the array frame (i.e., the ca. 2 m cantilevered distance of the array elements from the array frame base) meant that the use of the frame was limited to ‘fairweather’ conditions, during which the maximum swash runup distance was less than approximately 4 m. During tides 19 and 27, the array was favourably positioned relative to the high water line (HWL) such that intermittent swash height and bed exposure could be observed for periods longer than one hour without moving the frame. For these cases, time series of the swash thickness, bed level, and image-derived mean grain size are available. During both of tides 19 and 27, a pronounced berm developed near the HWL. The profiles and instrument positions associated with tides 19 and 27 are shown in Figure 7.
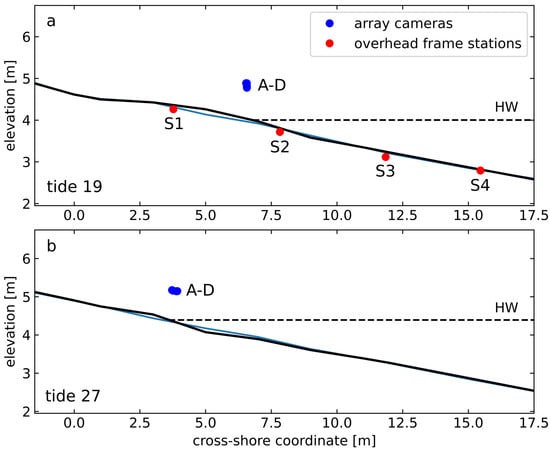
Figure 7.
Profiles of the upper beach for (a) tide 19 and (b) tide 27. Prior and post states at low tide are indicated by the blue and black profiles, respectively. Positions of the range sensor and camera array elements (A–D) are indicated by the blue dots. The four stations (S1–S4) occupied by the overhead camera frame used for cobble tracking are indicated by the red dots (tide 19 only), where each station’s coordinates were estimated using the average of three ground control points within the overhead camera’s field of view.
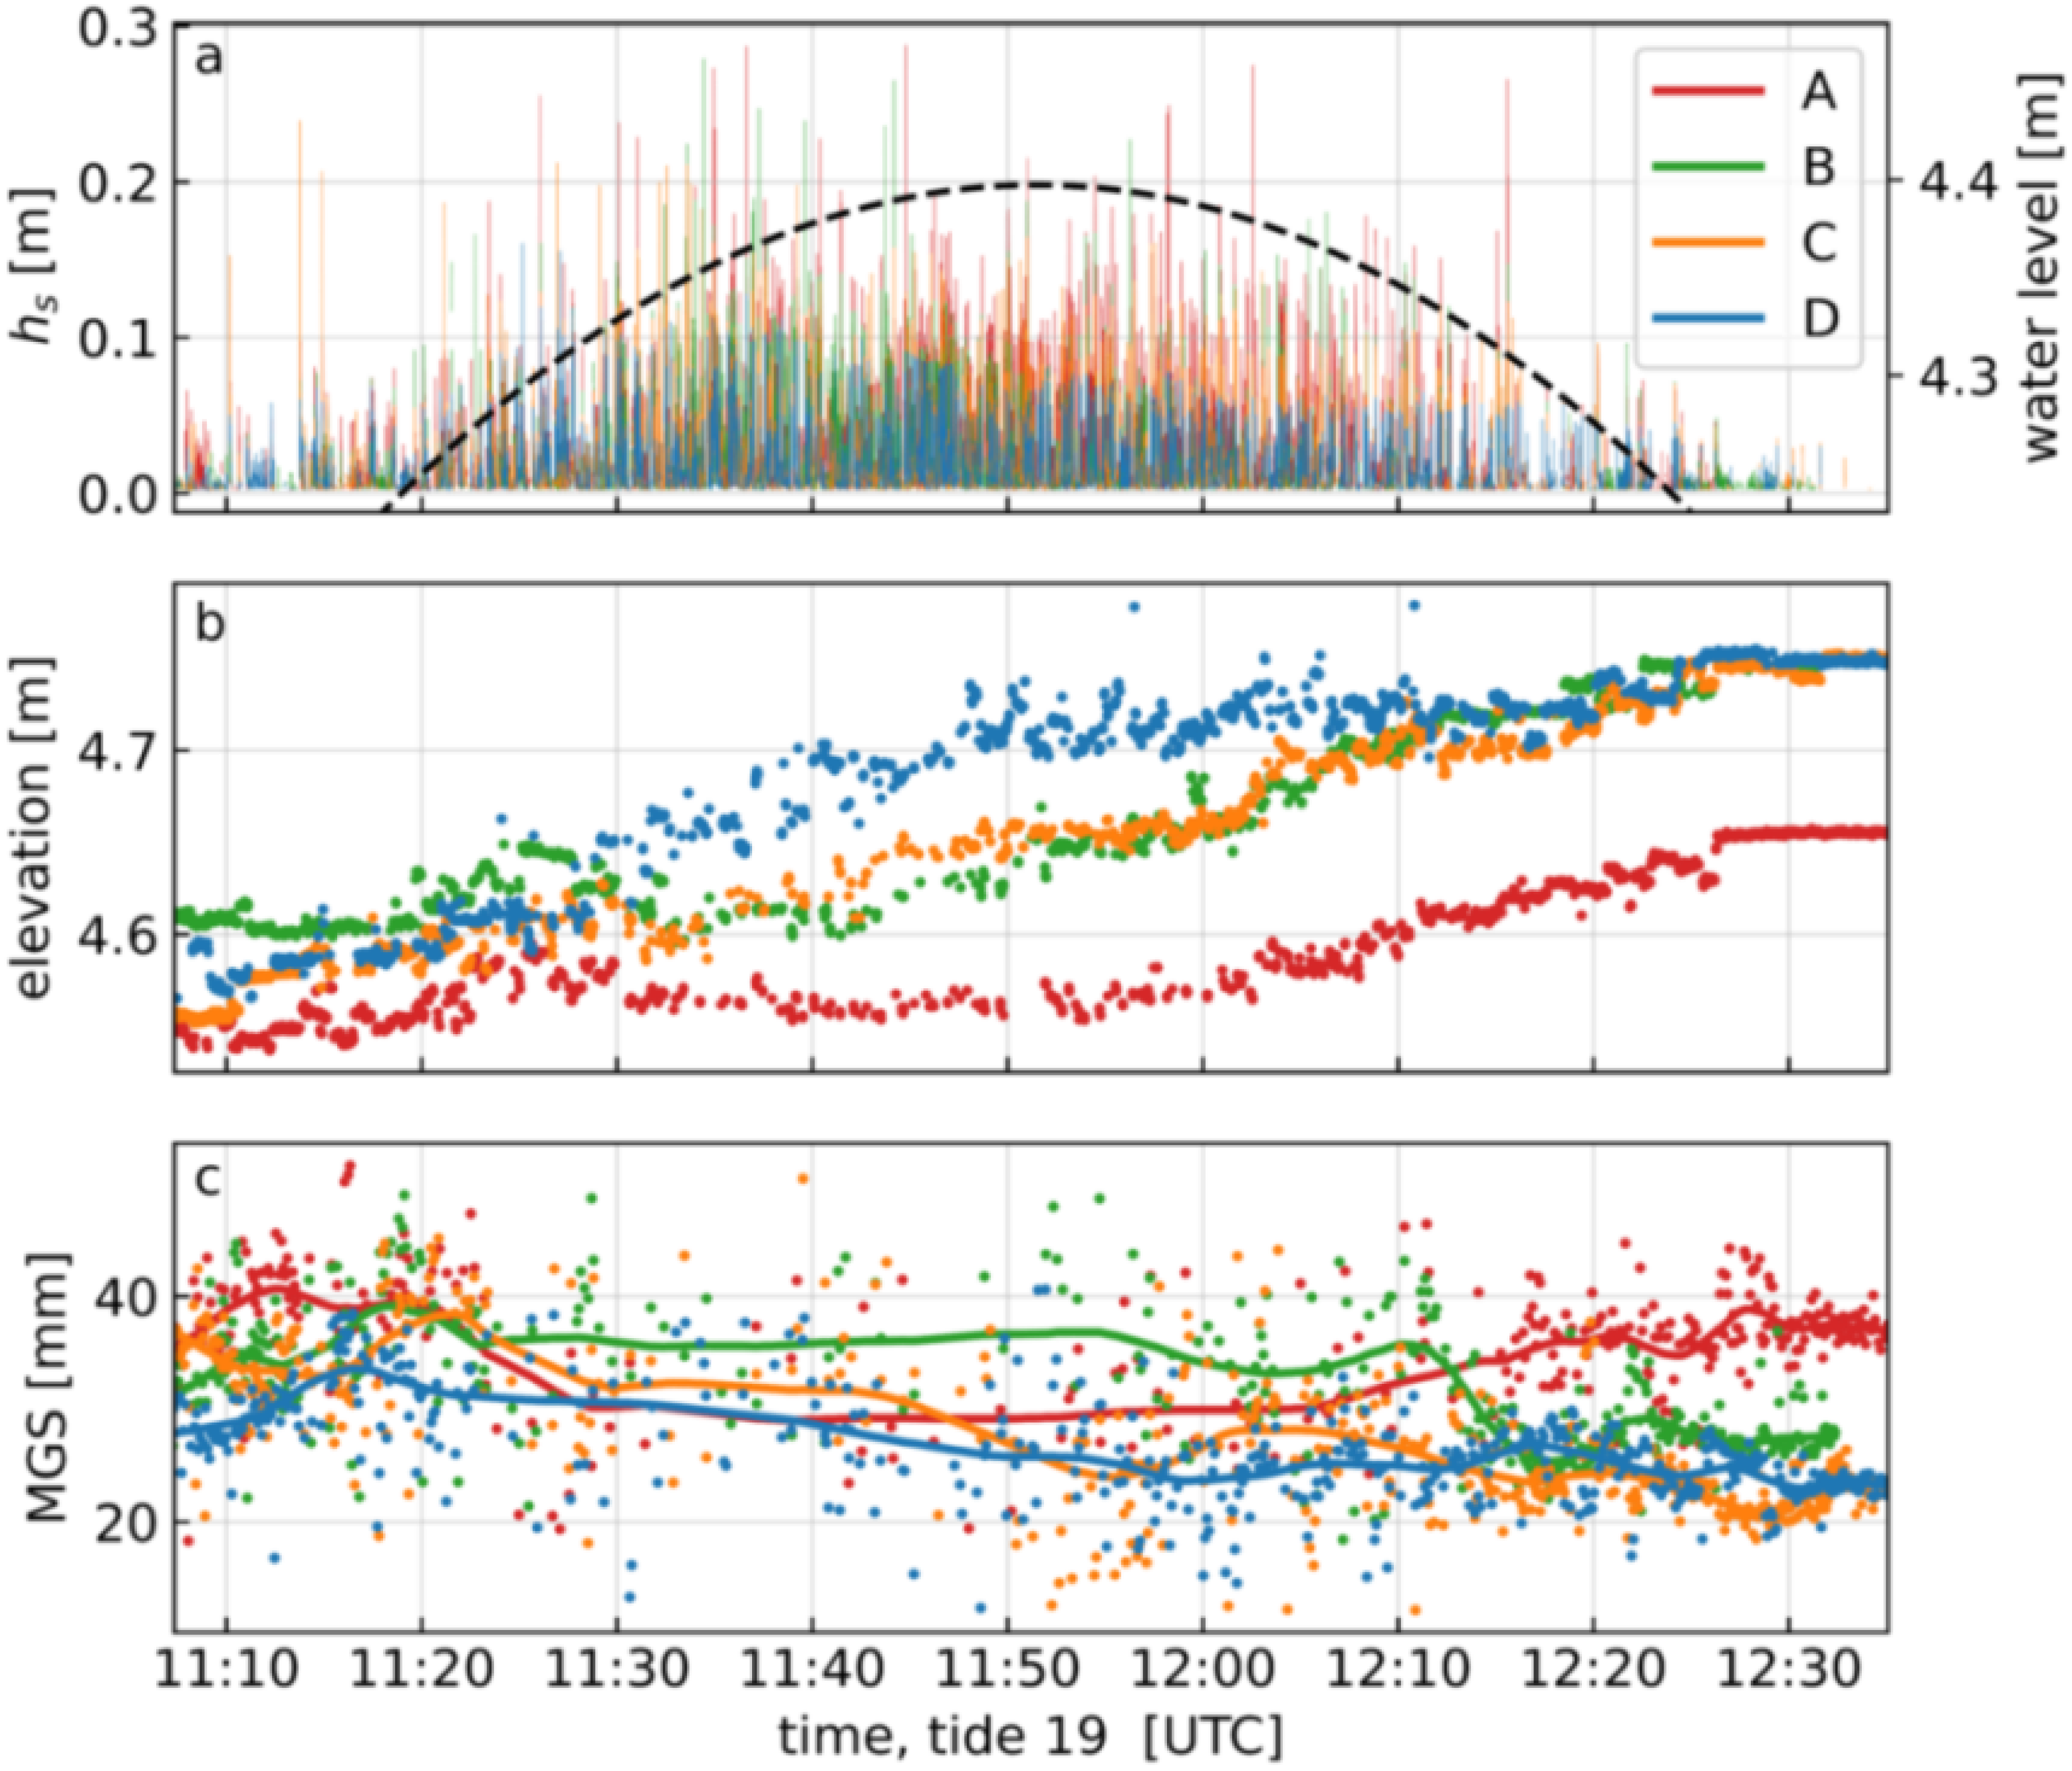
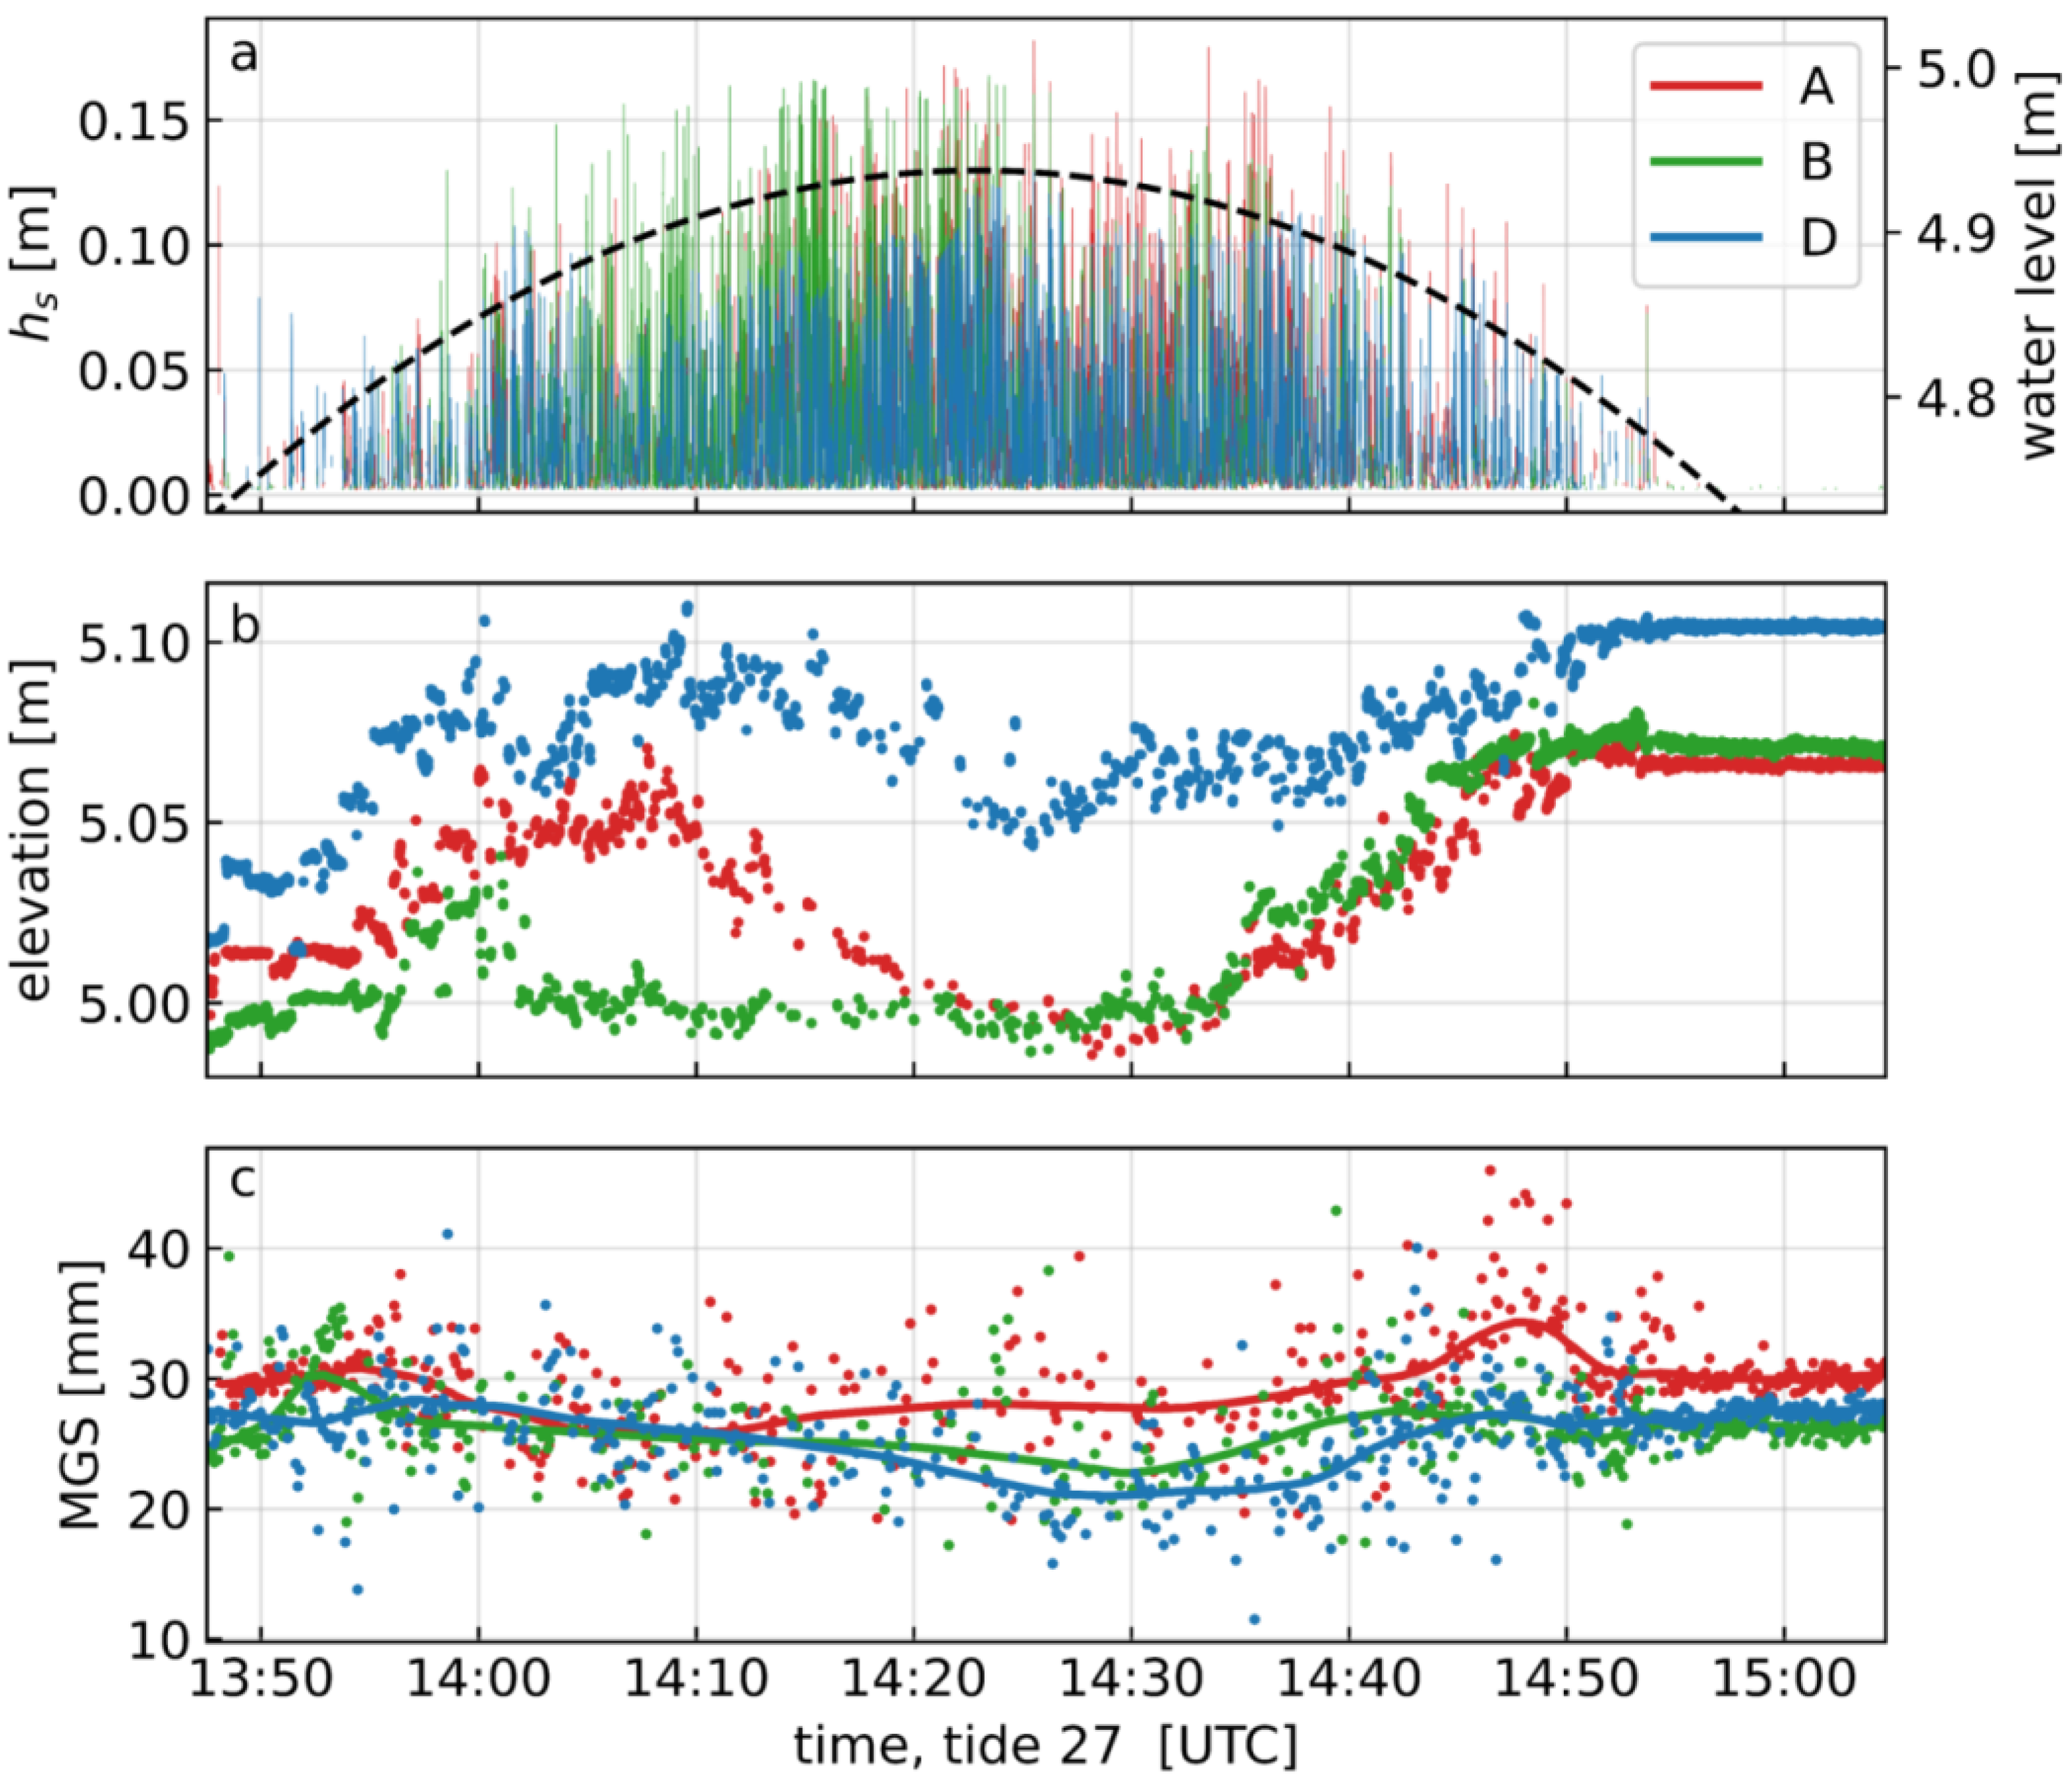
Applying the digital grain sizing algorithm to the images captured by the array enabled the examination of coevolving bed level and mean grain size at the bed beneath each array element. Figure 8 and Figure 9 show time series of the bed level and mean grain size during high tide for tides 19 and 27. The grain size data are inherently noisy, so the individual data points are less valuable than the trends revealed by large numbers of data points. In both cases, the morphological context was the formation—and for tide 27 the formation and shoreward translation—of a high tide berm. Visual inspection of the time series indicates that bed level and mean grain size tend to co-vary.
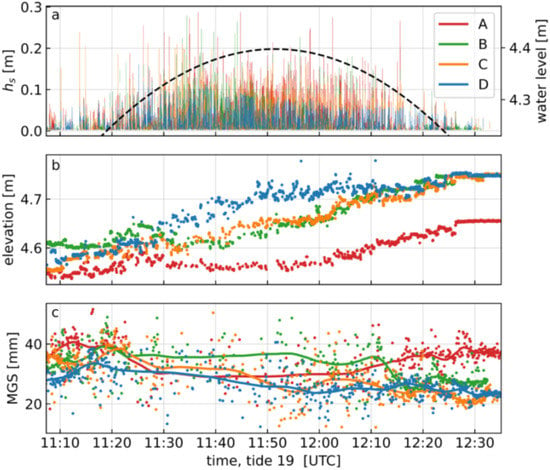
Figure 8.
Time series of (a) swash height, (b) bed level, and (c) mean grain size during high tide for tide 19, from the data recorded by the range sensor and camera array elements (A–D), oriented alongshore. The solid lines in (c) are locally-weighted (loess) regressions using a ca. 10 min averaging window.
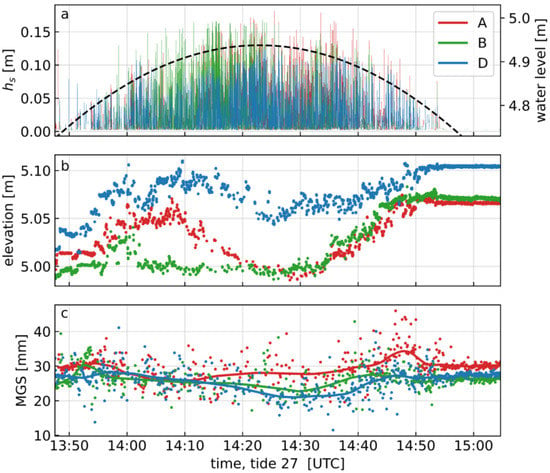
Figure 9.
Time series of (a) swash height, (b) bed level, and (c) mean grain size during high tide for tide 27, from the data recorded by the range sensor and camera array elements (A–D), oriented alongshore. The solid lines in (c) are locally-weighted (loess) regressions using a ca. 10 min averaging window.
During tide 19, coarse material accumulated near the HWL, initially in a mound directly beneath array element D (Figure 8). The mound initially resembled a developing cusp horn, though its alongshore extent widened over the following tens of minutes, becoming steeper in the offshore direction and more berm-like. An incipient topographic low existed beneath array element A. By early ebb tide, a more longshore uniform berm had formed. The berm beneath the array sloped downward alongshore to the south (note the elevation differences between the array elements A and D), with a maximum elevation increase of nearly 20 cm beneath the array element D. The grain size time series are noisy and sparsely sampled, especially at high tide (i.e., between 11:30 and 12:00) due to the more frequent swash events. However, common trends can be noted: namely, the upward trend in mean grain size as the swash zone first reached the sampling region (11:10–11:20), which precedes the onset of the upward trend in the bed level time series. Fining of the surficial sediments under array element A following the initial coarsening trend is also evident, and corresponds to a similar, but lagged, trend in the bed level time series.
During tide 27, a berm began to form seaward of the HWL (note the increase in bed elevation in Figure 9, 13:50–14:10). As the swash zone migrated landward, coarse material was pushed over the berm crest, leading to a shoreward migration of the berm by roughly 2 m. The decrease in bed elevation between 14:10 and 14:30 is a result of this berm translation. During early ebb tide, coarse material began to accrete on the seaward face of the berm, leading to the bed elevation increase observed between 14:30 and 14:50. The mean grain size was initially coarse (ca. 30 mm) in all three of the sampled locations, but shows a downward trend in two of the three cases. Fining occurred in all cases after the initiation of berm growth seen in the bed level time series. In all cases, the minimum mean grain size occurred at or just after high tide, when the sampling location was near the mid-swash zone, and also nearest the base of steep berm face. Bed surface coarsening coincided with the increase in bed level on the seaward face of the berm during early ebb tide. The absence of data from array element C in Figure 9 is a result of damage to the SD card used for data logging during demobilisation of the instruments.
A phenomenon that was often observed, both visually and in the grain size time series, was the shoreward migration of a band of coarse material at the top of the swash zone during late flood tide (i.e., the ‘bumps’ in the mean grain size time series in Figure 8 and Figure 9). Similarly, a coarsening of the substrate was generally observed at the seaward edge of the swash zone during early ebb tides. Surficial fining was generally observed nearer the mid-swash zone. This fining is apparent in both Figure 8 and Figure 9.
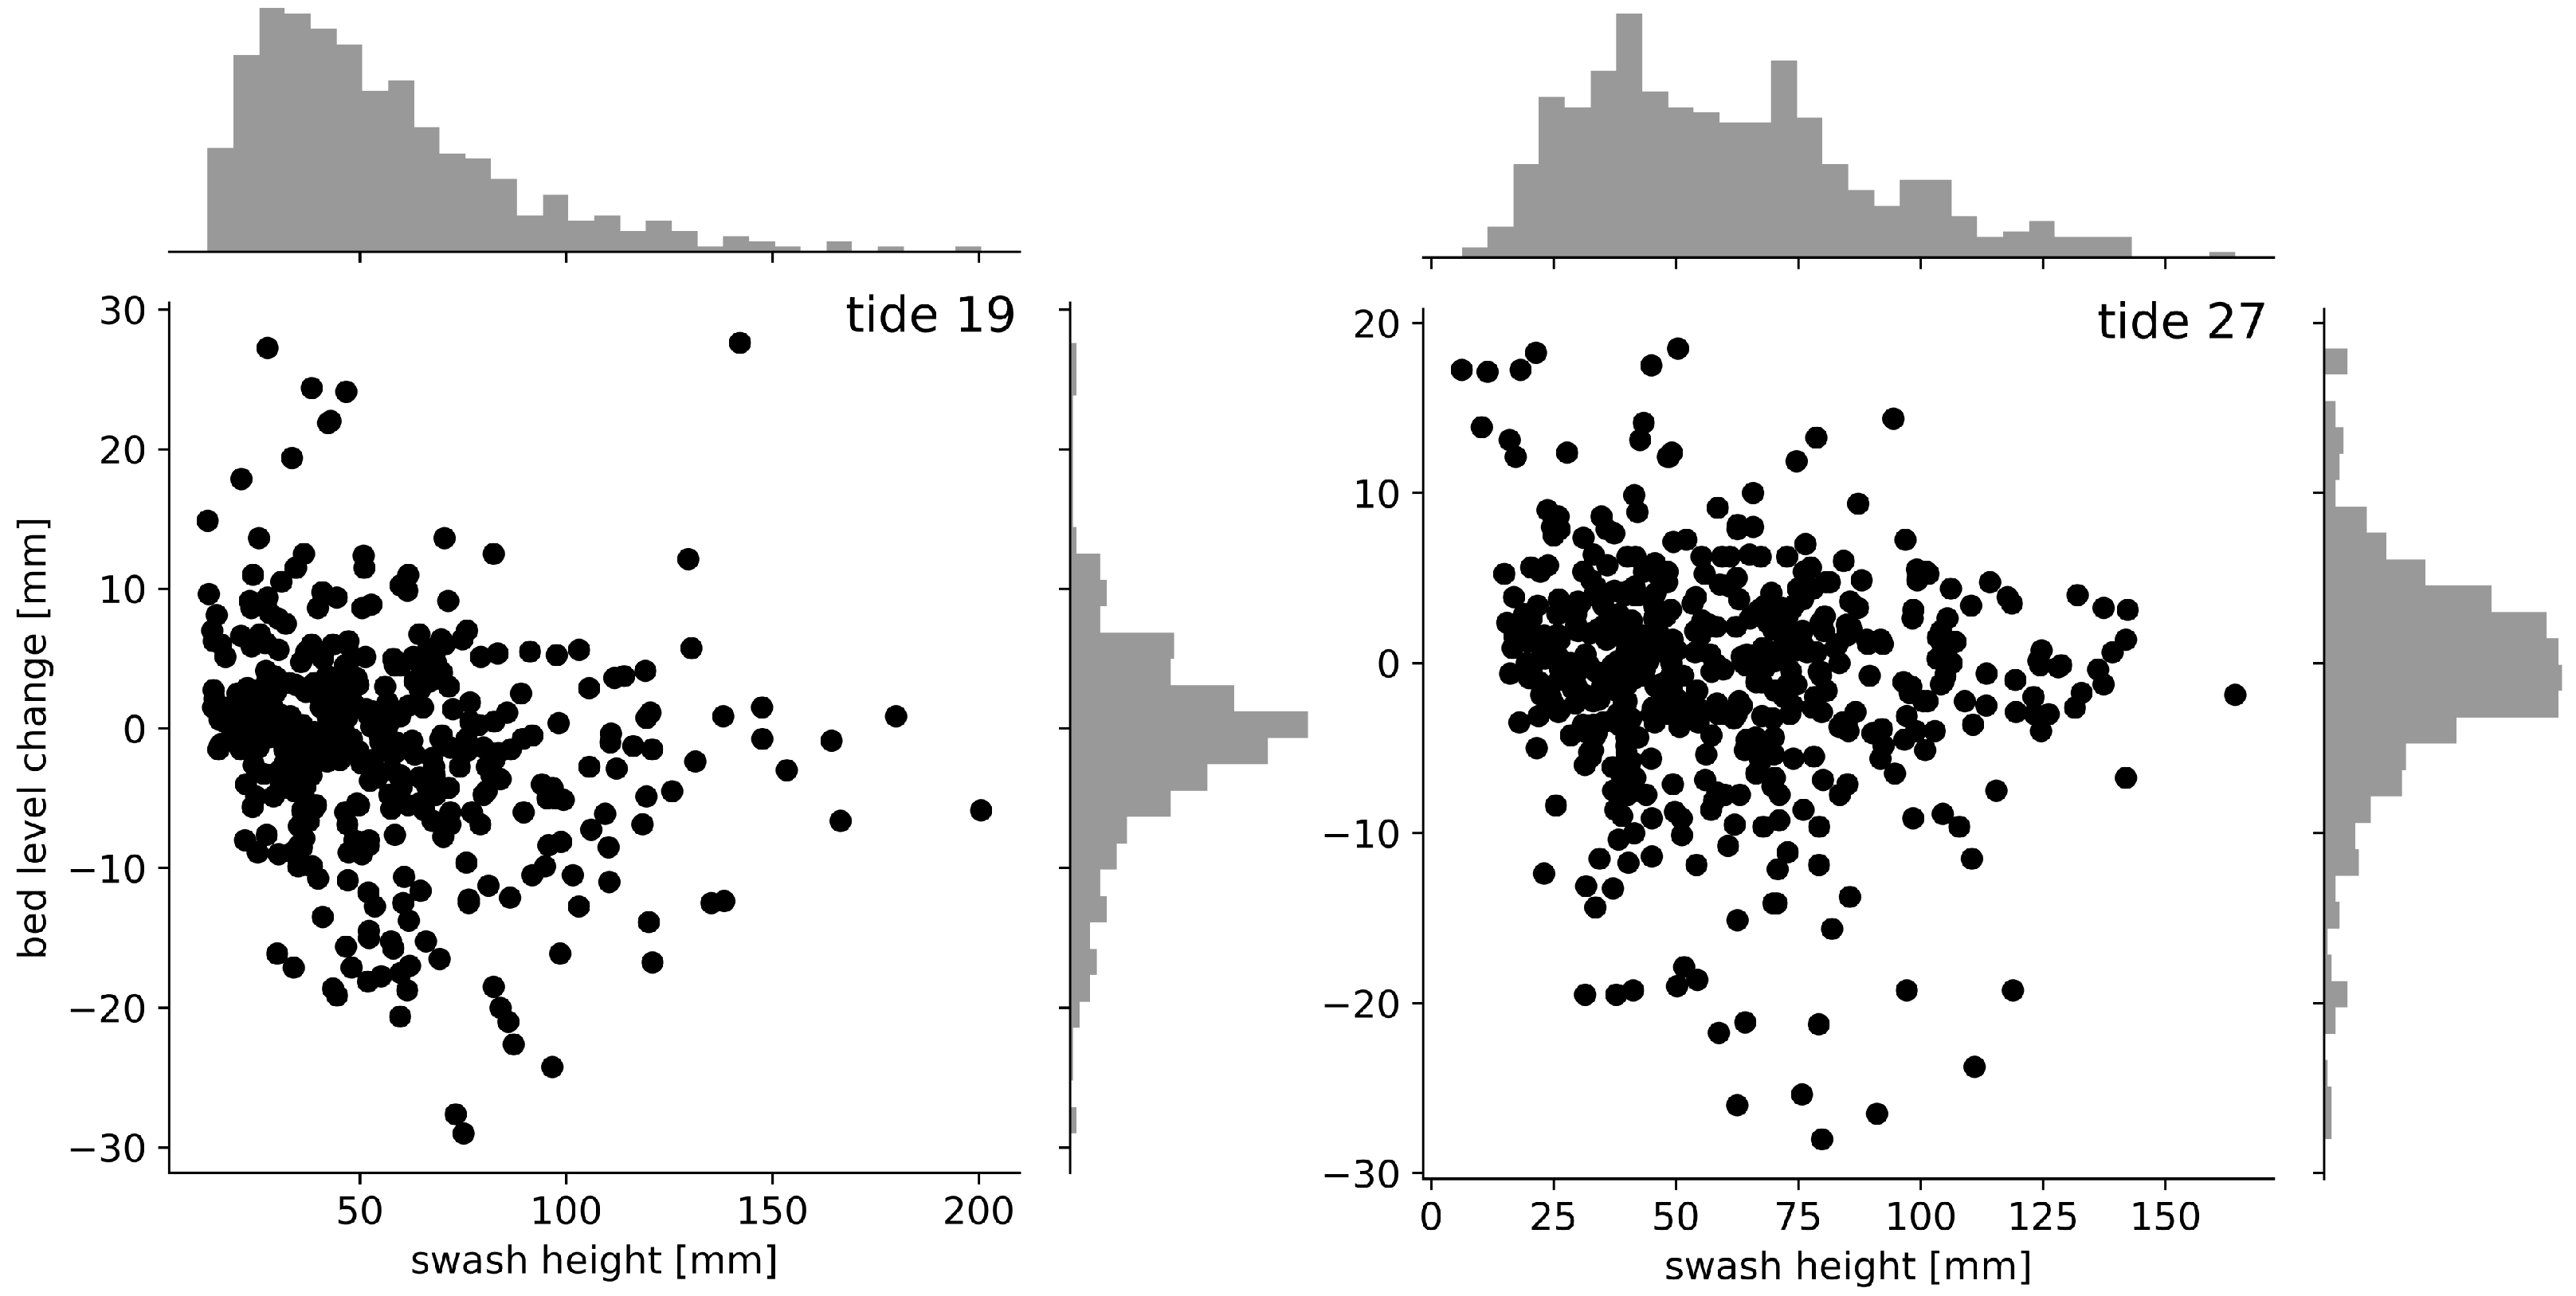
The distribution of bed level changes (Figure 10) shows that the majority of changes between swash events were near zero. The larger changes—both positive and negative—are loosely approximated by a Gaussian distribution, though with higher kurtosis values (kurtosis of 5.1 and 5.4 for tides 19 and 27, respectively, relative to a value of 3 for a Gaussian distribution). This finding is consistent with similar analyses in the literature [3,7,8,10], which have demonstrated that bed level change over the course of a tidal cycle is the result of the cumulative effect of many instances of small accretion and erosion. The joint probability distributions of the swash height and bed level change associated with each swash event indicate that bed level change and swash height are largely uncorrelated.
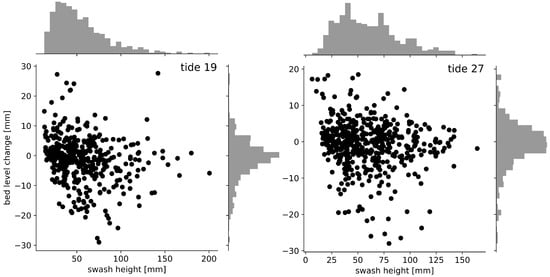
Figure 10.
Joint distributions of bed level change between swash events and swash height during high tide for tide 19 (left) and tide 27 (right). Data from all four sensors are included. The grey histograms indicate probability densities.
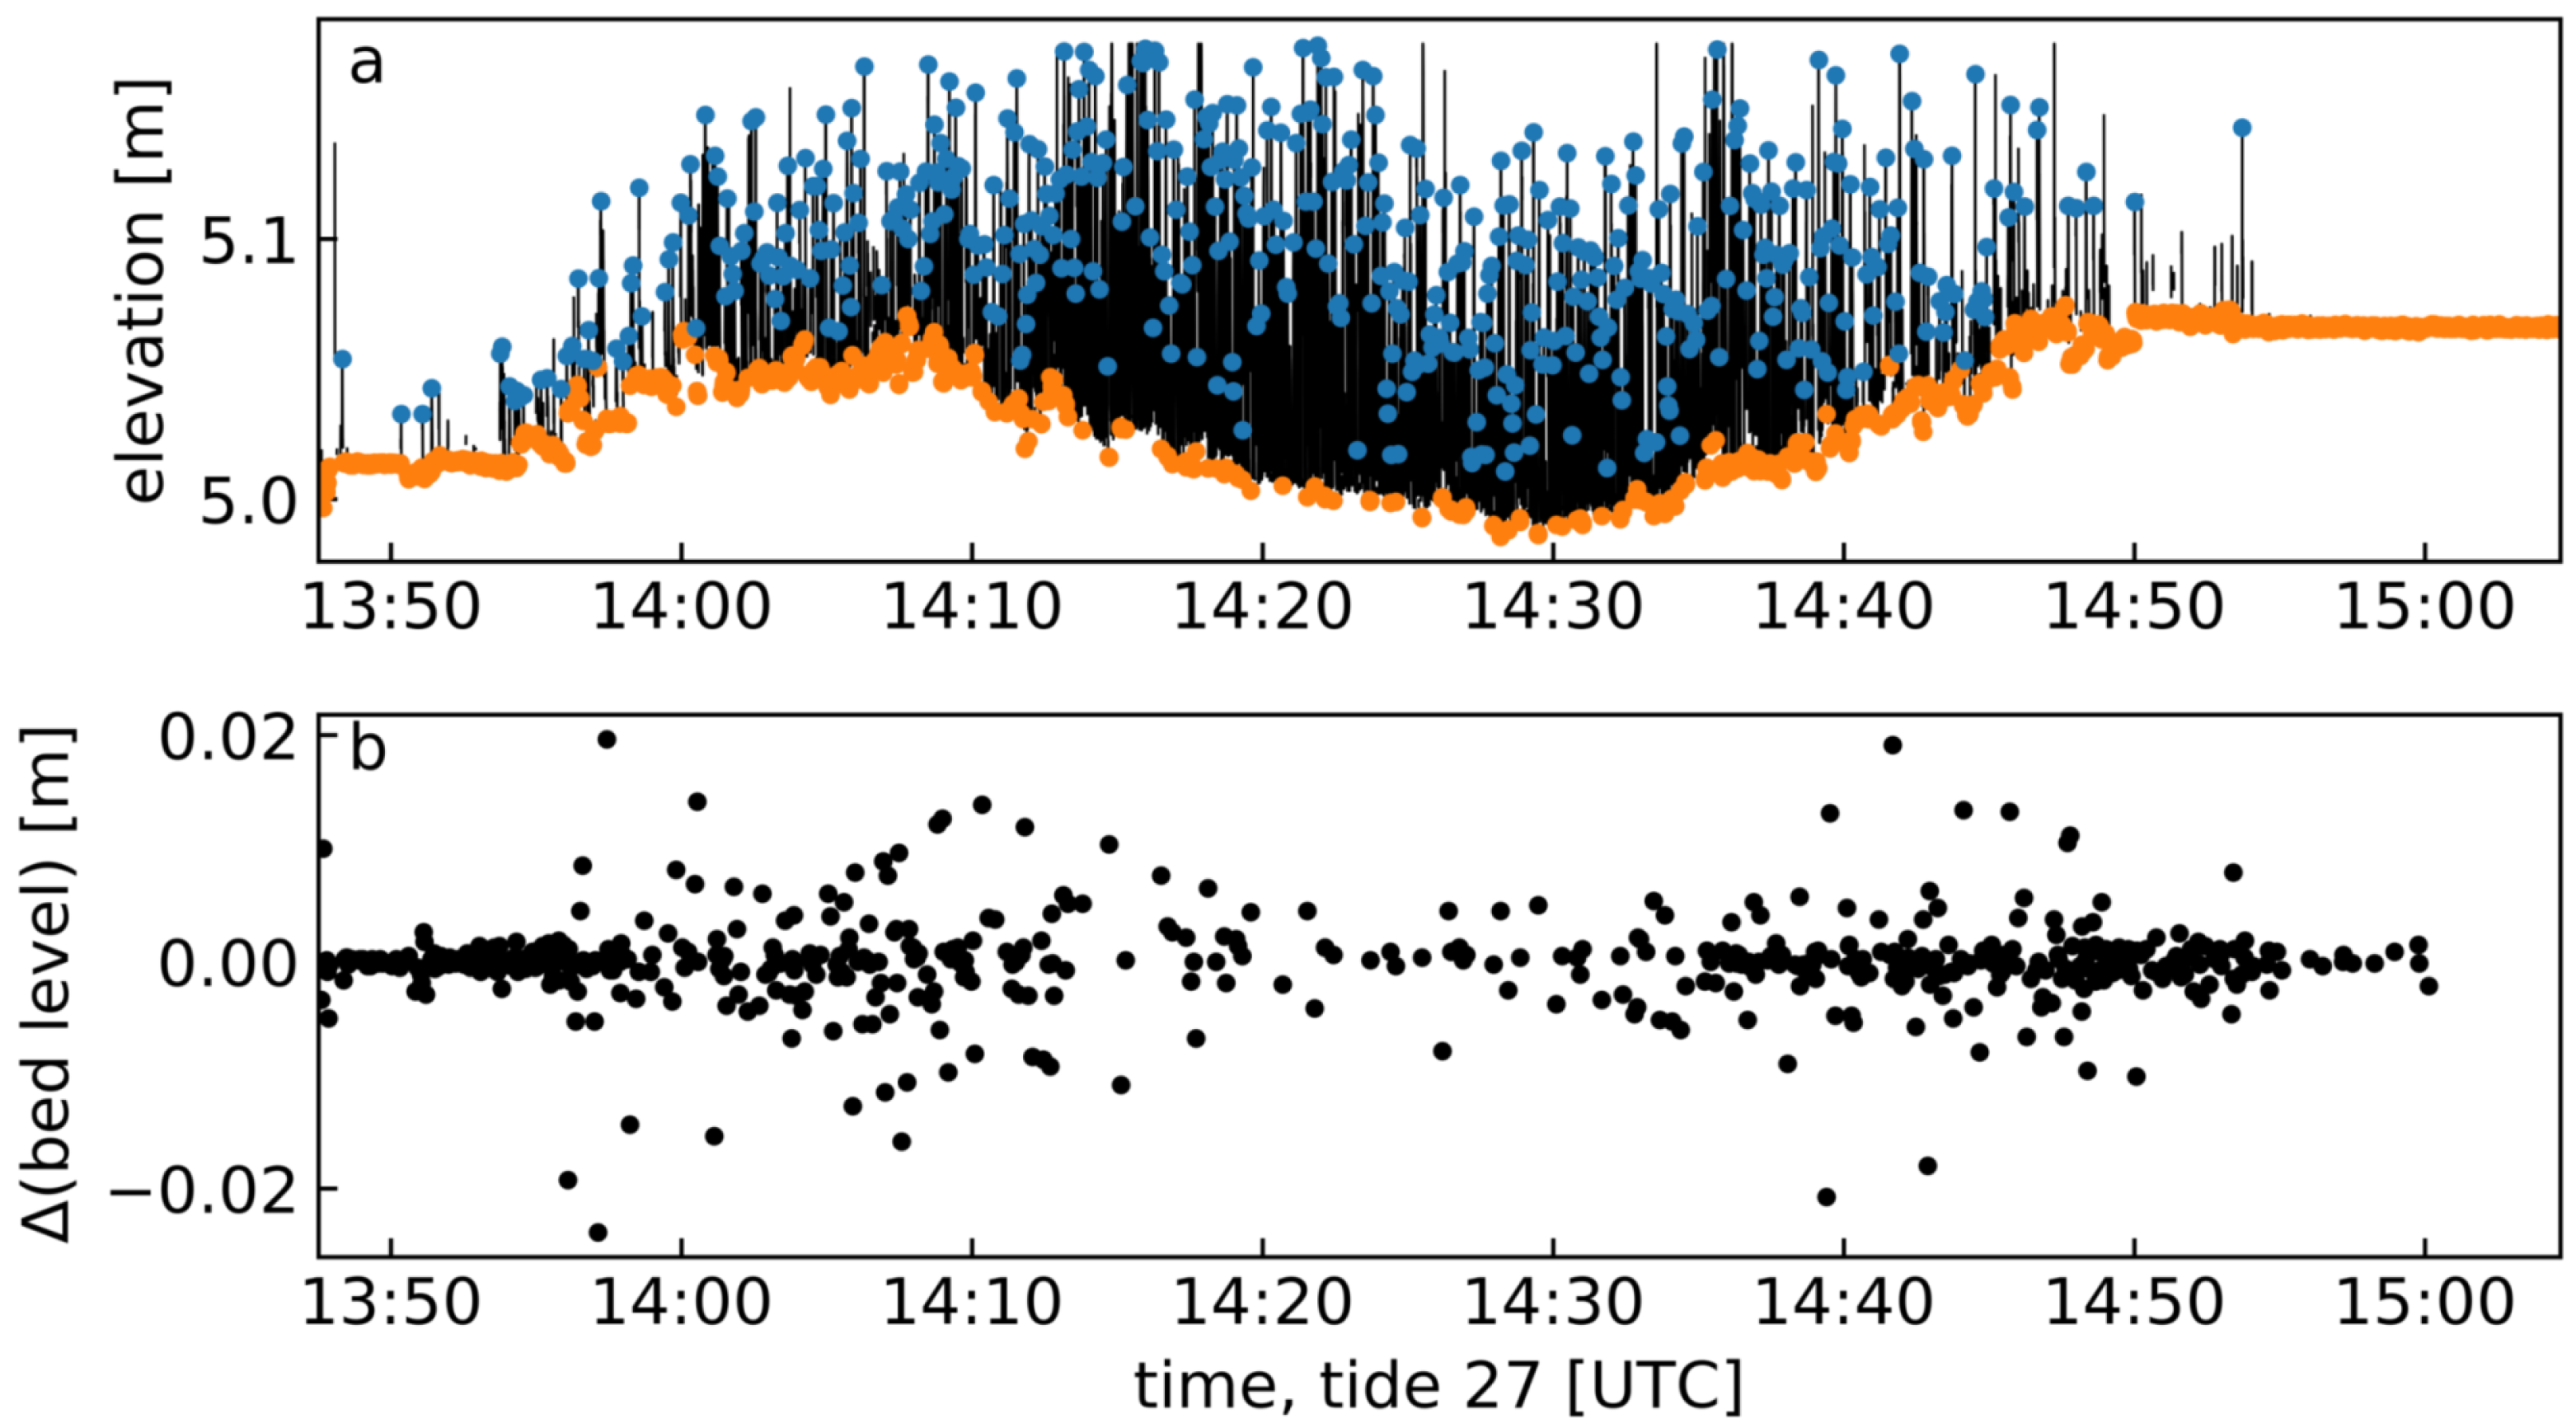
Figure 11 shows time series of swash height, bed elevation, and the change in bed elevation during the high tide for tide 27. The magnitude of bed elevation change is largest when bed elevation was higher (i.e., near the beginning and end of the time series). This may be due to the larger mean grain sizes associated with the coarse lag at the leading edge of the swash during flood tide, and the accretion of coarse material on the seaward face of the berm during ebb.
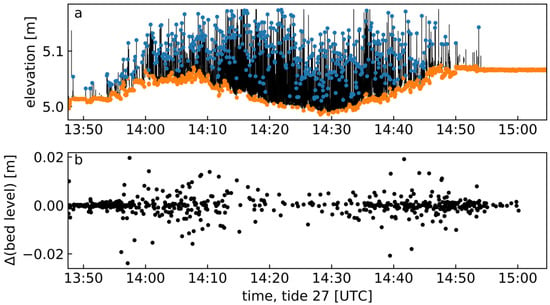
Figure 11.
(a) Time series of swash height and bed level during tide 27 recorded by array element A, and (b) the change in bed level between swash events over the period corresponding to (a).
3.2. Cobble Dynamics
Cobble trajectory statistics were computed from data associated with tide 19. Video datasets of cobble transport in the swash zone were collected at four locations in the cross-shore (i.e., four distinct mean shoreline positions; see Figure 7) during high tide and early ebb:
- Station 1 (S1): at high tide, when the shoreline position was nearest to the HWL. Here, the tracer cobbles were deployed atop the coarse berm material. The camera’s cross-shore field of view spanned 3.5 to 7 m in local cross-shore coordinates, and contained almost entirely coarse berm material. Note that this is the station associated with the images in Figure 4.
- Station 2 (S2): 45 min after high tide. The shoreline and swash zone coincided with the region immediately seaward of the coarse berm. Coarse berm material was present in the landward one third of the camera’s field of view, which spanned from 8.5 to 12 m (i.e., 5 m seaward of S1). The cobbles were deployed in the mid-swash, over a combination of the coarse seaward face of the berm and the finer material farther seaward.
- Station 3 (S3): 75 min after high tide. The swash zone no longer coincided with any coarse-grained berm material, and the substrate was predominantly fine-grained and uniform. The cobbles were deployed near mid-swash and mid-camera field of view: i.e., 12.5 to 16 m across-shore (9 m seaward of S1).
- Station 4 (S4): 85 min after high tide, with the bed conditions and the cobble deployment being similar to those described for S3. The cross-shore field of view of the camera in this location was 15.5 to 19 m (12 m seaward of S1).
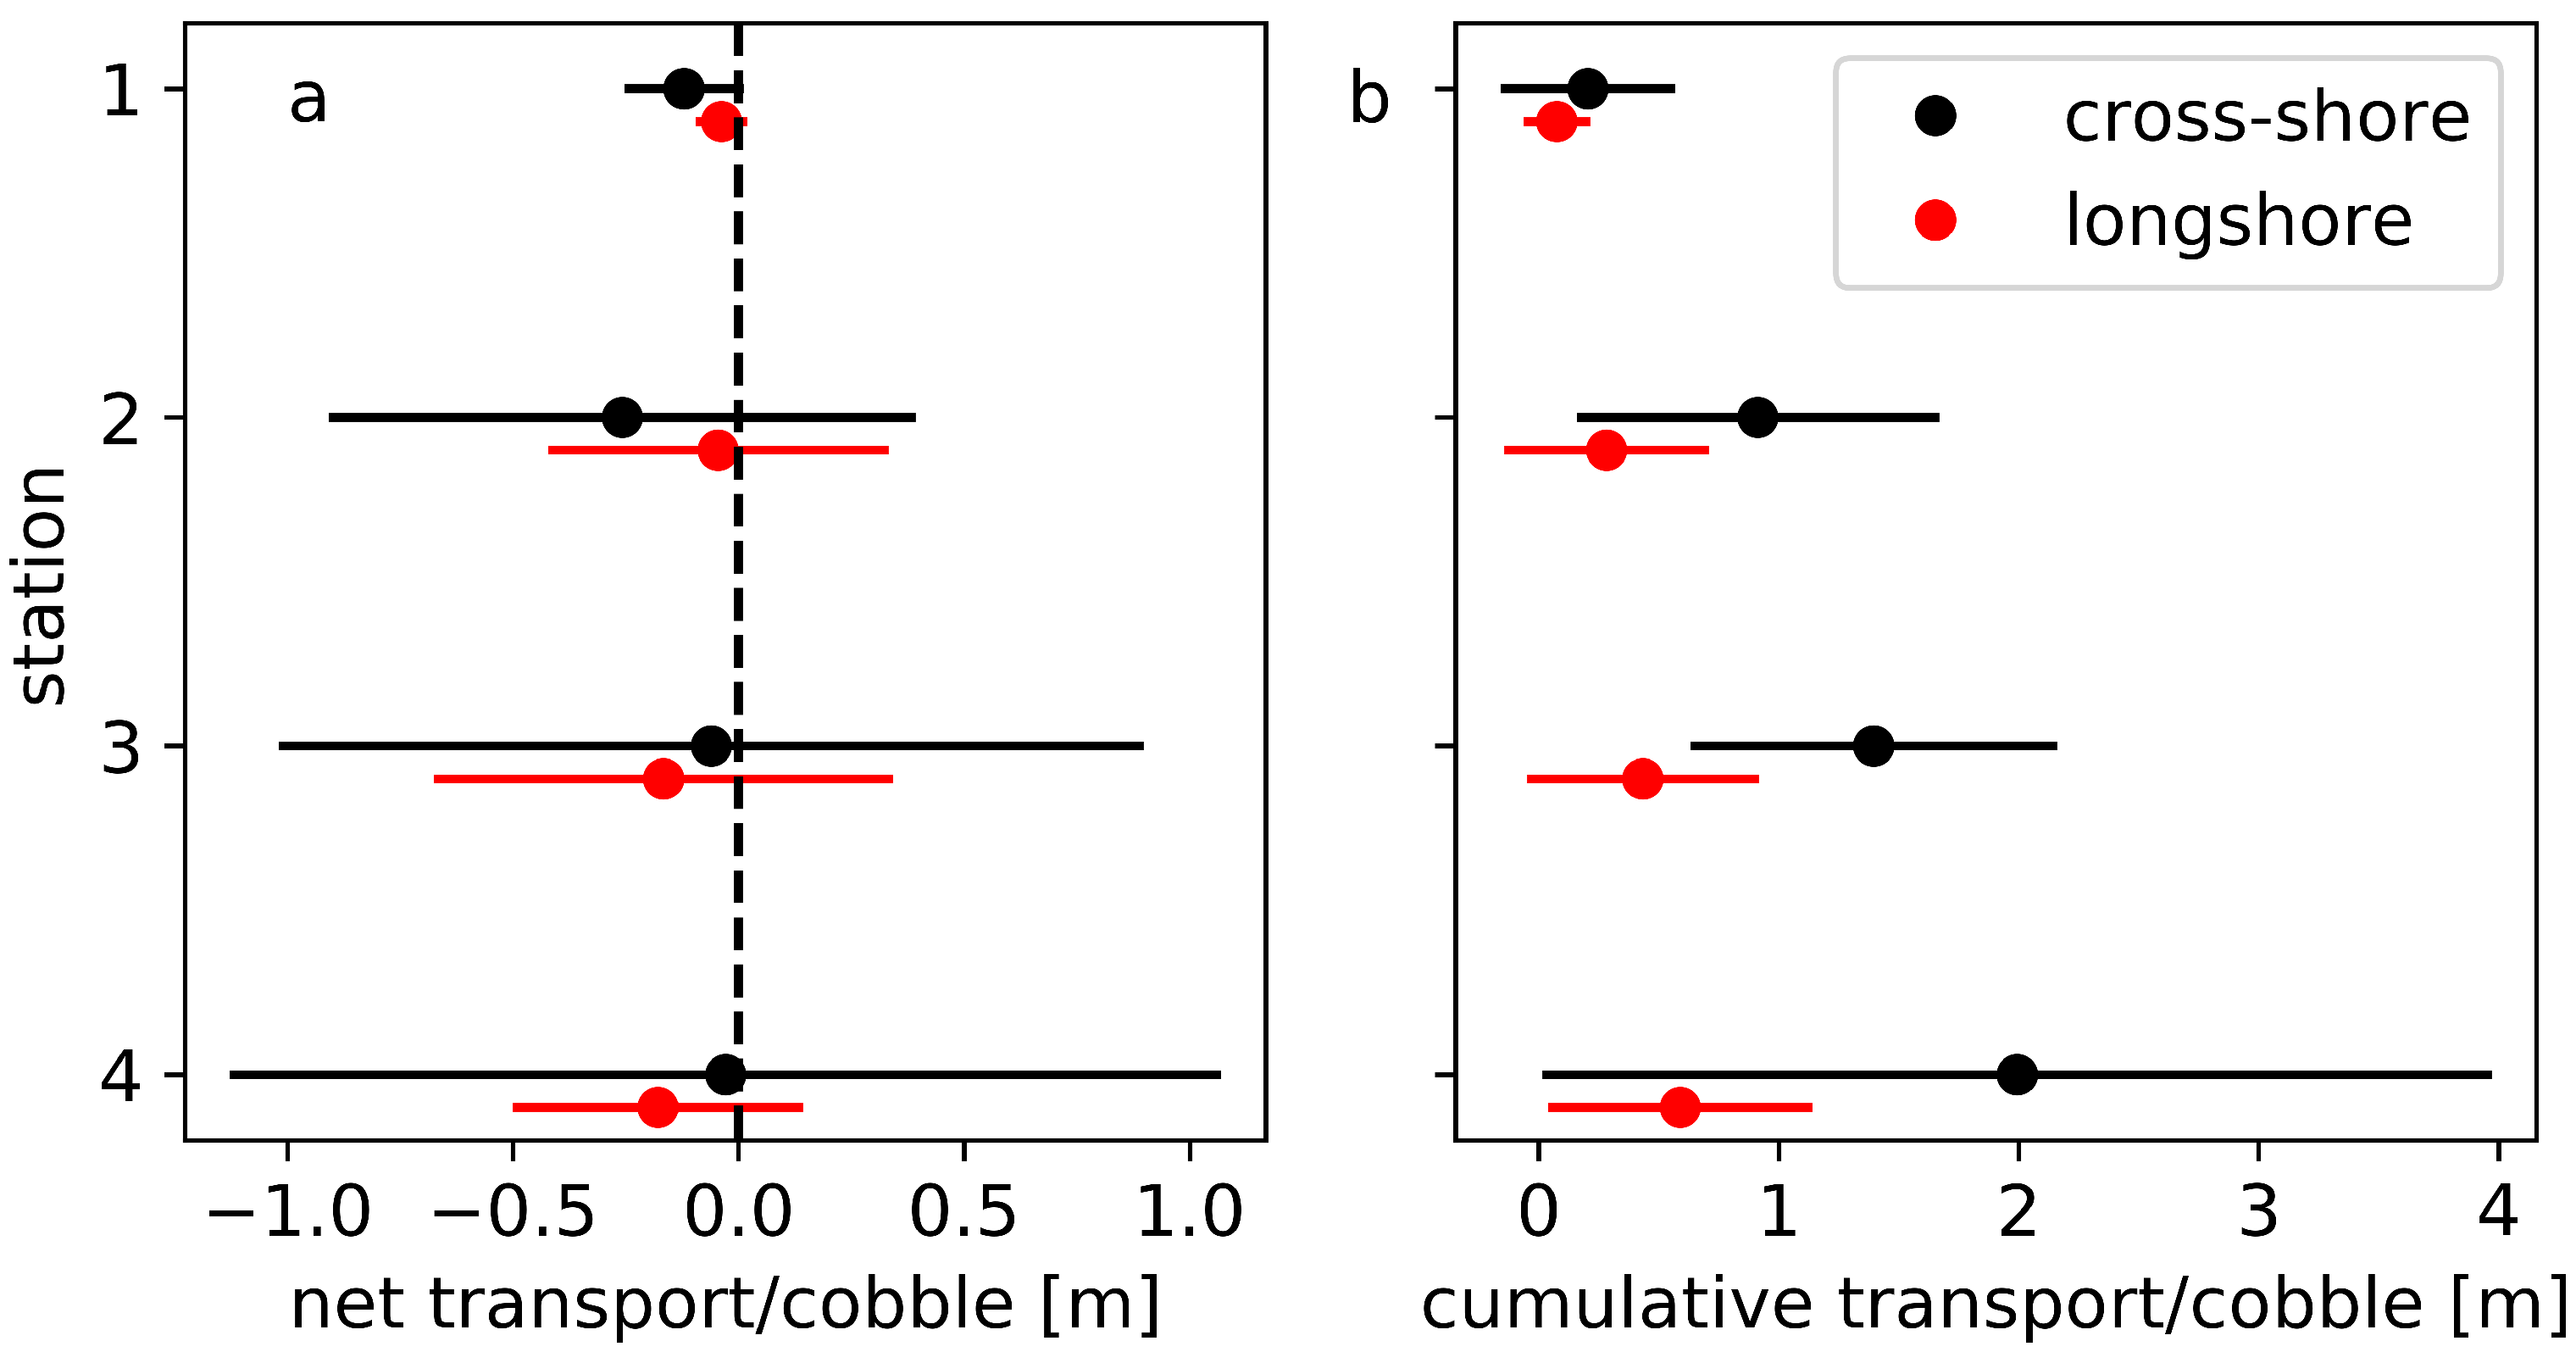
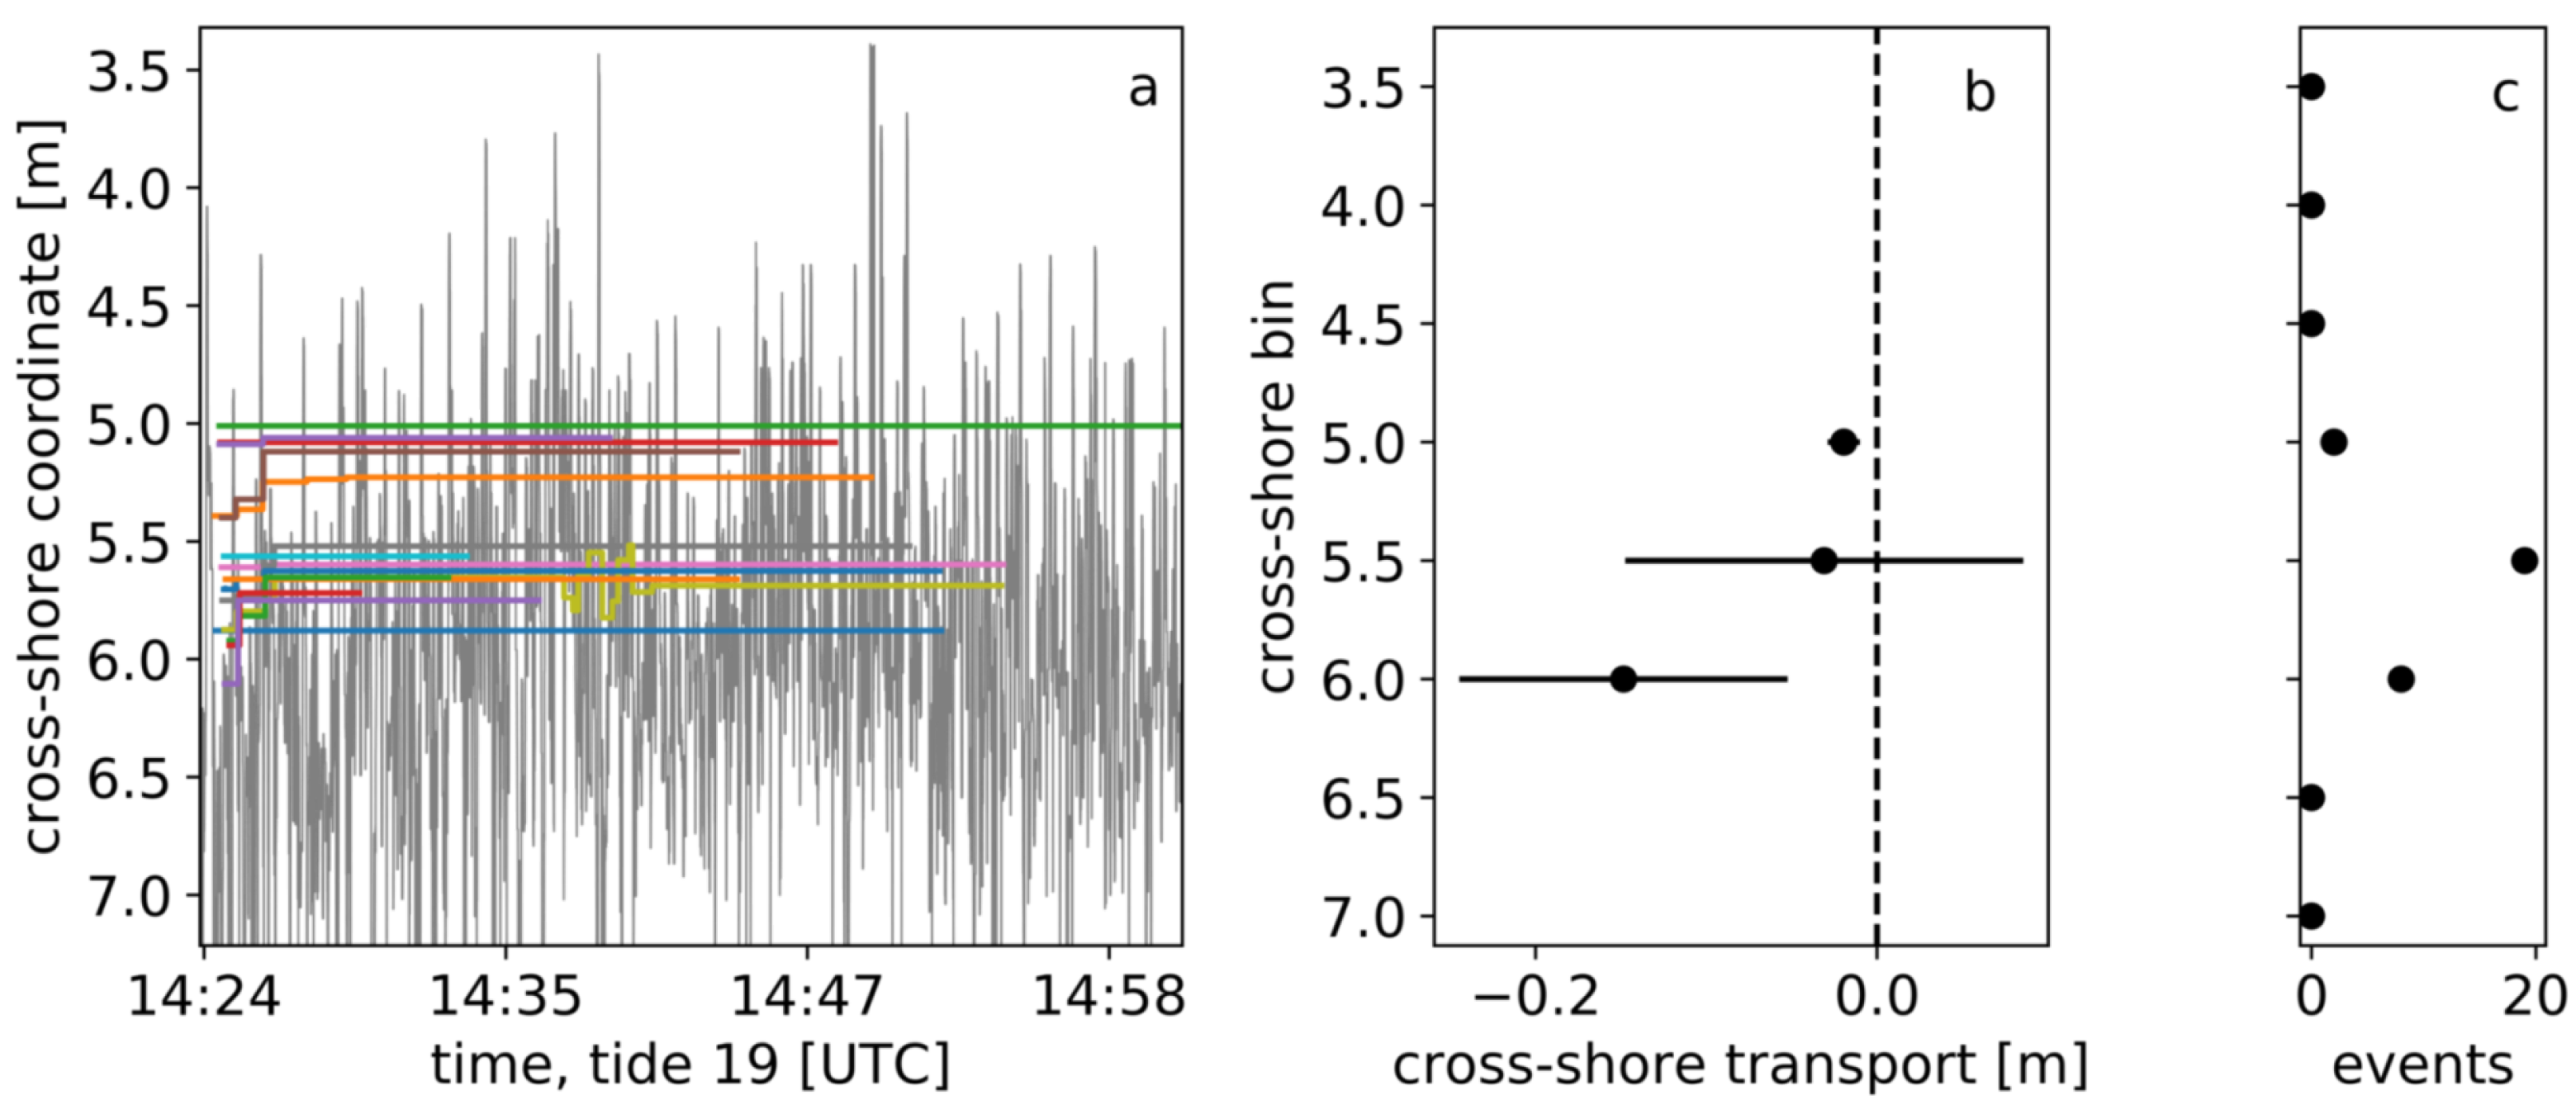
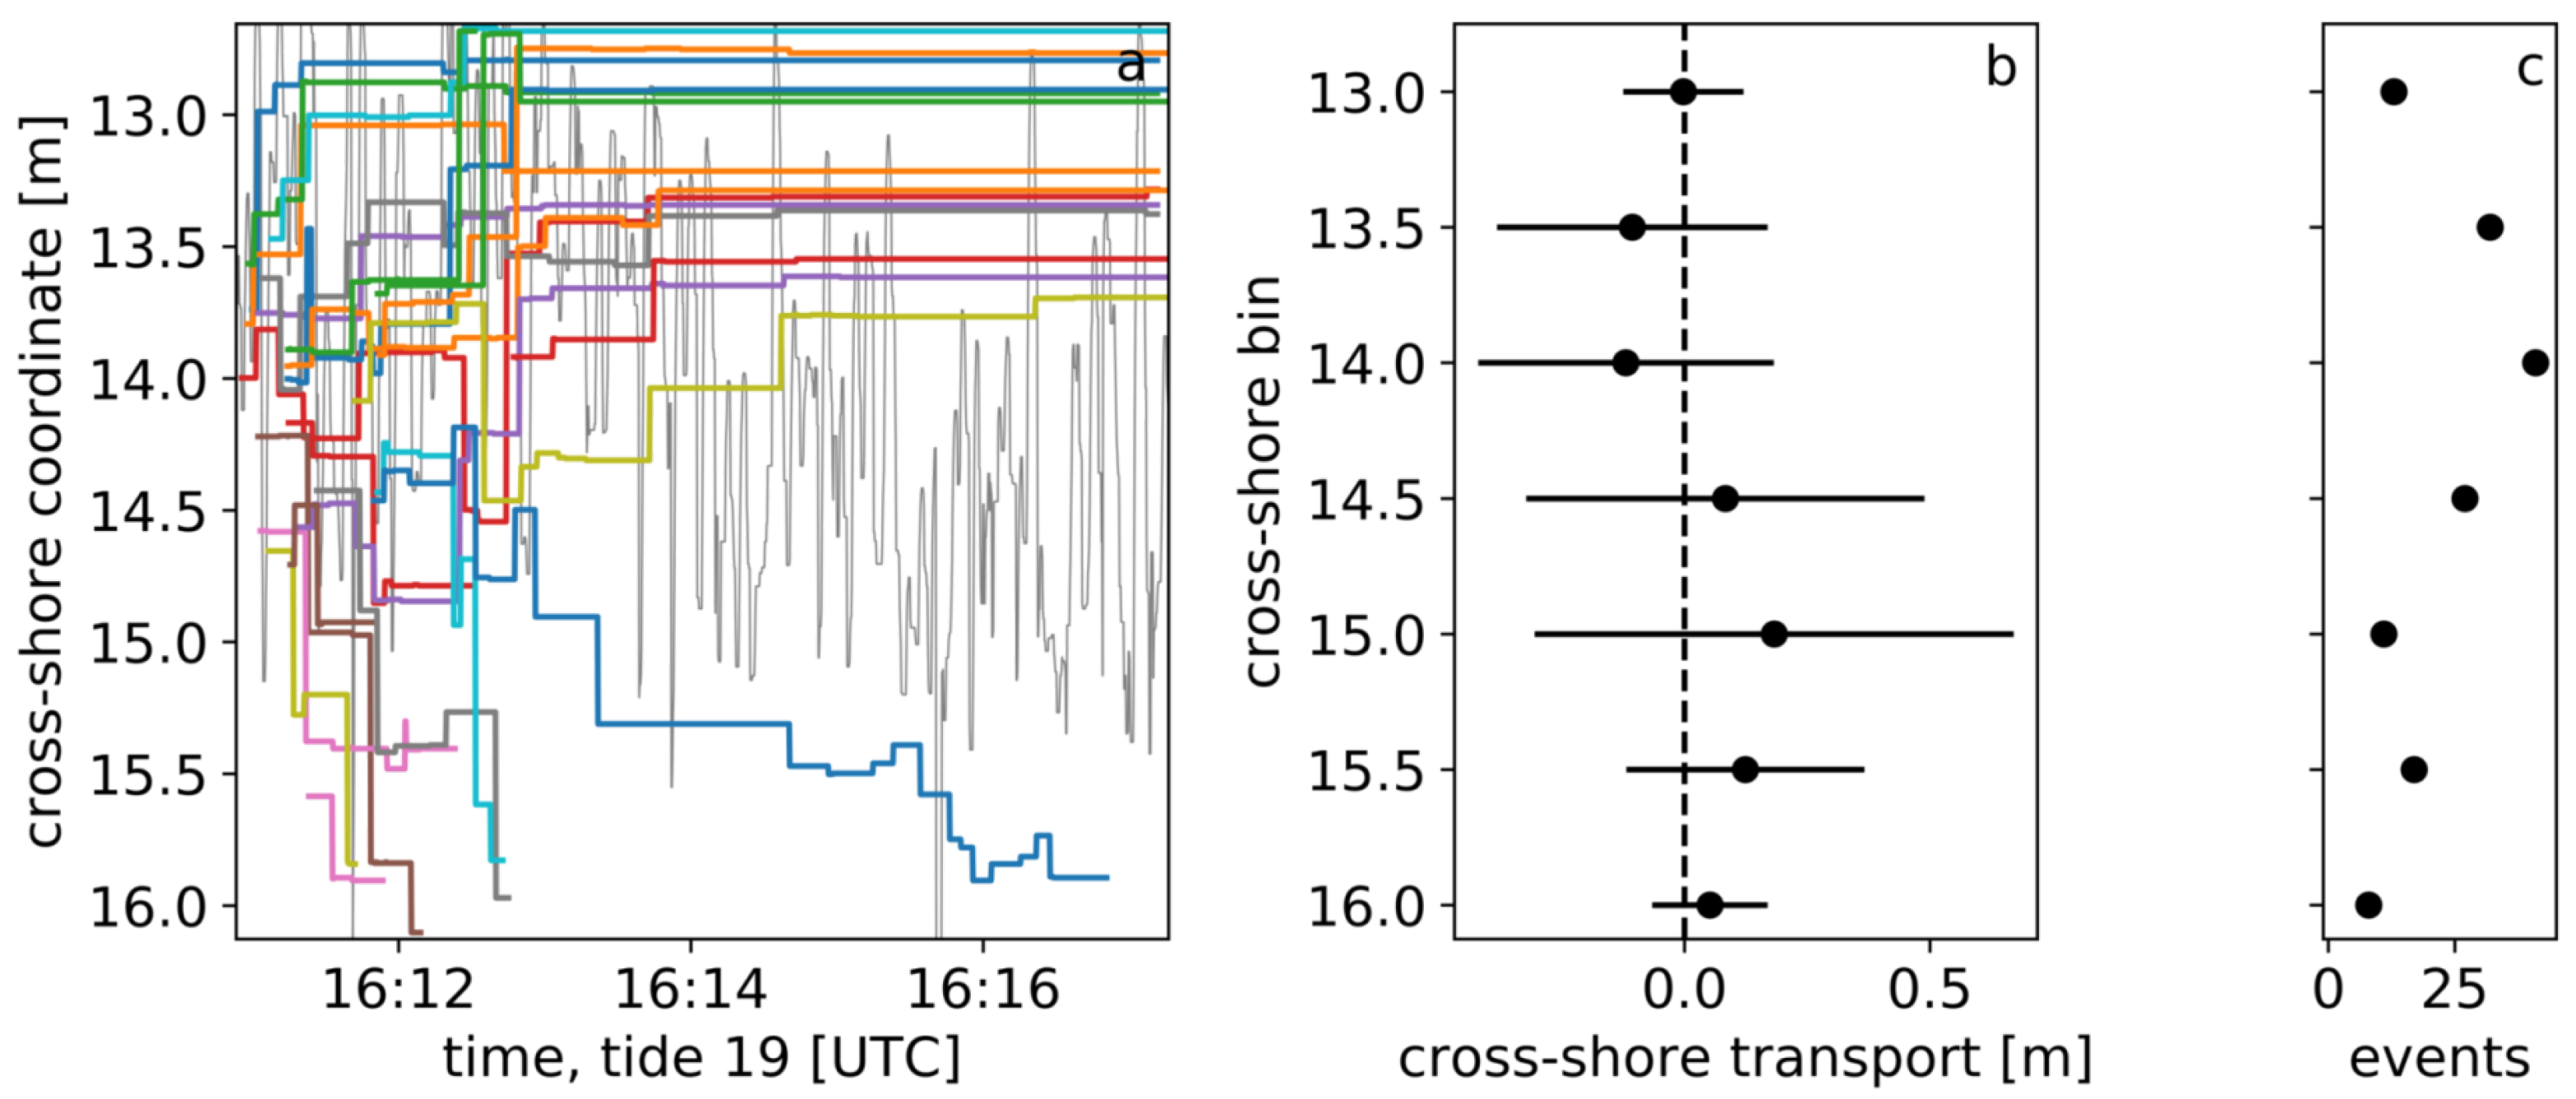
The net and cumulative transport statistics for the four stations are summarised in Figure 12. The net cobble transport was shoreward at S1 and S2, where the substrate consisted mostly of coarse-grained berm material. At S3 and S4, where the bed surface was predominantly fine-grained, the net transport was near zero, but with a high degree of variation between individual cobbles. The cumulative transport of cobbles increased to seaward (i.e., cobbles were more mobile where the mean shoreline position was farther to seaward), corresponding to a decrease in coarse-grained material in the swash zone substrate. Longshore transport was small in comparison to cross-shore transport at all stations, consistent with previous observations at Advocate Beach [18].
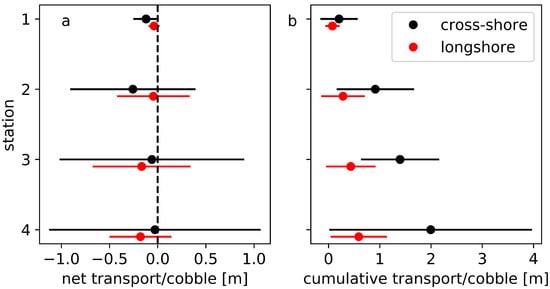
Figure 12.
Mean and standard deviation of the (a) net and (b) cumulative cobble transport. Positive cross-shore transport is seaward.
Closer inspection of the transport characteristics within each station reinforces the finding of low cumulative transport and net onshore transport of cobbles in the presence of the coarse-grained berm material. For example, data from S1 are shown in Figure 13. At the more seaward stations, a trend of divergence of the cobbles away from the mid-swash zone is observed: shoreward transport above the mid-swash level, and seaward transport below. This was particularly the case at S2 and S3, for which the camera’s field of view was well-centred in the swash zone, and the surficial sediments were predominantly fine-grained. Data from S3 illustrating this divergence are shown in Figure 14.
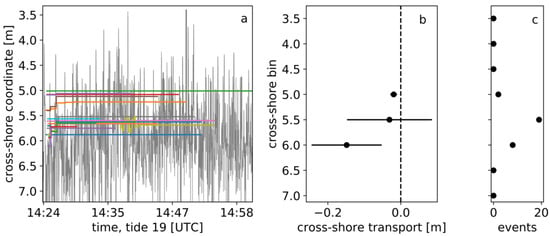
Figure 13.
Cross-shore cobble transport trajectories and transport distances at station 1 (S1) during tide 19. The bed composition was coarse-grained, leading to net onshore transport and low transport rates. (a) Time series of the cross-shore component of all the cobble trajectories. The grey line indicates the time-varying position of the swash front. The colored lines represent individual cobbles. Cross-shore positions are increasingly positive seaward. (b) Mean and standard deviation of the cross-shore transport distance in each each of eight bins corresponding to the the cross-shore coordinates in (a). The transport distance was assigned a bin based on its starting point. (c) Number of transport events used in the calculations of the means and standard deviations in (b).
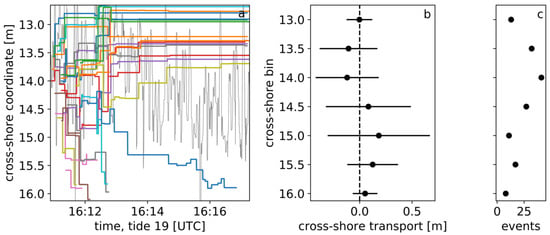
Figure 14.
Cross-shore cobble transport trajectories and transport distances at station 3 (S3) during tide 19. The bed composition was predominantly fine-grained, leading to higher transport rates than at other stations. (a) Time series of the cross-shore component of all the cobble trajectories. The grey line indicates the time-varying position of the swash front. The colored lines represent individual cobbles. Cross-shore positions are increasingly positive seaward. (b) Mean and standard deviation of the cross-shore transport distance in each each of seven bins corresponding to the the cross-shore coordinates in (a). The transport distance was assigned a bin based on its starting point. (c) Number of transport events used in the calculations of the means and standard deviations in (b).
4. Discussion
The mean grain size data (Figure 8 and Figure 9) corroborate visual observations made during the Advocate experiment, of coarse bands of sediments which tended to migrate shoreward with the leading edge of the swash zone. This shoreward migration appeared to precede any substantial changes in bed elevation during tides 19 and 27. This precursor to berm formation has been reported in the literature [15,33], and has been attributed to the temporary stranding of coarse material at the landward edge of the swash. At high tide, the slowdown and arrest of the swash zone’s shoreward translation leads to continued accretion at the leading edge. The berm crest migrates shoreward during periods of berm overtopping, wherein the coarsest mobile fraction is saltated, or ‘thrown’, over the crest. This is followed by accretion on the seaward face of the berm during the seaward regression of the shoreline during early ebb tide, leading to an increase in berm width [34,35]. The array data are consistent with this conceptual model. They indicate that the coarsest sediments correspond to the berm crest, nascent or developed, with fining occurring on the seaward face of the berm.
The above results and interpretation of the swash zone bed level and mean grain size signals are supported by the cobble tracer results. The divergence of the cobbles from the mid-swash toward the seaward and shoreward edges of the swash zone is consistent with the formation of a coarse deposit that migrates with the leading edge of the swash zone, as well as with the frequently observed fining of the surficial material in the mid-swash zone. Though not verifiable with the observations here, it is likely that seaward transported coarse material accumulated in the beach step region associated with bore collapse at the shore break, which also likely migrated with the cross-shore translating swash zone. The beach step has been demonstrated elsewhere to play an important role in controlling wave breaking on steep beaches, and has also been shown to migrate with the translating swash zone [15]. The net shoreward transport of cobbles in the vicinity of the berm (Figure 12, stations 1 and 2) suggests that the beach profile at high tide was in disequilibrium with the forcing in this case.
The cobble transport results highlight the influence of the substrate on the transport dynamics of coarse particles in a mixed grain-size setting; cobble transport is favoured on a fine substrate, where low angles of pivot and greater exposure to lift and drag forces cause the coarse particles to overpass the finer ones. Transport is inhibited where the substrate is coarse, due to higher angles of pivot required for mobilisation and decreased return flow velocities resulting from increased infiltration and hydraulic roughness.
The low-cost ultrasonic range sensors, despite their lower resolution compared to similar sensors used in other studies, were capable of characterising bed level changes with probability distributions that are comparable to those reported elsewhere [3,10], including at least one gravel beach [9]: namely, a quasi-Gaussian distribution that is indicative of an inter-swash timescale for profile evolution, where net changes to the profile are a result of time integration of small changes in bed elevation (both positive and negative) over many swash cycles. The ultrasonic range sensors used in this study would be less suitable where resolution finer than ±1 mm is required (e.g., in a pure sand setting where average grain sizes are less than 1 mm).
The high kurtosis of the bed level change distributions (kurtosis of 5.1, 5.4 for tides 19 and 27, respectively) relative to a value of 3 for a Gaussian distribution may be attributable to the ‘armouring’ effect of the coarse bed: low energy swash events with small runup and low velocities may not have led to mobilisation or deposition in the range sensor sampling region, resulting in a bed level change distribution more heavily weighted toward no change. This is in contrast to a sandy bed, where some degree of bed level change might be expected with each swash event due to the higher mobility of sand grains. Instances of greater bed level change associated with the transport of gravel- or cobble-sized grains into or out of the sampling region may also have contributed to a higher kurtosis value through increased weighting of the tails of the bed level change distribution.
The Raspberry Pi cameras were adequate for capturing images and video of the bed for digital grain sizing and cobble tracking. The difficulties resolving higher order moments of the grain size distribution (see Appendix A) can more likely be attributed to the wide grain size distribution at Advocate Beach, which spans three orders of magnitude.
In future work, it would be of interest to make similar measurements with greater spatial coverage, particularly in the cross-shore, in order to better resolve the fine-scale grain size and bed level changes associated with incipient berm formation at the leading edge of the swash. More sensors in an across-shore configuration would also allow for the consideration of volume change in the swash region; e.g., is positive bed level change at the berm balanced by erosion from the mid-swash, or must material be sourced from the step region as well? The step has been shown in previous work to have an important influence on swash processes via its control on wave breaking, and is likely to be an important source of coarse material for swash zone morpho-sedimentary evolution in MSG settings. However, the methods employed for this study are not capable of directly observing processes at the step. To the knowledge of the authors, no non-intrusive methods have been used to study the step in a field setting.
Given the acknowledged influence of the full grain size distribution on mixed sediment transport dynamics (e.g., the increased mobility of gravel-sized particles in the presence of a large sand fraction [36]), quantifying higher order moments of the grain size distribution would be of interest. It is possible that improvements upon the digital grain sizing results presented in this study could be obtained using a calibration-based approach [14]. Other properties of the grains, namely particle shape, have also been demonstrated to play an important role in particle transport dynamics. The ability to digitally quantify particle shape at wave forcing timescales would be valuable, particularly in the context of coarse particle transport in swash flows.
5. Conclusions
The morpho-sedimentary evolution of a mixed sand–gravel beach was investigated at the swash scale through point observations of bed level and mean grain size using collocated ultrasonic range sensors and optical cameras, with temporal resolution on the order of seconds. The trajectories of painted tracer cobbles in the swash were tracked using another optical camera. Data were collected near high tide during periods of fairweather forcing characterised by low steepness wave incidence and berm building. The shoreline position changed rapidly due to the large (ca. 10 m) tidal range.
We draw the following conclusions regarding processes in the swash zone at Advocate Beach, relevant to conditions of fairweather forcing, and exclusive of the beach step:
- In general, increases in bed level correspond to increases in mean surficial grain size.
- The largest mean grain sizes occur at the leading edge of the swash front, during both the flooding and ebbing tide. The smallest mean grain sizes are associated with the mid-swash zone.
- The magnitude of inter-swash-event bed level change is largest near the leading edge of the swash zone.
- Bed level change and swash height are uncorrelated at inter-swash timescales.
- The cumulative transport of cobbles in the swash is greater where the substrate consists of finer material. Cumulative transport is lower where the surficial material is coarser (i.e., of similar size to the cobble being trasported).
- Cobble transport tends to diverge shoreward or seaward from the mid-swash.
- The divergence of cobble transport from the mid-swash results in a deposit of coarse-grained material that migrates with the leading edge of the swash. The coarse-grained depoist is stranded near the high water line, becoming a nascent berm. Accumulation of coarse-grained material is also likely to occur at the beach step.
The low-cost, commercially available range sensors used in this study were successful in resolving signals of morpho-sedimentary change in the subaerial swash zone. This finding indicates potential of close-range remote sensing techniques for investigating the coevolution of bed level and grain size in response to swash processes, at least in macrotidal mixed sand–gravel settings.
Author Contributions
Conceptualisation, T.B.G. and A.E.H.; methodology, T.B.G. and A.E.H.; software, T.B.G.; validation, T.B.G.; formal analysis, T.B.G.; investigation, T.B.G. and A.E.H.; resources, A.E.H.; data curation, T.B.G.; writing—original draft preparation, T.B.G.; writing—review and editing, T.B.G. and A.E.H.; visualisation, T.B.G.; supervision, A.E.H.; project administration, A.E.H.; funding acquisition, T.B.G. and A.E.H. All authors have read and agreed to the published version of the manuscript.
Funding
This research was funded by the Natural Sciences and Engineering Research Council of Canada (NSERC) Discovery Grant (RGPIN-2017-05157) to A.E.H. and a Nova Scotia Graduate Scholarship awarded to T.B.G.
Institutional Review Board Statement
Not applicable.
Informed Consent Statement
Not applicable.
Data Availability Statement
The data presented in this study are available on request from the corresponding author.
Acknowledgments
The authors acknowledge Richard Cheel’s invaluable assistance in preparing for and carrying out the 2018 Advocate Beach field study.
Conflicts of Interest
The authors declare no conflict of interest.
Appendix A. Digital Grain Sizing Validation
The Buscombe [5] digital grain sizing (DGS) method used in this study applies wavelet analysis to space-series transects of greyscale pixel intensities in the image(s) being processed. For the algorithm to function as intended, the images must contain only sediment, and individual grains must be resolvable by eye (i.e., have minimum grain diameters of 3–4 pixels). The output is a distribution of grain diameters characterised by information from the wavelet-derived power spectrum, i.e., using a statistical characterisation of each pixel transect, rather than characterisations of individual grains. Unlike earlier statistical methods, the Buscombe [5] method does not require a site- or sediment population-specific calibration. The method is therefore described as ‘transferable’. In comparison to earlier methods, the transferable wavelet method is more applicable to poorly sorted sediment populations.
The DGS method requires a suite of input parameters: (1) a density parameter, which determines the spacing between pixel rows in the input image to be processed; (2) a pixel to physical unit scale factor; (3) a filtering Boolean, which applies a Savitzki-Golay high-pass ‘flattening’ filter if set to ‘True’; (4) a ‘notes’ parameter, which defines the number of notes per octave to consider in the continuous wavelet transform; (5) an inverse pixel-to-image-width ratio indicating the maximum diameter of grains to be resolved, in order to scale the maximum width of the ‘mother’ Morlet wavelet; and (6) a conversion constant required to enable comparability of the output with distributions obtained in a different dimensional space. See Buscombe [5] or Cuttler et al. [37] for more detailed summaries of the parameters. With the exception of the pixel to physical unit scaling parameter, the pixel-to-image-width ratio, and the dimensional conversion constant, the default parameter values were used in processing all images.
A validation analysis was carried out to ensure the most suitable parameter values were selected. Twenty-four surface sediment samples taken from the beach were transported to the laboratory, where grain size distributions were computed by sieving, a manual image-based point-counting approach, and the wavelet-based DGS method. The mean sample mass was 1.28 kg. The samples were prepared and sieved following the method of Ingram [38] to obtain volume-by-weight grain size distributions. The point counting method is a standard validation technique for image-based grain sizing, in which an uniformly spaced grid (, in the case of this study) is overlaid on the image, and the widths of the grains beneath each grid vertex manually extracted to produce a grid-by-number type grain size distribution [12,32].
To implement the point-counting and wavelet methods, each sample was placed in a tray and photographed using a tripod-mounted, downward-oriented Canon Powershot Elph 190. 3–5 images were captured for each sample, with the sediments being redistributed between each photograph. Each photograph was cropped so only sediment was visible in the image. The cropped images were digitally flatted in the process of implementing the DGS algorithm.
Since the output of the DGS algorithm is a distribution of line-by-number grain diameters (see Kellerhals and Bray [39], Church et al. [40] for descriptions of the types particle size distributions), a conversion factor is needed in order for the DGS output to be comparable to (i.e., dimensionally consistent with) output from a sieve-type analysis. A commonly used conversion formula is [37,39,41]:
where is the known proportion of the ith size fraction obtained using the input measure, is the proportion of the ith size fraction in units consistent with the desired output measure, is the grain diameter of the ith size fraction, and the exponent x is a conversion constant whose value is empirically dependent upon the grain size distribution. Equation (A1) is based on the voidless cube model from Kellerhals and Bray [39]. The Kellerhals and Bray [39] conversion is based on purely dimensional arguments, and does not depend upon an idealisation of the material. Thus, though the parameter x can be theoretically defined based only on knowledge of the input and output measures, it is best employed as an empirically defined tuning parameter. For example, Diplas and Sutherland [41] suggested a value of for converting from an area-by-number to volume-by-number type sample using natural sediments with 33% porosity, though the voidless cube model would indicate a conversion constant of . Theoretically correct values of x for a given conversion can be found in Table 2 of Kellerhals and Bray [39]. The same exponent values can be deduced using dimensional arguments. For example, converting from a grid-by-number type measure () to a volume-by-number measure () requires a conversion factor of
For the output from the wavelet method to be theoretically comparable to output from the sieve analysis, a conversion factor of is required. Note that the same conversion is used for comparing output from the wavelet method to output from the manual point counting method, since the sieve method (volume-by-weight) and the point counting method (grid-by-number) share an equivalence.
For the validation analysis, x values in the range of 0.5 through 1.5 were tested. RMS errors associated with all the x values tested are summarized in Table A1, and results for a subset of the values are plotted in Figure A1 and Figure A2 for the sieve and point count method comparisons, respectively. The best result in a minimised root mean square error sense was obtained using (RMSE = 3.35 mm). Though the higher values for x arguably lead to a more linear (though positively offset) relationship (see in Figure A1), this comes at the expense of the ability to differentiate grain sizes in the low- to mid range—i.e., the 10–20 mm mean grain size range—which accounts for a large proportion of the grain size distribution.
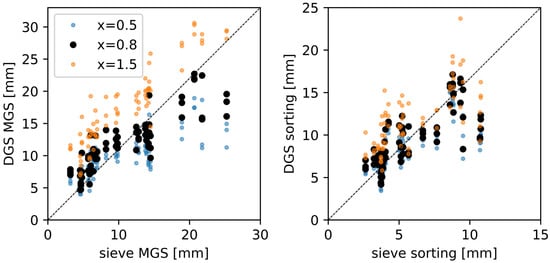
Figure A1.
Mean grain sizes (left) and sorting parameters (right) computed using the wavelet-based DGS method, plotted against values obtained from sieve analysis, for values of the dimensional scaling parameter x ranging from 0.5 to 1.5.
Figure A1.
Mean grain sizes (left) and sorting parameters (right) computed using the wavelet-based DGS method, plotted against values obtained from sieve analysis, for values of the dimensional scaling parameter x ranging from 0.5 to 1.5.
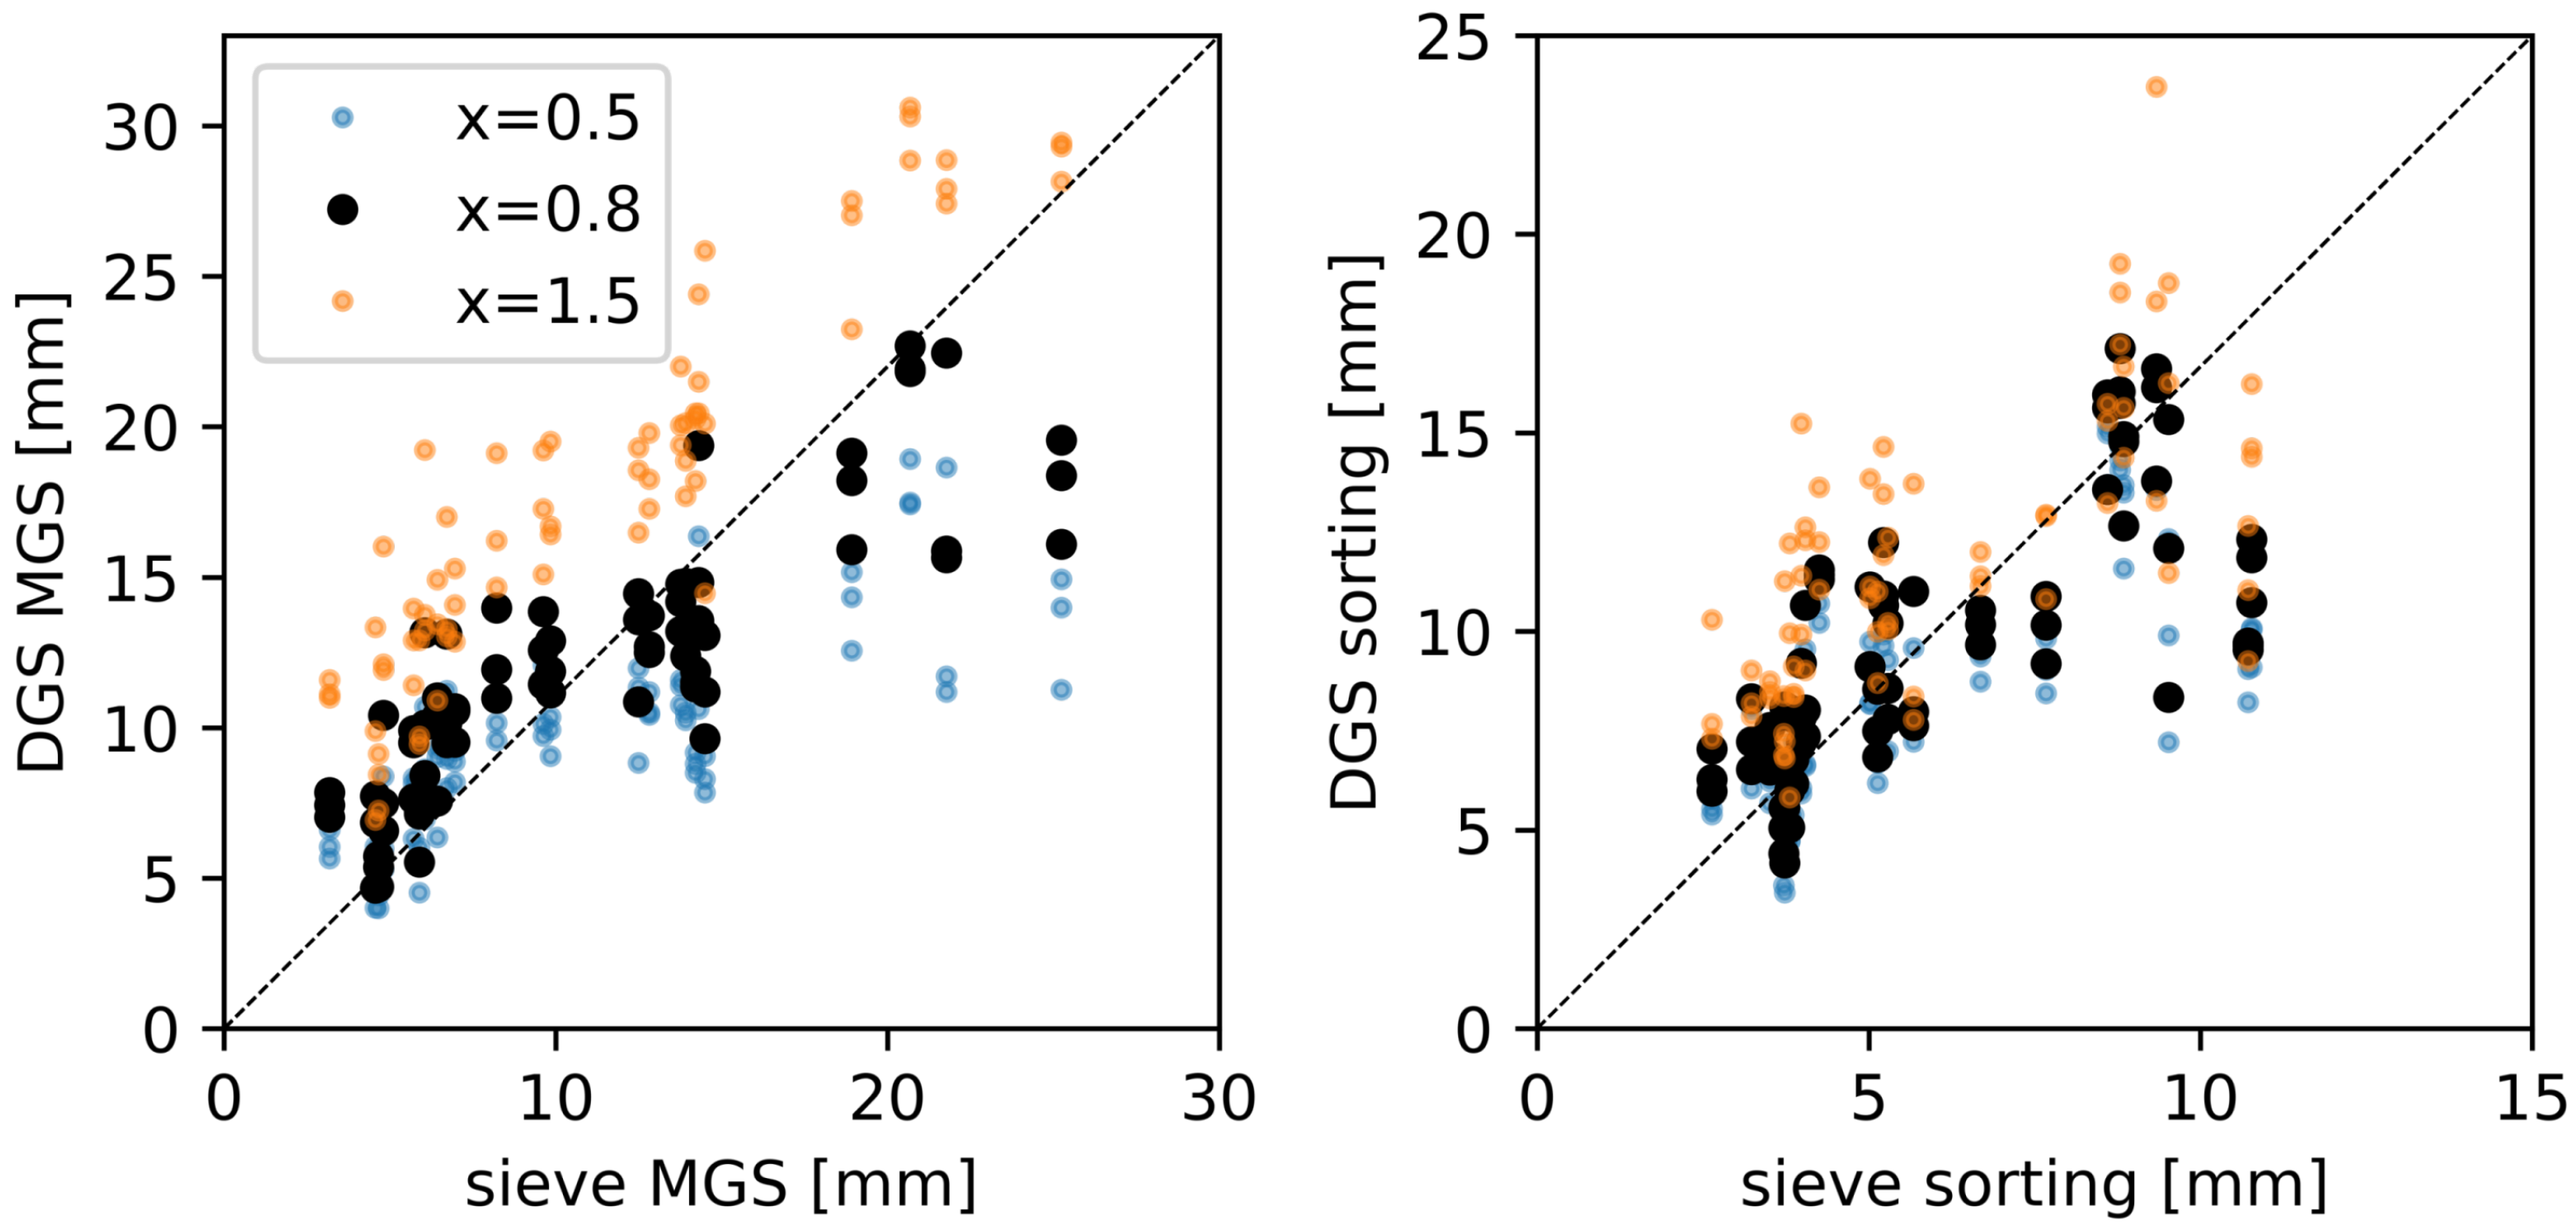
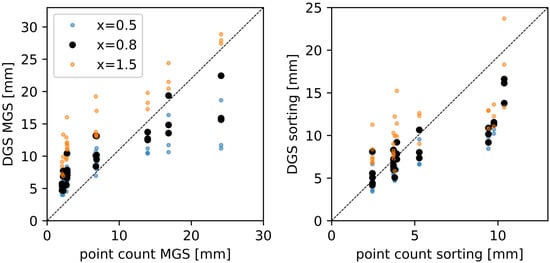
Figure A2.
Mean grain sizes (left) and sorting parameters (right) computed using the wavelet-based DGS method, plotted against values obtained using the manual point counting method, for values of the dimensional scaling parameter x ranging from 0.5 to 1.5.
Figure A2.
Mean grain sizes (left) and sorting parameters (right) computed using the wavelet-based DGS method, plotted against values obtained using the manual point counting method, for values of the dimensional scaling parameter x ranging from 0.5 to 1.5.
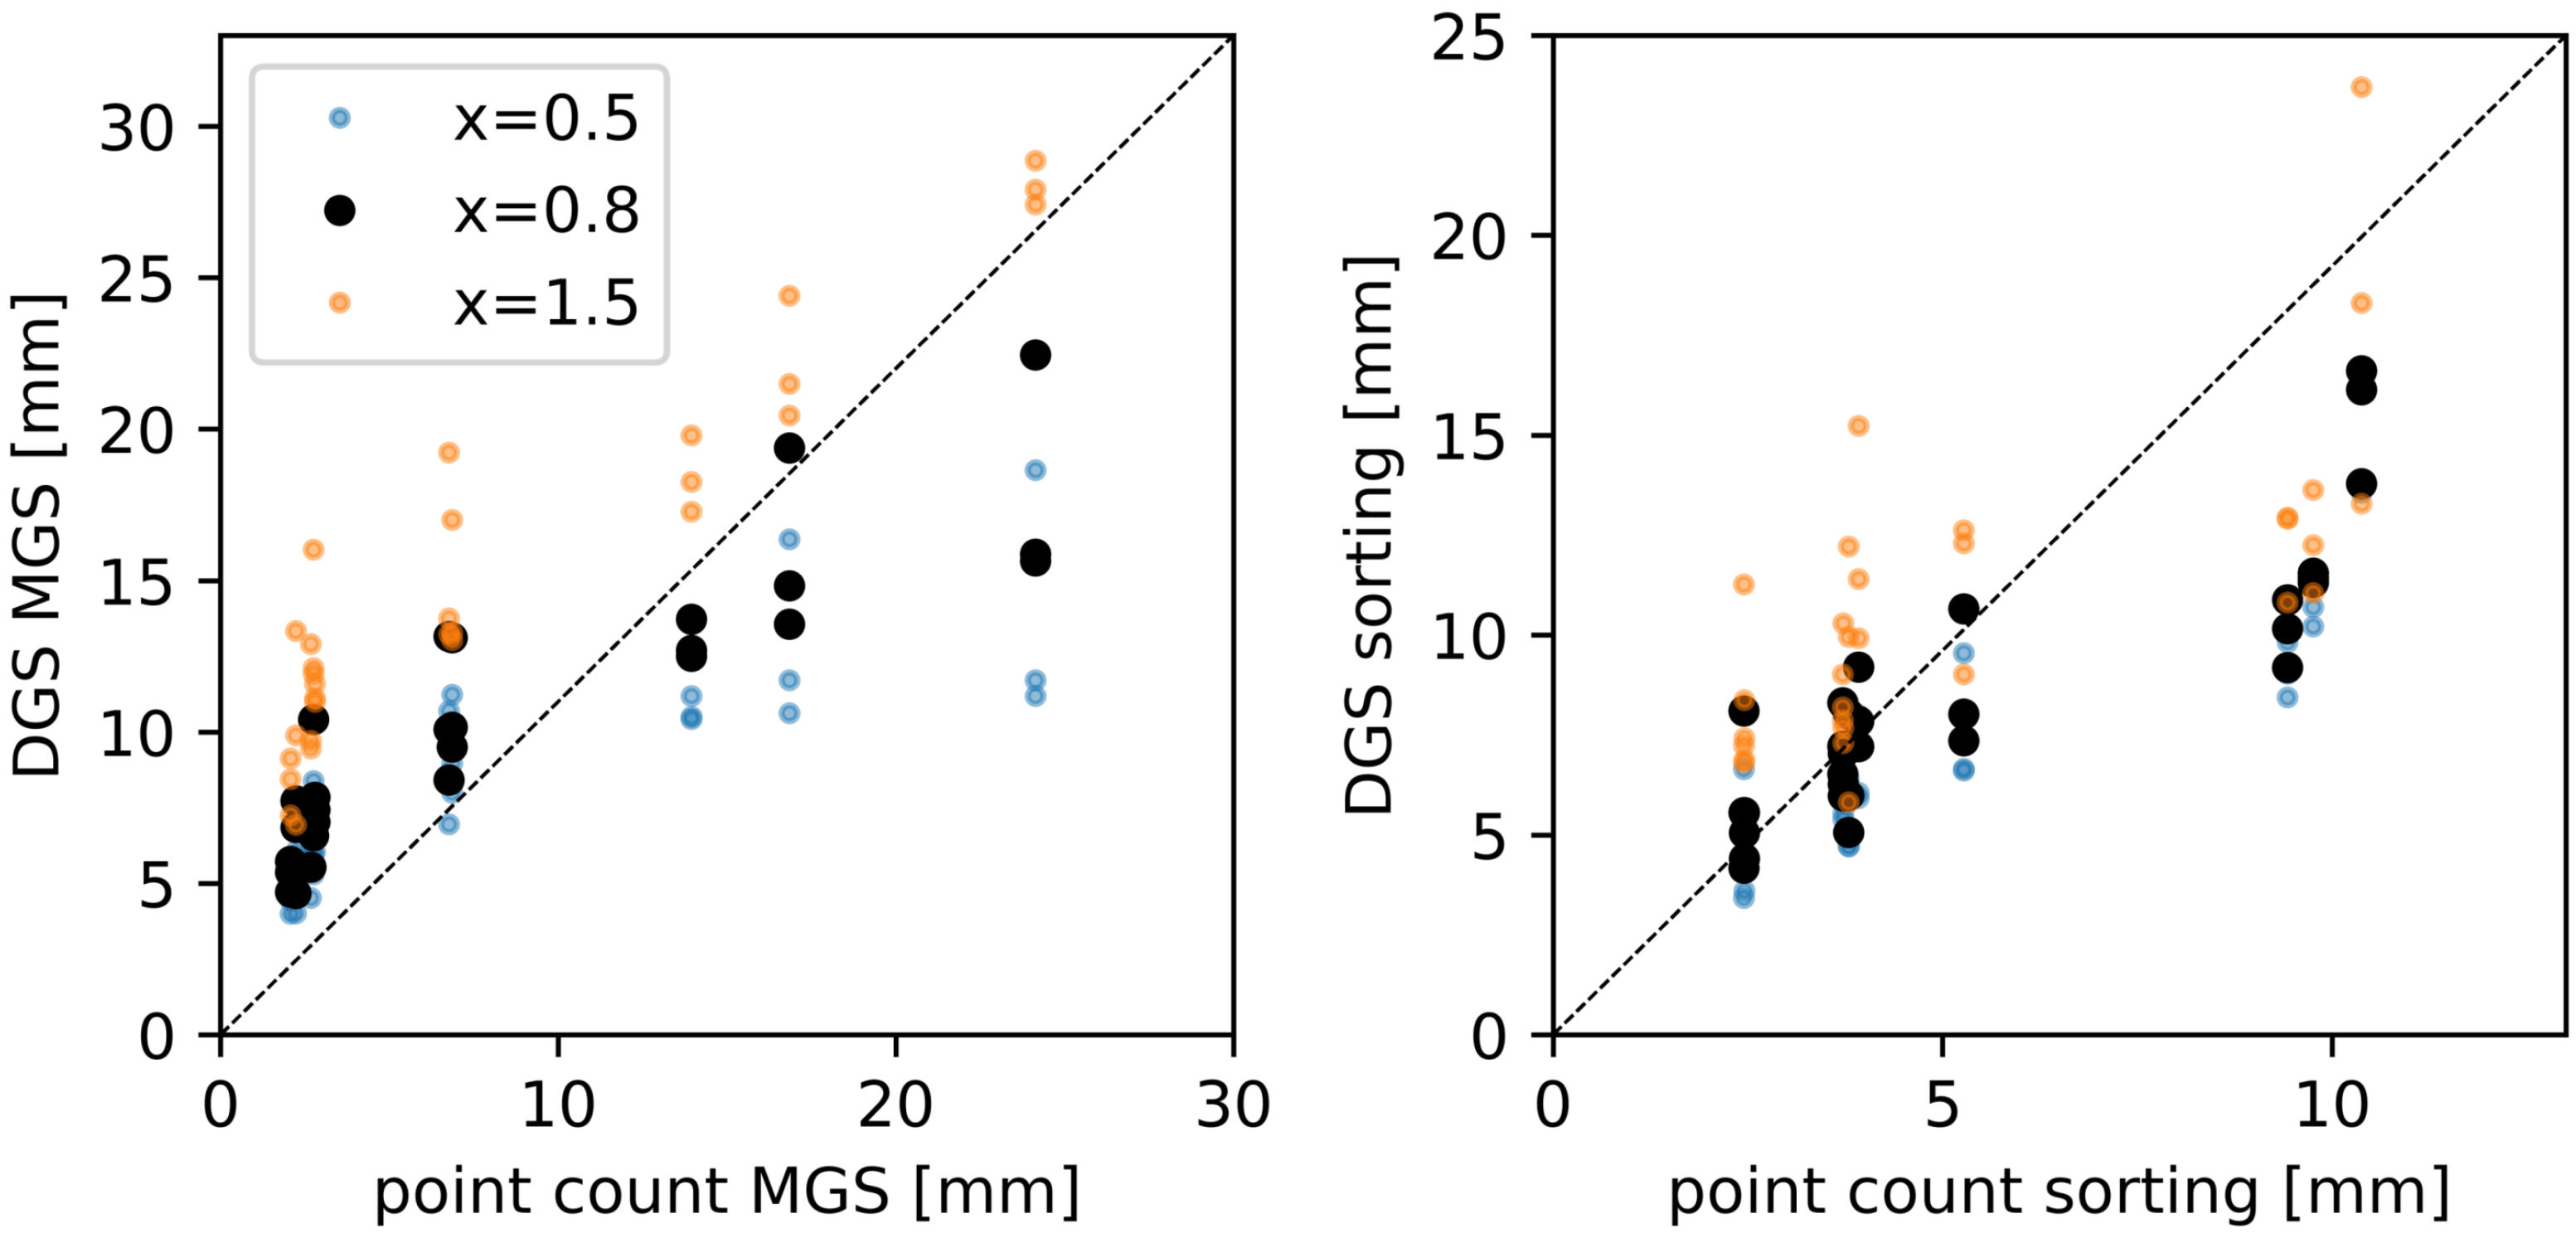

Table A1.
Root mean square errors (RMSE) of the DGS and sieve-derived mean grain size data for the validation analysis.
Table A1.
Root mean square errors (RMSE) of the DGS and sieve-derived mean grain size data for the validation analysis.
| x | DGS-Sieve RMSE (mm) | DGS-Point Count RMSE (mm) |
|---|---|---|
| 0.5 | 4.11 | 4.63 |
| 0.7 | 3.43 | 4.36 |
| 0.8 | 3.35 | 4.39 |
| 0.9 | 3.48 | 4.55 |
| 1.0 | 3.81 | 4.83 |
| 1.2 | 4.90 | 5.71 |
| 1.3 | 5.71 | 6.27 |
| 1.5 | 7.08 | 7.56 |
Other parameter values were held constant. The inverse pixel-to-image-width ratio was set as 5.3, for a maximum resolved feature scale of 56 mm, given a cropped image with of 2453 pixels, and a pixel to metric scaling parameter value of 0.12. The inverse pixel-to-image-width ratio of 5.3 was chosen so the maximum feature scale was consistent with the scale used to process the field survey images, which were cropped to different dimensions. Though this feature scale was not sufficient to resolve the largest grains in the distribution, it was deemed an acceptable compromise in the interest of optimising the representation of both the small and large diameter grains.
Though an acceptable level of agreement was obtained between the mean grain sizes computed using the DGS method and the validation methods, higher order moments of the grain size distribution, namely, the grain size sorting parameter (i.e., the standard deviation of the grain size distribution), the grain size skewness, and the kurtosis, were not reproduced with the same quality. This was attributed to the broad and variable grain size distribution within a given image, and throughout the image set. Consequently, the measures of grain size other than the mean were omitted from any analyses.
References
- Puleo, J.A.; Blenkinsopp, C.; Conley, D.; Masselink, G.; Turner, I.L.; Russell, P.; Buscombe, D.; Howe, D.; Lanckriet, T.; McCall, R.; et al. Comprehensive field study of swash-zone processes. I: Experimental design with examples of hydrodynamic and sediment transport measurements. J. Waterw. Port Coast. Ocean Eng. 2013, 140, 14–28. [Google Scholar] [CrossRef]
- Lanckriet, T.; Puleo, J.A.; Masselink, G.; Turner, I.L.; Conley, D.; Blenkinsopp, C.; Russell, P. Comprehensive field study of swash-zone processes. II: Sheet flow sediment concentrations during quasi-steady backwash. J. Waterw. Port Coast. Ocean Eng. 2013, 140, 29–42. [Google Scholar] [CrossRef]
- Turner, I.L.; Russell, P.E.; Butt, T. Measurement of wave-by-wave bed-levels in the swash zone. Coast. Eng. 2008, 55, 1237–1242. [Google Scholar] [CrossRef]
- Rubin, D.M. A simple autocorrelation algorithm for determining grain size from digital images of sediment. J. Sediment. Res. 2004, 74, 160–165. [Google Scholar] [CrossRef]
- Buscombe, D. Transferable wavelet method for grain-size distribution from images of sediment surfaces and thin sections, and other natural granular patterns. Sedimentology 2013, 60, 1709–1732. [Google Scholar] [CrossRef]
- Dean, R.G. Equilibrium beach profiles: Characteristics and applications. J. Coast. Res. 1991, 7, 53–84. [Google Scholar]
- Horn, D.P.; Walton, S.M. Sediment-level oscillations in the swash zone of a mixed sand and gravel beach. In Proceedings of the 29th International Conference on Coastal Engineering, Lisbon, Portugal, 19–24 September 2004; World Scientific Publishing Co.: Singapore, 2004; Volume 3, pp. 2390–2402. [Google Scholar]
- Masselink, G.; Russell, P.; Turner, I.; Blenkinsopp, C. Net sediment transport and morphological change in the swash zone of a high-energy sandy beach from swash event to tidal cycle time scales. Mar. Geol. 2009, 267, 18–35. [Google Scholar] [CrossRef]
- Russell, P.; Masselink, G.; Blenkinsopp, C.; Turner, I. A comparison of berm accretion in the swash zone on sand and gravel beaches at the timescale of individual waves. J. Coast. Res. 2009, SI 56, 1791–1795. [Google Scholar]
- Blenkinsopp, C.; Turner, I.; Masselink, G.; Russell, P. Swash zone sediment fluxes: Field observations. Coast. Eng. 2011, 58, 28–44. [Google Scholar] [CrossRef]
- Kulkarni, C.D.; Levoy, F.; Monfort, O.; Miles, J. Morphological variations of a mixed sediment beachface (Teignmouth, UK). Cont. Shelf Res. 2004, 24, 1203–1218. [Google Scholar] [CrossRef]
- Buscombe, D.; Rubin, D.; Warrick, J. A universal approximation of grain size from images of noncohesive sediment. J. Geophys. Res. Earth Surf. 2010, 115, F02015. [Google Scholar] [CrossRef]
- Chang, F.J.; Chung, C.H. Estimation of riverbed grain-size distribution using image-processing techniques. J. Hydrol. 2012, 440, 102–112. [Google Scholar] [CrossRef]
- Warrick, J.A.; Rubin, D.M.; Ruggiero, P.; Harney, J.N.; Draut, A.E.; Buscombe, D. Cobble Cam: Grain-size measurements of sand to boulder from digital photographs and autocorrelation analyses. Earth Surf. Process. Landforms J. Br. Geomorphol. Res. Group 2009, 34, 1811–1821. [Google Scholar] [CrossRef]
- Austin, M.J.; Buscombe, D. Morphological change and sediment dynamics of the beach step on a macrotidal gravel beach. Mar. Geol. 2008, 249, 167–183. [Google Scholar] [CrossRef]
- Nordstrom, K.F.; Jackson, N.L. Distribution of surface pebbles with changes in wave energy on a sandy estuarine beach. J. Sediment. Res. 1993, 63, 1152–1159. [Google Scholar]
- Ciavola, P.; Castiglione, E. Sediment dynamics of mixed sand and gravel beaches at short time-scales. J. Coast. Res. 2009, II, 1751–1755. [Google Scholar]
- Stark, N.; Hay, A.E. Pebble and cobble transport on a steep, mega-tidal, mixed sand and gravel beach. Mar. Geol. 2016, 382, 210–223. [Google Scholar] [CrossRef]
- Osborne, P.E. Transport of gravel and cobble on a mixed-sediment inner bank shoreline of a large inlet, Grays Harbor, Washington. Mar. Geol. 2005, 224, 145–156. [Google Scholar] [CrossRef]
- Allan, J.C.; Hart, R.; Tranquili, J.V. The use of Passive Integrated Transponder (PIT) tags to trace cobble transport in a mixed sand-and-gravel beach on the high-energy Oregon coast, USA. Mar. Geol. 2006, 232, 63–86. [Google Scholar] [CrossRef]
- Curtiss, G.M.; Osborne, P.D.; Horner-Devine, A.R. Seasonal patterns of coarse sediment transport on a mixed sand and gravel beach due to vessel wakes, wind waves, and tidal currents. Mar. Geol. 2009, 259, 73–85. [Google Scholar] [CrossRef]
- Dickson, M.E.; Kench, P.S.; Kantor, M.S. Longshore transport of cobbles on a mixed sand and gravel beach, southern Hawke Bay, New Zealand. Mar. Geol. 2011, 287, 31–42. [Google Scholar] [CrossRef]
- Miller, I.M.; Warrick, J.A.; Morgan, C. Observations of coarse sediment movements on the mixed beach of the Elwha Delta, Washington. Mar. Geol. 2011, 282, 201–214. [Google Scholar] [CrossRef]
- Miller, I.M.; Warrick, J.A. Measuring sediment transport and bed disturbance with tracers on a mixed beach. Mar. Geol. 2012, 299, 1–17. [Google Scholar] [CrossRef]
- Bertoni, D.; Sarti, G.; Benelli, G.; Pozzebon, A.; Raguseo, G. Transport trajectories of “smart” pebbles on an artificial coarse-grained beach at Marina di Pisa (Italy): Implications for beach morphodynamics. Mar. Geol. 2012, 291, 227–235. [Google Scholar] [CrossRef]
- Grottoli, E.; Bertoni, D.; Ciavola, P.; Pozzebon, A. Short term displacements of marked pebbles in the swash zone: Focus on particle shape and size. Mar. Geol. 2015, 367, 143–158. [Google Scholar] [CrossRef]
- Grottoli, E.; Bertoni, D.; Pozzebon, A.; Ciavola, P. Influence of particle shape on pebble transport in a mixed sand and gravel beach during low energy conditions: Implications for nourishment projects. Ocean Coast. Manag. 2019, 169, 171–181. [Google Scholar] [CrossRef]
- Levoy, F.; Anthony, E.J.; Monfort, O.; Larsonneur, C. The morphodynamics of megatidal beaches in Normandy, France. Mar. Geol. 2000, 171, 39–59. [Google Scholar] [CrossRef]
- Taylor, R.B.; Wittman, S.L.; Milne, M.J.; Kober, S.M. Beach Morphology and Coastal Changes at Selected Sites, Mainland Nova Scotia; Technical Report; Geological Survey of Canada: Ottawa, ON, Canada, 1985. [Google Scholar]
- Hay, A.E.; Zedel, L.; Stark, N. Sediment dynamics on a steep, megatidal, mixed sand-gravel-cobble beach. Earth Surf. Dyn. 2014, 2, 117–152. [Google Scholar] [CrossRef]
- Guest, T.B. Morpho-Sedimentary Dynamics of a Megatidal, Mixed Sand-Gravel Beach. Ph.D. Thesis, Dalhousie University, Halifax, NS, Canada, 2020. [Google Scholar]
- Barnard, P.L.; Rubin, D.M.; Harney, J.; Mustain, N. Field test comparison of an autocorrelation technique for determining grain size using a digital beachball camera versus traditional methods. Sediment. Geol. 2007, 201, 180–195. [Google Scholar] [CrossRef]
- Duncan, J.R., Jr. The effects of water table and tide cycle on swash-backwash sediment distribution and beach profile development. Mar. Geol. 1964, 2, 186–197. [Google Scholar] [CrossRef]
- Pontee, N.I.; Pye, K.; Blott, S.J. Morphodynamic behaviour and sedimentary variation of mixed sand and gravel beaches, Suffolk, UK. J. Coast. Res. 2004, 20, 256–276. [Google Scholar] [CrossRef]
- Austin, M.J.; Masselink, G. Observations of morphological change and sediment transport on a steep gravel beach. Mar. Geol. 2006, 229, 59–77. [Google Scholar] [CrossRef]
- Wilcock, P.R.; Kenworthy, S.T.; Crowe, J.C. Experimental study of the transport of mixed sand and gravel. Water Resour. Res. 2001, 37, 3349–3358. [Google Scholar] [CrossRef]
- Cuttler, M.V.; Lowe, R.J.; Falter, J.L.; Buscombe, D. Estimating the settling velocity of bioclastic sediment using common grain-size analysis techniques. Sedimentology 2017, 64, 987–1004. [Google Scholar] [CrossRef]
- Ingram, R.L. Sieve Analysis. In Procedures in Sedimentary Petrology; Carver, R.E., Ed.; Wiley Interscience: New York, NY, USA, 1971; pp. 49–67. [Google Scholar]
- Kellerhals, R.; Bray, D.I. Sampling procedures for coarse fluvial sediments. J. Hydraul. Div. 1971, 97, 1165–1180. [Google Scholar] [CrossRef]
- Church, M.A.; McLean, D.; Wolcott, J. River Bed Gravels: Sampling and Analysis, Sediment Transport in Gravel-Bed Rivers; Thorne, C.R., Bathurst, J.C., Hey, R.D., Eds.; John Wiley: New York, NY, USA, 1987; pp. 43–88. [Google Scholar]
- Diplas, P.; Sutherland, A.J. Sampling techniques for gravel sized sediments. J. Hydraul. Eng. 1988, 114, 484–501. [Google Scholar] [CrossRef]
Publisher’s Note: MDPI stays neutral with regard to jurisdictional claims in published maps and institutional affiliations. |
© 2021 by the authors. Licensee MDPI, Basel, Switzerland. This article is an open access article distributed under the terms and conditions of the Creative Commons Attribution (CC BY) license (https://creativecommons.org/licenses/by/4.0/).

