Article

Effects of a Vessel Speed Reduction Program on Air Quality in Port Areas: Focusing on the Big Three Ports in South Korea

1
Korea Energy Economics Institute, Ulsan 44543, Korea
2
Korea Maritime Institute, Busan 49111, Korea
3
Korea Institute for Health and Social Affairs, Sejong 30147, Korea
*
Author to whom correspondence should be addressed.
J. Mar. Sci. Eng. 2021, 9(4), 407; https://doi.org/10.3390/jmse9040407
Submission received: 11 March 2021 / Revised: 29 March 2021 / Accepted: 7 April 2021 / Published: 11 April 2021
(This article belongs to the Special Issue Marine Alternative Fuels and Environmental Protection)

Abstract

:
As the seriousness of air pollution from ports and ships is recognized, the Korean Port Authority is implementing many policies and instruments to reduce air pollution in port areas. This study aims to verify the effects of the vessel speed reduction (VSR) program among the procedures related to air pollution in port areas. This study was conducted using panel data created by combining ship entry and departure data and air quality measurement data. We measured the changes in air quality according to the entry and departure of ships and examined whether it changes due to the VSR program. For estimation, the panel fixed-effect model and the ordinary least squares (OLS) model were used. The results suggest that the VSR program had a positive effect on improving air quality in port areas. However, the VSR program’s effects were different over ports. Busan Port showed the highest policy effect, and Incheon Port showed a relatively low policy effect. Based on the results of this study, to maximize the VSR program’s effectiveness at the port, it is necessary to implement other eco-friendly policies as well.

1. Introduction

The air pollution issue is being taken seriously in the ocean as emissions from ships significantly contribute to air pollution in the nearby areas of ports where ships enter and depart [1,2,3]. Most ships use Bunker C oil (also known as heavy fuel oil; HFO), which generates more pollutants than other types of fuel [4]. When ships stay at a port, they operate various systems, such as cargo handling, refrigeration in the ship, and an air-conditioning system, which consume a large amount of fuel, thereby releasing air pollutants continuously. In particular, sulfur oxides, nitrogen oxides, and carbon monoxide, which can have harmful effects on the human body, are mainly emitted [5]. The International Maritime Organization (IMO) has established the guidelines on ship operations to minimize environmental pollution and regulated countries and shipping companies. The most recently implemented policy is IMO2020, which strengthens the sulfur content standard of ship fuel oil from 3.5% to 0.5% [6]. IMO2020 is a measure to prevent the emission of sulfur oxide. The operation of ships may be suspended if they do not comply with the IMO regulations [7,8,9].
Many studies on air pollution in the port area have been conducted [10,11]. Most of them have estimated the degree of environmental pollution caused by ship operations or analyzed the impact on residents’ health. According to Eyring et al. [12], air pollution caused by ships operating at sea is considerable, accounting for about 15% of global nitrogen oxide emissions and 5%–8% of sulfur oxide emissions. Merk [13] shows that ship emissions in port areas were 18 million tons of CO2, 0.4 million tons of nitrogen oxides (NOx), 0.2 million tons of sulfur oxides (SOx), and 0.03 million tons of particulate matter (PM). According to the research, about 85% of total emissions come from container ships and tankships, and it is expected to increase fourfold by 2050. Recently, many theoretical and empirical studies have been conducted to analyze the effects of policies to reduce the negative impact of ships. For instance, Marcin and Jakub [14] introduced the eco-friendly policies that will be faced by the European cruise industry. Major ports’ incentive programs to run ports in an eco-friendly way were introduced in their research. Han [15] reviewed policies to reduce air pollution in the shipping industry and suggested measures to achieve practical policy effects.
Import and export via sea routes account for most of South Korea’s import and export as the three parts of South Korea are surrounded by sea. Accordingly, many ships entering and departing from ports and environmental issues caused by ships have become major issues in Korea [16,17,18,19]. The Port Authority, which manages and supervises ports, implements various policies to reduce emissions from ships. The most representative policy is to reduce entry fees for eco-friendly ships and low-speed vessels as incentives. Eco-friendly ships can be identified through the Environmental Ship Index (ESI) (the Environmental Ship Index is an index developed jointly by the World Port Climate Initiative (WPCI) under the International Association of Ports and Harbors in 2011 and major ports in the world to show the level of eco-friendliness of ships). Eco-friendly ships are subject to an entry fee discount. Currently, only Busan Port and Ulsan Port in Korea are running the ESI program.
In addition, a vessel speed reduction (VSR) program was introduced to reduce pollutants at ports and nearby areas. To reduce the emission of air pollutants, such as fine dust generated from ships, the Korean government has designated five major ports, namely, Busan Port, Ulsan Port, Yeosu Port, Gwangyang Port, and Incheon Port, as the area subject to the VSR program from 1 December 2019 [20]. The range of sea area to which the VSR is applied is 20 nautical miles in radius starting from a specific lighthouse in the port, and ships participating in the VSR program must operate at the recommended speed or less from the starting point of the designated area. Among the ships entering and leaving through an external port, specific types of ships with a scale of 3000 tons or more are eligible to participate in this program. Each port designated at least three types of vessels that most significantly contribute to the fine dust in port areas (Table 1).
Full container vessels (Busan, Ulsan, and Incheon) and automobile carriers (Ulsan and Incheon) received a maximum reduction of 30% of the port cost, whereas other ships received a maximum of 15%. Shipping companies wanting to participate in the program must announce their intention to participate to the Port Authority in advance and go through the application and approval processes. The amount of reduction or exemption will be given only when a low-speed operation is performed for more than 60% of the total number of operations during the year. Recently, most port authorities such as Ulsan and Incheon are trying to improve air quality by expanding their target ships.
In this study, the VSR program’s effect, among various policies to reduce air pollution in ports, is to be examined. The VSR program induces immediate changes in the behavior of ships and ultimately induces policy effects [21,22]. Among incentive policies, the VSR program makes it relatively easy for ships to receive incentives. The reduction of fees based on ESI may put a significant financial burden on shipping companies as they must install eco-friendly equipment on the ship or build new ships. In contrast, reducing vessels’ speed when entering a port is relatively easier to start than the ESI program. In this respect, the VSR program can derive more active participation of shipping companies than the ESI program as they can participate in the program regardless of their size and economic situation. Furthermore, shipping companies participating in the VSR program can have additional benefits from low-speed operation of ships [23,24]. Woo and Moon [25] demonstrated that the ship’s speed affects the operation costs, so low-speed operation brings both reductions of greenhouse gas emissions and shipping companies’ operation costs. Ahl et al. [26] empirically analyzed the effect of shipping companies’ incentive structure on the program participation rate using actual data from Long Beach Port in California. The VSR program also benefits ports and the government [27,28]. Zhuge et al. [29] applied the Stackelberg game to conduct a theoretical study on the structure of incentives for new ships to participate in the VSR program. Results of the analysis theoretically demonstrate that the port’s profit increases, and the government’s cost decreases under the VSR program.
The effect of reducing pollutants of the VSR program has been proven [30]. Khan et al. [31] measured the level of emissions that are reduced when the ship operates at a low speed using data on the actual ship’s pollutant emissions. They confirmed that when a container ship is operated at the speed of 12 knots, carbon dioxide emissions were reduced by 61%, nitrogen oxide emissions by 56%, and fine dust emissions by 69%. Chang and Chang [32] analyzed the effect of the VSR program on the energy consumption and CO2 emission of international dry bulk carriers. They showed that as the vessel’s speed was decreased, fuel consumption and carbon dioxide emission also decreased. Cariou [33] suggested that container ships’ low-speed operation reduced greenhouse gas emissions by 11% from 2008. In addition, the largest decline was found in ships operating on routes to the Far East in Europe.
Comprehensively reviewing these previous studies, the VSR program seems to be an effective way to reduce ship emissions in port areas and be cost-effective policy measures. Therefore, how much air quality is improved because of this program must be verified, as this air quality impacts residents living in port areas. This research will help to devise a plan to maximize the policy effect in the future by understanding the system’s effect of air quality improvement more accurately. Currently, the Korean Ministry of Oceans and Fisheries is considering expanding the VSR program to other types of ships to maximize the policy impact [34]. This study can be an essential basis for future policy by estimating how much the air quality in the port’s vicinity has been improved because of the VSR program’s implementation. To be specific, this study intends to determine whether ships’ negative effect on air quality in port areas has been reduced because of Korea’s VSR program. To this end, the vessels’ entry and departure records were combined with real-time data from air pollution observatories around the ports. First, this study analyzes the overall effect of the VSR program. Then, we show the differential effects in each port. To identify the overall effect, a panel fixed-effect model was used, and ordinary least squares (OLS) regression analysis was conducted for each port for the individual port analysis.

2. Materials and Methods

2.1. Data

In this study, two open-source data, namely Port Management Information System (Port-MIS) (which is the system established to handle port operation and civil affairs, such as reporting of ships’ entry, facility use, taking in and out of cargo, and departure reporting for ships using 30 trade ports in Korea) data and measurement of air pollutants data provided by AIR KOREA, were combined and used in the analysis. The Port-MIS data are the ship entry and departure data for each port collected through the Port-MIS. It includes information related to the ship’s unique characteristics, such as the ship’s name, type, shipping company information, and nationality, as well as information related to the operation record, such as the ship’s entry and departure time, purpose, loading capacity, cargo type, and the number of passengers. In this paper, each ship’s entry and departure records were converted into a form that can be analyzed and used. The number of ships entering and leaving each port was summarized to make aggregated data by ship type and the type of entry and departure. Thus, in the analysis, the ship entry and departure record was not used as it is, but it was converted into panel data, including information on the number of ships entering and departing by port and time. However, by classifying the characteristics of ships entering and departing in detail when aggregating the log data, we tried minimizing the omission of ship’s characteristics that may occur in converting log data into panel data.
Other data used in the analysis are the measurement of air pollutants provided by AIR KOREA of Korea Environment Corporation, an organization that provides real-time measurement data of atmospheric environmental standards (sulfur dioxide, nitrogen dioxide, carbon monoxide, fine dust, ultrafine dust, etc.) observed at about 580 measuring stations in Korea. The data are the measurement of real-time levels of representative air pollutants that negatively impact public health. This study used the mean value data for each measurement station per hour.
Panel-type data established by merging two types of data based on region and time point were used for the analysis. To combine the two data, the Port-MIS data’s port code must be matched to the measurement station code in the AIR KOREA data. Thus, the area where the port is located must be identified, and a measuring station that can represent the port area’s air quality must be selected. To this end, the address information of each port and measurement station was converted into coordinates, and the distance between each port and each measurement station was calculated using the coordinates in this study. The Haversine formula (which is the method for calculating the minimum distance between two points on the sphere) was used to calculate the distance between the two coordinates. After calculating the distances between all ports and all stations, we found air quality monitoring stations located within a 10 km radius around the ports. If multiple measuring stations exist within a 10 km radius of a specific port, a weighted average of the measured values using the inverse distance weight was taken. It means that the final data used in this study are panel-type data that include the number of ships entering and departing at each port and the average air quality measure in the port areas for every hour.
As this study focuses on the big three ports in Korea that occupy the highest market share among over 30 ports in Korea, the analysis sample includes only Busan, Ulsan, and Incheon Port data. The sample size is 212,447, which is considered large as the sample period was from January 2010 to May 2020, and most variables were collected hourly during the sample period.

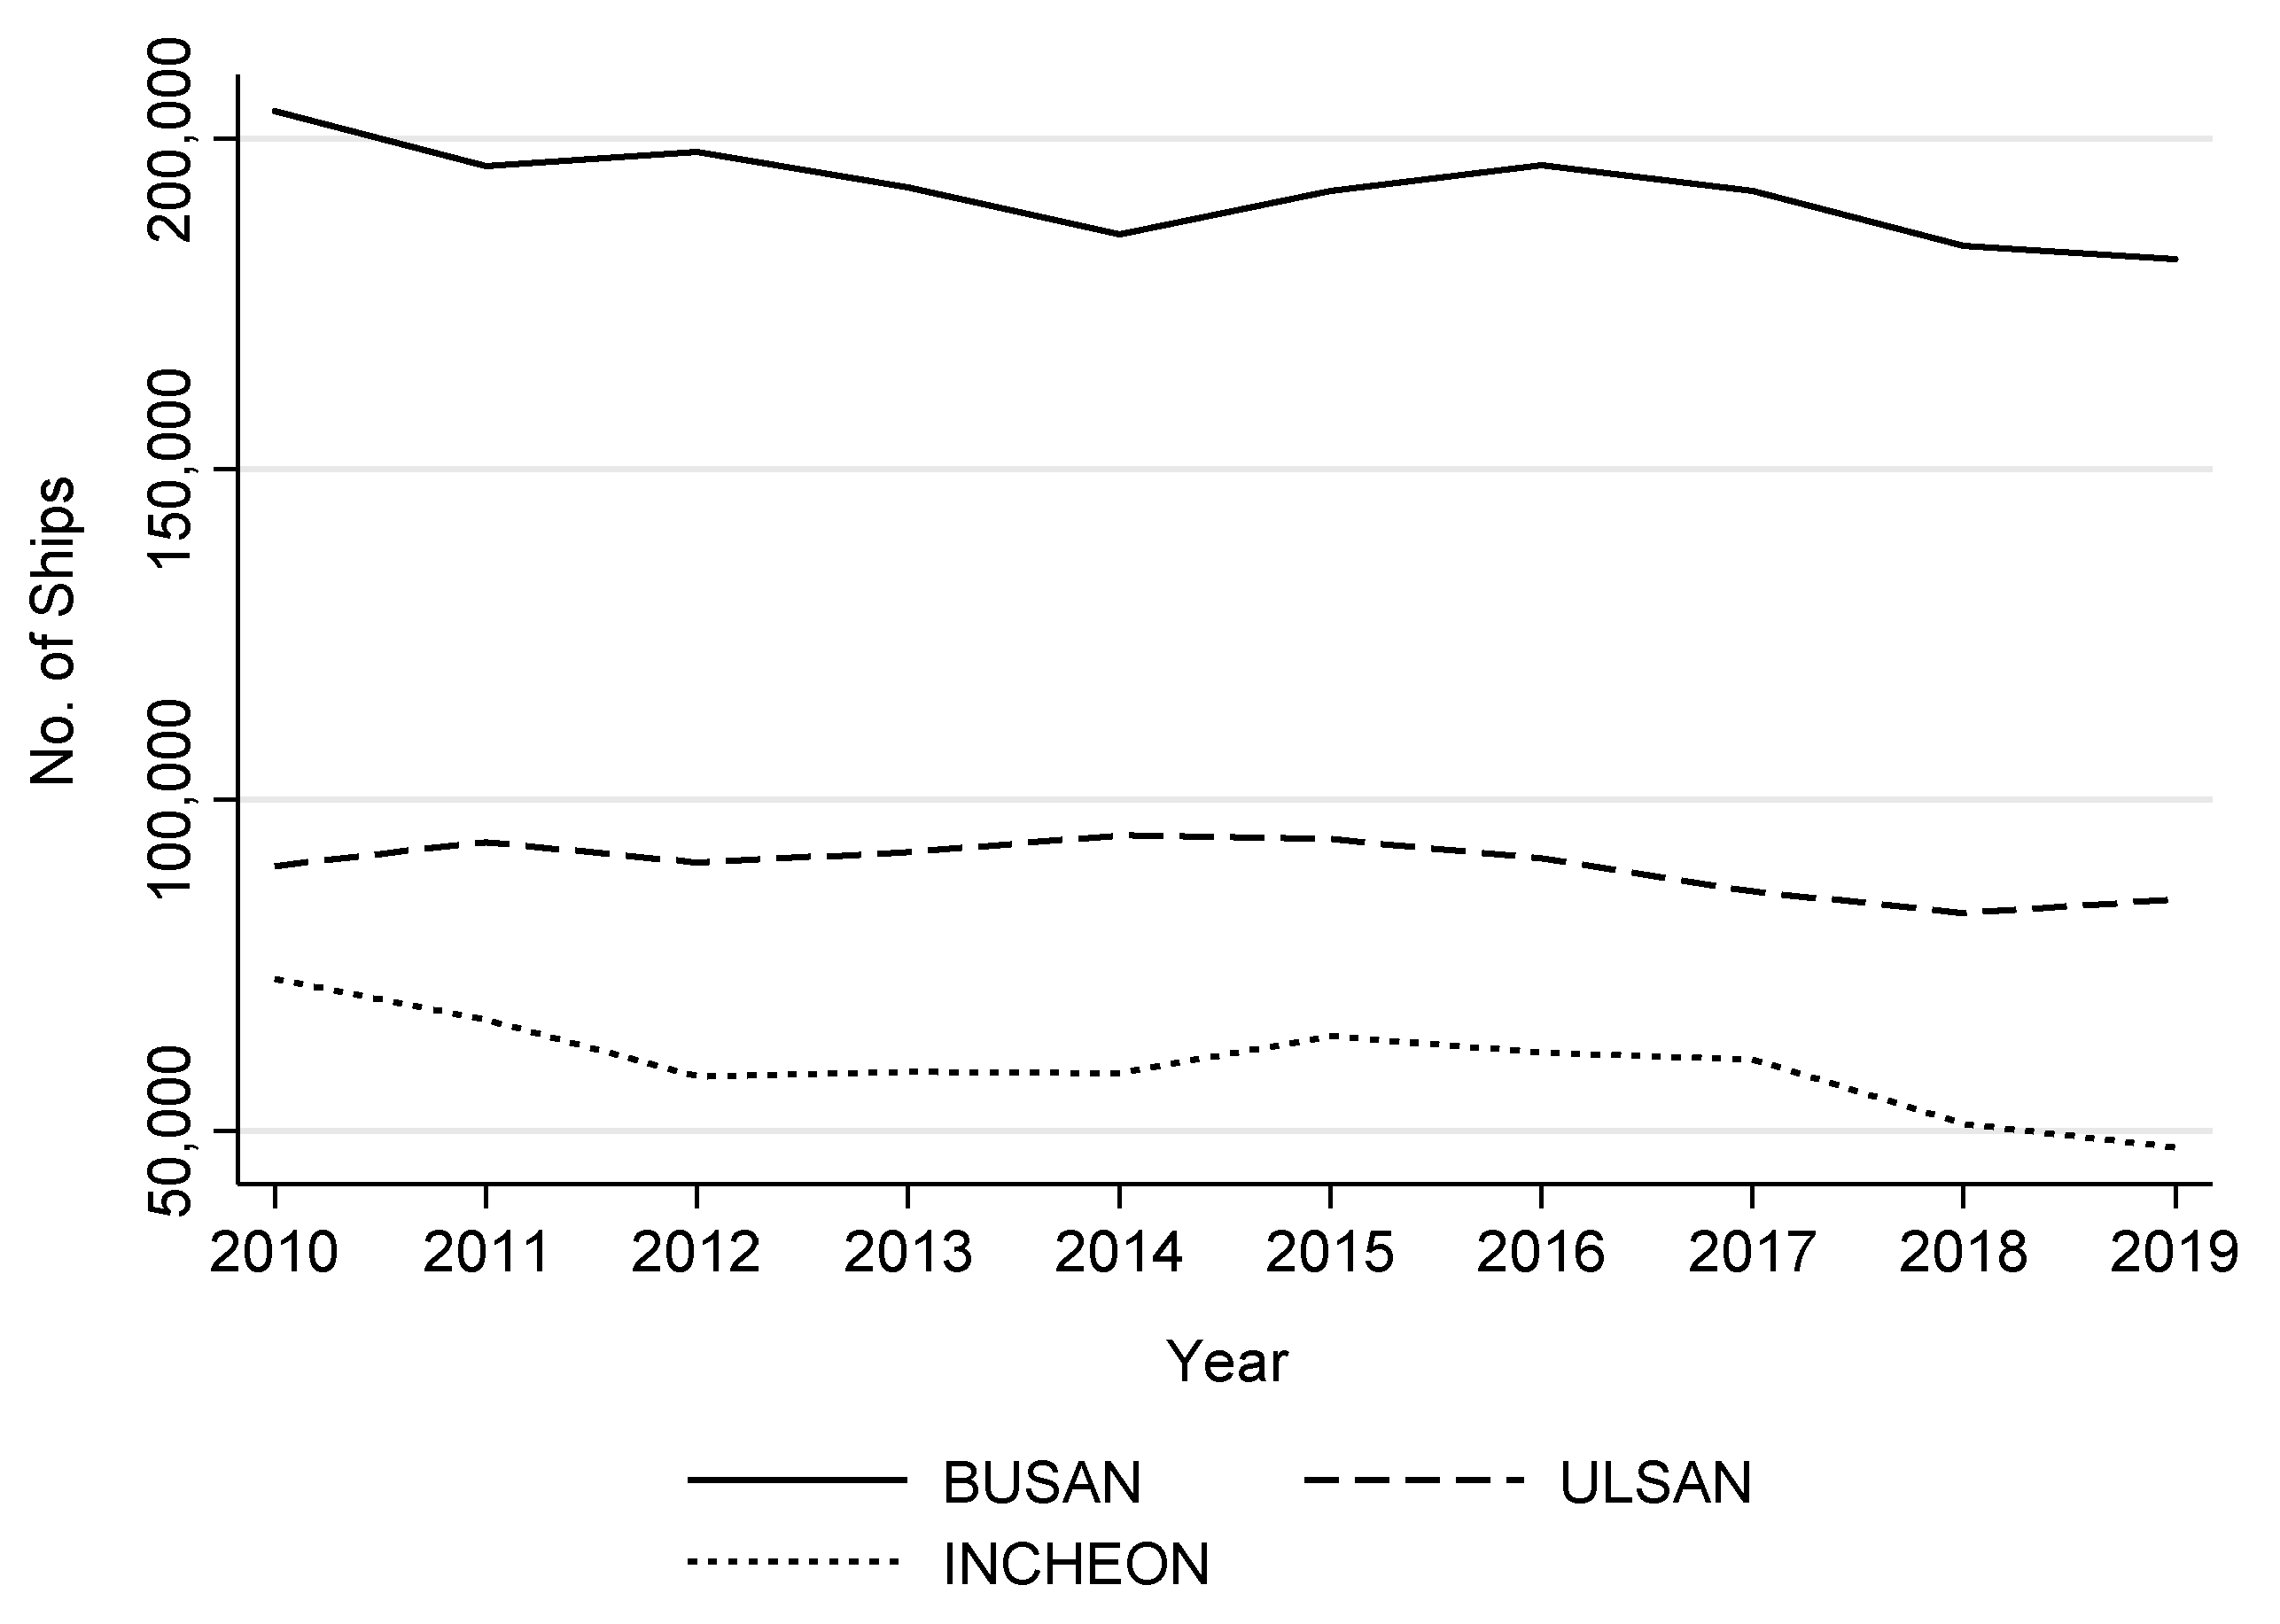
2.2. Descriptive Statistics

The descriptive statistics are presented in Table 2. The number of ships entering into and departing from ports was classified and summed based on the type of ships. The ship types subject to the VSR program are limited to ships of 3000 tons or more that enter and depart through external ports among ships with high emission levels of air pollutants, as designated by the Ministry of Oceans and Fisheries. In the analysis sample, full container vessels, general cargo vessels, and Liquified Natural Gas (LNG), automobile, chemical, and oil carriers fall under this category. Other non-eligible types of cargo and carrying ships and passenger ships are separately classified. Moreover, other ships, such as warships, police boats, and patrol boats, are classified in the “other” (ETC) category.
Five representative substances that are considered to have high emissions through ship operations were selected as dependent variables. The subjects of analysis were sulfur dioxide, nitrogen dioxide, and carbon monoxide, which are highly emitted during ship operations. The derived particulate matter (PM) 10 and PM 2.5 were also used in the analysis. Here, note that the specific value of the air pollutant variables refers to the mean value observed for an hour.
This study analyzes three ports with regional differences. Therefore, the characteristics of each port are different. Figure 1 is a time-series graph of the total number of ships entering and leaving each port per year. As shown in Figure 1, the number of ships entering and departing through Busan Port is overwhelmingly larger than those through the other two ports.
The total number of entries and departures through a port and the types of vessels that have entered and departed are different. Figure 2 shows three pie charts presenting the proportion of the total number of ships’ operation records by ship type in each port. In all three ports, cargo ships that were not subject to the VSR program had the highest proportion of entry and departure. Meanwhile, other (ETC) ships, which are frequently operated, such as tugboats, barges, and pilot ships, accounted for a high proportion. The types of ships subject to the VSR program show that Busan Port and Incheon Port have the highest percentage of full-container vessels, whereas Ulsan Port has the highest percentage of chemical carriers.
Next, Figure 3 presents the monthly average level of air pollutants by region. As shown in Figure 3, air pollutants are seasonal, so periods with a high air pollutant level are seasonally repeated. Furthermore, annual trends may exist, even though they are not that noticeable. Hence, annual trends and seasonality must be controlled upon designing a regression model for the level of air pollutants. In addition, the average level of air pollutants varies, depending on where the port is located. Figure 3 confirms that the average air quality in the area where Incheon Port is located is worse than that of Busan Port and Ulsan Port at all times. Thus, the influence caused by port characteristics must be controlled when analyzing data on various ports located in different regions.

2.3. Empirical Methodology

In the previous section, we determine the data’s characteristics through descriptive statistics. This section proposes a regression model to identify the VSR program’s effect on air quality in port areas, considering the data’s characteristics. First, we set a regression model to show whether the VSR program has reduced ship operation’s negative impact on the air quality in port areas:
y i t = α + β ( A f t e r   V S R ) t + γ ( N o .   o f   S h i p s ) i t + θ t + μ i + ϵ i t   ,
where γ = γ 1 + γ 2 ( A f t e r   V S R ) t , i is the individual port, and t is the period (year, month, day, and hour).
In Equation (1), the dependent variable y i t denotes the log value of the average air pollutant level in the area where the port i is located at time t—the time point t is an hour. θ t is a time characteristic vector to control for time trends and includes year, month, and hour dummies. μ i indicates a term that controls the characteristics of a port or region that does not change over time. In this study, Equation (1) was estimated using a panel fixed-effect model to control for the port characteristic μ i .
( A f t e r   V S R ) t is a dummy variable indicating whether the VSR program is in action. It takes the value of 1 if time t is after December 2019, and 0 otherwise. ( N o .   o f   S h i p s ) i t indicates the number of ships entering and departing through port i , thus coefficient γ refers to the increase in the level of air pollutants (%) for the period when a vessel enters into or departs from the port. In this study, we assume that coefficient γ changes depending on whether the VSR program is implemented or not. The regression model was organized by dividing coefficient γ into γ 1 , which is the impact of a vessel entering or departing without a VSR program ( ( A f t e r   V S R ) t = 0 ) , and γ 2 , which is the additional impact after the implementation of the VSR program ( ( A f t e r   V S R ) t = 1 ) . In other words, a regression model in the form of Equation (2 was used in the analysis. In Equation (2), the coefficients of interest are γ 1 and γ 2 . Regardless of the VSR program, γ 1 is expected to have a positive value because the effect of one ship entering or departing from the port negatively affects air quality. If the VSR program reduces the negative factors affecting the air quality, γ 2 is expected to have a negative value.
y i t = α + β ( A f t e r   V S R ) t + γ 1 ( N o .   o f   S h i p s ) i t + γ 2 ( A f t e r   V S R N o .   o f   S h i p s ) i t + θ t + μ i + ϵ i t ,
where i is the individual port, and t is the period (year, month, day, and hour).
Equation (1) presented above can only estimate the average effect that appears in all ports. In this study, Equation (3) is also proposed to estimate each port’s heterogeneous effect. In the big three ports of Korea, the types of ships entering and departing from each port differ, and thus, the policies to manage air quality in the port area are also different. Each port has a different target vessel under the VSR program. Besides, Busan Port and Ulsan Port are different from Incheon Port as they operate the ESI system along with the VSR program. Therefore, an analysis was conducted using Equation (3) to separately estimate the VSR program’s effect for each port i. For each port i ,
y t = α + β ( A f t e r   V S R ) t + j γ j ( N o .   o f   S h i p s ) j t   + θ t + u t   ,
where γ j = γ 1 j + γ 2 j ( A f t e r   V S R ) j t , j is the type of ships, i is the individual port, and t is the period (year, month, day, and hour).
However, in Equation (3), the number of vessels of ship type j and ( N o .   o f   S h i p s ) j t were used instead of the total number of vessels. It is because that there is a difference in the types of ships that are subject to the VSR program for each port. If the total number of ships is used without being classified by ship type, the effect of ship types with high entry and departure frequency overwhelms the overall effect. For this, it is necessary to use the variables classified by ship type. Otherwise, it can lead to distorted results. As the number of entry and departure aggregated at the ship type level is used, it was possible to identify the program’s heterogeneous effects on each port and understand each ship type’s differential effect. Therefore, Equation (4) was used to estimate γ j , the coefficient of interest for both before and after the implementation of the VSR program. For each port i ,
y t = α + β ( A f t e r   V S R ) t + j γ 1 j ( N o .   o f   S h i p s ) j t   + j γ 2 j ( A f t e r   V S R N o .   o f   S h i p s ) j t + θ t + u t   ,
where j is the type of ships, i is the individual port, and t is the period (year, month, day, and hour).

3. Results

The estimation results of Equation (2) using the panel-fixed effect model are presented in Table 3.
The coefficients for (No. of Ships) show that all five substances are positive, and the estimates were statistically significant. Therefore, the average air pollutant level in the port areas increases when vessels are entering or departing through the port when the VSR program is not implemented. Expressly, when one ship enters or departs through a port, the average level of sulfur dioxide increased by 0.4%. The average value of nitrogen dioxide increased by about 0.9%, and carbon monoxide increased by about 0.4% due to ship operation for an hour. Moreover, the fine dust level increased by 0.6%, and the ultrafine dust increased by 0.8%.
Meanwhile, the coefficient of (AFTER VSR * No. of Ships), the interaction terms of the dummy variable for the VSR program and the number of ships, was estimated to be negative. It means that the negative impact caused by a ship entering the port was reduced partially after implementing the VSR program. These results suggest that the VSR program has a significant effect on air quality improvement in port areas, even though this policy is run with shipping companies’ voluntary participation.
Next, the port level estimation results using Equation (4) are presented in the following three tables. The number of entries and departures for each ship type and the interaction term with the dummy variable for the VSR program are shown together. The estimation result of the variable representing the ship type subject to the VSR program for each port is italicized and bold. First, Table 4 shows the results of the analysis using only data from Busan Port that provides incentives to general cargo ships, automobile carriers, and full container ships for their low-speed operation.
Results reveal that the three types of ship types had a negative impact on the air quality in the port area before the implementation of the VSR program. The effect of the VSR program was not significant except for automobile carriers and full container ships. In the case of automobile carriers, the negative effect on sulfur dioxide was significantly reduced, whereas in the case of full container ships, the emission of sulfur dioxide, nitrogen dioxide, and carbon monoxide was lowered after the implementation of the VSR program. In line with this study’s analysis results, the Ministry of Oceans and Fisheries was supposed to exclude general cargo ships having low performance in reducing fine dust from the target ships for the VSR program and include semi container ships in the program from 2021 [34]. Looking at the results of other ship types, we can see that the estimates of variables related to entry and departure of tugboats, barges, and pilot ships are outstanding. The entry and departure of tugboats, barges, and pilot ships significantly impacted the average air quality in the port area, and the effect of adopting the VSR program was significant. This is due to the characteristics of tugboats, barges, and pilot ships that play an auxiliary role in large-scale cargo’s entry and departure. Besides, in the case of a tugboat used to tow a large-scale ship, diesel, which generates much environmental pollution, is used as fuel because it has a high frequency of transport within the port and requires instantaneous fast speed during the operation.
Thus, the tugboat is suggested to be indirectly affected by the VSR program, even though it was not subject to the VSR program. Accordingly, the Ministry of Oceans and Fisheries and each port corporation are trying to change old diesel-powered tugboats to LNG-powered tugboats to improve air quality in the port area [35]. The program was also seen to be partly effective for cargo ships not subject to the VSR program, which can be the result of a positive external effect. As large-scale vessels participating in the VSR program operate at low speeds when entering and departing, the speed of operation of other ships entering and departing during the same period may also change, which is likely to have reduced the level of air pollution. These results are the same in all analyses from the three ports.
Next, Table 5 presents the estimation results for Ulsan Port. At the beginning of the program, Ulsan Port provided incentives for the low-speed operation of the following three types of ships designated by the Ministry of Oceans and Fisheries: crude oil carriers, chemical carriers, and full container ships. Soon, it expanded the target ship types to automobile carriers and petroleum product carriers [36]. However, the estimation results reveal that Ulsan Port did not show the VSR program’s effect well compared with Busan Port. Among the target ship types, only full container ships showed the effect of the VSR program partially because those full container ships have received a higher level of reduction in entry and departure fees compared with other target ship types. However, the analysis data and model of this study has certain limitations in that petroleum product carriers were not separated and analyzed. According to the analysis data in this study, petroleum product carriers are classified as non-target cargo/carrying ships.
Finally, the analysis results for Incheon Port are presented in Table 6. Incheon Port has designated LNG carriers, general cargo ships, automobile carriers, and full container ships as target ship types for the VSR program [37]. However, no significant effect has been found in the ship types subject to the VSR program except for automobile carriers. Despite the high frequency of entry and departure for full container ships, the program’s positive effect was not high even for full container ships.
Comprehensively, the VSR program positively impacted the improvement of air quality in the port area, but the level of improvement was not high yet. The effect in the ship types designated under the program was not outstanding. The outcome is due to the VSR program’s limitation of ship types and because the policy effect is not vitalized significantly due to the characteristics of the program where shipping companies voluntarily participate. However, the negative impact of other ships, such as tugboats, on air pollution could be minimized due to the low-speed operation of some types of ships.

4. Discussion

4.1. Major Findings

In this study, the effect of the VSR program, which is the policy to reduce air pollution in port areas caused by the ship operation, was demonstrated. Panel data were established to identify air quality changes depending on the type of ships entering and departing at the port level by combining the port entry and departure data and real-time air quality monitoring data. Previous studies have focused on the effect of the VSR program on reducing emissions from ships directly, whereas this present study focused on the changes in air quality due to the VSR program. This study considers that the VSR program improves the air quality by changing the behavior of ships entering and departing through ports. Moreover, this study demonstrates whether the VSR program drives ships entering and departing through ports to reduce the negative impact on the air quality in the port area. The port area’s air quality was represented by the concentration of sulfur oxide, nitrogen oxide, carbon monoxide, fine dust, and ultrafine dust collected at an observatory within a 10 km radius of the port.
Results of the analysis reveal that the concentration of air pollutants in the port area increases every time a ship enters and departs through a port during the period when the VSR program was not implemented. However, this increase would slow down after the implementation of the VSR program. Therefore, the VSR program had a positive effect on improving air quality in the port area. As the ship types subject to the VSR program are different across ports, the effects of the VSR program policy also vary. Busan Port showed the highest policy effect, whereas Incheon Port showed a relatively low policy effect. Furthermore, full container ships showed the most considerable policy impact as they can acquire the largest incentives for participating in the VSR program. Other ship types showed some effects, but they were not that significant. One outstanding factor found in this empirical study is that policy effects spread through unexpected channels, and not the ship types subject to the VSR program. In particular, the policy effect is shown in tugboats, barges, and pilot boats that play the supporting role for large ships coming into and departing from the port. It indicates that the VSR program contributed to reducing the negative impact of barges that produce a significant amount of air pollutants than general large-scale ships.

4.2. Policy Implications

Based on these analysis results, this study proposed some policy implications. The current policy is established based on the level of air pollutants released from ships. Accordingly, the ship types subject to the VSR program are limited to some ship types coming and going through external ports with a capacity of 3000 tons or more. However, the frequency of such ships’ entry and departure through the port is shallow. For future policies, target ship types subject to the VSR program must be selected, considering the frequency of entering and departing together. Besides, ships that arrive and depart through external ports and small-scale ships in internal ports, which are located closer to the inland area, must be included to improve policy effectiveness.
In addition, the adoption of other environmental regulation policies with the VSR program is expected to be more effective. In this study, Busan and Ulsan Ports, where the ESI program is accompanied by the VSR program to reduce entry fees for eco-friendly ships, were found to show higher policy effects than Incheon Port. As such, if several eco-friendly policies are established and implemented together, the release of air pollutants may be minimized throughout the process of ships’ operation, such as entering or departing at a low speed and using an onshore power supply system.

Author Contributions

Conceptualization, J.A., K.L., and H.P.; methodology, J.A. and H.P.; data analysis, J.A. and H.P.; data interpretation, J.A. and H.P.; writing—original draft preparation, J.A. and H.P.; writing—review and editing, K.L. and H.P.; funding acquisition, K.L. All authors have read and agreed to the published version of the manuscript.

Funding

This research was supported by Korea Maritime Institute (Project title: Strategies for development of smart ports, 2021010AEBE-00).

Institutional Review Board Statement

Not applicable.

Informed Consent Statement

Not applicable.

Data Availability Statement

Data are available from the authors upon request.

Conflicts of Interest

The authors declare no conflict of interest.

References

  1. Endresen, Ø.; Sørgård, E.; Sundet, J.K.; Dalsøren, S.B.; Isaksen, I.S.; Berglen, T.F.; Gravir, G. Emission from international sea transportation and environmental impact. J. Geophys. Res. Atmos. 2003, 108. [Google Scholar] [CrossRef]
  2. Yau, P.S.; Lee, S.C.; Corbett, J.J.; Wang, C.; Cheng, Y.; Ho, K.F. Estimation of exhaust emission from ocean-going vessels in Hong Kong. Sci. Total Environ. 2012, 431, 299–306. [Google Scholar] [CrossRef] [PubMed]
  3. Fu, Q.; Shen, Y.; Zhang, J. On the ship pollutant emission inventory in Shanghai port. J. Saf. Environ. 2012, 12, 57–64. [Google Scholar]
  4. De Cola, E.; Robertson, T.; Fisher, M.; Blair, L. Phasing out the Use and Carriage for Use of Heavy Fuel Oil in the Canadian Arctic: Impacts to Northern Communities. Report to WWF-Canada. 2018. Available online: https://wwf.ca/downloads/phasing_out_heavy_fuel_oil_report.pdf (accessed on 27 March 2021).
  5. Liu, H.; Fu, M.; Jin, X.; Shang, Y.; Shindell, D.; Faluvegi, G.; He, K. Health and climate impacts of ocean-going vessels in East Asia. Nat. Clim. Chang. 2016, 6, 1037–1041. [Google Scholar] [CrossRef]
  6. IMO. IMO 2020: Consistent Implementation of MARPOL Annex VI, 2019 ed.; International Maritime Organization: London, UK, 2019. [Google Scholar]
  7. Van, T.C.; Ramirez, J.; Rainey, T.; Ristovski, Z.; Brown, R.J. Global impacts of recent IMO regulations on marine fuel oil refining processes and ship emissions. Transp. Res. Part D Transp. Environ. 2019, 70, 123–134. [Google Scholar] [CrossRef]
  8. Repka, S.; Erkkilä-Välimäki, A.; Jonson, J.E.; Posch, M.; Törrönen, J.; Jalkanen, J.P. Assessing the costs and environmental benefits of IMO regulations of ship-originated SOx and NOx emissions in the Baltic Sea. Ambio 2021. [Google Scholar] [CrossRef]
  9. Joung, T.-H.; Kang, S.-G.; Lee, J.-K.; Ahn, J. The IMO initial strategy for reducing Greenhouse Gas(GHG) emissions, and its follow-up actions towards 2050. J. Int. Marit. Saf. Environ. Aff. Shipp. 2020, 4, 1–7. [Google Scholar] [CrossRef] [Green Version]
  10. Ekmekçioğlu, A.; Kuzu, S.L.; Ünlügençoğlu, K.; Çelebi, U.B. Assessment of shipping emission factors through monitoring and modelling studies. Sci. Total Environ. 2020, 743, 140742. [Google Scholar] [CrossRef] [PubMed]
  11. Liu, J.; Duru, O. Bayesian probabilistic forecasting for ship emissions. Atmos. Environ. 2020, 231, 117540. [Google Scholar] [CrossRef]
  12. Eyring, V.; Köhler, H.W.; Van Aardenne, J.; Lauer, A. Emissions from international shipping: 1. The last 50 years. J. Geophys. Res. Space Phys. 2005, 110. [Google Scholar] [CrossRef]
  13. Merk, O. Shipping Emissions in Ports; OECD: Paris, France, 2014. [Google Scholar]
  14. Burchacz, M.; Piotrowicz, J. Green port incentives in the European cruise industry. Biul. Inst. Morskiego 2018, 33, 103–110. [Google Scholar] [CrossRef]
  15. Han, C.-H. Strategies to Reduce Air Pollution in Shipping Industry. Asian J. Shipp. Logist. 2010, 26, 7–29. [Google Scholar] [CrossRef] [Green Version]
  16. Cho, N.-W.; Lee, M.-J. Exploring Changes in Coastal Environment Policy Using Text Mining: A Case Study in South Korea. J. Coast. Res. 2020, 102, 47–53. [Google Scholar] [CrossRef]
  17. Eum, Y.; Song, I.; Kim, H.C.; Leem, J.H.; Kim, S.Y. Computation of geographic variables for air pollution prediction models in South Korea. Environ. Health Toxicol. 2015, 30, e2015010. [Google Scholar] [CrossRef] [Green Version]
  18. Lee, T.; Nam, H. A Study on Green Shipping in Major Countries: In the View of Shipyards, Shipping Companies, Ports, and Policies. Asian J. Shipp. Logist. 2017, 33, 253–262. [Google Scholar] [CrossRef]
  19. Lee, J.H.; Lim, S. The selection of compact city policy instruments and their effects on energy consumption and greenhouse gas emissions in the transportation sector: The case of South Korea. Sustain. Cities Soc. 2018, 37, 116–124. [Google Scholar] [CrossRef]
  20. Ministry of Oceans and Fisheries. Vessel Speed Reduction(Vsr) Program to Start December This Year. Available online: https://www.mof.go.kr/en/board.do?menuIdx=1491&bbsIdx=30629 (accessed on 27 March 2021).
  21. Ammar, N.R.; Seddiek, I.S. Eco-environmental analysis of ship emission control methods: Case study RO-RO cargo vessel. Ocean Eng. 2017, 137, 166–173. [Google Scholar] [CrossRef]
  22. Chen, L.; Yip, T.L.; Mou, J. Provision of Emission Control Area and the impact on shipping route choice and ship emissions. Transp. Res. Part D Transp. Environ. 2018, 58, 280–291. [Google Scholar] [CrossRef]
  23. Benford, H. A simple approach to fleet deployment. Marit. Policy Manag. 1981, 8, 223–228. [Google Scholar] [CrossRef]
  24. Tezdogan, T.; Incecik, A.; Turan, O.; Kellett, P. Assessing the Impact of a Slow Steaming Approach on Reducing the Fuel Consumption of a Containership Advancing in Head Seas. Transp. Res. Procedia 2016, 14, 1659–1668. [Google Scholar] [CrossRef] [Green Version]
  25. Woo, J.-K.; Moon, D.S.-H. The effects of slow steaming on the environmental performance in liner shipping. Marit. Policy Manag. 2014, 41, 176–191. [Google Scholar] [CrossRef]
  26. Ahl, C.; Frey, E.; Steimetz, S. The effects of financial incentives on vessel speed reduction: Evidence from the Port of Long Beach Green Flag Incentive Program. Marit. Econ. Logist. 2017, 19, 601–618. [Google Scholar] [CrossRef]
  27. Corbett, J.J.; Wang, H.; Winebrake, J.J. The effectiveness and costs of speed reductions on emissions from international shipping. Transp. Res. Part D Transp. Environ. 2009, 14, 593–598. [Google Scholar] [CrossRef]
  28. Linder, A. Explaining shipping company participation in voluntary vessel emission reduction programs. Transp. Res. Part D Transp. Environ. 2018, 61, 234–245. [Google Scholar] [CrossRef]
  29. Zhuge, D.; Wang, S.; Zhen, L.; Laporte, G. Subsidy design in a vessel speed reduction incentive program under government policies. Nav. Res. Logist. 2021, 68, 344–358. [Google Scholar] [CrossRef]
  30. Zis, T.; North, R.J.; Angeloudis, P.; Ochieng, W.Y.; Bell, M.G.H. Evaluation of cold ironing and speed reduction policies to reduce ship emissions near and at ports. Marit. Econ. Logist. 2014, 16, 371–398. [Google Scholar] [CrossRef]
  31. Khan, M.Y.; Agrawal, H.; Ranganathan, S.; Welch, W.A.; Miller, J.W.; Cocker, D.R., III. Greenhouse gas and criteria emission benefits through reduction of vessel speed at sea. Environ. Sci. Technol. 2012, 46, 12600–12607. [Google Scholar] [CrossRef]
  32. Chang, C.C.; Chang, C.H. Energy conservation for international dry bulk carriers via vessel speed reduction. Energy Policy 2013, 59, 710–715. [Google Scholar] [CrossRef]
  33. Cariou, P. Is slow steaming a sustainable means of reducing CO2 emissions from container shipping? Transp. Res. Part D Transp. Environ. 2011, 16, 260–264. [Google Scholar] [CrossRef]
  34. Ministry of Environment. Improvement of Operation of Vessel Sped Reduction Program. Available online: http://blueskyday.kr/bbs/board.php?bo_table=report&wr_id=14&page=3 (accessed on 27 March 2021).
  35. Ministry of Oceans and Fisheries. Project to Promote the Conversion of Old Qualifiers to LNG Fuel. Available online: https://www.mof.go.kr/article/view.do?articleKey=28584&boardKey=9&menuKey=375&currentPageNo=1 (accessed on 27 March 2021).
  36. Ulsan Port Authority. Expansion of Vessel Speed Reduction Program from the New Year to Reduce Particular Matters in the Port Area. Available online: https://www.upa.or.kr/bbs/view.do?bbsId=BBS_0000000000000060&mId=001005002001000000&dataId=9750 (accessed on 27 March 2021).
  37. Incheon Port Authority. Introduction of Vessel Speed Reduction Program. Available online: https://www.icpa.or.kr/mobile/content/view.do?menuKey=3044&contentKey=836 (accessed on 27 March 2021).
Figure 1. Time-series graph of the total number of ships entering and leaving each port.
Jmse 09 00407 g001
Figure 2. The portion of total ships entering and departing (by ship type).
Jmse 09 00407 g002aJmse 09 00407 g002b
Figure 3. The monthly average level of air pollutants by port.
Jmse 09 00407 g003aJmse 09 00407 g003b
Table 1. Target vessel type and recommended speed.
Busan PortUlsan PortYeosu and Gwangyang PortsIncheon Port
Ship TypeSpeed
(Knot)
Ship TypeSpeed
(Knot)
Ship TypeSpeed
(Knot)
Ship TypeSpeed
(Knot)
Container vessel 12Container vessel 12Container vessel12Container vessel12
General cargo vessel 10Oil carrier10General cargo vessel10Oil carrier10
Automobile carrier 12Chemical carrier10Automobile carrier12Chemical carrier 10
Table 2. Summary statistics.
VariablesNMeanSDMinMax
No. of Ships
Operating
per hour
Total (Arrivals + Departures)212,44716.6199.7592154
Total Arrivals212,4478.3325.739196
Total Departures212,4478.2875.630196
Through External Port212,4478.5256.1930102
Through Internal Port212,4478.0945.553078
Full Container Ship212,4473.2113.815060
Carrying LNG Ship212,4470.0360.26906
Carrying Automobile Ship212,4470.2340.716018
Carrying Chemical Ship212,4470.4090.994018
General Cargo Ship212,4470.9981.503024
Carrying Crude Oil Ship212,4470.0940.45308
Other Non-target Cargo/Carrying Ship212,4477.3444.675072
Passenger Ship212,4470.8661.695030
Tugboat/Barge/Pilot Ship212,4472.6593.241054
ETC212,4475.9034.290056
Average level of PollutantsSulfur dioxide ( S O 2 , ppm)212,4470.0100.0060.0010.120
Nitrogen dioxide ( N O 2 , ppm)212,4470.0380.0260.0010.272
Carbon monoxide (CO, ppm)212,4470.7110.4230.1548.072
Particulate matter 10 μm ( P M 10 , μg/m3)212,44768.09649.5753.8802340.379
Particulate matter 2.5 μm ( P M 2.5 , μg/m3)108,11235.20626.5631.552371.666
Notes: The data on ultrafine dust of PM (particulate matter) 2.5 have been collected since 2015. N denotes the number of observations in the analysis sample; Mean means the average value of each variable in the sample; SD indicates the standard deviation of each variable; Min and Max mean the smallest value and the largest value of each variable; ETC indicates other ships.
Table 3. Estimation results of panel regression for the big three ports.
All Ports
Variables S O 2 N O 2 C O P M 10 P M 2.5
AFTER VSR−0.0080.226 **0.0400.047 **0.108 **
(0.060)(0.051)(0.019)(0.010)(0.020)
No. of Ships0.004 **0.009 ***0.004 ***0.006 ***0.008 ***
(0.001)(0.001)(0.000)(0.001)(0.001)
AFTER VSR * No. of Ships−0.004 *−0.008 **−0.004 *−0.005−0.007
(0.001)(0.001)(0.001)(0.002)(0.002)
Constant−4.812 ***−3.475 ***−0.264 **4.107 ***3.538 ***
(0.089)(0.041)(0.030)(0.070)(0.102)
Port FEYYYYY
Year dummyYYYYY
Month dummyYYYYY
Time dummyYYYYY
Adj. R-sq.0.2180.2390.2120.1580.133
N212,447212,447212,447212,447108,112
Notes: (1) *, **, and *** denote significance at the 10%, 5%, and 1% levels, respectively. (2) Standard errors are in parenthesis and robust to heteroskedasticity and port-level clustering.
Table 4. Estimation results of Busan Port.
Busan
Variables S O 2 N O 2 C O P M 10 P M 2.5
AFTER VSR−0.075 ***0.222 ***0.037 ***−0.0140.008
(0.013)(0.022)(0.011)(0.021)(0.027)
NON-TARGET CARGO/CARRYING SHIP0.003 ***0.006 ***0.003 ***0.005 ***0.007 ***
(0.000)(0.000)(0.000)(0.001)(0.001)
AFTER VSR * NON-TARGET CARGO/CARRYING SHIP−0.002−0.006 ***−0.0010.0020.001
(0.001)(0.002)(0.001)(0.002)(0.003)
CARRYING LNG SHIP−0.018 *0.002−0.010−0.0080.007
(0.010)(0.010)(0.006)(0.012)(0.015)
AFTER VSR * CARRYING LNG SHIP0.0100.0430.005−0.004−0.034
(0.022)(0.046)(0.025)(0.052)(0.072)
CARRYING CRUDE OIL SHIP0.0130.016 *0.0060.019 *0.031 **
(0.009)(0.009)(0.005)(0.010)(0.014)
AFTER VSR * CARRYING CRUDE OIL SHIP−0.020 *−0.032−0.0080.008−0.020
(0.012)(0.022)(0.009)(0.021)(0.029)
GENERAL CARGO SHIP0.007 ***0.010 ***0.004 ***0.008 ***0.011 ***
(0.001)(0.001)(0.001)(0.001)(0.002)
AFTER VSR * GENERAL CARGO SHIP−0.002−0.0020.0010.008 **0.005
(0.002)(0.003)(0.001)(0.003)(0.004)
CARRYING AUTOMOBILE SHIP0.008 ***0.015 ***0.006 ***0.009 ***0.019 ***
(0.002)(0.002)(0.001)(0.003)(0.005)
AFTER VSR * CARRYING AUTOMOBILE SHIP−0.010*−0.013−0.004−0.004−0.022
(0.006)(0.014)(0.006)(0.014)(0.016)
CARRYING CHEMICAL SHIP0.005 *0.007 ***0.0020.0020.001
(0.003)(0.003)(0.002)(0.003)(0.005)
AFTER VSR * CARRYING CHEMICAL SHIP0.002−0.006−0.008−0.001−0.012
(0.007)(0.010)(0.005)(0.011)(0.014)
FULL CONTAINER SHIP0.002 ***0.0000.001 ***0.001 *0.001
(0.000)(0.000)(0.000)(0.000)(0.001)
AFTER VSR * FULL CONTAINER SHIP−0.003 ***−0.005 ***−0.002 ***−0.002−0.003
(0.001)(0.001)(0.001)(0.001)(0.002)
PASSENGER SHIP0.006 ***−0.0010.001 **0.005 ***0.008 ***
(0.001)(0.001)(0.000)(0.001)(0.001)
AFTER VSR * PASSENGER SHIP−0.0040.011 **0.001−0.0040.003
(0.002)(0.005)(0.002)(0.005)(0.006)
TUGBOAT/BARGE BOAT/PILOT SHIP0.007 ***0.012 ***0.004 ***0.009 ***0.011 ***
(0.000)(0.000)(0.000)(0.000)(0.001)
AFTER VSR * TUGBOAT/BARGE BOAT/PILOT SHIP−0.005 ***−0.007 ***−0.004 ***−0.004 **−0.007 ***
(0.001)(0.002)(0.001)(0.002)(0.002)
ETC0.001 **0.005 ***0.001 ***0.002 ***0.002 **
(0.001)(0.000)(0.000)(0.001)(0.001)
AFTER VSR * ETC0.0000.003−0.001−0.000−0.002
(0.001)(0.002)(0.001)(0.002)(0.003)
Constant−5.068 ***−3.705 ***−0.558 ***3.991 ***3.375 ***
(0.010)(0.011)(0.006)(0.011)(0.017)
Year dummyYYYYY
Month dummyYYYYY
Time dummyYYYYY
Adj. R-sq.0.2600.3050.2610.1990.189
N83,76283,76283,76283,76243,347
Notes: (1) *, **, and *** denote significance at the 10%, 5%, and 1% levels, respectively. (2) Standard errors are in parenthesis and robust to serial correlation.
Table 5. Estimation results of Ulsan Port.
Ulsan
Variables S O 2 N O 2 C O P M 10 P M 2.5
AFTER VSR0.088 ***0.155 ***0.031 **0.0290.128 ***
(0.021)(0.019)(0.012)(0.023)(0.030)
NON-TARGET CARGO/CARRYING SHIP0.004 ***0.006 ***0.001 **0.005 ***0.003 **
(0.001)(0.001)(0.001)(0.001)(0.002)
AFTER VSR * NON-TARGET CARGO/CARRYING SHIP0.001−0.007 **−0.003 *−0.005−0.005
(0.003)(0.003)(0.002)(0.004)(0.005)
CARRYING LNG SHIP0.0390.0220.007−0.0130.030
(0.032)(0.019)(0.014)(0.027)(0.040)
AFTER VSR * CARRYING LNG SHIP−0.115 **−0.0180.0400.0960.115
(0.047)(0.046)(0.027)(0.082)(0.101)
CARRYING CRUDE OIL SHIP0.0020.009 ***0.006 ***0.013 ***0.024 ***
(0.003)(0.002)(0.002)(0.003)(0.004)
AFTER VSR * CARRYING CRUDE OIL SHIP−0.003−0.003−0.0070.001−0.011
(0.008)(0.008)(0.005)(0.009)(0.012)
GENERAL CARGO SHIP0.007 ***0.011 ***0.002 *0.013 ***0.011 ***
(0.002)(0.001)(0.001)(0.002)(0.003)
AFTER VSR * GENERAL CARGO SHIP−0.018 ***−0.011 **−0.002−0.010−0.008
(0.005)(0.005)(0.003)(0.006)(0.007)
CARRYING AUTOMOBILE SHIP0.005 *0.014 ***0.004 ***0.005 **0.013 ***
(0.002)(0.002)(0.002)(0.002)(0.004)
AFTER VSR * CARRYING AUTOMOBILE SHIP0.0060.004−0.005−0.008−0.007
(0.008)(0.006)(0.005)(0.008)(0.011)
CARRYING CHEMICAL SHIP0.003 **0.005 ***0.002 **0.006 ***0.008 ***
(0.001)(0.001)(0.001)(0.001)(0.002)
AFTER VSR * CARRYING CHEMICAL SHIP−0.000−0.006−0.0030.000−0.005
(0.005)(0.005)(0.003)(0.005)(0.007)
FULL CONTAINER SHIP−0.0010.0010.002 **0.004 **0.007 ***
(0.002)(0.001)(0.001)(0.001)(0.002)
AFTER VSR * FULL CONTAINER SHIP0.003−0.004−0.005 **0.003−0.001
(0.005)(0.004)(0.002)(0.005)(0.006)
PASSENGER SHIP−0.024−0.012−0.0050.0130.035
(0.026)(0.022)(0.015)(0.026)(0.033)
AFTER VSR * PASSENGER SHIP−0.0090.0330.099 ***−0.0020.096
(0.034)(0.079)(0.020)(0.034)(0.088)
TUGBOAT/BARGE BOAT/PILOT SHIP0.012 ***0.027 ***0.011 ***0.022 ***0.028 ***
(0.001)(0.001)(0.001)(0.001)(0.002)
AFTER VSR * TUGBOAT/BARGE BOAT/PILOT SHIP−0.007 *−0.017 ***−0.009 ***−0.010 **−0.019 ***
(0.004)(0.004)(0.002)(0.004)(0.005)
ETC−0.0010.002 **0.002 ***−0.0000.002
(0.001)(0.001)(0.001)(0.001)(0.002)
AFTER VSR * ETC−0.0000.003−0.0010.0050.005
(0.004)(0.003)(0.002)(0.004)(0.005)
Constant−5.037 ***−3.794 ***−0.404 ***3.773 ***3.175 ***
(0.013)(0.012)(0.009)(0.013)(0.021)
Year dummyYYYYY
Month dummyYYYYY
Time dummyYYYYY
Adj. R-sq.0.2960.2390.1770.1410.118
N72,77472,77472,77472,77437,185
Notes: (1) *, **, and *** denote significance at the 10%, 5%, and 1% levels, respectively. (2) Standard errors are in parenthesis and robust to serial correlation.
Table 6. Estimation results of Incheon Port.
Incheon
Variables S O 2 N O 2 C O P M 10 P M 2.5
AFTER VSR−0.201 ***0.077 ***−0.036 **−0.092 ***−0.007
(0.011)(0.024)(0.016)(0.026)(0.035)
NON-TARGET CARGO/CARRYING SHIP0.005 ***0.008 ***0.004 ***0.008 ***0.010 ***
(0.001)(0.001)(0.001)(0.001)(0.002)
AFTER VSR * NON-TARGET CARGO/CARRYING SHIP−0.004 ***−0.007 **−0.006 ***−0.012 ***−0.021 ***
(0.002)(0.003)(0.002)(0.004)(0.005)
CARRYING LNG SHIP0.002−0.005−0.0020.000−0.004
(0.003)(0.004)(0.003)(0.005)(0.008)
AFTER VSR * CARRYING LNG SHIP−0.0030.006−0.007−0.0010.009
(0.006)(0.015)(0.009)(0.015)(0.020)
CARRYING CRUDE OIL SHIP0.0050.0070.001−0.006−0.003
(0.005)(0.006)(0.005)(0.008)(0.011)
AFTER VSR * CARRYING CRUDE OIL SHIP0.011−0.050 *−0.025−0.005−0.034
(0.014)(0.030)(0.017)(0.033)(0.035)
GENERAL CARGO SHIP0.004 ***0.005 ***0.002 **0.005 ***0.003
(0.001)(0.001)(0.001)(0.001)(0.003)
AFTER VSR * GENERAL CARGO SHIP−0.0010.003−0.002−0.004−0.003
(0.003)(0.006)(0.003)(0.006)(0.008)
CARRYING AUTOMOBILE SHIP0.0000.003−0.0010.002−0.001
(0.002)(0.003)(0.002)(0.003)(0.006)
AFTER VSR * CARRYING AUTOMOBILE SHIP−0.006−0.001−0.014 *−0.023−0.026
(0.006)(0.014)(0.007)(0.016)(0.018)
CARRYING CHEMICAL SHIP0.0020.0040.007 **0.004−0.011
(0.003)(0.003)(0.003)(0.005)(0.008)
AFTER VSR * CARRYING CHEMICAL SHIP−0.008−0.038 **−0.027 ***−0.016−0.032
(0.006)(0.016)(0.009)(0.017)(0.023)
FULL CONTAINER SHIP0.002 *−0.0010.0010.0020.002
(0.001)(0.001)(0.001)(0.001)(0.002)
AFTER VSR * FULL CONTAINER SHIP0.0020.001−0.0010.006−0.001
(0.002)(0.004)(0.002)(0.004)(0.006)
PASSENGER SHIP0.007 ***0.019 ***0.003 ***0.006 ***0.000
(0.001)(0.001)(0.001)(0.002)(0.003)
AFTER VSR * PASSENGER SHIP−0.002−0.015 ***−0.0020.0030.000
(0.003)(0.005)(0.003)(0.007)(0.008)
TUGBOAT/BARGE BOAT/PILOT SHIP0.006 ***0.009 ***0.004 ***0.006 ***0.009 ***
(0.001)(0.001)(0.001)(0.001)(0.002)
AFTER VSR * TUGBOAT/BARGE BOAT/PILOT SHIP0.001−0.005−0.0020.0020.004
(0.002)(0.004)(0.002)(0.004)(0.005)
ETC−0.0010.002 *0.001 *−0.002 **−0.004 *
(0.001)(0.001)(0.001)(0.001)(0.002)
AFTER VSR * ETC0.003 *0.0030.0010.0070.015 **
(0.002)(0.004)(0.002)(0.005)(0.006)
Constant−4.087 ***−2.599 ***0.415 ***4.767 ***4.386 ***
(0.009)(0.014)(0.011)(0.015)(0.026)
Year dummyYYYYY
Month dummyYYYYY
Time dummyYYYYY
Adj. R-sq.0.3460.2610.3580.1990.174
N55,91155,91155,91155,91127,580
Notes: (1) *, **, and *** denote significance at the 10%, 5%, and 1% levels, respectively. (2) Standard errors are in parenthesis and robust to serial correlation.
Publisher’s Note: MDPI stays neutral with regard to jurisdictional claims in published maps and institutional affiliations.

