Abstract
To study the optimal design of Wave Glider parameters in the wave environment of the Northwest Pacific Ocean, the North Indian Ocean, and the South China Sea, the average velocity of a Wave Glider was taken as the evaluation criterion. Wave reanalysis data from ERA5 were used to classify the mean wave height and period into five types by the K-means clustering method. In addition, a dynamic model was used to simulate the influence of umbilical length, airfoil, and maximum limited angle on the velocity of the Wave Glider under the five types of wave element. The force of the wings was simulated using FLUENT as the model input. The simulation results show that (1) 7 m is the most suitable umbilical length; (2) a smaller relative thickness should be selected in perfect conditions; and (3) for the first type of wave element, 15° is the best choice for the maximum limited angle, and 20° is preferred for the second, third, and fourth types, while 25° is preferred for the fifth type.
1. Introduction
The Wave Glider is a new type of unmanned ocean vehicle developed by Liquid Robotics. The key innovation of the Wave Glider is its ability to harvest the abundant energy in ocean waves to provide essentially limitless propulsion [1]. At the same time, solar panels on the float power the control system, communication system, and various sensors. The Wave Glider has great significance for resource exploration, environmental monitoring, military reconnaissance, and other applications [2,3,4,5,6,7].
A Wave Glider is composed of a float, a glider, and an umbilical, as shown in Figure 1. The propulsion system is purely mechanical and neither generates nor consumes electricity [8,9]. As shown in Figure 2, when the wave surface rises, the float rises with the wave surface and causes the glider to rise. The wings deflect and are subjected to forces in both the forward and downward directions. Similarly, as the Wave Glider sinks with the wave, its wings deflect and are subjected to forces in both the forward and upward directions. As a result of the fluctuations of the wave surface, the wings drive the Wave Glider to move forward [10].
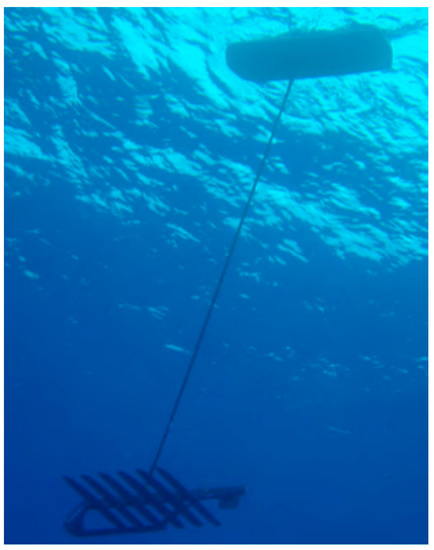
Figure 1.
Wave Glider.
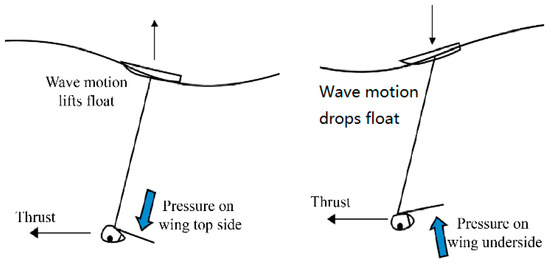
Figure 2.
Wave Glider principles of operation.
To improve the performance of Wave Gliders, their hydrodynamic parameters have been studied. To optimize these parameters, Kraus [11,12] established the first Wave Glider dynamic model, based on the ship 6-DOF dynamic model that was established by Fossen [13], and effectively simulated the motion of a Wave Glider. Qi et al. [14] and Jia et al. [15] established the dynamic equation of a Wave Glider based on the Kane equation and used MATLAB to simulate and analyze the motion when a Wave Glider sinks with the wave surface. Tian et al. [16,17] used the D-H method to establish a motion equation and analyze the influence of wave height, wave period, and maximum limited angle on motion efficiency. Li [18] used a dynamic model to simulate the influence of umbilical length and wing number, which provide the basis for parameter optimization. In addition, he simulated the speed under first- and third-level sea conditions and the survivability under ninth-level sea conditions. To study the course control of a Wave Glider, Lu [19] established a 6-DOF dynamic model and used MATLAB/Simulink software to analyze the interference of wind, waves, and flow. Li [20] established a 3-DOF dynamic model by using the Newton–Euler method to simulate the motion of a Wave Glider, verifying the accuracy of the simulation by using the results of three tests of the Wave Glider in the sea.
These studies used dynamics to simulate the motion of Wave Gliders, but the optimization schemes for parameters were only proposed for the single wave-element conditions. In this paper, we take the average velocity as the evaluation criterion and study the optimal design of Wave Glider parameters under the wave environments of the Northwest Pacific Ocean, the North Indian Ocean, and the South China Sea. We also use the force on the wings, simulated by FLUENT, as the input for the wing thrust in the model, instead of the force calculated by an empirical formula.
Wave reanalysis data from ERA5 are used to classify the mean wave height and period of the Northwest Pacific Ocean, the North Indian Ocean, and the South China Sea into five types by the K-means clustering method. In addition, a dynamic model is used to simulate the influence of umbilical length, airfoil, and maximum limited angle of the wing on the velocity of a Wave Glider under the five types of wave element.
2. Cluster Analysis of Wave Elements
The data selected for this study are the effective wave height and mean wave period data from ERA5, the global atmospheric and oceanic reanalysis data set of the European Center for Mesoscale Weather Forecasting. The temporal resolution is one month, and the time range is from 1981 to 2010. The spatial resolution is 0.5° × 0.5°, and the spatial range is the North Indian Ocean, the Northwest Pacific Ocean, and the South China Sea. The specific spatial range is 65° N–0°, 30° E–180° E. The K-means method is adopted to cluster the mean wave height and period into five types. The clustering results are shown in Figure 3 and Figure 4.
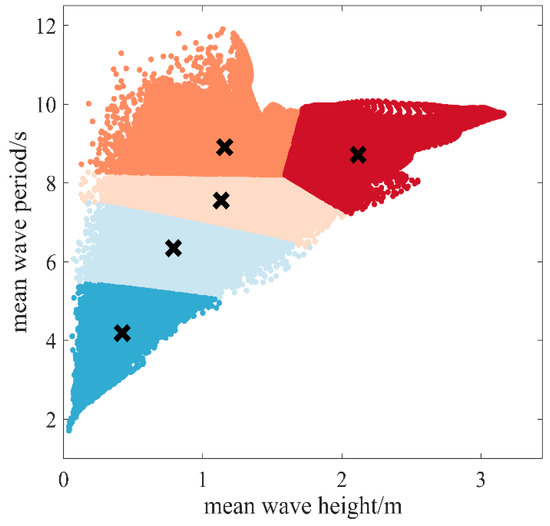
Figure 3.
Clustering results of wave elements.
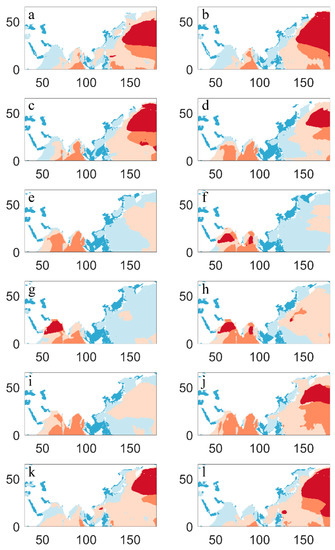
Figure 4.
Wave classification in each month: (a) January, (b) February, (c) March, (d) April, (e) May, (f) June, (g) July, (h) August, (i) September, (j) October, (k) November, and (l) December.
In Figure 3, “×” represents each cluster center. The data values for each cluster center are shown in Table 1.

Table 1.
Values of each cluster center.
The color in Figure 4 corresponds to the color in Figure 3. The first type of wave element is mainly distributed to the south of the South China Sea from March to August. The second type of wave element is mainly distributed in the west of the Arabian Sea from November to March of the following year, the west of the Northwest Pacific Ocean from May to July, the north of the South China Sea from February to September, and the south of the South China Sea in February, March, and October. The third type of wave element is mainly distributed in the west of the Northwest Pacific Ocean from October to April of the following year, the central North Pacific Ocean from May to June and August to September, and the South China Sea from November to January of the following year. The fourth type of wave element is mainly distributed in the south of the North Pacific from October to April of the following year, the east of the north Indian Ocean from January to March, the north Indian Ocean from April to May and September to October, and the south of the north Indian Ocean from June to August. The fifth type of wave element is mainly distributed in the central North Pacific from October to April of the following year, the Arabian Sea from June to August, and the central Bay of Bengal in June and August.
3. Dynamic Model
In this study, a two-dimensional dynamic model of a Wave Glider proposed by Kraus was used for simulation:
where is the velocity of the Wave Glider along the x-axis in the system coordinates; is the umbilical deflection angular velocity caused by the relative displacement of the float and the glider; is total mass; is the moment of inertia around the overall center of mass; is the damping force in the x-direction; is the damping torque around the y-axis; is the force caused by buoyancy and gravity; is the thrust produced by the wings; is the distance between the overall center and the glider.
The parameters of the Wave Glider were selected based on the design of the “Ray” Wave Glider. Its float length, width, and depth are 2.1, 0.6, and 0.2 m, respectively. The length of its umbilical is 7 m. The glider length, width, and depth are 2.0, 1.1, and 0.35 m, respectively. The total mass is 110 kg, and the glider mass is 50 kg.
3.1. Thrust
The thrust generated by the wings adopts the results simulated by FLUENT. The incoming flow velocity is considered as the velocity of the glider along the z-axis. The current deflection angle of the wings is calculated in real-time by the governing equation of the wing oscillation.
The results simulated by Fluent are shown in Figure 5.

Figure 5.
The force of the wings when airfoil is NACA 0012: (a) The force in the x direction, (b) The force in the y direction, (c) torque.
The governing equation of the passive oscillation of the wings can be expressed as:
where is angular velocity; is the current deflection angle of the wings; is the maximum deflection angle of the wings; is the torque obtained by the wings; is the moment of inertia of the wings.
3.2. Time Step
To eliminate the deviation caused by the time step and the simulation time length, the change of the propulsion velocity was simulated under the third type of wave element. Time steps of 0.01, 0.005, 0.002, and 0.001 s were selected for simulation. The time for five wave periods was simulated; that is, the simulation time was 37.82 s. To determine the time step, we firstly used five times wave period as the simulation time. Therefore, we simulated until 37.82 s. The difference between the average propulsion velocities over four time steps was compared, and the average propulsion velocity was approximately regarded as the conventional true value when the time step was 0.001 s. The relative error between the average velocity and the agreed truth value was obtained, as shown in Table 2.
Table 2.
Average propulsion velocity under four time steps.
The relative errors obtained were all less than 0.1%. Considering the simulation efficiency of the model, 0.01 s was finally selected as the time step.
3.3. Simulation Time
We set the time step to 0.01 s. To reduce the influence of the wave input value on the selection of the simulation time, the multiple of the wave period was adopted as the simulation time.
The change in the average velocity was compared with the simulation of 50 times, 100 times, 500 times, 1000 times, and 2000 times wave periods. In addition, the average propulsion velocity was taken as the conventional true value under the simulation of 2000 times wave periods. The relative error between the average propulsion velocity and the conventional true value was calculated and the results are shown in Table 3.
Table 3.
Average propulsion velocity under different simulation times.
The relative error was controlled at less than 0.1%, so the simulation length was selected as 100 times wave periods.
4. Parameter Optimization Design
In this paper, for the dynamic model of the Wave Glider, the force on the wings simulated by FLUENT was taken as the input value. The optimum selection of umbilical length, airfoil, and maximum limited angle was simulated and analyzed under five kinds of wave element.
4.1. Umbilical Length
The umbilical length of a Wave Glider is generally between 4 and 7 m. The umbilical length of the SV2 Wave Glider developed by Liquid Robotics is 6 m, and that of the SV3 Wave Glider is 4 m. The umbilical lengths of Wave Gliders developed in China are generally 7 m.
A dynamic model was used to simulate the average propulsion velocity under the conditions of five kinds of wave element when the umbilical length varied from 4 to 7 m.
Considering the wave attenuation with depth, the surface wave attenuation with depth was approximated to the attenuation of small amplitude waves with infinite depth. Figure 6 shows the variation of the average propulsion velocity with the umbilical length under the five types of wave element. The average velocity increases monotonously with the increase in umbilical length under the five types of wave element. The length of the umbilical should therefore be selected as 7 m.

Figure 6.
Variation in the average propulsion velocity with the umbilical length: (a) first type, (b) second type, (c) third type, (d) fourth type, and (e) fifth type.
4.2. Airfoil
A National Advisory Committee for Aeronautics (NACA) 4-digit airfoil was selected in this study. Four airfoils, NACA0006, NACA0009, NACA0012, NACA0015, were simulated. These four airfoils differed in relative thickness.
Considering the mass change caused by the airfoil, the influence of airfoils on the average propulsion velocity was analyzed, and the results are shown in Figure 7.

Figure 7.
Variation in the average propulsion velocity with the airfoil: (a) first type, (b) second type, (c) third type, (d) fourth type, and (e) fifth type.
Figure 7 shows the variation of the average velocity with the relative thickness of the wings. Reduction of the relative thickness is conducive to the increase in the average propulsion velocity. The change of the relative thickness of the wings will cause a change in the maximum bearing capacity of the wings. Therefore, the relative thickness should be reduced appropriately to ensure that the Wave Glider does not break.
4.3. Maximum Limited Angle
The maximum limited angle of the wings affects the propulsion performance of a Wave Glider. Kraus [21], Jia [22], Hu [23], Yan [24] showed that it is better to choose a maximum limited angle between 15° and 20°.
The influence of the maximum limited angle of the wings on the propulsion velocity was simulated under five types of wave element. The airfoil NACA 0012 was selected, and maximum limited angles within the range [0°, 45°] were simulated. The results are shown in Figure 8.

Figure 8.
Variation in the average propulsion velocity with the maximum limited angle: (a) first type, (b) second type, (c) third type, (d) fourth type, and (e) fifth type.
Figure 8 shows the variation in the average velocity with the maximum limited angle. As can be seen from the figure, the average propulsion velocity increases with the maximum limited angle, first increasing and then decreasing. Under the first type of wave element, the average propulsion velocity reaches the maximum value when the maximum limited angle is 15°. For the second, third, and fourth types of wave element the value is 20°, and for the fifth type of wave element it is 25°.
Corresponding to different sea areas in different months, the specific distribution is shown in Figure 9. The recommended maximum limited angle is 15° in the blue area, 20° in the orange area, and 25° in the red area. An angle of 15° is recommended for the maximum limited angle in the offshore regions, the inland seas, and the southern part of the South China Sea from April to September. That of 25° is recommended for the maximum limited angle in the central North Pacific from October to April of the following year, the Arabian Sea from June to August, and the central Bay of Bengal in June and August. At other times, it is recommended that the maximum limited angle should be 20° in other sea areas of the Northwest Pacific Ocean, the North Indian Ocean, and the South China Sea.

Figure 9.
Selection of the maximum limited angle in different months: (a) January, (b) February, (c) March, (d) April, (e) May, (f) June, (g) July, (h) August, (i) September, (j) October, (k) November, and (l) December.
5. Conclusions and Discussion
Taking the average velocity of a Wave Glider as the evaluation criterion, we have studied the optimal design of Wave Glider parameters in the wave environments of the Northwest Pacific Ocean, the North Indian Ocean, and the South China Sea. Monthly wave reanalysis data from ERA5 were used and the mean wave height and period were classified into five types by the K-means clustering method. In addition, the stress of the wings was simulated using FLUENT in our model. The dynamic model was used to simulate the influence of umbilical length, airfoil, and maximum limited angle on the velocity of the Wave Glider under the conditions of five types of wave element. The simulation results show that:
- 7 m is recommended as the umbilical length suitable for the Northwest Pacific Ocean, the North Indian Ocean, and the South China Sea;
- An NACA4 digital airfoil with smaller relative thickness should be selected if the wings are not broken;
- A maximum limited angle of 15° is recommended in offshore regions, inland seas, and the southern part of the South China Sea from April to September. An angle of 25° is recommended for the central North Pacific from October to April of the following year, the Arabian Sea from June to August, and the central Bay of Bengal in June and August. At other times, it is recommended that the maximum limited angle should be 20° in other sea areas of the Northwest Pacific Ocean, the North Indian Ocean, and the South China Sea.
- A genetic algorithm was applied to obtain the optimum values for the umbilical length, airfoil, and maximum limited angle, and the results differed slightly but not significantly, probably due to the correlation between the parameters.
- We took the average velocity as the evaluation criterion instead of focusing on sway and yaw. Therefore, we use a two-dimensional model instead of a three-dimensional model.
- The total thrust of the tandem fins is calculated when the incoming flow velocity is 1 m/s and the deflection angle of the wings is 20° under four grid sizes. The Table 4 records the thrust under four grid sizes, and A3 mesh is adopted in this paper. After changing the deflection angle, the mesh is also divided according to the same density.
Table 4. The different thrust under four grid sizes.
In the simulation model used in this paper, the influence of wind, sea current, and other factors were not considered. In practice, these factors sometimes greatly affect the average speed of a Wave Glider. In addition, the wave equation used in this paper is simple. The fuzzy model (Stefanakos C N et al. [25]) could be used in the future. The parameters for the float and the glider were selected based on the existing parameters of the “Skate” Wave Glider. For future work, we could change the parameters of the float and the glider to optimize the parameters.
Author Contributions
Conceptualization, X.C.; methodology, M.H. and S.W.; validation, M.H. and K.L.; formal analysis, K.M.; investigation, X.C.; resources, S.W. and X.C.; data curation, K.L.; writing—original draft preparation, M.H.; writing—review and editing, X.C. and S.W.; visualization, K.L. and K.M. Supervision, M.H.; project administration, X.C.; funding acquisition, X.C. and M.H. All authors have read and agreed to the published version of the manuscript.
Funding
This study was supported by the Chinese National Natural Science Fund (No. 41875061; No. 41775165; 51609254) and the Chinese National Natural Science Fund (2020JJ4661) of Hunan Province.
Institutional Review Board Statement
Not applicable.
Informed Consent Statement
Not applicable.
Data Availability Statement
Data available in a publicly accessible repository: The data presented in this study are openly available in https://cds.climate.copernicus.eu/cdsapp#!/dataset/reanalysis-era5-single-levels-monthly-means?tab=form.
Conflicts of Interest
The authors declare no conflict of interest.
References
- Manley, J.; Willcox, S. The Wave Glider: A persistent platform for ocean science. In Proceedings of the OCEANS’10 IEEE SYDNEY, Sydney, NSW, Australia, 24–27 May 2010; IEEE: New York, NY, USA, 2010. [Google Scholar]
- Mullison, J.; Symonds, D.; Trenaman, N. ADCP data collected from a Liquid Robotics Wave Glider®. In Proceedings of the 2011 IEEE/OES 10th Current, Waves and Turbulence Measurements (CWTM), Monterey, CA, USA, 20–23 March 2011; pp. 266–272. [Google Scholar] [CrossRef]
- Carlon, R. Tracking tagged fish using a wave glider. In Proceedings of the OCEANS 2015—MTS/IEEE Washington, Washington, DC, USA, 19–22 October 2015. [Google Scholar] [CrossRef]
- O’Reilly, T.C.; Kieft, B.; Chaffey, M. Communications relay and autonomous tracking applications for Wave Glider. In Proceedings of the OCEANS 2015-Genova, Genova, Italy, 18–21 May 2015. [Google Scholar]
- Goebel, N.L.; Frolov, S.; Edwards, C.A. Complementary use of Wave Glider and satellite measurements: Description of spatial decorrelation scales in Chl-a fluorescence across the Pacific basin. Methods Oceanogr. 2014, 10, 90–103. [Google Scholar] [CrossRef]
- Schmidt, K.M.; Swart, S.; Reason, C.; Nicholson, S.-A. Evaluation of Satellite and Reanalysis Wind Products with In Situ Wave Glider Wind Observations in the Southern Ocean. J. Atmos. Ocean. Technol. 2017, 34, 2551–2568. [Google Scholar] [CrossRef]
- Penna, N.T.; Maqueda, M.A.M.; Martin, I.; Guo, J.; Foden, P.R. Sea Surface Height Measurement Using a GNSS Wave Glider. Geophys. Res. Lett. 2018, 45, 5609–5616. [Google Scholar] [CrossRef]
- Hine, R.; Willcox, S.; Hine, G.; Richardson, T. The Wave Glider: A Wave-Powered Autonomous Marine Vehicle; IEEE: New York, NY, USA, 2009. [Google Scholar]
- Manley, J.; Wilcox, S.; Westwood, R. The Wave Glider: An energy harvesting unmanned surface vehicle. Mar. Technol. Rep. 2009, 1, 27–31. [Google Scholar]
- Manley, J.; Willcox, S. The Wave Glider: A New Concept for Deploying Ocean Instrumentation. IEEE Instrum. Meas. Mag. 2010, 13, 8–13. [Google Scholar] [CrossRef]
- Kraus, N.; Bingham, B. Estimation of Wave Glider Dynamics for Precise Positioning; IEEE: New York, NY, USA, 2011. [Google Scholar]
- Kraus, N.; David, N. Wave Glider Dynamic Modeling, Parameter Identification and Simulation. Ph.D. Thesis, University of Hawaii at Manoa, Honolulu, HI, USA, 2012. [Google Scholar]
- Fossen, T.I. Guidance and Control of Ocean Vehicles. Ph.D. Thesis, University of Trondheim, Trondheim, Norway, 1994. [Google Scholar]
- Qi, Z.F.; Liu, W.X.; Jia, L.J.; Qin, Y.F.; Sun, X.J. Dynamic Modeling and Motion Simulation for Wave Glider. Appl. Mech. Mater. 2013, 397–400, 285–290. [Google Scholar] [CrossRef]
- Jia, L.J.; Zhang, X.M.; Qi, Z.F.; Qin, Y.F.; Sun, X.J. Hydrodynamic Analysis of Submarine of the Wave Glider. Adv. Mater. Res. 2013, 834–836, 1505–1511. [Google Scholar] [CrossRef]
- Tian, B.-Q.; Yu, J.-C.; Zhang, A.-Q. Dynamic modeling of wave driven unmanned surface vehicle in longitudinal profile based on D-H approach. J. Cent. South Univ. 2015, 22, 4578–4584. [Google Scholar] [CrossRef]
- Tian, B.Q.; Yu, J.C.; Zhang, A.Q. Lagrangian dynamic modeling of wave-driven unmanned surface vehicle in three dimensions based on the D-H approach. In Proceedings of the 2015 IEEE International Conference on Cyber Technology in Automation, Control, and Intelligent Systems (CYBER), Shenyang, China, 8–12 June 2015. [Google Scholar]
- Tian, B.Q.; Yu, J.C.; Zhang, A.Q. Dynamics analysis of wave-driven unmanned surface vehicle in longitudinal profile. In Proceedings of the OCEANS 2014-TAIPEI, Taipei, Taiwan, 7–10 April 2014; IEEE: New York, NY, USA, 2014. [Google Scholar]
- Li, X.T. Dynamic Model and Simulation Study Based on the Wave Glider; China Ship Research and Development Academy: Beijing, China, 2014. [Google Scholar]
- Lu, X. Research on the General Technology of Wave Glider; Harbin Engineering University: Harbin, China, 2015. [Google Scholar]
- Li, C. Dynamic Analysis and Performance Optimization of Wave Glider; Tiangong University: Tianjin, China, 2018. [Google Scholar]
- Jia, L.J. Study of Operation Principle of Two-Part Architecture and Dynamic Behavior of Wave Glider. Ph.D. Thesis, National Ocean Technology Center, Tianjin, China, 2014. [Google Scholar]
- Hu, K.W. Hydrodynamic analysis of Wave Glider. Adv. Mater. Res. 2015, 834–836, 1505–1511. [Google Scholar]
- Yan, R.H. Hydrodynamic Analysis of Wave Glider Submerged Body Part; Harbin Engineering University: Harbin, China, 2017. [Google Scholar]
- Stefanakos, C.N.; Schinas, O.; Eidnes, G. Application of Fuzzy Time Series Techniques in Wind and Wave Data Forecasting. In Proceedings of the ASME 2014 33rd International Conference on Ocean, Offshore and Arctic Engineering, San Francisco, CA, USA, 8–13 June 2014. [Google Scholar] [CrossRef]
Publisher’s Note: MDPI stays neutral with regard to jurisdictional claims in published maps and institutional affiliations. |
© 2021 by the authors. Licensee MDPI, Basel, Switzerland. This article is an open access article distributed under the terms and conditions of the Creative Commons Attribution (CC BY) license (https://creativecommons.org/licenses/by/4.0/).