Article

The Impact of Fortnightly Stratification Variability on the Generation of Baroclinic Tides in the Luzon Strait

1
College of Oceanic and Atmospheric Sciences, Ocean University of China, Qingdao 266100, China
2
Centre for Earth System Research and Sustainability, Institute of Oceanography, University of Hamburg, 20146 Hamburg, Germany
*
Author to whom correspondence should be addressed.
J. Mar. Sci. Eng. 2021, 9(7), 703; https://doi.org/10.3390/jmse9070703
Submission received: 30 March 2021 / Revised: 23 June 2021 / Accepted: 24 June 2021 / Published: 26 June 2021

Abstract

:
The impact of fortnightly stratification variability induced by tide–topography interaction on the generation of baroclinic tides in the Luzon Strait is numerically investigated using the MIT general circulation model. The simulation shows that advection of buoyancy by baroclinic flows results in daily oscillations and a fortnightly variability in the stratification at the main generation site of internal tides. As the stratification for the whole Luzon Strait is periodically redistributed by these flows, the energy analysis indicates that the fortnightly stratification variability can significantly affect the energy transfer between barotropic and baroclinic tides. Due to this effect on stratification variability by the baroclinic flows, the phases of baroclinic potential energy variability do not match the phase of barotropic forcing in the fortnight time scale. This phenomenon leads to the fact that the maximum baroclinic tides may not be generated during the maximum barotropic forcing. Therefore, a significant impact of stratification variability on the generation of baroclinic tides is demonstrated by our modeling study, which suggests a lead–lag relation between barotropic tidal forcing and maximum baroclinic response in the Luzon Strait within the fortnightly tidal cycle.

1. Introduction

Internal waves for which reduced gravity provides the restoring force widely occur in seas and are responsible for enhanced dissipation in the deep ocean [1]. Most of the internal wave energy is radiated from the source over a long distance, which can significantly affect the space-time distribution of energy available for global mixing [2,3,4]. The South China Sea may have most intense internal waves among all oceans. Internal solitary waves with peak-to-trough amplitudes over 150 m have been reported in the northern South China Sea, and such waves are believed to impact other ocean processes notably [5,6]. Both observation and numerical simulation studies have suggested that the Luzon Strait is the main generation site of internal waves in the northern South China Sea [7,8,9,10,11,12,13,14]. Alford et al. depicted a cradle-to-grave picture of internal waves from the Luzon Strait to the continental shelf on a basin scale through the combination of in situ data and numerical simulation [15]. In situ observations show that the regularity and strength of internal solitary waves on the shelf of the northern South China Sea has a significant spring-neap variability [12,15,16]. Moreover, internal tides in the deep basin west of the Luzon Strait also show a spring-neap variability that has been demonstrated by moored current observations [17]. In addition, numerical simulations and remote sensing data suggest that internal solitary waves on the shelf are developed by nonlinear steepening and frequency dispersion of the baroclinic tides generated in the Luzon Strait by tide–topography interactions [8,9,12,15,18]. As Ramp et al. stated, “Most of the features of the wave arrival can be explained by the tidal variability in the Luzon Strait” [16]. Therefore, the generation of baroclinic tides in the Luzon Strait, which is investigated in the present study, is important for forecasting internal wave characteristics in the South China Sea.
At least five different internal wave generation mechanisms exist including beam scattering, mixed region collapse, and lee–wave mechanism [18,19,20,21,22]. The timing and strength of the energy transfer process from barotropic to baroclinic mode thereof determine how the internal wave is generated at the beginning. In previous numerical studies concerning baroclinic tides in the Luzon Strait, the main focus has been on tides and topography and their interaction, for example, the spring-neap cycle, flood–ebb current, generation site, and resonance between two ridges [11,12,13,23,24]. Stratification is considered a minor factor in internal wave variability, for example, the seasonal variation of internal tides in the northern South China Sea is considered to be mainly modulated by the astronomical tides rather than by the seasonal thermocline in the Luzon Strait [17]. Some previous numerical simulations have shown that stratification can notably impact internal wave generation under specific conditions [25,26]. Recently, an extreme internal solitary wave with a maximum peak-to-though amplitude of 240 m was reported in the northern South China Sea [6]. The authors argue that the variability of stratification in the Luzon Strait may be a key factor for the generation of energetic internal tides and the formation of this extreme internal solitary wave event. As a result, the variability of stratification in the Luzon Strait obviously deserves more attention in baroclinic tide generation studies. In particular, stratification can be affected by many factors, such as surface heat flux and mesoscale eddy intrusion. To simplify this situation, we focus only on the tidal effect on stratification because the interaction between strong tidal flow and steep topography in the Luzon Strait can severely affect the local stratification and is thus the major source of baroclinic variability in our case. The specific questions we address are how stratification is affected by tide–topography interactions and how the baroclinic tides are affected by this stratification variability. Research on these questions will be helpful for improving the understanding of the internal wave generation process and variability in realistic situations.
In this paper, the MIT general circulation model (MITgcm) described by Marshall et al. is used for the three-dimensional hydrodynamic baroclinic simulation [27]. We focus mainly on the stratification variability and the generation of baroclinic tides in the Luzon Strait. Therefore, we decided to use the hydrostatic version of MITgcm as our main target processes can be adequately resolved by this model. The main objective is to determine how the stratification variability affects the internal wave generation in the Luzon Strait.
In Section 2, the model settings are presented. Subsequently, in Section 3, the model validation, the stratification variability, and the analysis of governing mechanisms in the Luzon Strait are presented. These sections are followed by an analysis of energy transfer and its effect on internal wave generation. Finally, the discussion and conclusions are presented in Section 4 and Section 5, respectively.

2. Materials and Methods

The model domain covers the northern South China Sea, the Luzon Strait, and part of the Western Pacific and ranges zonally from 110 E to 129 E and meridionally from 16 N to 23 N. Realistic bathymetry data are derived from the general bathymetric chart of the oceans (GEBCO_08, Figure 1). The primary research domain, i.e., the Luzon Strait, is placed at the center of the model domain. L1 is selected as a generation site, and B2 falls along the propagation path [16]. The grid resolution in the horizontal direction is set to 1/30th degree × 1/30th degree, which is fine enough to describe baroclinic tidal signals for our model domain. A total of 115 uneven vertical layers are set, ranging from 10 m in the upper ocean and gradually increasing to 200 m in the deep ocean.
The model is driven by barotropic tidal currents composed of the first eight tidal constituents ( M 2 , S 2 , K 2 , N 2 , K 1 , O 1 , P 1 , Q 1 ) at four open lateral boundaries. Harmonic constants of forcing are derived from the OSU TOPEX/Poseidon Global Inverse Solution (TPXO7.2). A sponge layer is specified along the open boundaries to avoid artificial reflection (Figure 1). A relaxation term that relaxes variables toward the boundary values by applying a linearly increasing relaxation time scale is added to the momentum equation. The relaxation time scale is set to one M 2 cycle at the interior termination of the sponge layer and to one thousandth of one M 2 cycle at boundaries as the M 2 signal is most significant in our case.
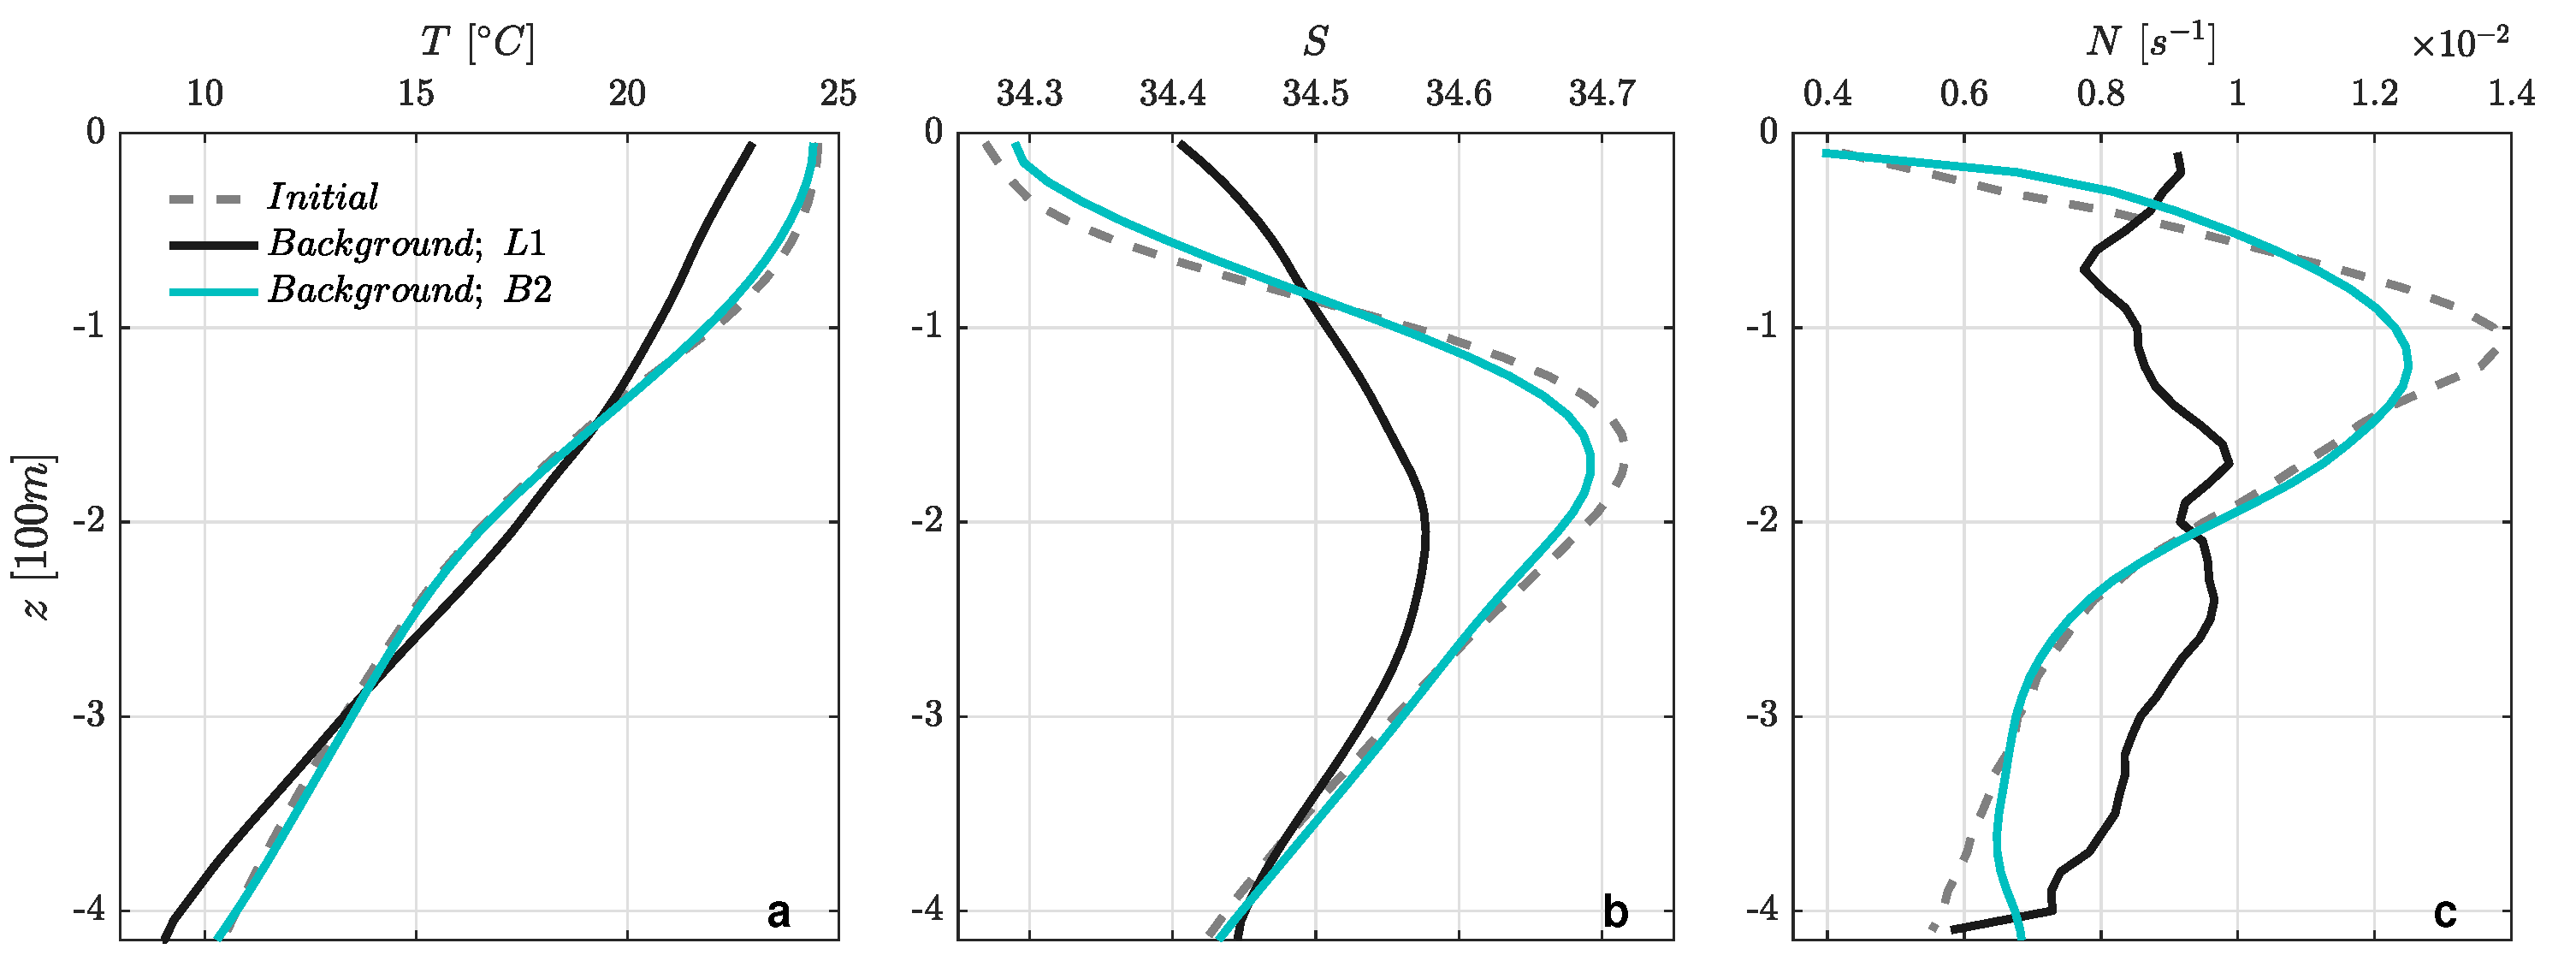
Initial temperature and salinity are derived from the World Ocean Atlas 2009 and are horizontally homogeneous and vertically stratified (Figure 2a,b). According to the buoyancy frequency N (Figure 2c), the initial pycnocline is at a depth of approximately 100 m, showing a stable ocean stratification structure. A no-slip condition is used for lateral boundaries and at the bottom. The quadratic bottom drag coefficient is 0.002. The vertical diffusivity and viscosity are calculated by the KPP vertical mixing parameterizations proposed by Large et al., which can simulate oceanic processes like convective penetration and diurnal cycling based on physical principles [28]. The model run lasts for 50 model days with 1-min time steps and hourly output.

3. Results

3.1. Model Validation

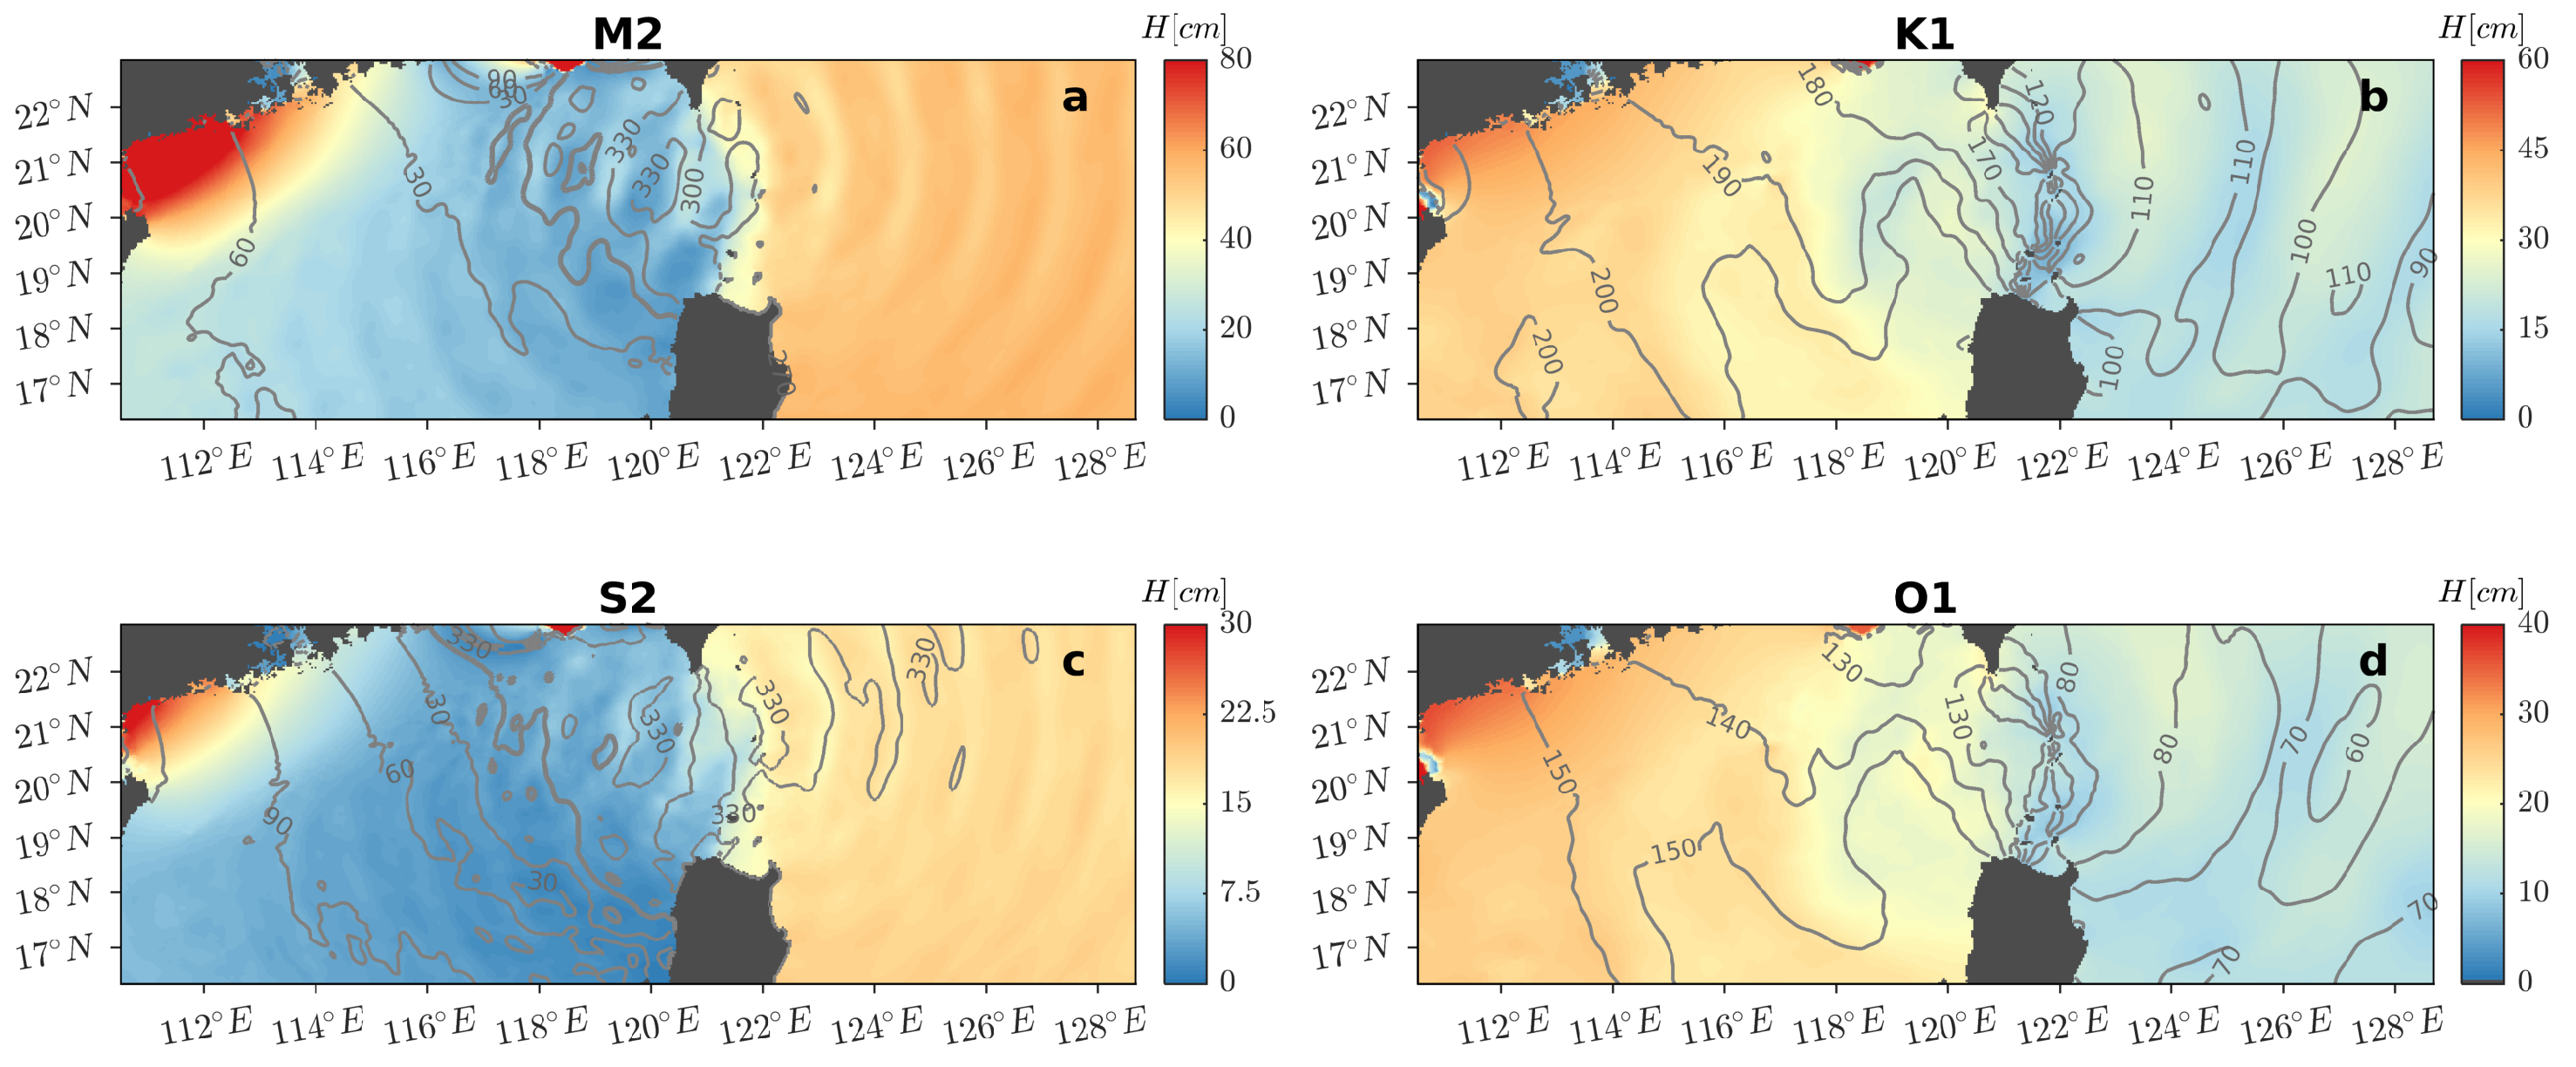
Considering that we only use barotropic tidal forcing to drive the model, the model run is primarily validated using TPXO7.2 data. Figure 3 gives the co-tidal charts for the first four tidal constituents derived through harmonic analysis over the final 30 days of the model results. The co-tidal chart of M 2 (Figure 3a) is in good agreement with previous tidal current measurements [29]. Our model also reproduced the degenerated counterclockwise amphidromic system of K 1 and O 1 near the northern tip of Luzon Island, which was mentioned in previous simulations [23,30,31]. Notably, wave-like stripes exist in the model-predicted amplitude and phase. These features are the manifestation of spatially coherent internal tide modulations with associated wavelengths [32].
The root mean square difference D between the model and TPXO7.2 data for sea-level height and zonal barotropic velocity is used here [33]. The barotropic velocities U = 1 H u ¯ and V = 1 H v ¯ are defined as depth-averaged velocities, where ( · ) ¯ = d η ( · ) d z is the depth integration of a quantity from the bottom d to surface η and the total water depth H = η + d .
D = 1 2 ( A o 2 + A m 2 ) A o A m cos ( ϕ o ϕ m )
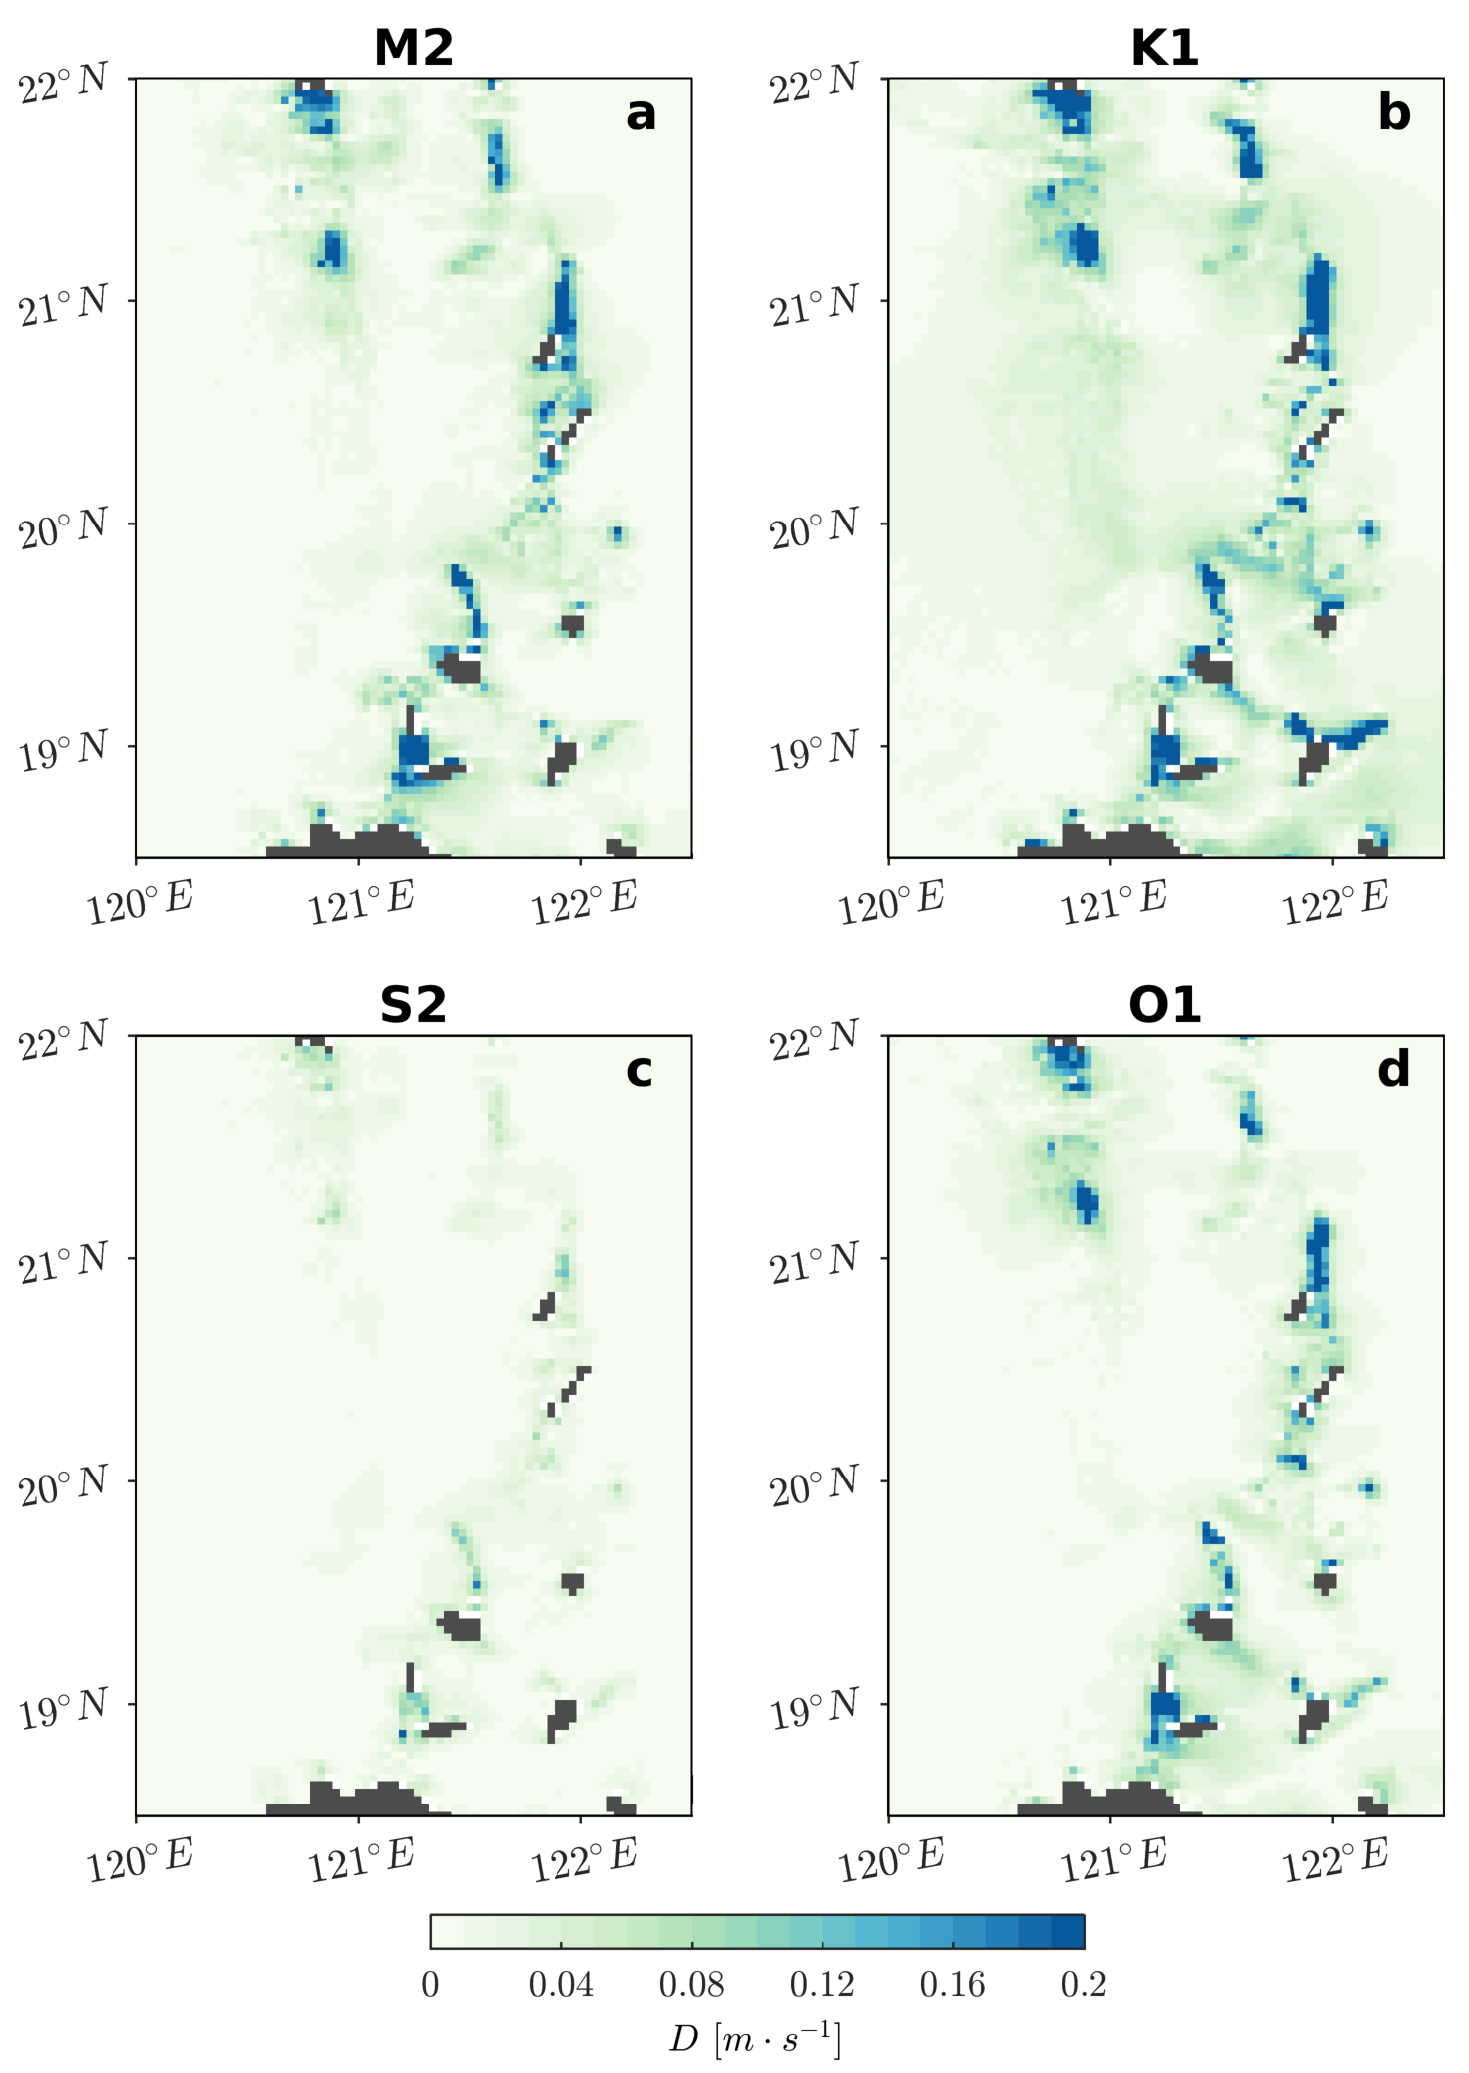
where A and ϕ are the amplitudes and phases of a given constituent, respectively, and subscripts o and m refer to the TPXO7.2 data and our model, respectively. The domain-averaged D of sea-level height in areas deeper than 200 m is 3.03, 5.46, 1.34, and 2.78 cm for M 2 , K 1 , O 1 , and S 2 , respectively. The distributions of D of the zonal barotropic velocity in the Luzon Strait for the first four tidal constituents (Figure 4) show small values in most regions, which indicates a good agreement between the model results and the TPXO7.2. Relatively larger D values appear mainly above ridges, where water is shallow. Our model is fully baroclinic and has a slightly different topography compared to the TPXO7.2 model, which has a stronger effect in shallow areas. Data assimilation is not included in our case but may also result in differences.
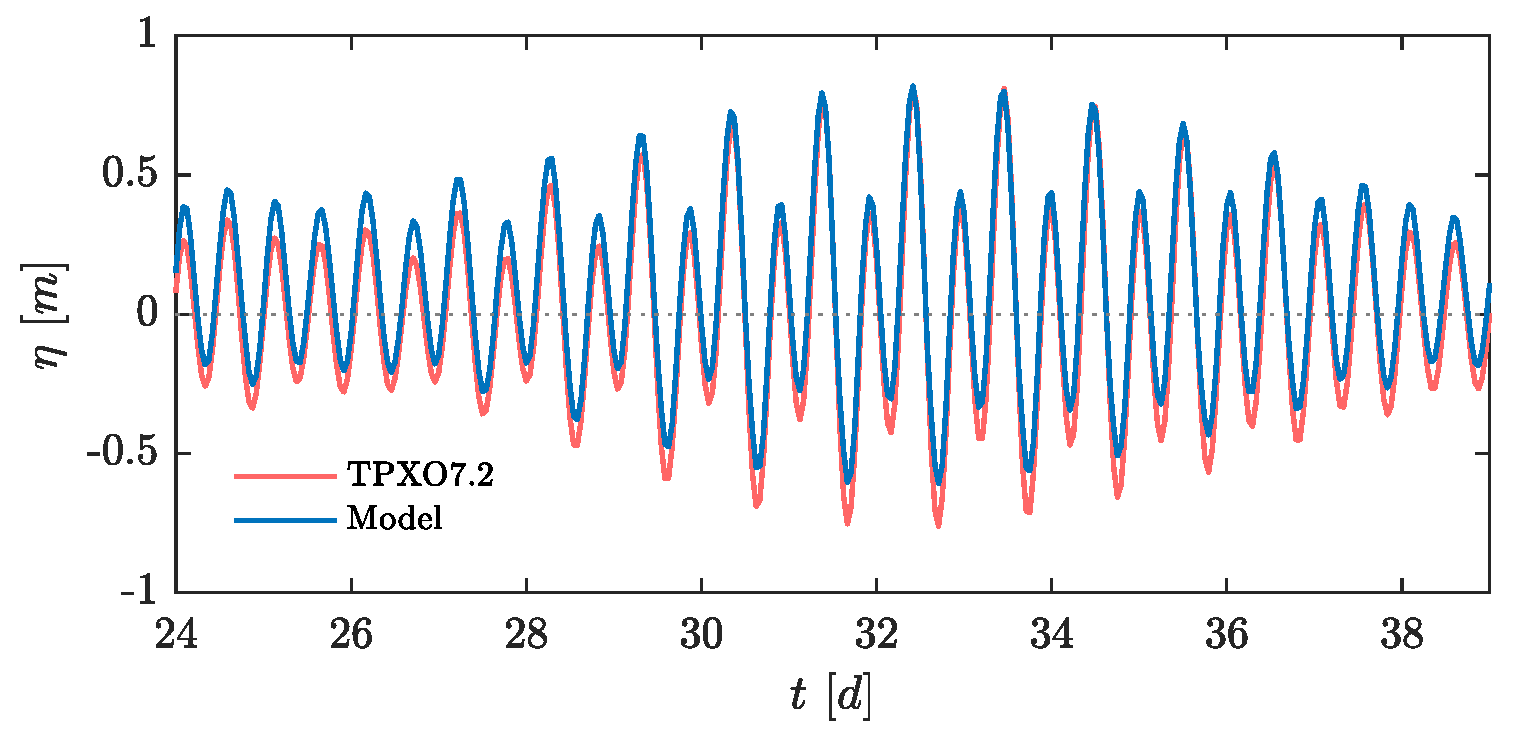
Figure 5 shows the comparison of time series of sea-level height η at L1 between our model prediction and TPXO7.2. L1 is located on the side of a seamount in the Luzon Strait and is hypothesized to be a generation source for internal waves [16]. These two time series are in good agreement, and both show well-recognized spring-neap characteristics. The heights of high tides and low tides are different, but the phases match very well. Therefore, our model is suitable for the simulation of tidal characteristics.

3.2. Stratification Variability

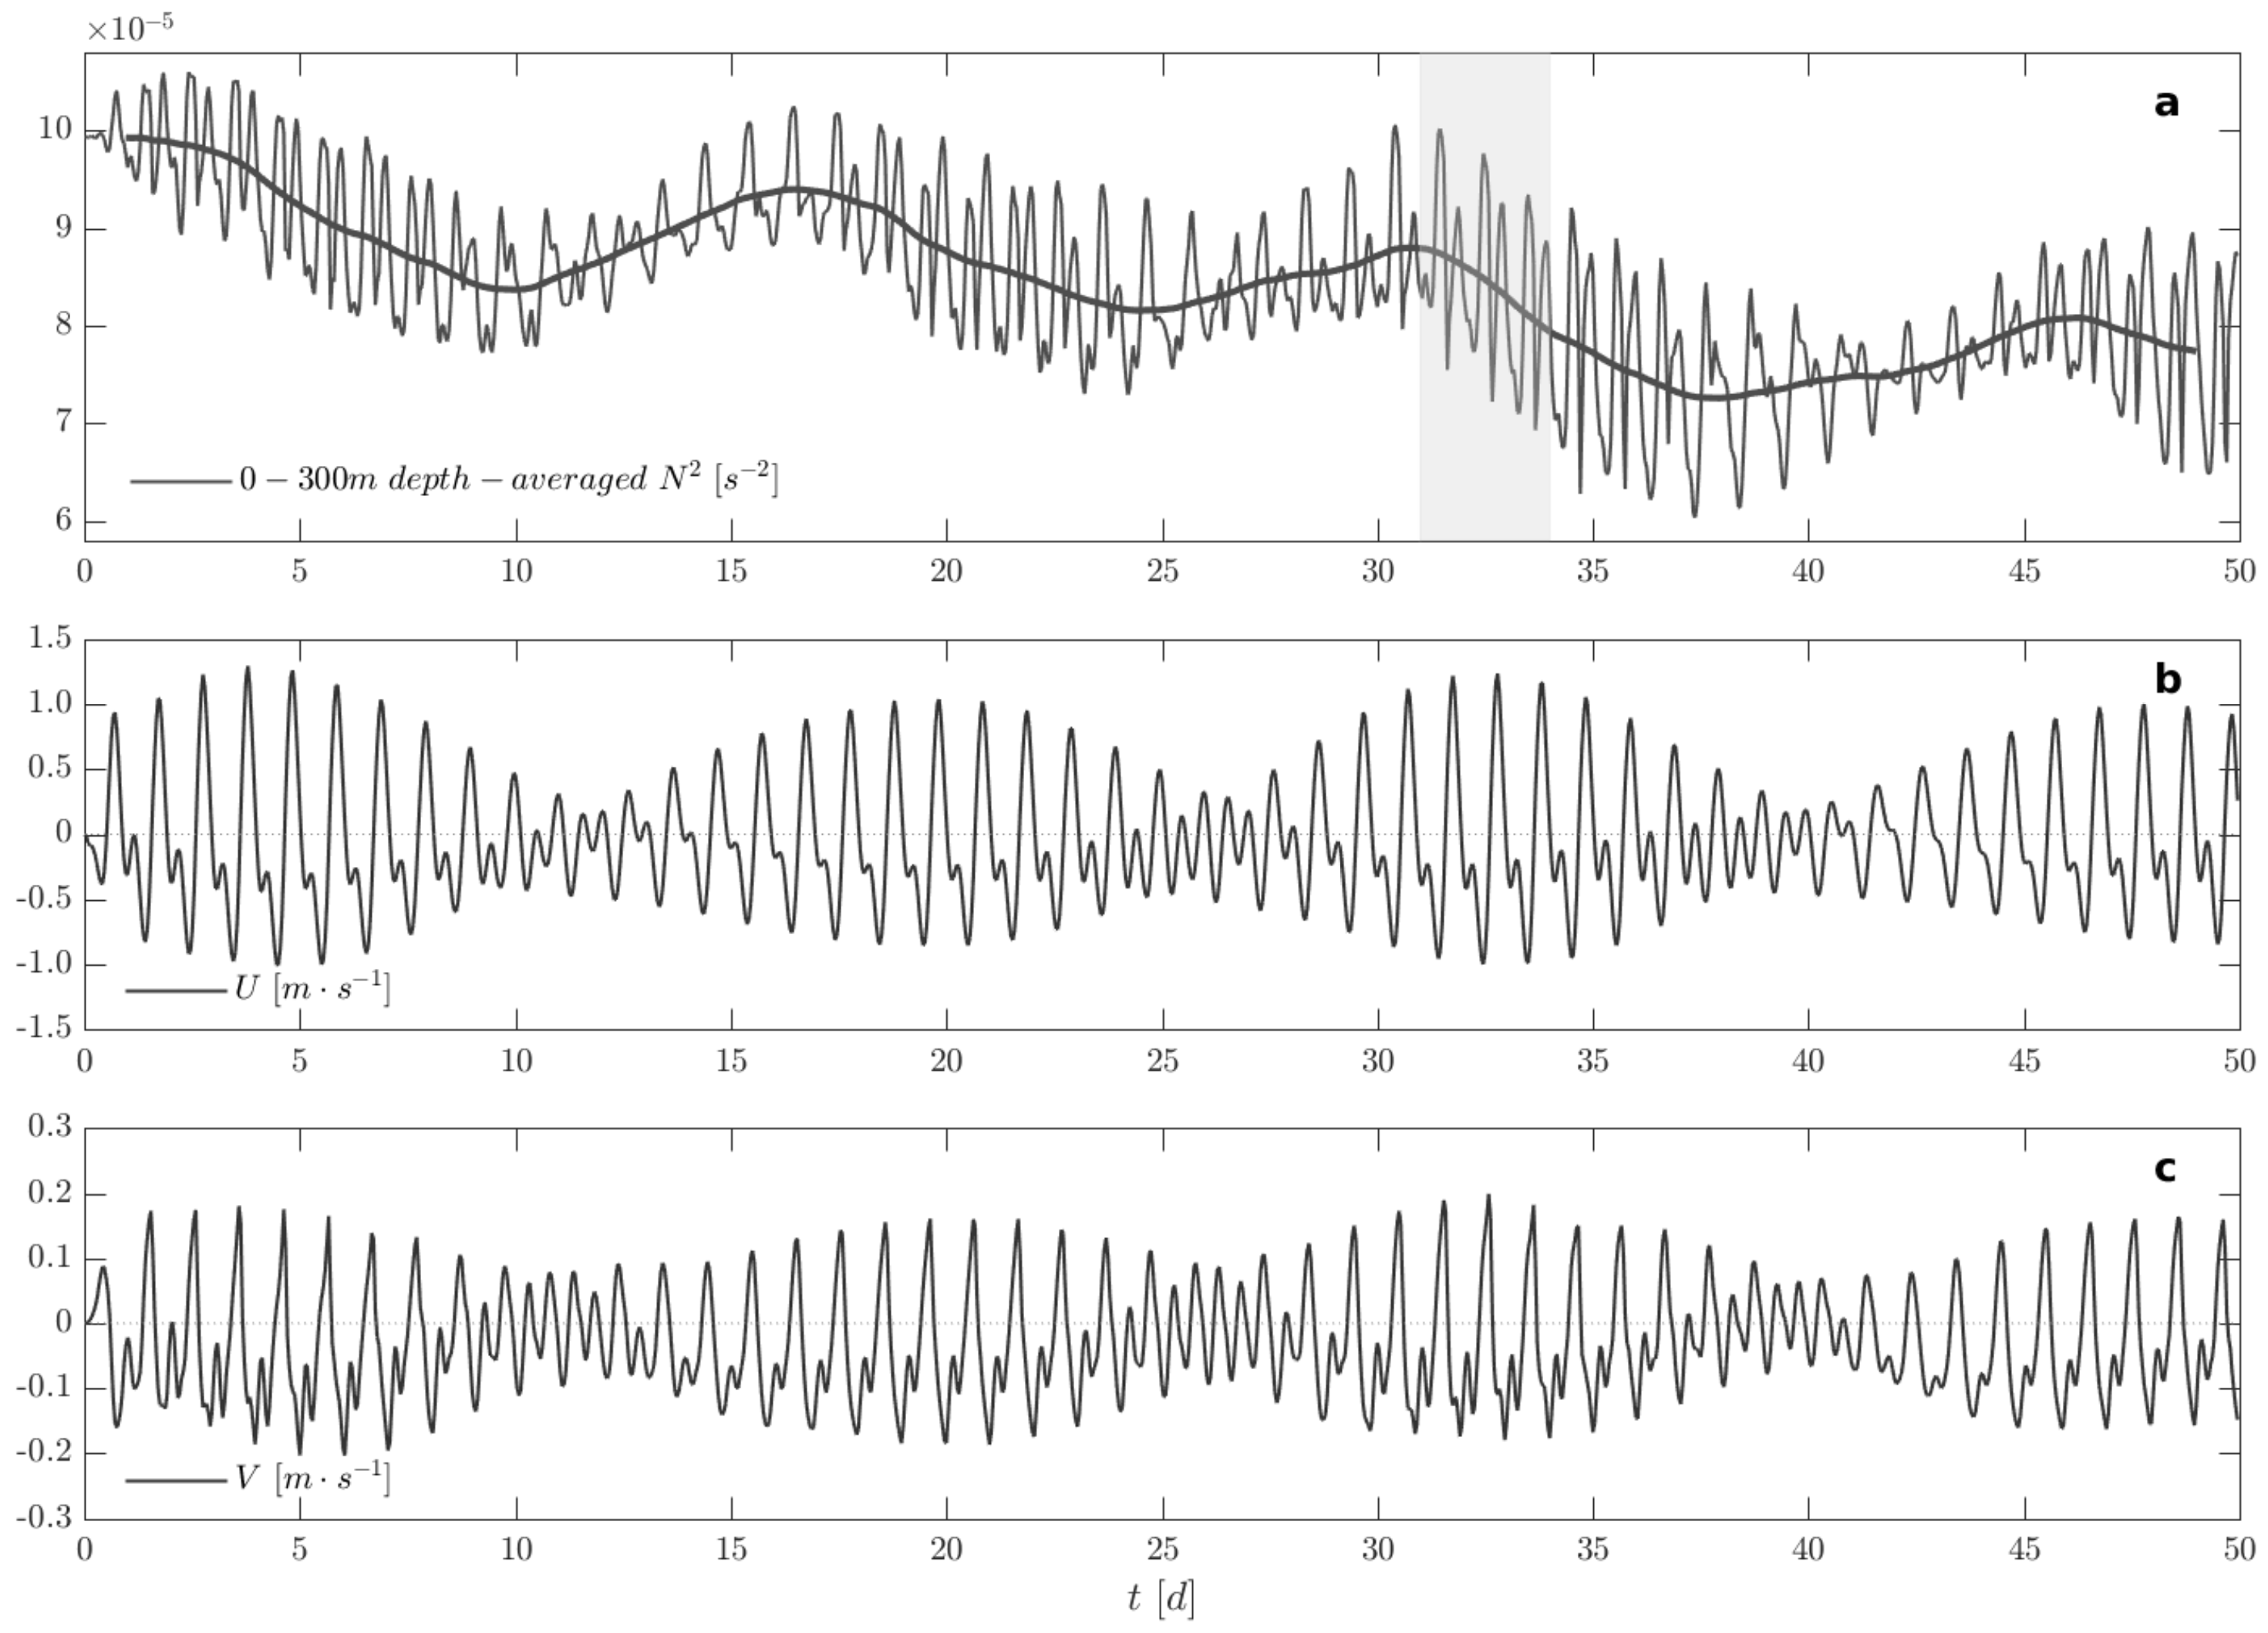
The variability of stratification in our investigation is an important part of baroclinic responses. Therefore, we investigate this feature in more detail. The depth and strength of the pycnocline are two parameters used to evaluate stratification, whereas buoyancy frequency N provides a more concise measure of ocean stratification. Given that barotropic tidal current in the Luzon Strait has a significant spring-neap tidal cycle, we calculate a time average over the spring-neap tidal cycle (model days 24 to 38) to determine the background field. For example, the background buoyancy frequency N b = N , where · = 1 T t t + T ( · ) d τ , is the time average of a quantity over the time interval T, T is 15 days covering a spring-neap cycle in this case. Apparently, the model results show different background stratification at different locations (Figure 2). At L1, which is located on the eastern side of the ridge and has a sharp topography, the N b shows no prominent peaks, which means the water column here has experienced significant vertical mixing and diffusion since initialization. At B2, which is located in the sea basin with more than 3000 m depth, N b is similar to the initial state, which means that stratification here is only slightly changed and that the vertical structure of the water column can be well maintained. For a more integrated picture, we analyze the time series of the depth-averaged N 2 between the surface and a depth of 300 m instead of the profiles below (Figure 6a).
According to the time series of the depth-averaged N 2 , the stratification at L1 exhibits daily oscillations. After applying two times a moving average with a window size of 24 h, the time-smoothed result of stratification is marked by a bold line indicating the approximate fortnightly variability (Figure 6a). This variability shows a buoyancy increase and decrease cycle at L1 in the model, although no buoyancy input takes place during the model run, leading to the question as to which process is responsible for the enhancement of stratification. The low-pass decline of the depth-averaged N 2 is due to numerical diffusion and mixing. Finally, the stratification will almost disappear according to our model setting of no surface buoyancy forcing. The boundary tidal current signal plays an important role on the stratification variability, as it quickly traverses the model domain and dominates its variability. To investigate the reason for these results, we reviewed the local barotropic current field first (Figure 6b,c). The time series of zonal and meridional barotropic velocities suggest that the local barotropic flows are asymmetric, which means that these flows have different strengths in opposite directions, and the stratification shows a similar spring-neap cycle as the barotropic velocity, which means there is an impact from barotropic forcing on stratification. The asymmetry in the barotropic tidal flows is defined by the discrepancies in the duration of the eastward (northward) and westward (southward) tidal currents [18]. The interactions and phase difference between tidal constituents are the major source behind the barotropic tidal asymmetry [34,35]. Besides, there are some barotropic mean flows on the order of 0.1 m/s near the west ridge (not shown), which are considered to be caused by topographic rectification [36,37,38], also contribute to the asymmetric barotropic flows.
In the following, we introduce the potential energy anomaly φ = g H ( ρ ^ ρ ) z ¯ [39,40] to explain what happens during stratification changes, where g is the gravity acceleration and ρ ^ is the depth-averaged density. φ is a depth-integrated value that represents changes in potential energy relative to the vertically homogeneous conditions. For a given density profile, φ is the amount of work per unit volume required to completely homogenize the water column [40]. Thus, we define Δ φ = φ φ 0 as the potential energy anomaly change, where φ 0 is calculated from the initial field.
The interaction between barotropic flows and ridges causes vertical movements (Figure 7a) and thus can uplift or depress the isopycnals. Through this physical process, φ can decrease or increase (Figure 7b). Considering the generation of internal waves here and the accompanying intense baroclinic currents, the baroclinic component is expected to dominate the vertical velocity. These baroclinic flows are associated with the asymmetric barotropic forcing and exhibit a fortnightly cycle. Thus it is evident that the accumulated enhancing of stratification is unequal to the weakening (Figure 7b), and finally overwhelms the φ , thereby contributing to the fortnightly stratification variability (Figure 6a).
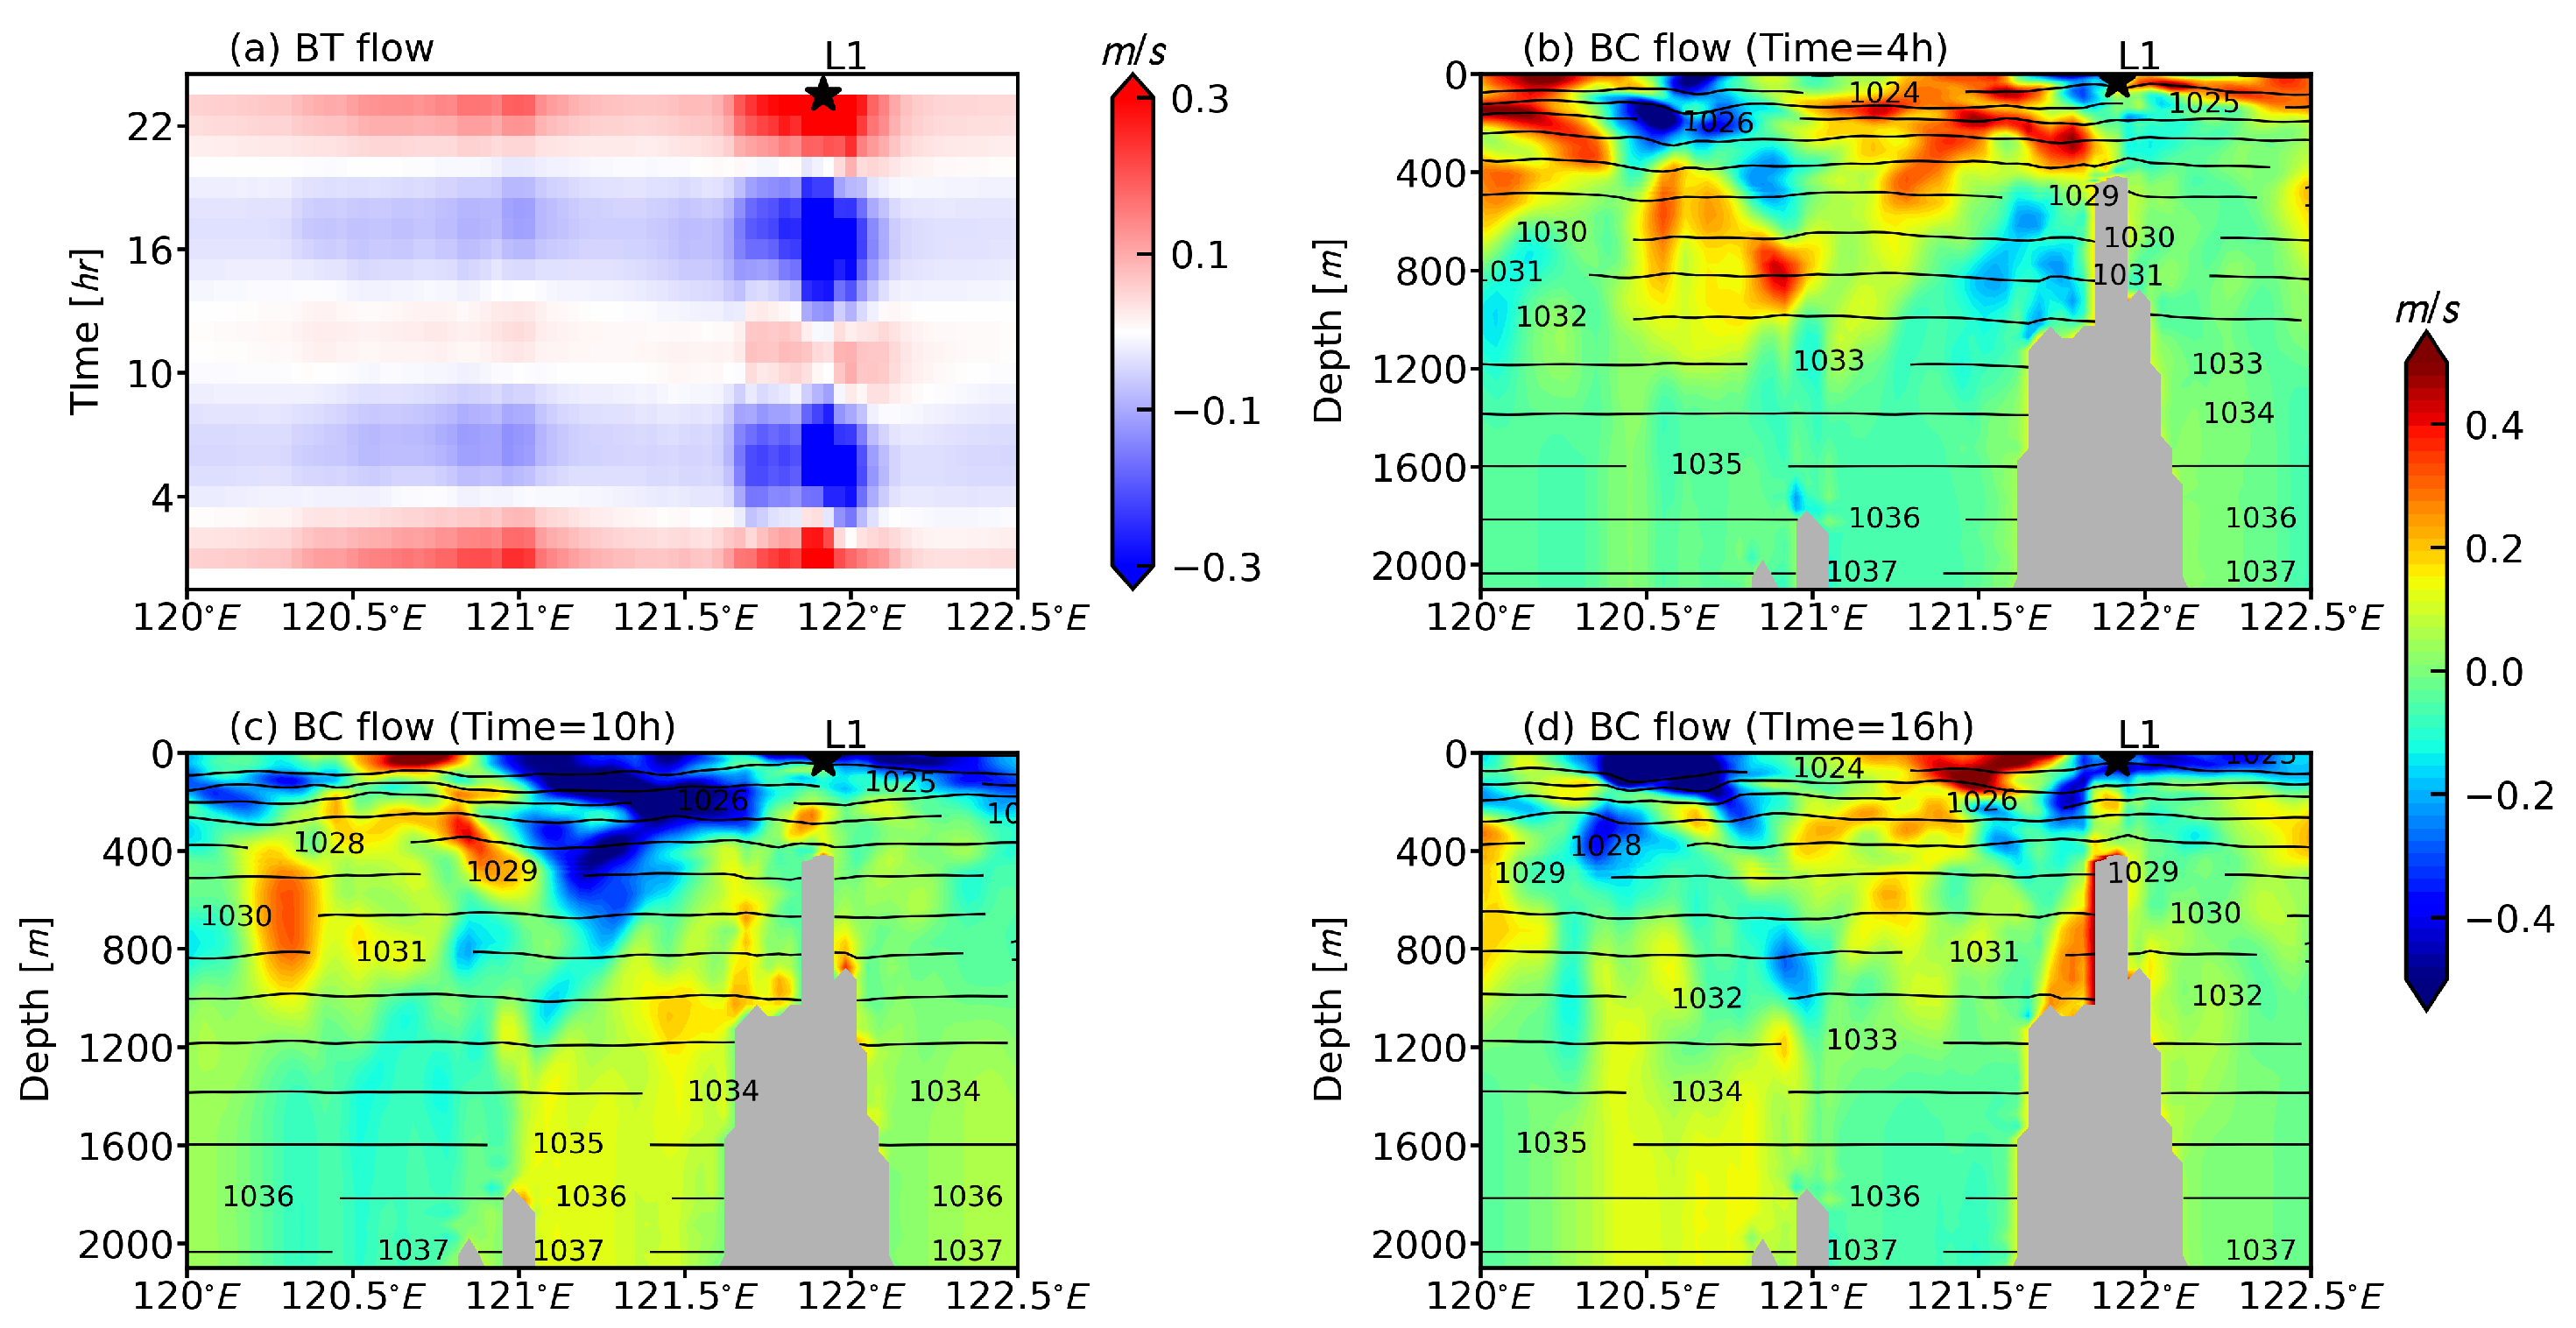
Figure 8 shows the position of the isopycnals in relation to the baroclinic flow in the zonal L1-section during a tidal cycle. The interaction between barotropic forcing and topography in the stratified ocean can produce intense baroclinic currents. The simulated baroclinic currents show a structure of wave beams and their speed can reach to about 0.5 m/s, which are in agreement with the in situ observations [38]. Therefore, it can be concluded that our model performance is acceptable. According to our simulation, the horizontal baroclinic currents change directions with the tidal phase. The isopycnals also vary during a tidal cycle. In addition, the horizontal baroclinic velocity at L1 beats at a fortnightly cycle (not shown), which implies the impact of horizontal bariclinic currents on fortnightly stratification variability.
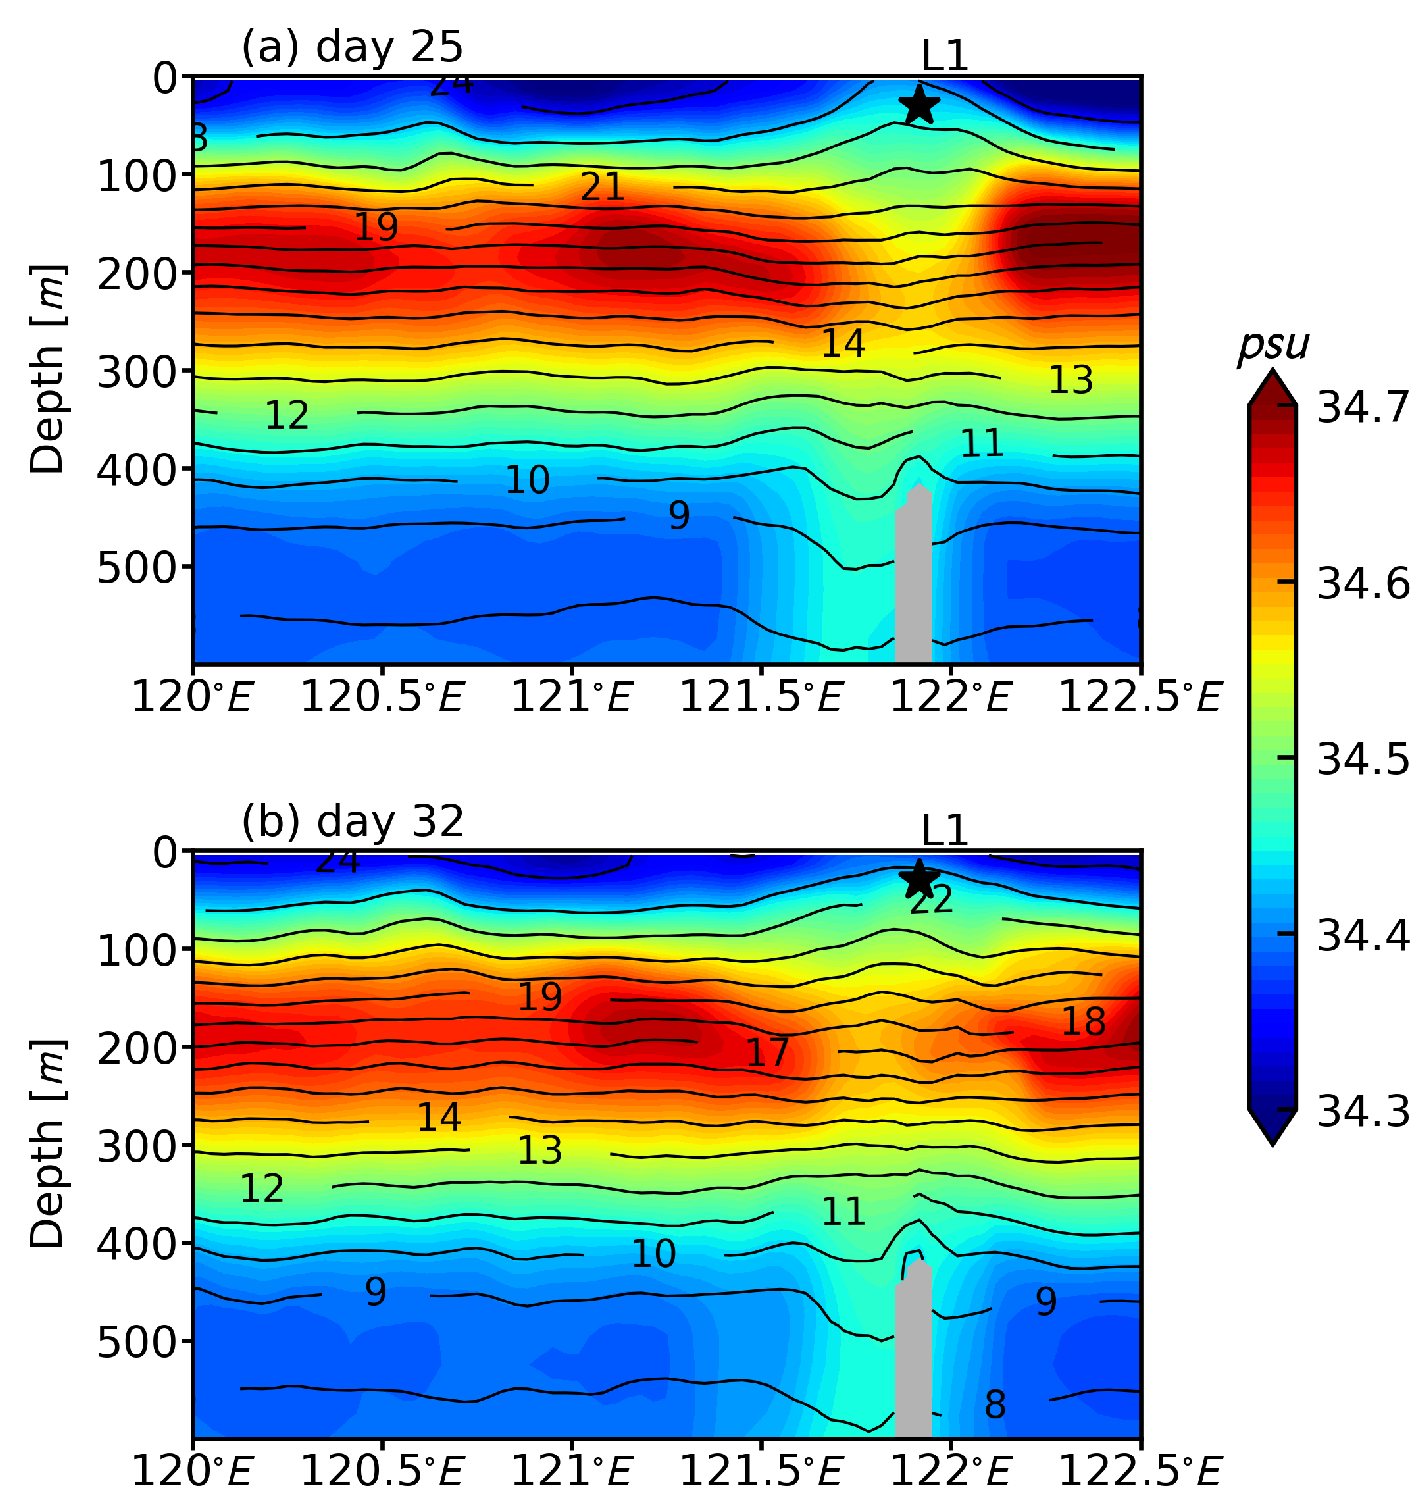
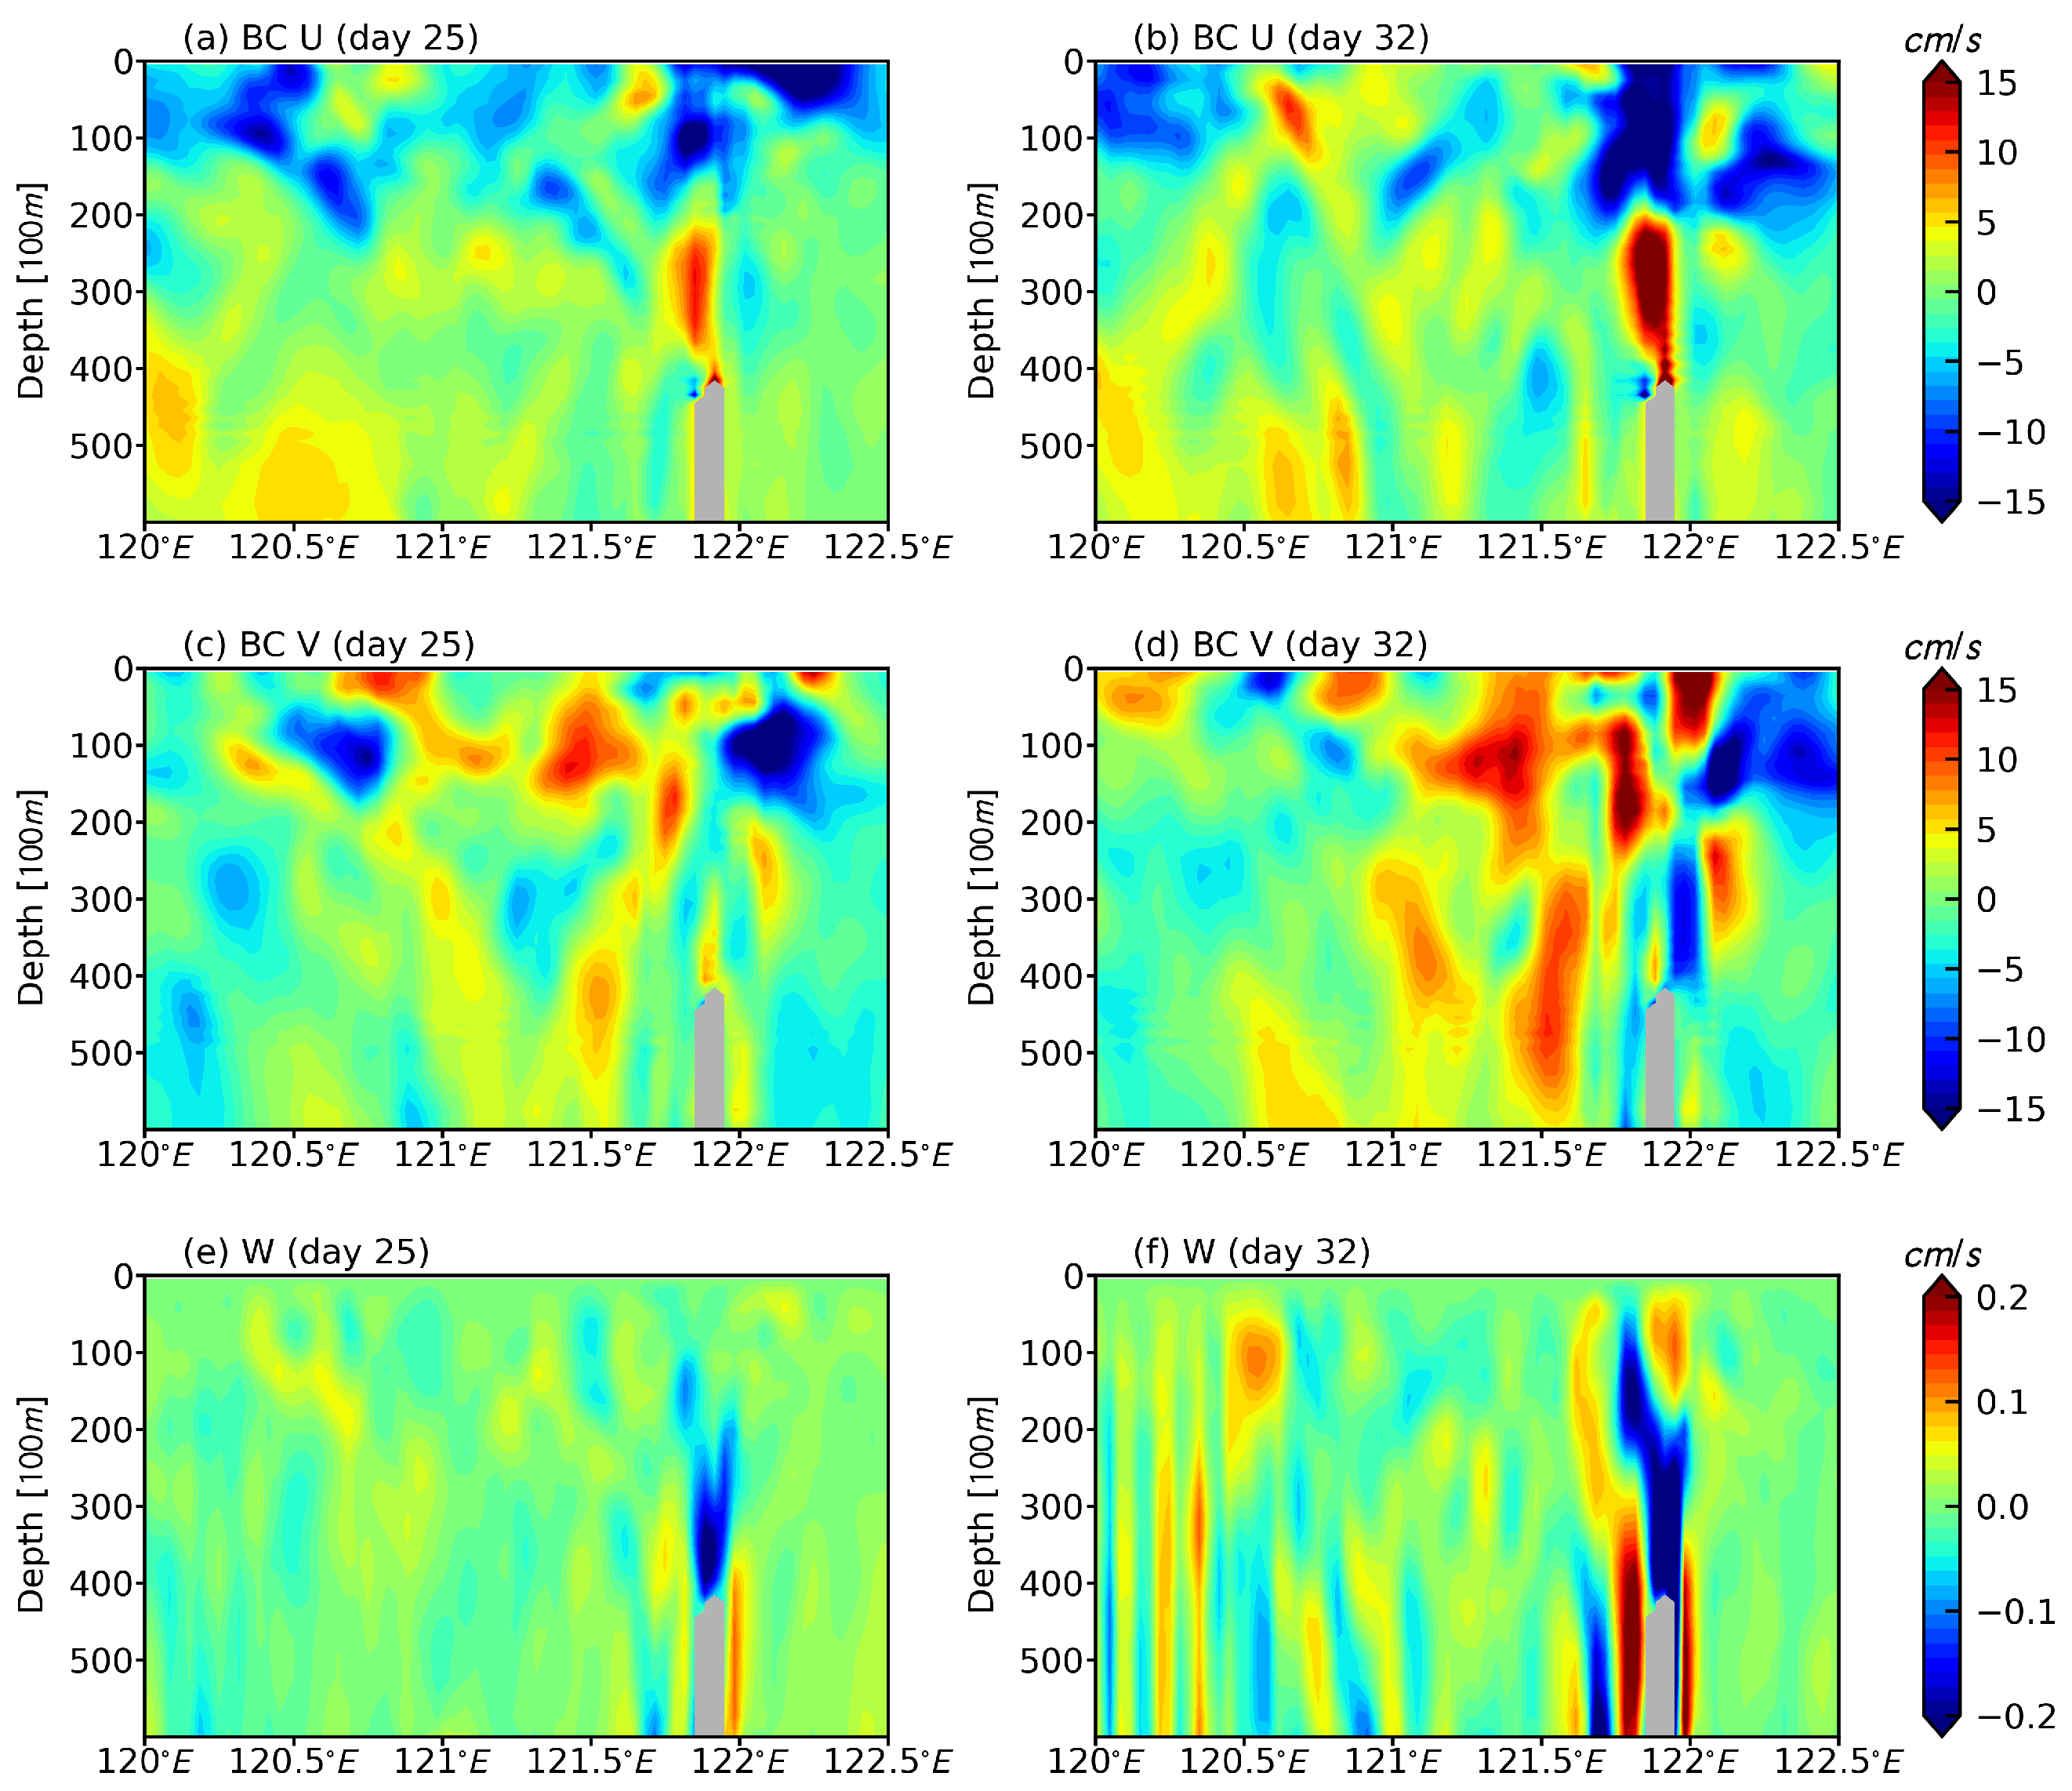
Figure 9 shows daily averages of temperature and salinity when the time-smoothed depth-averaged N 2 is ascending or descending. Daily averages of the baroclinic U-velocity and V-velocity as well as the full W-velocity are shown in Figure 10. As can be seen, the magnitude of these mean currents and their temporal variability are in a reasonable range, indicating that the model is able to reasonably reproduce the underlying processes. The baroclinic velocity fields are associated with the asymmetric barotropic forcing in our simulation, and thus these rectified baroclinic flows also exhibit a fortnightly variability. As shown in Figure 9, the halocline at L1 is depressed at day 25 and it is uplifted at day 32 above the ridge. Considering the vertical rectified flow exists in this area (Figure 10), the vertical movement of the halocline demonstrates that the vertical advection of buoyancy by the rectified flow near the ridge contributes to the fortnightly stratification variability. Due to the effect of internal wave generation, the stratification at L1 is relatively weak compared to its surroundings. Considering the horizontal difference of stratification and the existence of the horizontal mean baroclinic flow in this area (Figure 10), the horizontal advection by the baroclinic flow also contributes to the fortnightly stratification variability.
These dynamics can explain how the stratification process varies at L1. Subject to our model configuration, the energy that enhances the stratification must originally come from boundary forcing. Given that there are two ridges in the Luzon Strait, when the stratification at L1 is enhanced, the stratification at other places within the Luzon Strait should be weakened. Figure 11a,b shows Δ φ and the corresponding time-smoothed result at L1 and L2, respectively, where L1 is on the east side of the ridge and L2 is on the west side of the ridge. The time-smoothed result at L2 shows an almost inverse phase compared to that at L1, which proves our speculation. In order to determine the spatial distribution, we calculated three daily averages Δ φ that are separated by 6 days, d 1 , d 2 and d 3 (Figure 11a).
Figure 11c,d shows the differences in Δ φ between different intervals. For different intervals, these differences are almost in anti-phase, suggesting that the stratification in the Luzon Strait is always being redistributed within a spring-neap cycle. Regarding stratification, this result means that the baroclinic field in the Luzon Strait can be disturbed and redistributed by the interaction between asymmetric barotropic forcing and topography. Due to this redistribution, the energy transfer and the internal wave generation, which strongly depend on stratification, will be affected.

3.3. Energy Transfer

In order to analyze energy transfer and internal wave generation, we introduce the depth-integrated barotropic and baroclinic energy equations [24,41,42].
t ( E k 0 ¯ + E p 0 ¯ ) + · F 0 ¯ = C ¯ ϵ 0 ¯
t ( E k ¯ + E p ¯ ) + · F ¯ = C ¯ ϵ ¯
where subscript 0 and superscript indicate barotropic and baroclinic, respectively. E k ¯ is the kinetic energy, E p ¯ is the available potential energy, F ¯ is the energy flux, C ¯ is the barotropic to baroclinic energy conversion rate that connects the two equations, and ϵ ¯ is the dissipation term including the conversion and radiation processes and bottom drag. As this paper mainly focuses on the baroclinic responses of barotropic forcing, we diagnose only the relative kinetic and potential energy terms and the conversion rate between the two.
C ¯ = p b W
E k 0 ¯ = 1 2 ρ 0 ( U 2 + V 2 ) H
E p 0 ¯ = 1 2 ρ 0 g η 2
E k ¯ = 1 2 ρ 0 d η ( u 2 + v 2 + w 2 ) d z
E p ¯ = g 2 2 ρ 0 d η ρ 2 N b 2 d z
where p b is the perturbation pressure at the bottom; W = U · H is the vertical velocity at the bottom due to barotropic flow over variable topography; ρ 0 is the reference density; u = u U and v = v V are the zonal and meridional baroclinic velocity, respectively; w is the vertical velocity; and ρ = ρ ρ b is the perturbation density due to wave motions, where ρ b is the background density during the selected spring-neap cycle.
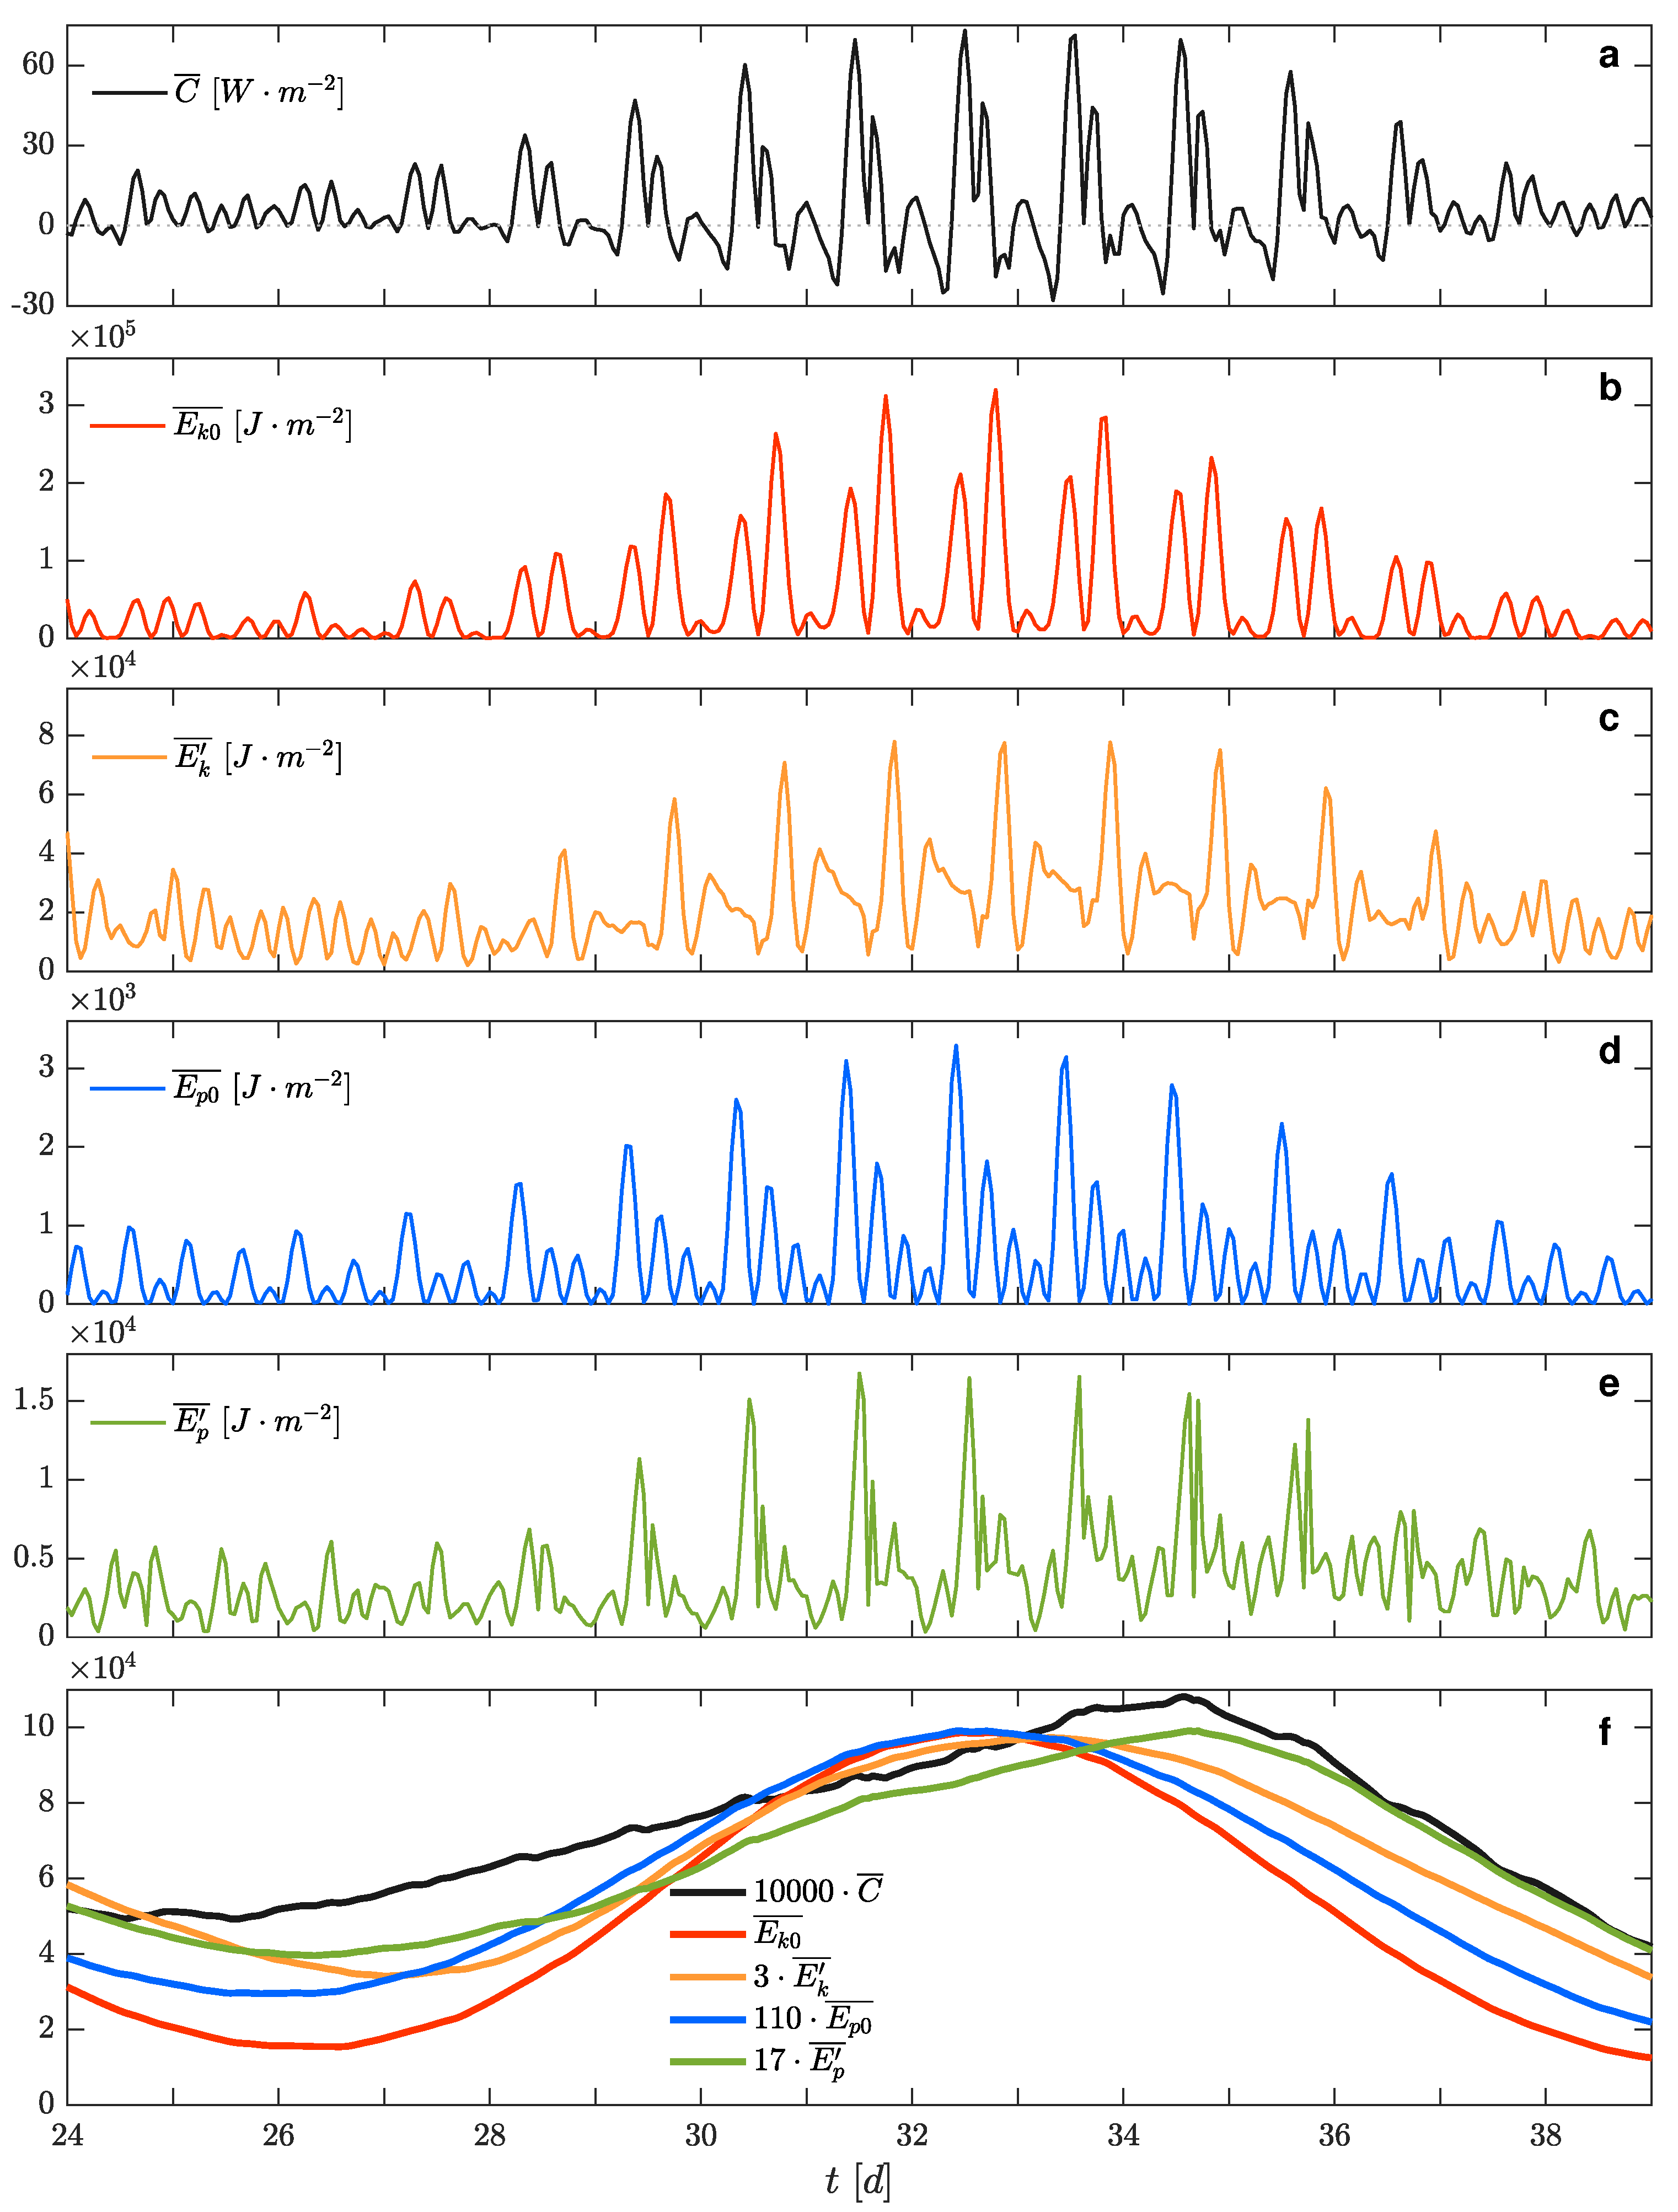
Overall, C ¯ represents the conversion rate from barotropic to baroclinic mode. Generally, C ¯ should be the sink term for Equation (2) and the source term for Equation (3), which also means that baroclinic terms gain energy from barotropic terms, on average. However, C ¯ can be a sink for baroclinic components, for example, C ¯ becomes negative when W and p b are out of phase [24,43]. In our case, C ¯ is positive most of the time (Figure 12a), which represents energy transfer from barotropic tide to baroclinic tide. Negative C ¯ can reach nearly half of the maximum positive value during spring tide, which suggests a strong local dissipation of the baroclinic tide for this period.
For kinetic energy, the barotropic part E k 0 ¯ and the baroclinic part E k ¯ mainly change according to barotropic and baroclinic velocity, respectively. E p 0 ¯ mainly changes with sea-level height and represents the potential energy due to surface waves. Equation (8) is an exact expression for the baroclinic potential energy if the fluid is linearly stratified [44]. In our case, N b at L1 is slowly varying and almost constant, which suggests that this expression is suitable for evaluating the local available potential energy. E p ¯ directly measures the strength of isopycnal perturbations.
Figure 12b–e shows the changes for those energy components. The time series of E k 0 ¯ and E p 0 ¯ both show a significant spring-neap cycle and peaks in one day, which matches with the local barotropic tidal signal. The baroclinic energy components exhibit different features. E k ¯ reaches the highest peak when the local barotropic current is directed eastward. However, this behavior changes slowly and does not show a second narrow peak when the local barotropic current is directed westward. Especially for E p ¯ , it shows a weaker correlation to the boundary forcing, and thus more nonlinear characteristics comparing to barotropic energy components.
Figure 12f shows the time-smoothed results of each of the above components with the same color. In order to analyze the interaction between the components, we applied a suitable amplification factor. The largest lag difference among energy components is between E p ¯ and the other components. Except for E p ¯ , the other three energy components show the same fortnightly variability that matches well with the local barotropic forcing. The lag of E p ¯ indicates that the maximum baroclinic disturbance is not generated during the maximum barotropic forcing. At L1, the lag is approximately two days, which indicates that the maximum baroclinic disturbance occurs two days after the maximum spring tide. As we analyzed before, the baroclinic potential energy and barotropic components exhibit different features. The baroclinic potential energy depends on the perturbation density, which depends on local stratification and dynamic field. The stratification shows a fortnightly variability resulting from the advection of buoyancy by rectified baroclinic flows. In general, the fortnightly stratification variability, i.e., the phase of baroclinic potential energy and the phase of barotropic forcing do not match at most locations. Thus, our result shows a lag or lead relation between the maximum baroclinic potential energy and the maximum barotropic forcing on fortnight time scale. Additionally, the time-smoothed result of C ¯ shows a comparable lag, which suggests that the maximum barotropic to baroclinic energy conversion is affected by this fortnightly stratification variability.
Here, we introduce a harmonic fit f ( t ) = A cos ( ω t + P ) + M of the time-smoothed results, where ω is the selected spring-neap cycle frequency corresponding to 14.78 days, t is the time, A is the amplitude, P is the phase, M is the time average of a spring-neap cycle, and f is the harmonic fitted result. In order to evaluate the goodness of this fit, the coefficient of determination R = 1 i = 1 n ( y i f i ) 2 ( y i y a v ) 2 is calculated here, where f i is the predicted value from the fit, y i represents the observed data, and y a v is the mean of observed data. R is generally a value between 0 and 1, and a value closer to 1 indicates a better fit.
Figure 13 shows the harmonic fit results of E k 0 ¯ and C ¯ for model days 24 to 38. The average R of E k 0 ¯ and C ¯ in the Luzon Strait is 0.9664 and 0.9097, respectively, which suggests that most of the spring-neap variation of barotropic and baroclinic tides in the Luzon Strait can be explain by this fit. Strong E k 0 ¯ is mainly distributed in channels between islands and seamounts (Figure 10c), and is accompanied by intense spring-neap variation (Figure 13a). The main generation sites and dissipation sites of baroclinic tides, suggested by time-averaged M (Figure 13f), are mainly distributed along the two ridges [7,23,31] and are accompanied by intense spring-neap variation as well (Figure 13d). P suggests the arrival time of spring tide. The arrival time of the maximum E k 0 ¯ (Figure 13b) and C ¯ (Figure 13e) during the selected period can be calculated from the phase. For E k 0 ¯ , the arrival time shows differences along the isobath in general. For C ¯ , only the sites where R is greater than 0.9 and where the average C ¯ is greater than 2 W · m 2 are presented because we mainly focus on the generation process, the arrival time is also quite similar in the main generation sites.
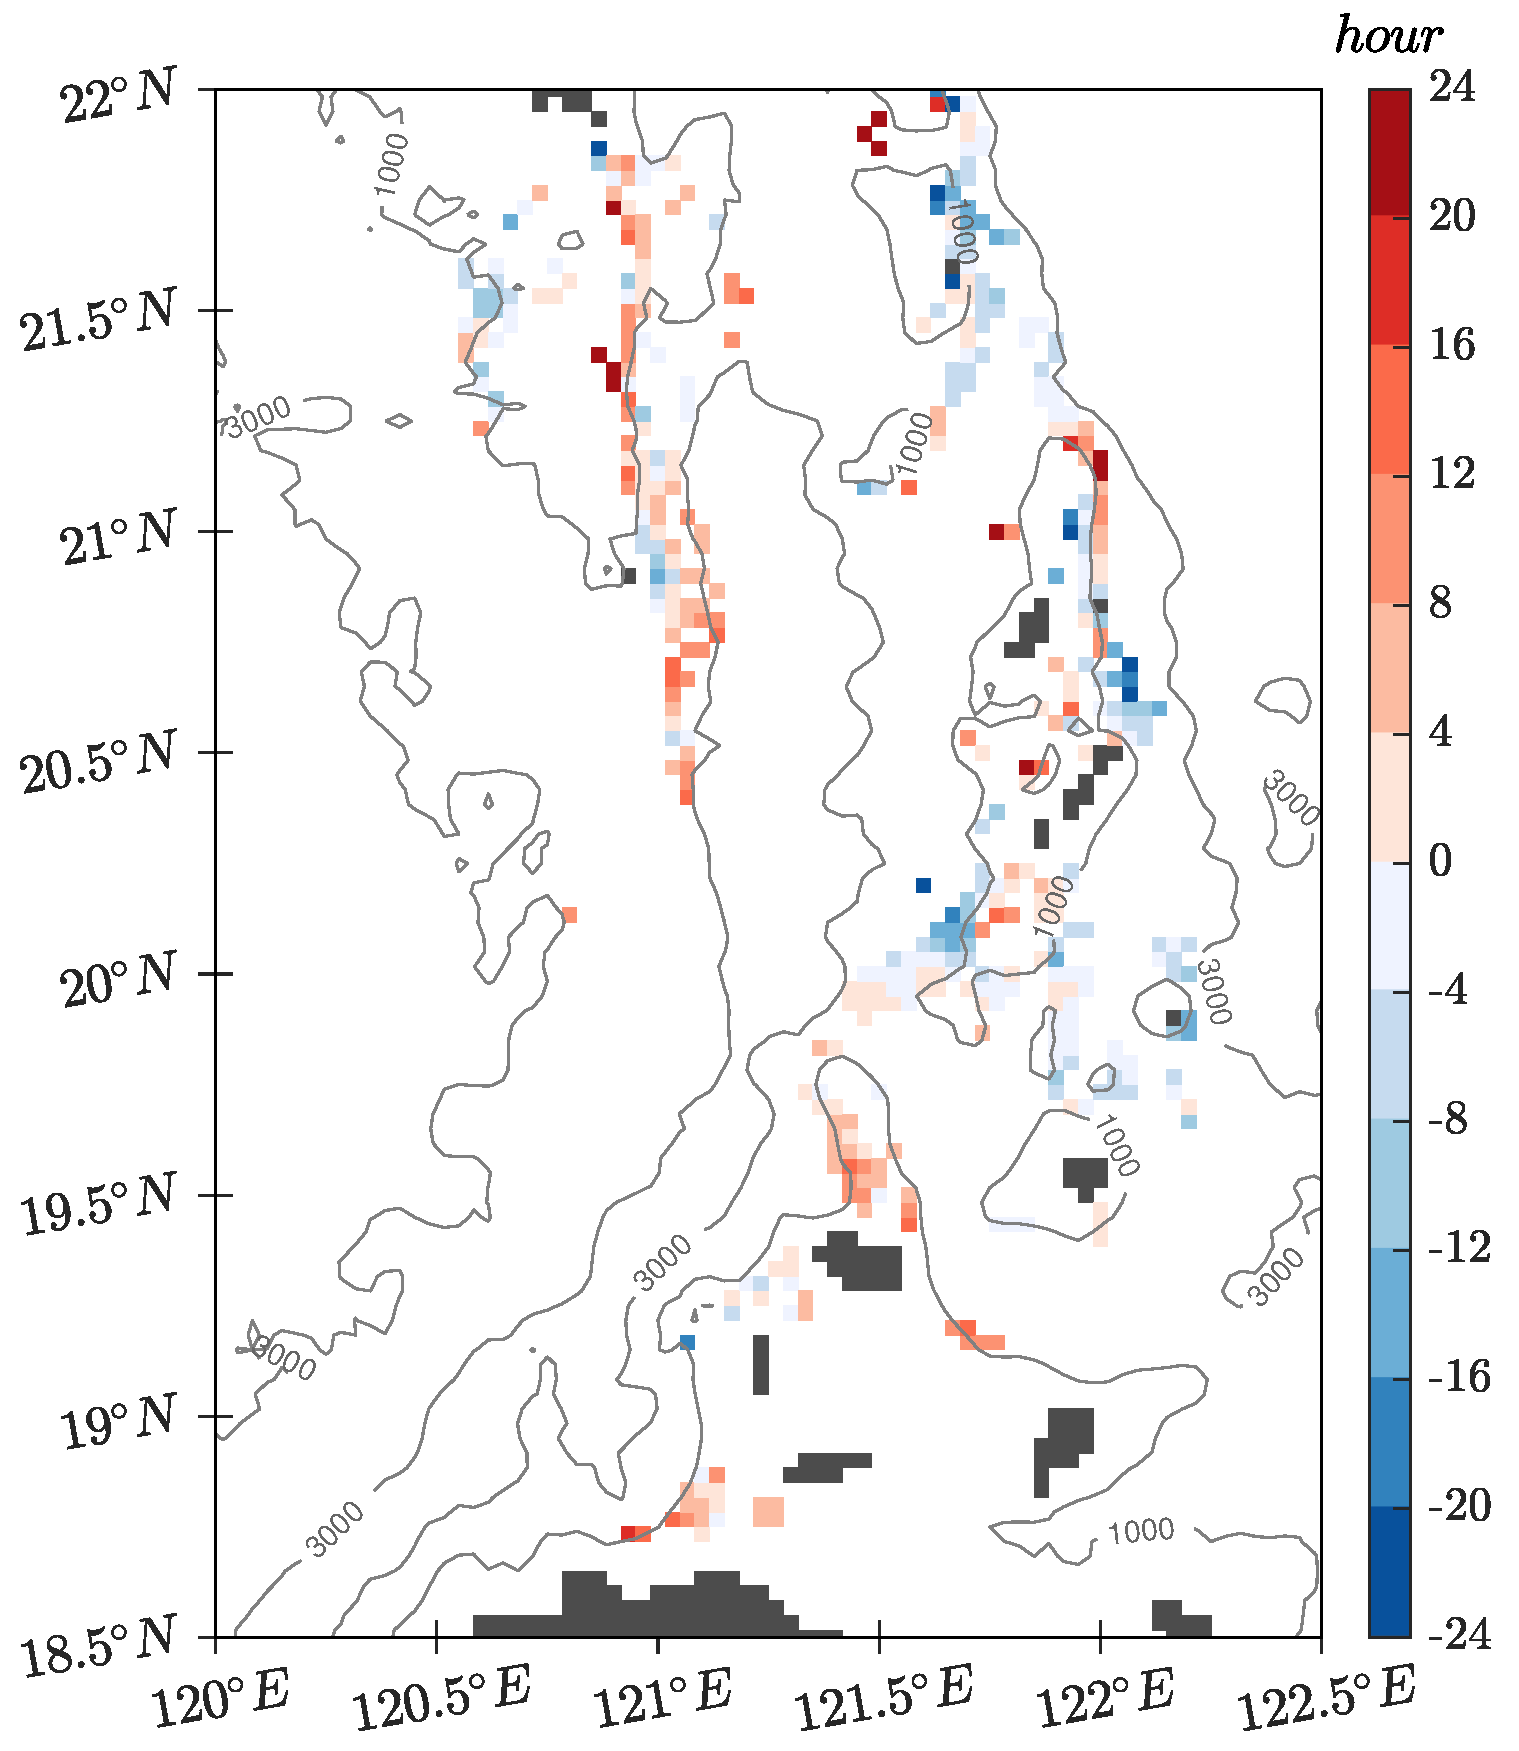
Figure 14 shows the estimated lag between C ¯ and E k 0 ¯ calculated from the phase difference. Only the generation sites are presented as well as Figure 13e. Obviously, on the fortnightly time scale, the C ¯ is not phase-locked to E k 0 ¯ on potential generation sites of the Luzon Strait. Similar to L1, which we analyzed above, there are many other sites where C ¯ lags behind E k 0 ¯ . Meanwhile, during this spring-neap period, E k 0 ¯ may also lag behind C ¯ in some locations. The coexistence of both positive and negative lags is an expected result as well as we can see the stratification in the Luzon Strait is fortnightly redistributed (Figure 11). The difference in the arrival time between the maximum barotropic tidal forcing and the maximum barotropic to baroclinic conversion rate are not only a local relation at L1 but are also a more general pattern, which suggests a lead-lag relation between barotropic tidal forcing and maximum barolinic response within the fortnightly tidal cycle.

4. Discussion

Internal waves in the South China Sea begin as sinusoidal disturbances in the Luzon Strait [15]. Zhao and Alford presented a simple prediction model that can estimate the arrival times of internal solitary waves in the northeastern South China Sea based on a phase-locked relationship within the tidal cycle between internal solitary waves on the South China Sea shelf and westward tidal currents in the Luzon Strait [9]. However, the amplitude of the internal solitary waves, which depends on the strength of tidal forcing, background flow, and stratification near the generation region, is unpredictable in the prediction model in the above work. There is a clear correlation between the magnitude of semidiurnal tidal current in the Luzon Strait and the corresponding height of the leading solitary wave in the basin of South China Sea [12], which suggests the importance of fortnightly variability in the prediction of internal waves. The intensity of the initial disturbances that can be represented by the baroclinic potential energy at the generation source depends on the local stratification and flow. The local stratification and flow can be modified by Kuroshio and mesoscale eddies in the Luzon Strait, thereby affecting the internal wave generation and evolution [18,45,46,47]. Except for these two factors, our model results demonstrate that the stratification can also be altered by rectified baroclinic flows, thereby resulting in a lead–lag phenomenon within the fortnightly cycle.
There are some factors that may alter the stratification in our simulation. The two-ridge system in the Luzon Strait enhances the interaction between baroclinic tides from different sites, which may also affect the stratification variation in our model. This effect is considered to be responsible for the high local dissipation [11,24], which should weaken the stratification. Thermal wind balance driven flows caused by the horizontally non-homogeneous stratification may enhance mixing and ultimately weaken the stratification. Mean barotropic flows caused by tidal rectification can also suppress or uplift the stratification and thus modulate the stratification redistribution [36,37]. The strong mean barotropic flows exist only near the ridges, while the redistribution of stratification occurs over the whole Luzon Strait, therefore these mean barotropic flows play a secondary role for modulating the stratification over this research domain.
Although our model grid is too coarse to discuss the details of internal solitary wave generation and our diffusion and viscosity scheme cannot resolve wave-breaking, the energy calculation is still credible as background dissipation is included to parameterize this effect. Meanwhile, the interaction between the asymmetric tidal current and the topography generally exists in the Luzon Strait, and can uplift and suppress the isotherms [18]. Thus, the fortnightly variability of stratification revealed by our model results certainly affects the prediction of internal wave amplitude. Our model results suggest that due to this lead-lag relation, the maximum internal solitary wave under certain conditions may not be triggered by the maximum barotropic forcing.

5. Conclusions

We analyzed the baroclinic responses to barotropic forcing by investigating two aspects, namely, stratification variability and energy transfer, using the MITgcm model [27]. We first validated the model results and thus proved the reliability of our simulation. The stratification variability was investigated by analyzing profiles of temperature and salinity, as well as time series of buoyancy frequency and potential energy anomaly [40]. The energy transfer was investigated based on the depth-integrated barotropic and baroclinic energy equations [24,41,42], specifically by diagnosing the relative kinetic and potential energy terms and the conversion rate in the equations.
We found that the stratification in the Luzon Strait exhibits daily variation caused by daily variations of baroclinic tidal flows and fortnightly variability mainly caused by rectified baroclinic flows. The interaction between asymmetric barotropic forcing and topography generates intense baroclinic flows and thus offers an approach to increasing the stratification without buoyancy inputs like precipitation, fresh water from rivers, and surface heat fluxes. This interaction can also decrease the stratification, thus resulting in the fortnightly variability of stratification. In a scenario without surface buoyancy fluxes, we demonstrated that the stratification in the Luzon Strait can be periodically redistributed by the interaction between periodic asymmetric barotropic forcing and topography. Each barotropic and baroclinic energy component reflects a spring-neap cycle overlaid on the daily variation. The phases of the fortnightly cycle of baroclinic potential energy and conversion rate at L1, which is one location of internal wave generation in the Luzon Strait, do not match the phase of the barotropic energy component, which indicates that the internal wave generation is affected by this fortnightly stratification variability and that the maximum disturbance of these internal waves may not be generated during the maximum barotropic forcing. Extended to the whole Luzon Strait, this lead–lag relation between barotropic tidal forcing and maximum baroclinic response within the fortnightly tidal cycle generally exists in the source of internal waves. In summary, we infer that the fortnightly variability of stratification in the Luzon Strait due to rectified baroclinic flows can significantly affect energy transfer and internal wave generation.
The exact length of the lead–lag relation that determines the accuracy of internal wave amplitude prediction might be affected by the mixing parameterization in our model and by other processes such as mesoscale eddy intrusion, Kuroshio intrusion, and strong upper-layer mixing induced by winds in the real ocean. In order to improve the ability to predict internal waves, each of the effects of the above factors needs further investigation.

Author Contributions

Conceptualization, Z.Z., X.C., and T.P.; methodology, Z.Z.; software, Z.Z.; validation, Z.Z., X.C., and T.P.; formal analysis, Z.Z.; investigation, Z.Z.; resources, X.C and T.P.; data curation, Z.Z.; writing—original draft preparation, Z.Z.; writing—review and editing, Z.Z., X.C., and T.P.; visualization, Z.Z.; supervision, X.C. and T.P.; project administration, X.C.; funding acquisition, X.C. and T.P. All authors have read and agreed to the published version of the manuscript.

Funding

This research was supported by National Natural Science Foundation of China (no. U1706218), and the German BMBF CLISTORM under grant no. 03F0781A.

Data Availability Statement

The model results presented in this study are available on request from the corresponding author.

Acknowledgments

We acknowledge the National Supercomputing Center of Jinan for providing the computing resources. The bathymetric data were obtained from the general bathymetric chart of the oceans 2008 http://www.gebco.net (last access: 26 June 2021). The barotropic forcing data were obtained from the OSU TOPEX/Poseidon Global Inverse Solution 7.2 http://g.hyyb.org/archive/Tide/TPXO/TPXO_WEB/global.html (last access: 26 June 2021). The initial field data were obtained from World Ocean Atlas 2009 https://www.nodc.noaa.gov/OC5/WOA09/pr_woa09.html (last access: 26 June 2021). Two anonymous reviewers provided numerous helpful suggestions for improving the manuscript.

Conflicts of Interest

The authors declare no conflict of interest.

References

  1. Egbert, G.D.; Ray, R.D. Significant dissipation of tidal energy in the deep ocean inferred from satellite altimeter data. Nature 2000, 405, 775–778. [Google Scholar] [CrossRef]
  2. Laurent, L.S.; Garrett, C. The role of internal tides in mixing the deep ocean. J. Phys. Oceanogr. 2002, 32, 2882–2899. [Google Scholar] [CrossRef] [Green Version]
  3. Alford, M.H. Redistribution of energy available for ocean mixing by long-range propagation of internal waves. Nature 2003, 423, 159–162. [Google Scholar] [CrossRef]
  4. Buijsman, M.C.; Stephenson, G.; Ansong, J.; Arbic, B.; Green, J.; Richman, J.; Shriver, J.; Vic, C.; Wallcraft, A.; Zhao, Z. On the interplay between horizontal resolution and wave drag and their effect on tidal baroclinic mode waves in realistic global ocean simulations. Ocean Model. 2020, 152, 101656. [Google Scholar] [CrossRef]
  5. Klymak, J.M.; Pinkel, R.; Liu, C.-T.; Liu, A.K.; David, L. Prototypical solitons in the south china sea. Geophys. Res. Lett. 2006, 33, l11607. [Google Scholar] [CrossRef] [Green Version]
  6. Huang, X.; Chen, Z.; Zhao, W.; Zhang, Z.; Zhou, C.; Yang, Q.; Tian, J. An extreme internal solitary wave event observed in the northern south china sea. Sci. Rep. 2016, 6, 30041. [Google Scholar] [CrossRef] [Green Version]
  7. Niwa, Y.; Hibiya, T. Three-dimensional numerical simulation of m2 internal tides in the east china sea. J. Geophys. Res. Ocean 2004, 109, c04027. [Google Scholar] [CrossRef]
  8. Zhao, Z.; Klemas, V.; Zheng, Q.; Yan, X.-H. Remote sensing evidence for baroclinic tide origin of internal solitary waves in the northeastern south china sea. Geophys. Res. Lett. 2004, 31, l06302. [Google Scholar] [CrossRef] [Green Version]
  9. Zhao, Z.; Alford, M.H. Source and propagation of internal solitary waves in the northeastern south china sea. J. Geophys. Res. Ocean 2006, 111, c11012. [Google Scholar] [CrossRef]
  10. Jan, S.; Chern, C.-S.; Wang, J.; Chao, S.-Y. Generation of diurnal k1 internal tide in the luzon strait and its influence on surface tide in the south china sea. J. Geophys. Res. Ocean 2007, 112, c06019. [Google Scholar] [CrossRef]
  11. Alford, M.H.; MacKinnon, J.A.; Nash, J.D.; Simmons, H.; Pickering, A.; Klymak, J.M.; Pinkel, R.; Sun, O.; Rainville, L.; Musgrave, R.; et al. Energy flux and dissipation in luzon strait: Two tales of two ridges. J. Phys. Oceanogr. 2011, 41, 2211–2222. [Google Scholar] [CrossRef]
  12. Li, Q.; Farmer, D.M. The generation and evolution of nonlinear internal waves in the deep basin of the south china sea. J. Phys. Oceanogr. 2011, 41, 1345–1363. [Google Scholar] [CrossRef]
  13. Zhang, Z.; Fringer, O.B.; Ramp, S.R. Three-dimensional, nonhydrostatic numerical simulation of nonlinear internal wave generation and propagation in the south china sea. J. Geophys. Res. Ocean 2011, 116, c05022. [Google Scholar] [CrossRef]
  14. Guo, C.; Vlasenko, V.; Alpers, W.; Stashchuk, N.; Chen, X. Evidence of short internal waves trailing strong internal solitary waves in the northern south china sea from synthetic aperture radar observations. Remote. Environ. 2012, 124, 542–550. [Google Scholar] [CrossRef]
  15. Alford, M.H.; Peacock, T.; MacKinnon, J.A.; Nash, J.D.; Buijsman, M.C.; Centuroni, L.R.; Chao, S.-Y.; Chang, M.-H.; Farmer, D.M.; Fringer, O.B.; et al. The formation and fate of internal waves in the south china sea. Nature 2015, 521, 65–69. [Google Scholar] [CrossRef]
  16. Ramp, S.R.; Yang, Y.J.; Bahr, F.L. Characterizing the nonlinear internal wave climate in the northeastern south china sea. Nonlinear Processes Geophys. 2010, 17, 481–498. [Google Scholar] [CrossRef] [Green Version]
  17. Xu, Z.; Yin, B.; Hou, Y.; Liu, A.K. Seasonal variability and north–south asymmetry of internal tides in the deep basin west of the luzon strait. J. Mar. Syst. 2014, 134, 101–112. [Google Scholar] [CrossRef]
  18. Buijsman, M.C.; Kanarska, Y.; McWilliams, J.C. On the generation and evolution of nonlinear internal waves in the south china sea. J. Geophys. Res. Ocean 2010, 115, C02012. [Google Scholar] [CrossRef]
  19. Lee, C.-Y.; Beardsley, R.C. The generation of long nonlinear internal waves in a weakly stratified shear flow. J. Geophys. Res. 1974, 79, 453–462. [Google Scholar] [CrossRef]
  20. Maxworthy, T. A note on the internal solitary waves produced by tidal flow over a three-dimensional ridge. J. Geophys. Res. Ocean 1979, 84, 338–346. [Google Scholar] [CrossRef]
  21. Maxworthy, T. On the formation of nonlinear internal waves from the gravitational collapse of mixed regions in two and three dimensions. J. Fluid Mech. 1980, 96, 47–64. [Google Scholar] [CrossRef]
  22. Gerkema, T. Internal and interfacial tides: Beam scattering and local generation of solitary waves. J. Mar. Res. 2001, 59, 227–255. [Google Scholar] [CrossRef]
  23. Jan, S.; Lien, R.-C.; Ting, C.-H. Numerical study of baroclinic tides in luzon strait. J. Oceanogr. 2008, 64, 789–802. [Google Scholar] [CrossRef]
  24. Buijsman, M.C.; Legg, S.; Klymak, J. Double-ridge internal tide interference and its effect on dissipation in luzon strait. J. Phys. Ocean 2012, 42, 1337–1356. [Google Scholar] [CrossRef]
  25. Baines, P. On internal tide generation models. Deep. Sea Res. Part Oceanogr. Res. Pap. 1982, 29, 307–338. [Google Scholar] [CrossRef]
  26. Xing, J.; Davies, A.M. Influence of stratification and topography upon internal wave spectra in the region of sills. Geophys. Res. Lett. 2006, 33, L23606. [Google Scholar] [CrossRef]
  27. Marshall, J.; Adcroft, A.; Hill, C.; Perelman, L.; Heisey, C. A finite-volume, incompressible navier stokes model for studies of the ocean on parallel computers. J. Geophys. Res. Ocean 1997, 102, 5753–5766. [Google Scholar] [CrossRef] [Green Version]
  28. Large, W.G.; McWilliams, J.C.; Doney, S.C. Oceanic vertical mixing: A review and a model with a nonlocal boundary layer parameterization. Rev. Geophys. 1994, 32, 363–403. [Google Scholar] [CrossRef] [Green Version]
  29. Fang, G. Tide and tidal current charts for the marginal seas adjacent to china. Chin. J. Oceanol. Limnol. 1986, 4, 1–16. [Google Scholar]
  30. Zu, T.; Gan, J.; Erofeeva, S.Y. Numerical study of the tide and tidal dynamics in the south china sea. Deep. Sea Res. Part Oceanogr. Res. Pap. 2008, 55, 137–154. [Google Scholar] [CrossRef]
  31. Li, M.; Hou, Y.; Li, Y.; Hu, P. Energetics and temporal variability of internal tides in luzon strait: A nonhydrostatic numerical simulation. Chin. J. Oceanol. Limnol. 2012, 30, 852–867. [Google Scholar] [CrossRef]
  32. Ray, R.D.; Mitchum, G.T. Surface manifestation of internal tides generated near hawaii. Geophys. Res. Lett. 1996, 23, 2101–2104. [Google Scholar] [CrossRef]
  33. Cummins, P.F.; Oey, L.-Y. Simulation of barotropic and baroclinic tides off northern british columbia. J. Phys. 1997, 27, 762–781. [Google Scholar] [CrossRef]
  34. Boon, J.D.; Byrne, R. On basin hypsometry and the morphodynamic response of coastal inlet systems. Mar. Geol. 1981, 40, 27–48. [Google Scholar] [CrossRef]
  35. Friedrichs, C.T.; Aubrey, D. Non-linear tidal distortion in shallow well-mixed estuaries: A synthesis. Estuar. Coast. Shelf Sci. 1988, 27, 521–545. [Google Scholar] [CrossRef]
  36. Loder, J.W. Topographic rectification of tidal currents on the sides of Georges Bank. J. Phys. Oceanogr. 1980, 10, 1399–1416. [Google Scholar] [CrossRef] [Green Version]
  37. Chen, C.S.; Lai, Z.; Beardsley, R.; Xu, Q.; Lin, H.; Viet, N. Current separation and upwelling over the southeast shelf of Vietnam in the South China Sea. J. Geophys. Res. Ocean 2012, 117, C03033. [Google Scholar] [CrossRef] [Green Version]
  38. Pickering, A.; Alford, M.; Nash, J.; Rainville, L.; Ko, D.S.; Lim, B. Structure and Variability of Internal Tides in Luzon Strait. J. Phys. Oceanogr. 2015, 45, 1574–1594. [Google Scholar] [CrossRef] [Green Version]
  39. Simpson, J.H.; Crisp, D.J.; Hearn, C. The shelf-sea fronts: Implications of their existence and behaviour [and discussion]. Philos. Trans. R. Soc. Lond. Ser. A Math. Phys. Sci. 1981, 302, 531–546. [Google Scholar]
  40. De Boer, G.J.; Pietrzak, J.D.; Winterwerp, J.C. Using the potential energy anomaly equation to investigate tidal straining and advection of stratification in a region of freshwater influence. Ocean Model. 2008, 22, 1–11. [Google Scholar] [CrossRef]
  41. Kurapov, A.L.; Egbert, G.D.; Allen, J.S.; Miller, R.N.; Erofeeva, S.Y.; Kosro, P.M. The m2 internal tide off oregon: Inferences from data assimilation. J. Phys. Oceanogr. 2003, 33, 1733–1757. [Google Scholar] [CrossRef]
  42. Kang, D.; Fringer, O. Energetics of barotropic and baroclinic tides in the monterey bay area. J. Phys. Oceanogr. 2012, 42, 272–290. [Google Scholar] [CrossRef] [Green Version]
  43. Kelly, S.M.; Nash, J.D. Internal-tide generation and destruction by shoaling internal tides. Geophys. Res. Lett. 2010, 37, l23611. [Google Scholar] [CrossRef] [Green Version]
  44. Kang, D.; Fringer, O. On the calculation of available potential energy in internal wave fields. J. Phys. Oceanogr. 2010, 40, 2539–2545. [Google Scholar] [CrossRef]
  45. Jan, S.; Chern, C.-S.; Wang, J.; Chiou, M.-D. Generation and propagation of baroclinic tides modified by the Kuroshio in the Luzon Strait. J. Geophys. Res. Ocean 2012, 117, c02019. [Google Scholar] [CrossRef] [Green Version]
  46. Ma, B.B.; Lien, R.C.; Ko, D.S. The variability of internal tides in the Northern South China Sea. J. Oceanogr. 2013, 59, 619–630. [Google Scholar] [CrossRef]
  47. Li, Q.; Wang, B.; Chen, X.; Chen, X.E.; Park, J.H. Variability of nonlinear internal waves in the South China Sea affected by the Kuroshio and mesoscale eddies. J. Geophys. Res. Ocean 2016, 121, 2098–2118. [Google Scholar] [CrossRef] [Green Version]
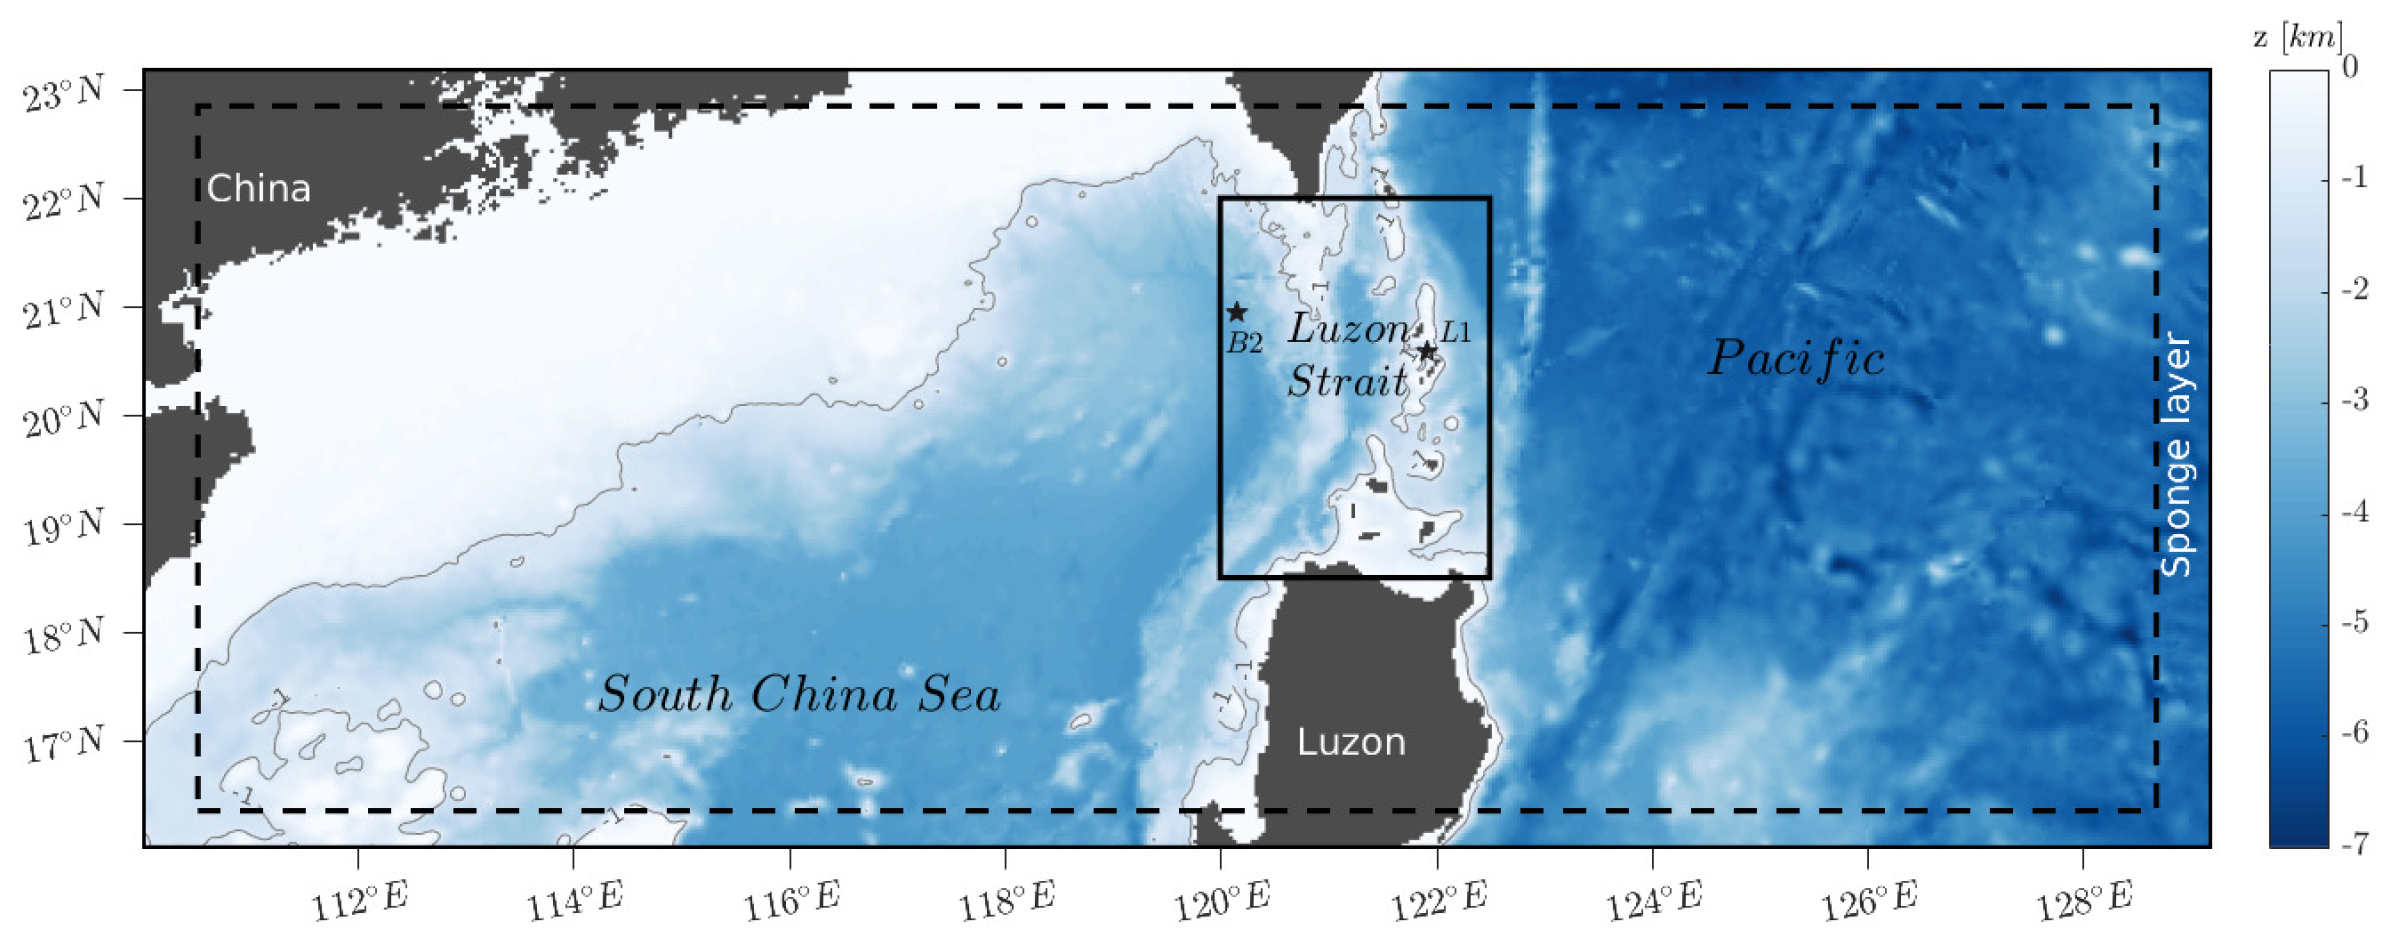
Figure 1. Model domain and its topography. Black solid box is the main research domain, the Luzon Strait. Selected locations L1 and B2, which refer to Ramp et al., are marked with stars [16]. The dashed line is the inner boundary of a sponge layer.
Jmse 09 00703 g001
Figure 2. (a) The temperature, (b) salinity, and (c) buoyancy frequency profiles. Gray dashed lines are the initial field. Black and blue solid lines are the background profiles at L1 and B2, respectively.
Jmse 09 00703 g002
Figure 3. The co-tidal charts calculated from model-predicted sea-level height for (a) M 2 , (b) K 1 , (c) S 2 , and (d) O 1 . Patched colors represent amplitude, gray lines represent phase (in deg and in reference to 0 ).
Jmse 09 00703 g003
Figure 4. The root mean square difference between the model and TPXO7.2 data of zonal barotropic velocity for (a) M 2 , (b) K 1 , (c) S 2 , and (d) O 1 .
Jmse 09 00703 g004
Figure 5. The time series of sea-level height at L1. The blue line represents the model results, the red line represents the TPXO7.2 results.
Jmse 09 00703 g005
Figure 6. (a) The time series of 0–300-meter depth-averaged N 2 and corresponding time-smoothed result (bold line) at L1. The shaded bar represents a three-day period. (b) The zonal barotropic U and (c) V at L1.
Jmse 09 00703 g006
Figure 7. (a) The vertical velocity w (positive upward) and (b) the potential energy anomaly φ and the corresponding time-smoothed result at L1 over three days (shaded in Figure 6a).
Jmse 09 00703 g007
Figure 8. (a) The daily cycle of barotropic U-velocity in the zonal L1-section of day 25. The corresponding baroclinic U-velocity (shaded) and the isopycnals (contours) at (b) 4:00, (c) 10:00, and (d) 16:00.
Jmse 09 00703 g008
Figure 9. Daily averages of salinity and temperature in the zonal L1-section over (a) the ascending part day 25 and (b) the descending part day 32 shown in Figure 6.
Jmse 09 00703 g009
Figure 10. Daily averages of (a,b) baroclinic U-velocity, (c,d) baroclinic V-velocity, and (e,f) W-velocity in the zonal L1-section over the ascending part day 25 and the descending part day 32.
Jmse 09 00703 g010
Figure 11. (a) The time series of potential energy anomaly change Δ φ and corresponding time-smoothed result at L1 and (b) L2. The shaded bars d 1 , d 2 , and d 3 represent one-day periods on different dates. (c) The distribution of the differences of Δ φ between d 2 and d 1 , and (d) between d 3 and d 2 .
Jmse 09 00703 g011
Figure 12. (a) Time series of depth-integrated barotropic to baroclinic conversion rate C ¯ , (b) barotropic kinetic energy E k 0 ¯ , (c) baroclinic kinetic energy E k ¯ , (d) barotropic potential energy E p 0 ¯ , and (e) baroclinic potential energy E p ¯ at L1. (f) Time-smoothed results of the above-mentioned components with the same color.
Jmse 09 00703 g012
Figure 13. (a) The amplitude A, (b) arrival time calculated from phase P and (c) time average M of selected spring-neap cycle of depth-integrated barotropic kinetic energy E k 0 ¯ , and (df) conversion rate C ¯ .
Jmse 09 00703 g013
Figure 14. The estimated lag between conversion rate C ¯ and depth-integrated barotropic kinetic energy E k 0 ¯ at main generation sites of baroclinic tides in the Luzon Strait. Positive means C ¯ lags behind E k 0 ¯ .
Jmse 09 00703 g014
Publisher’s Note: MDPI stays neutral with regard to jurisdictional claims in published maps and institutional affiliations.