Abstract
With the increasing demand for wind energy, the vertical axis wind turbine (VAWT) is attracting more and more attention. In order to design the VAWT array for better performance, the VAWT wake model needs to reflect the wake characteristics well. Based on the asymmetric wake characteristic, a new VAWT wake model is proposed in this paper, which is a combination of two semi Gaussian functions with different deviations, and can be called the “double semi Gaussian functions wake model”. The model is simple and has only four parameters (mean, amplitude, left deviation and right deviation). Compared with the traditional Gaussian and Top-hat model, this model can better reflect the asymmetric characteristic of the VAWT wake. In particular, it can describe the behavior of wake merging in the case of counter-rotating twin turbines. Based on this wake model, the velocity field of VAWT array can be reproduced accurately. The goal function is mainly based on the performance of a basic array unit, and it can ensure the rapidity of the optimization process. The optimal arrangements under two different criteria are analyzed. Moreover, the truncation ratio is introduced to ensure that the downstream turbine works at the rated condition, and the optimal arrangements under different truncation ratios are analyzed. In this paper, the proposed wake model provides a good choice for the preliminary design of the VAWT array, and some relevant suggestions on the array arrangement have been put forward.
1. Introduction
There is huge potential in offshore wind energy, and the number of wind turbines has grown rapidly in recent years [1]. In offshore engineering, wind turbines are often arranged in the array layout. As a widely used device for wind energy, the vertical axis wind turbine (VAWT) has received more and more attention. According to some previous studies, the velocity deficit of the VAWT wake would recover more quickly than that of the horizontal axis wind turbine (HAWT) wake [2]. When the power density is considered, the VAWT array has the potential to achieve higher power density than the HAWT array [3]. In addition, due to the limitation of land use, an active control of the yaw angle is often used in the HAWT array, which could deflect the wake of yawed HAWT. Although the power output of a single turbine would become slightly smaller, the HAWTs can be arranged closer and the whole HAWT wind farm could achieve higher power density [4]. In the same way, the deflection characteristics of VAWT wake can also make the VAWT array achieve high power density. In order to study and design the VAWT array, the VAWT wake model needs to reflect the wake characteristics well.
According to the previous experimental studies, it can be found that there are some characteristics of a VAWT wake. The asymmetry is one of the most typical characteristics of a VAWT wake, the wake deflection has been observed in many experiments [5,6,7,8]. Due to the Magnus effect, the VAWT wake deflects and becomes asymmetric [7]. At a higher tip speed ratio, the velocity deficit in the near field is greater and the velocity recovery in the far field is faster [9]. Due to the wake deflection, the two wakes of the counter-rotating twin VAWTs would merge into one wake in the far field [10]. Moreover, the greater dynamic solidity could lead to the greater wake deflection and velocity deficit [11,12]. In the case of turbulent inflow, the recovery of velocity deficit is faster [13]. The influence of the boundary layer on the VAWT wake depends on the relative height between the turbine and the boundary layer [14].
The characteristics of the VAWT wake are complex, and it is a challenging work for the VAWT wake model. In terms of research status, there are a few studies on the VAWT wake model. The introduction of each VAWT wake model is shown in Table 1.

Table 1.
The research status of VAWT wake model.
It can be seen that the studies on the VAWT wake model are few, and the characteristics of VAWT wake cannot be accurately reflected. However, there is less research on the array optimization. Only the wake edges model and the potential flow model have been used to optimize the array arrangement [23,24,25]. No matter the array optimization or the appropriate wake model, the relevant studies are quite limited. In order to design the VAWT array for better performance, it is necessary to develop a wake model which can better reflect the characteristics of VAWT wake.
In this paper, the “double semi Gaussian functions wake model” is proposed, which can better reflect the asymmetry of velocity distribution and deflection characteristic of the VAWT wake. In Section 2, the model is introduced in detail and compared with some traditional models. In Section 3, some experimental cases are fitted into the model and the contours of streamwise velocity are presented. It is proved that the proposed model can well reproduce the VAWT wake field. Then, in Section 4, this wake model is used for the array optimization. Under two common criteria (average inflow velocity and array power density), the optimal arrangements are analyzed. In Section 5, in order to ensure that the downstream turbine works at the rated condition, the truncation ratio is introduced and the optimal arrangements under different truncation ratios are analyzed.
2. Description of the Double Semi Gaussian Functions Wake Model
In order to closely match the asymmetric velocity profile of the VAWT wake, some statistical distributions are chosen, and the curves of these functions are asymmetric. These functions are the Weibull distribution, polynomial interpolation and double semi Gaussian functions. The statistical meaning of these functions is not used here, and their geometric curves are used to fit the velocity profile of the VAWT wake. The formulas of these functions are listed in Table 2.
Table 2.
The formulas of some asymmetric functions.
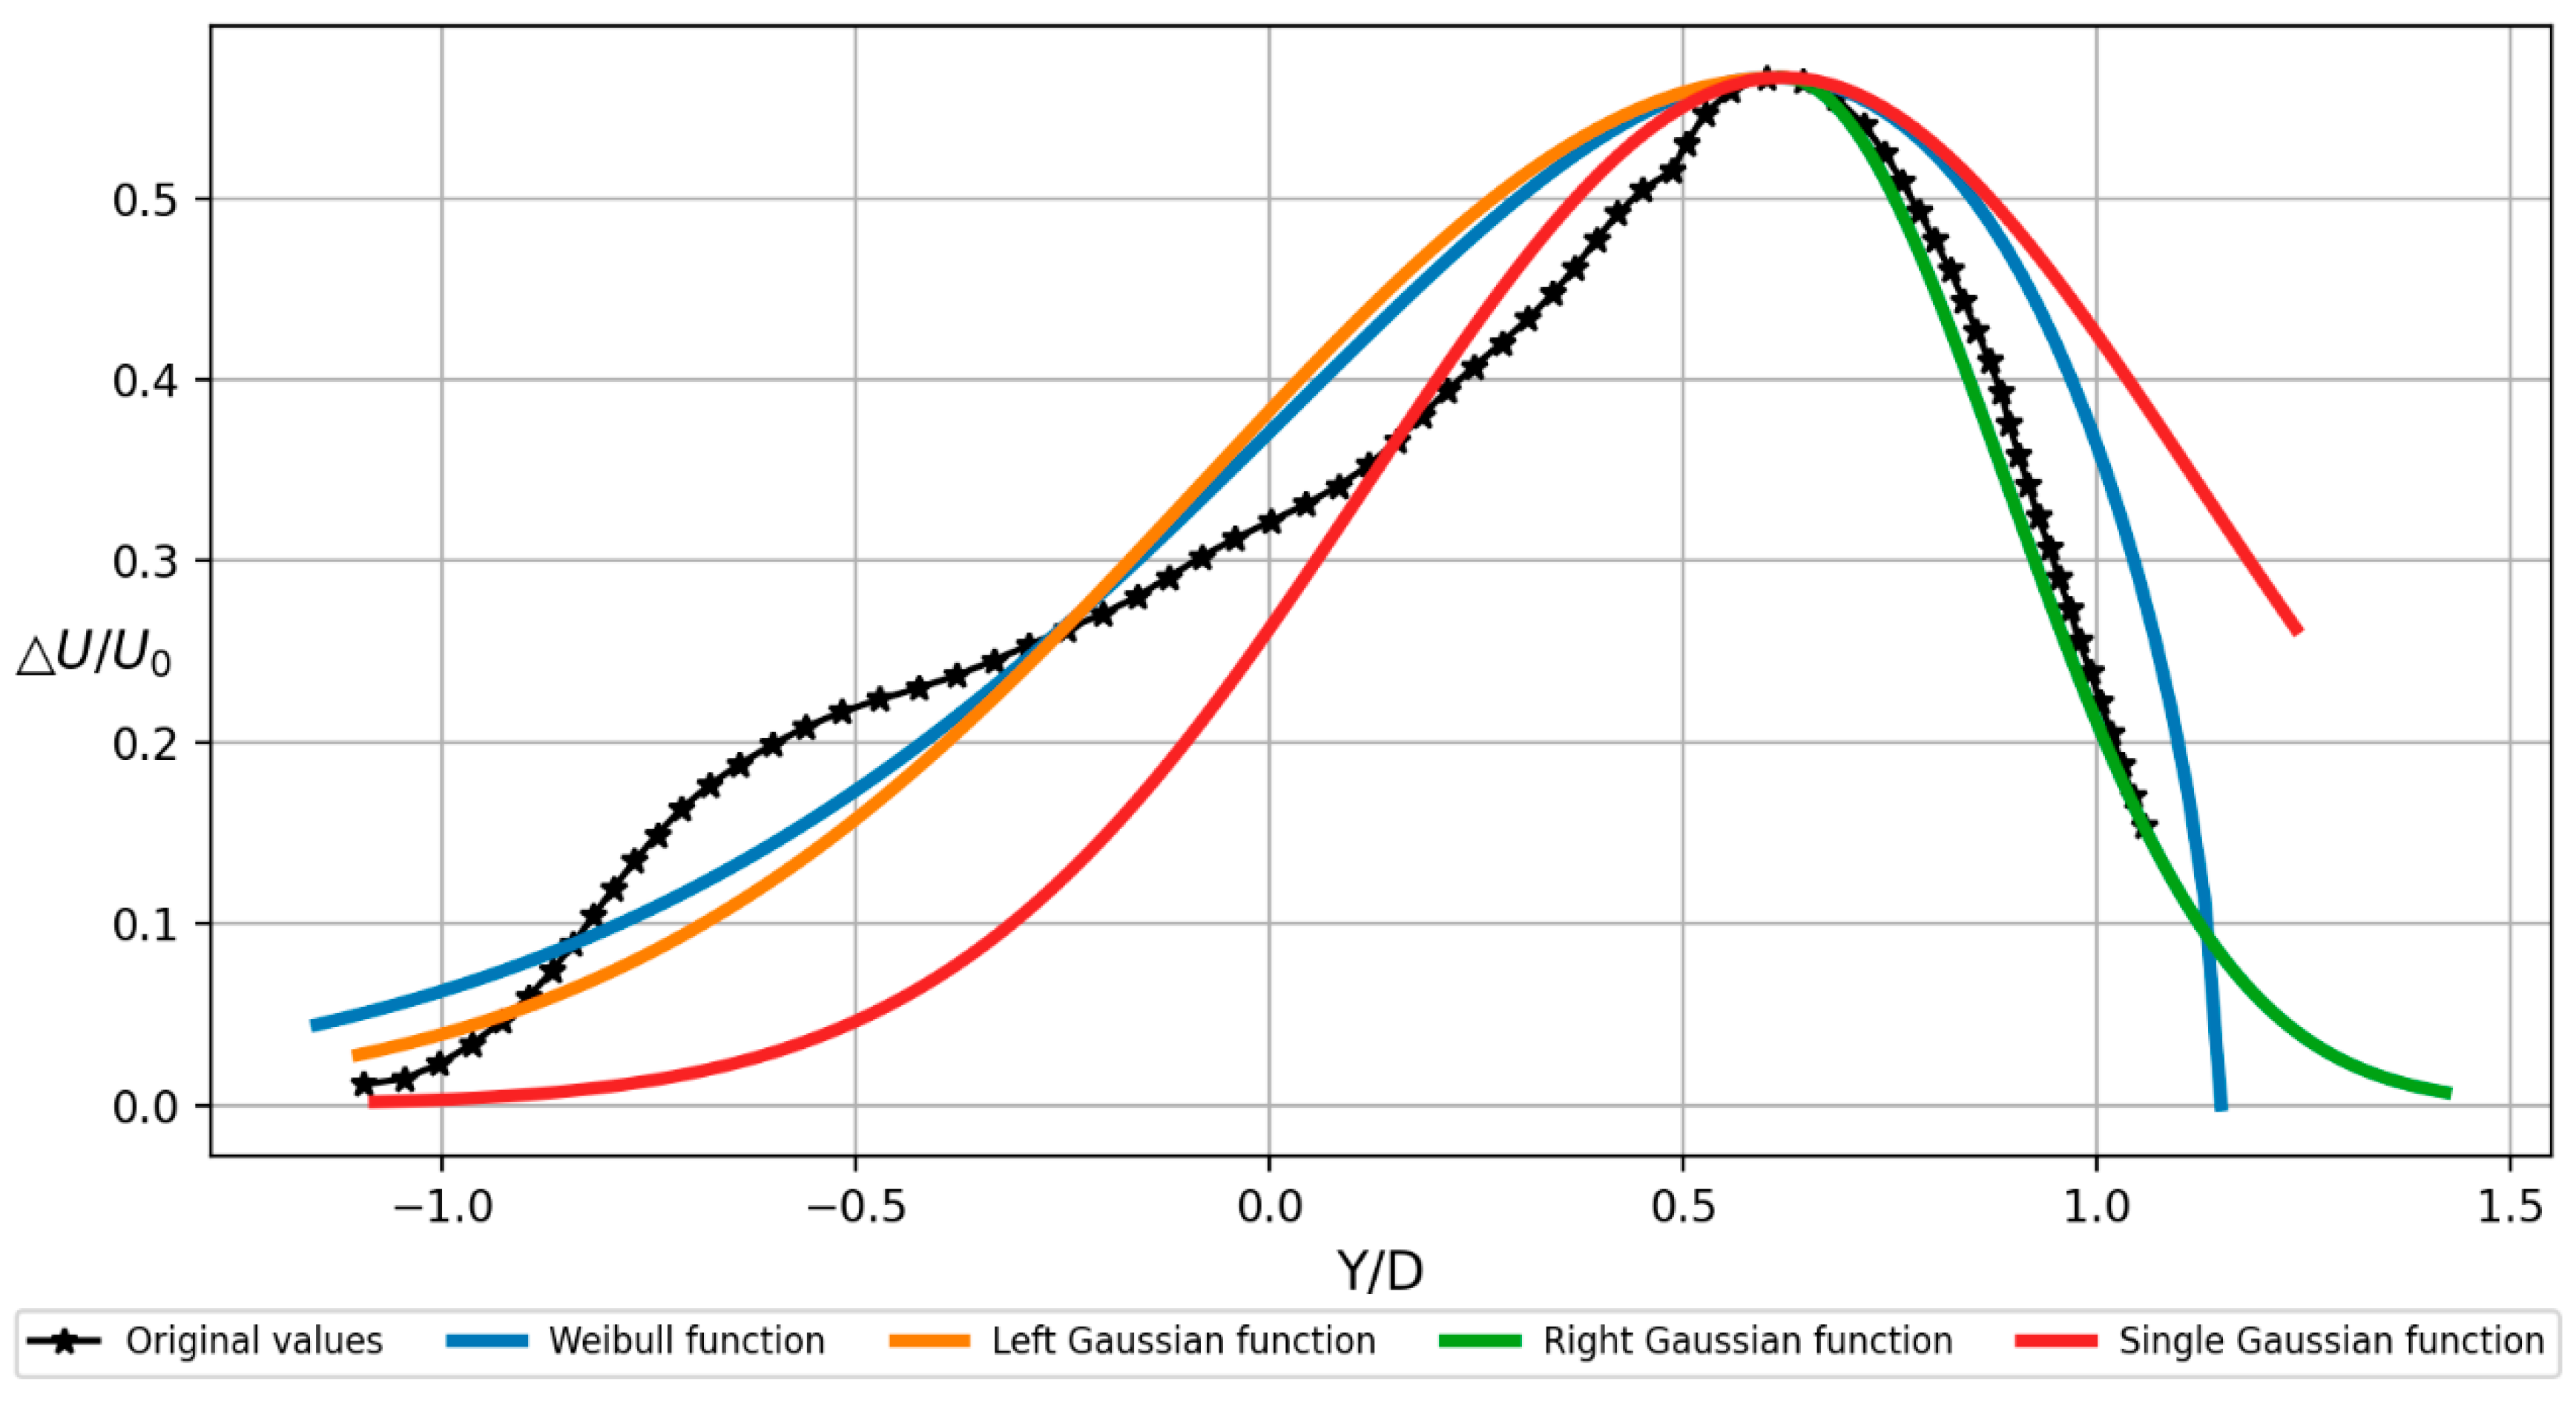
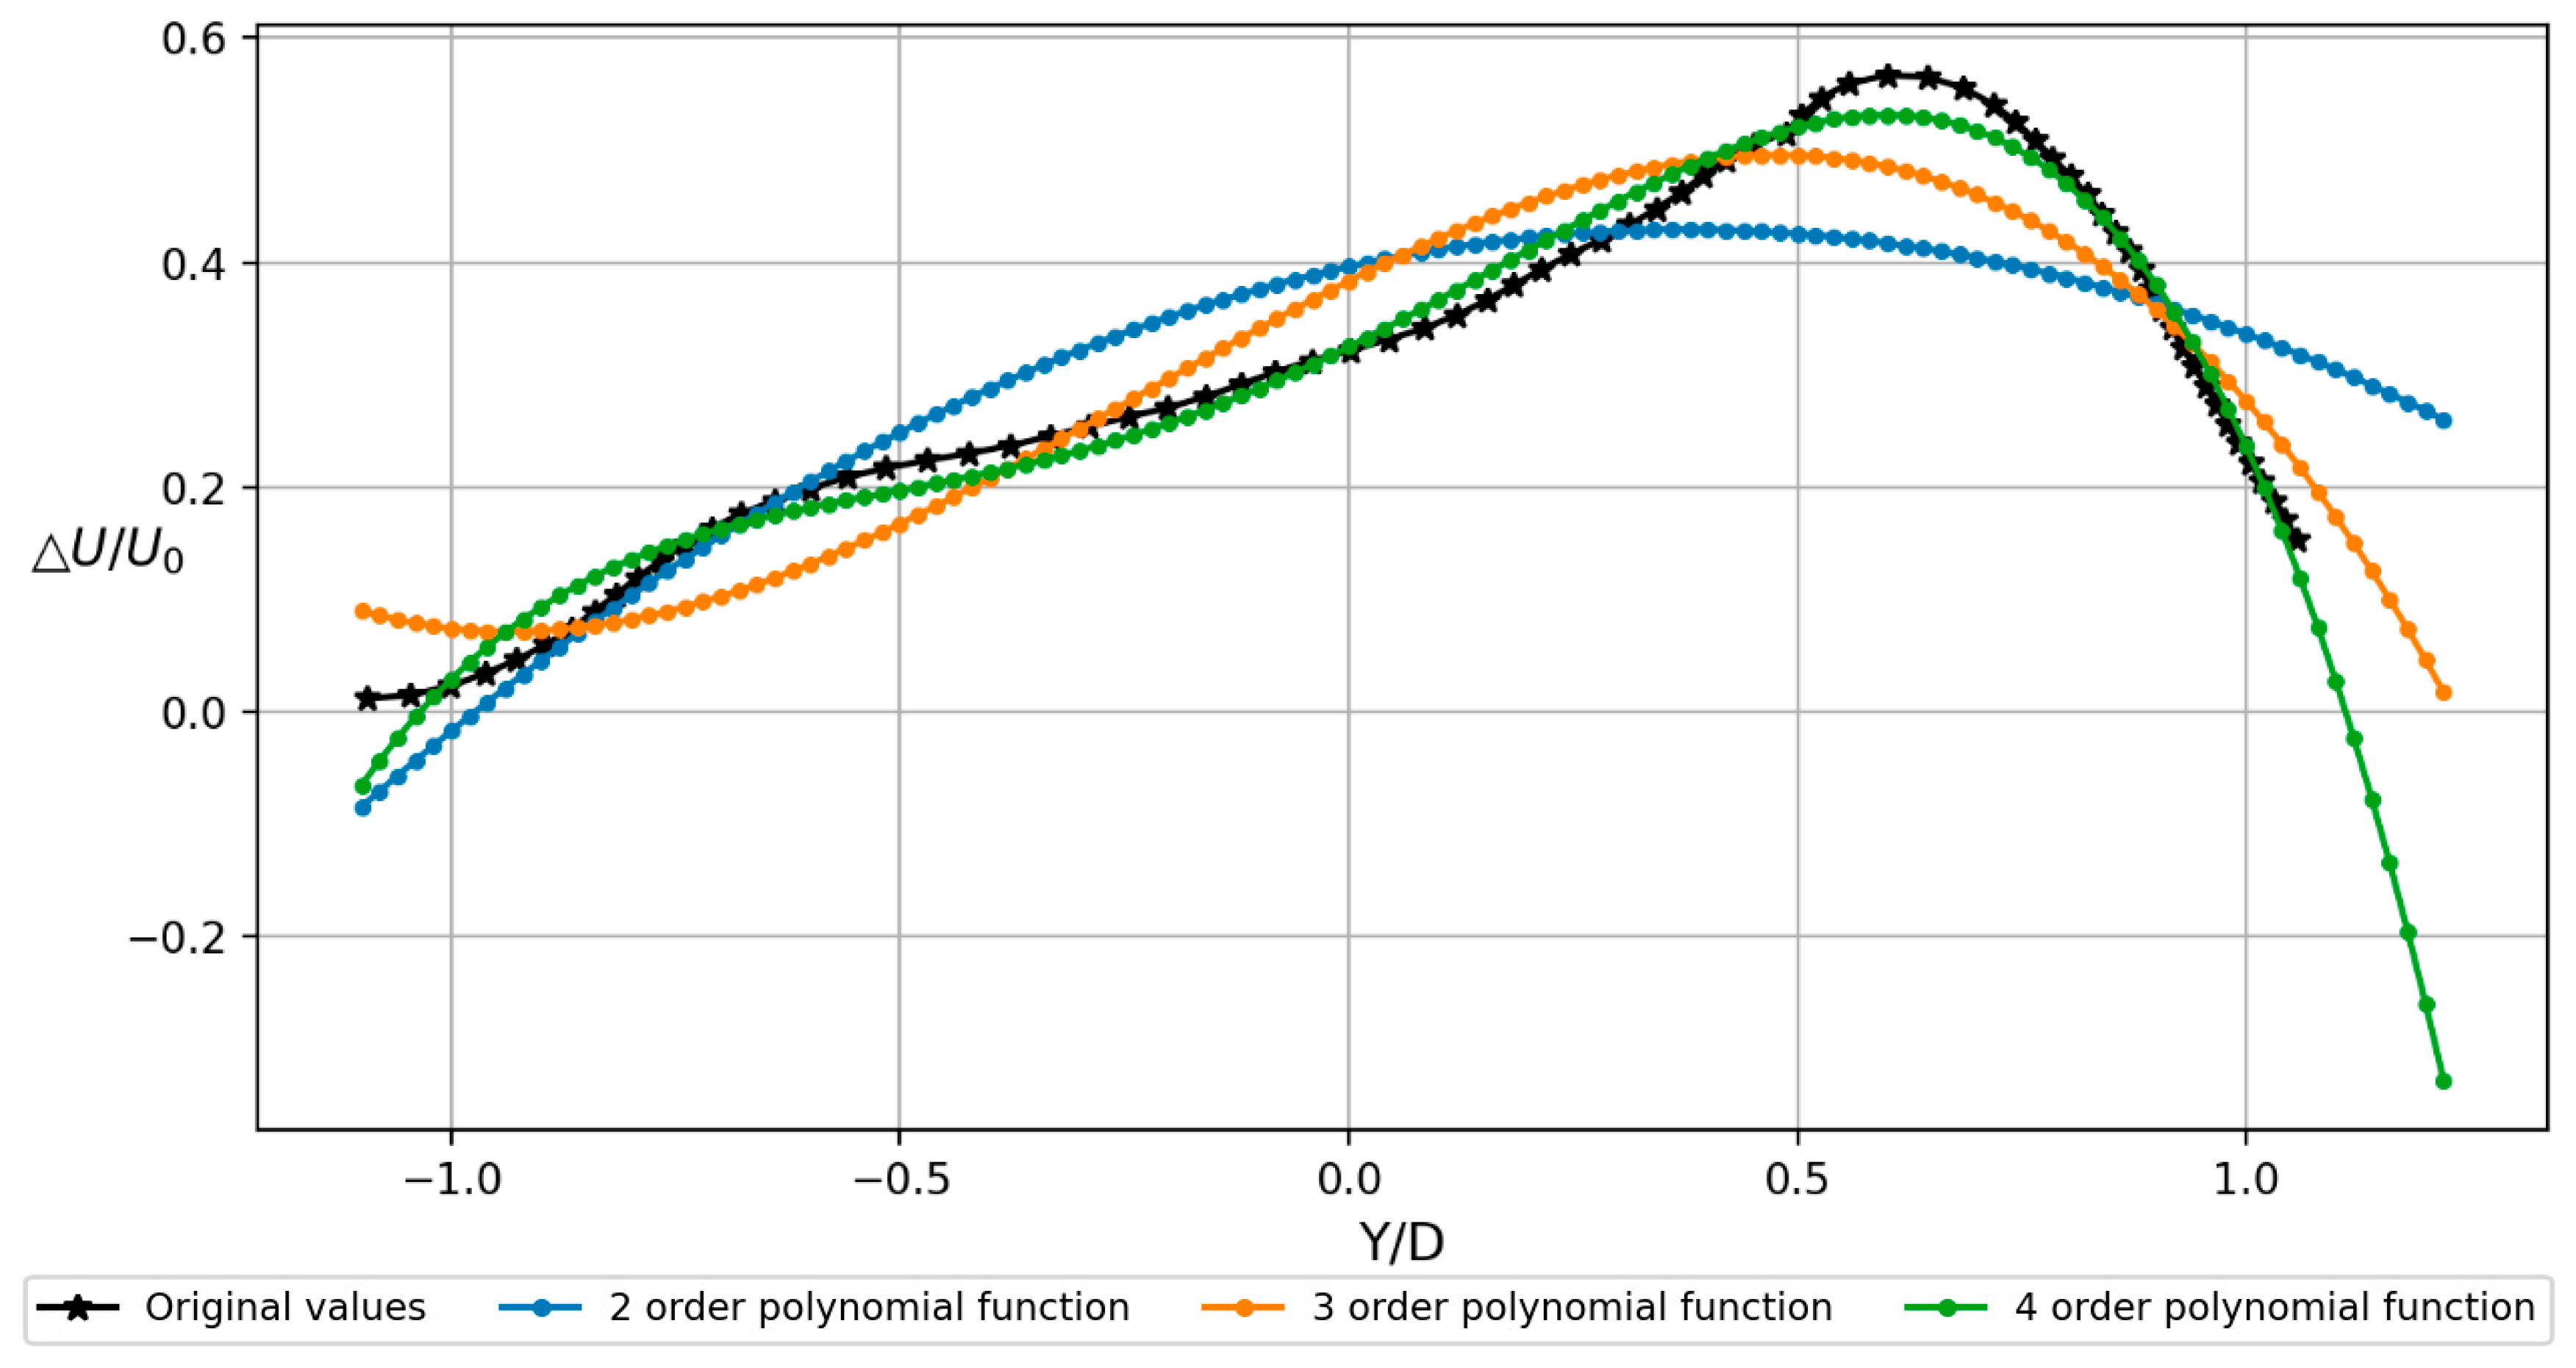
To qualitatively compare the fitting accuracy of these functions, an asymmetric velocity profile of a PIV experiment [8] is selected as the fitting target. The fitting results of Weibull distribution, double semi Gaussian functions and single Gaussian function are shown in Figure 1. The fitting results of second order, third order and fourth order polynomial functions are shown in Figure 2.
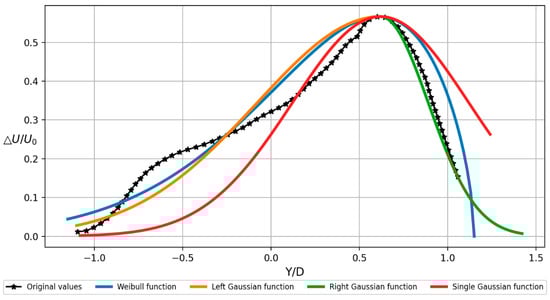
Figure 1.
The comparison between the original data and three fitting functions. Here, the double semi Gaussian functions are divided into left Gaussian function and right Gaussian function. The original data is the velocity profile at 3D position in a PIV experiment [8]. X-axis is the position of cross-section which is normalized by the diameter D. Y-axis is the velocity deficit which is normalized by the inlet velocity U0. (The deviation of left Gaussian is 0.7, the deviation of right Gaussian is 0.27, the parameters of Weibull function: k = 1.6, λ = 1. The deviation of single Gaussian is 0.5).
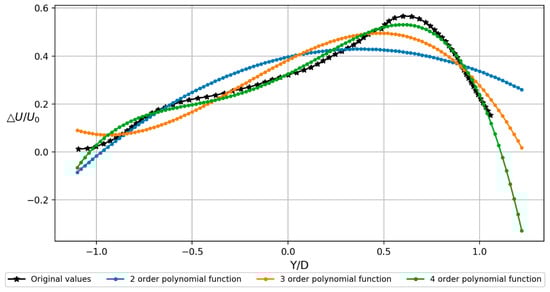
Figure 2.
The comparison between the original data and three polynomial functions. The original data is the velocity profile at 3D position in a PIV experiment [8]. X-axis is the position of cross-section which is normalized by the diameter D. Y-axis is the velocity deficit which is normalized by the inlet velocity U0. (2 order polynomial function: . 3 order polynomial function: . 4 order polynomial function: . The polynomials are calculated by the fitting program of Python).
In the preliminary design of the VAWT array, only the streamwise velocity needs to be considered. In the fitting process, the streamwise velocity profile of cross section is fitted into the proposed model. The peak of the velocity profile is easy to be identified. The abscissa of the peak is the mean (c), the ordinate of the peak is the amplitude (A). In order to determine the other two model parameters (left deviation and right deviation), the fitting principle is based on the area conservation, that is, the area enclosed by the fitting curve should be kept roughly equal to the area enclosed by the original curve. If the fitting curve is higher in some places, it needs to be lower in other places. Especially in the peak region of the velocity profile, the fitting curve should be as close as possible to the original curve. Additionally, the fitting accuracy of the peak region should be ensured prior to that of edge region. Based on the area conservation, the two deviations can be adjusted and determined empirically.
In the existing research on the VAWT wake model, the fitting weight is empirical and has not been systematically studied. The fitting weights of different regions are adjusted empirically, so it is not easy to calculate the quantitative error of the whole fitting curve. However, only the qualitative comparison of different wake models is needed, the fitting curve of wake model is not required to completely match every point of the velocity profile, and it is unnecessary to consider the quantitative errors and uncertainty of a wake model. In a word, on the basis of the conservation of enclosed area, there are still some empirical corrections. Although it is difficult to achieve complete high-precision fitting through the wake model, the general consistency and first-order accuracy approximation of the wake model are sufficient for the array optimization. In this paper, wake model is mainly focus on the array optimization, rather than the fine fitting of flow details. The applicability of the proposed model can be verified by the qualitative comparison in Figure 1.
According to Figure 1 and Figure 2, the comparison of these fitting functions are summarized in Table 3. The physical meaning in the third column is that the model parameters can be corresponding to the wake parameters. As a good wake model, the model parameters should represent the wake parameters more intuitively, the mathematical parameters should be more relevant to the physical meaning.
Table 3.
The comparison and summary of these fitting functions.
According to the comparison of fitting accuracy and physical meaning, the double semi Gaussian functions perform better in both aspects. As a VAWT wake model, the proposed model not only can fit the asymmetric velocity profile well, but also has some other advantages in engineering, which are introduced one by one in the following three paragraphs.
In the design of array layout, not only the maximum velocity deficit but also the area of velocity deficit is often used to measure the wind power. The inflow velocity of downstream turbine can be better represented by velocity integration rather than the maximum velocity. The area of velocity deficit is the integral area of the double semi Gaussian functions. Compared with other fitting functions, the velocity integration can be calculated directly according to the amplitude and deviation, without any complex integral process.
A pair of VAWTs would also be a basic unit in the VAWT array [3,10]. Due to the wake deflection, the two wakes of a pair of VAWTs would merge into one wake in the far field [10]. In view of this phenomenon, most of the conventional wake models may not be applicable. However, the model proposed in this paper can make one of the two deviations close to zero, so that this phenomenon can be reproduced in the flow field. This is also an important advantage of this model, which is verified in Section 3.
According to some previous studies, the wake of a yawed HAWT is asymmetric [27], and the wake of a rotating cylinder is also deflected [28]. Therefore, the double semi Gaussian functions could also be applied to the wake of yawed HAWT and rotating cylinder.
According to the introduction above, it can be found that the double semi Gaussian functions proposed in this paper could be widely applicable under different working conditions. In the following sections, the verification and application of this model are introduced in detail.
3. Velocity Contours Reproduced by the Proposed Model
The wake model is used for the preliminary design of VAWT array. Although different experimental parameters (turbulence intensity and tip speed ratio) lead to different model parameters, it is not the purpose of this paper to study the effect of experimental parameters. Therefore, the experimental parameters would not be the selection standard of the benchmark experiment, the complete measurement of the VAWT wake is more important and would be the selection standard of benchmark experiment.
There are few experiments on the VAWT wake; especially, there are fewer experiments which measured the complete wake as far as 10D downstream. To be applicable for the array design, more data of complete wake is necessary, so that the whole field could be fitted into the wake model. In the existing experiments, three different layouts [10,15] of the same VAWT prototype are selected as the benchmark experiments, which present ten velocity profiles from near field to far field. The details of these three cases are shown in Table 4.
Table 4.
The basic information of these three cases.
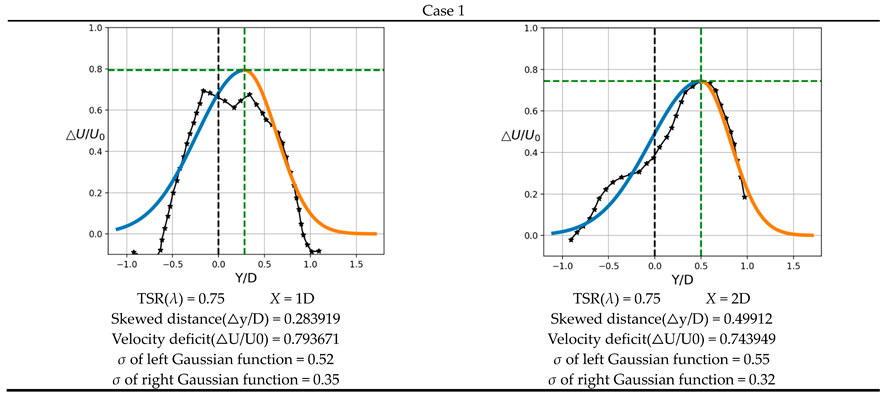
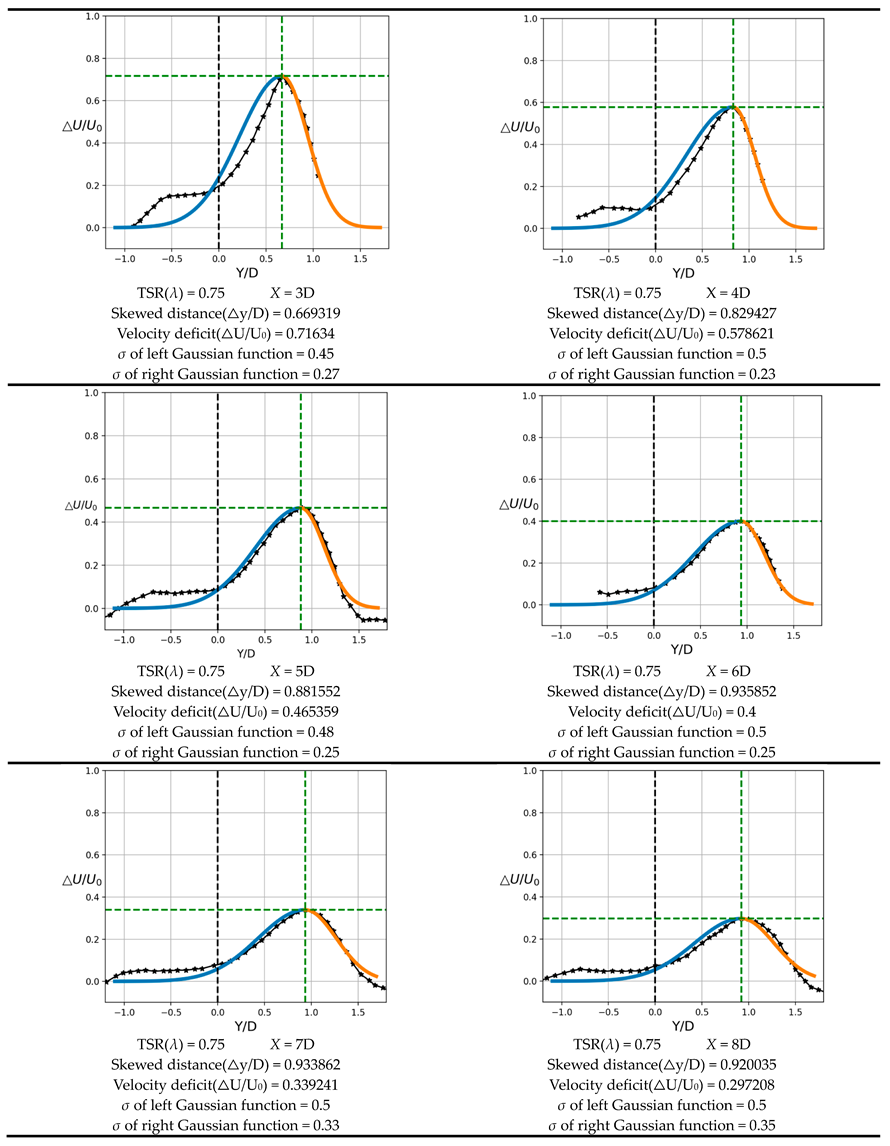
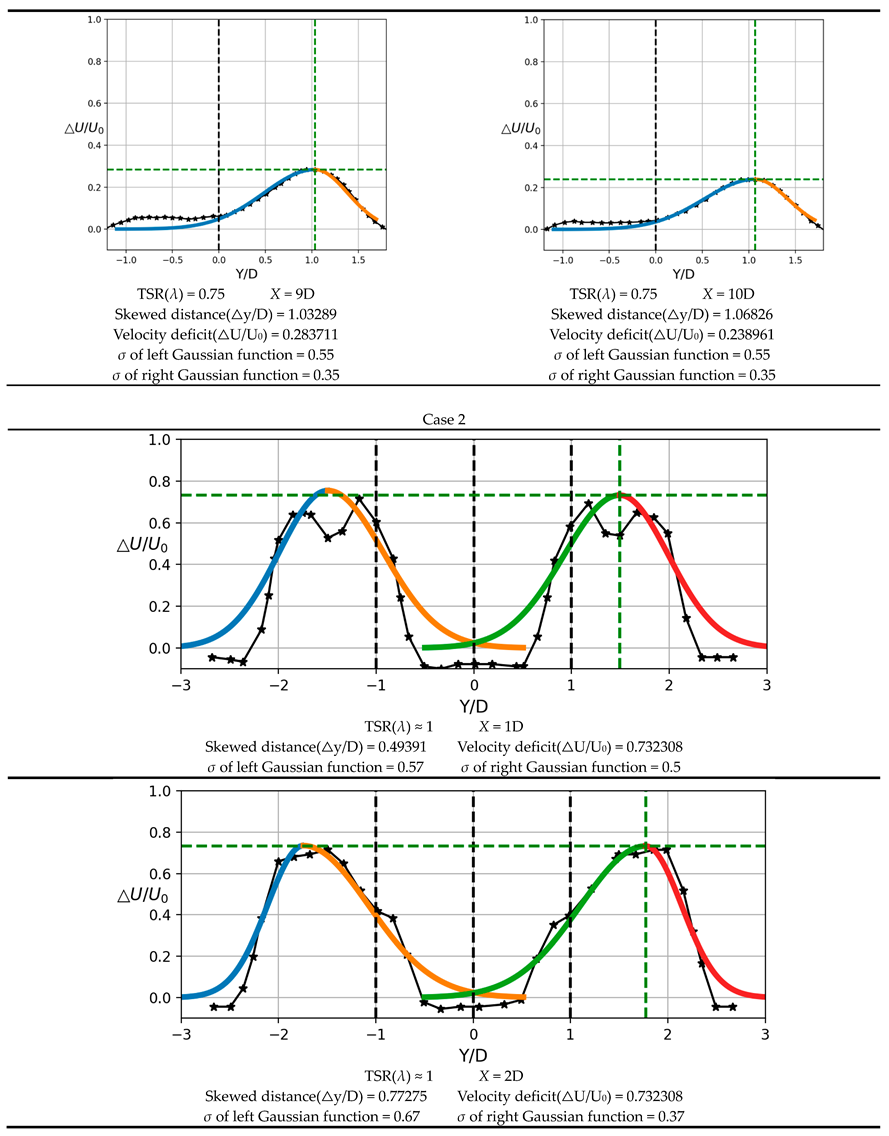
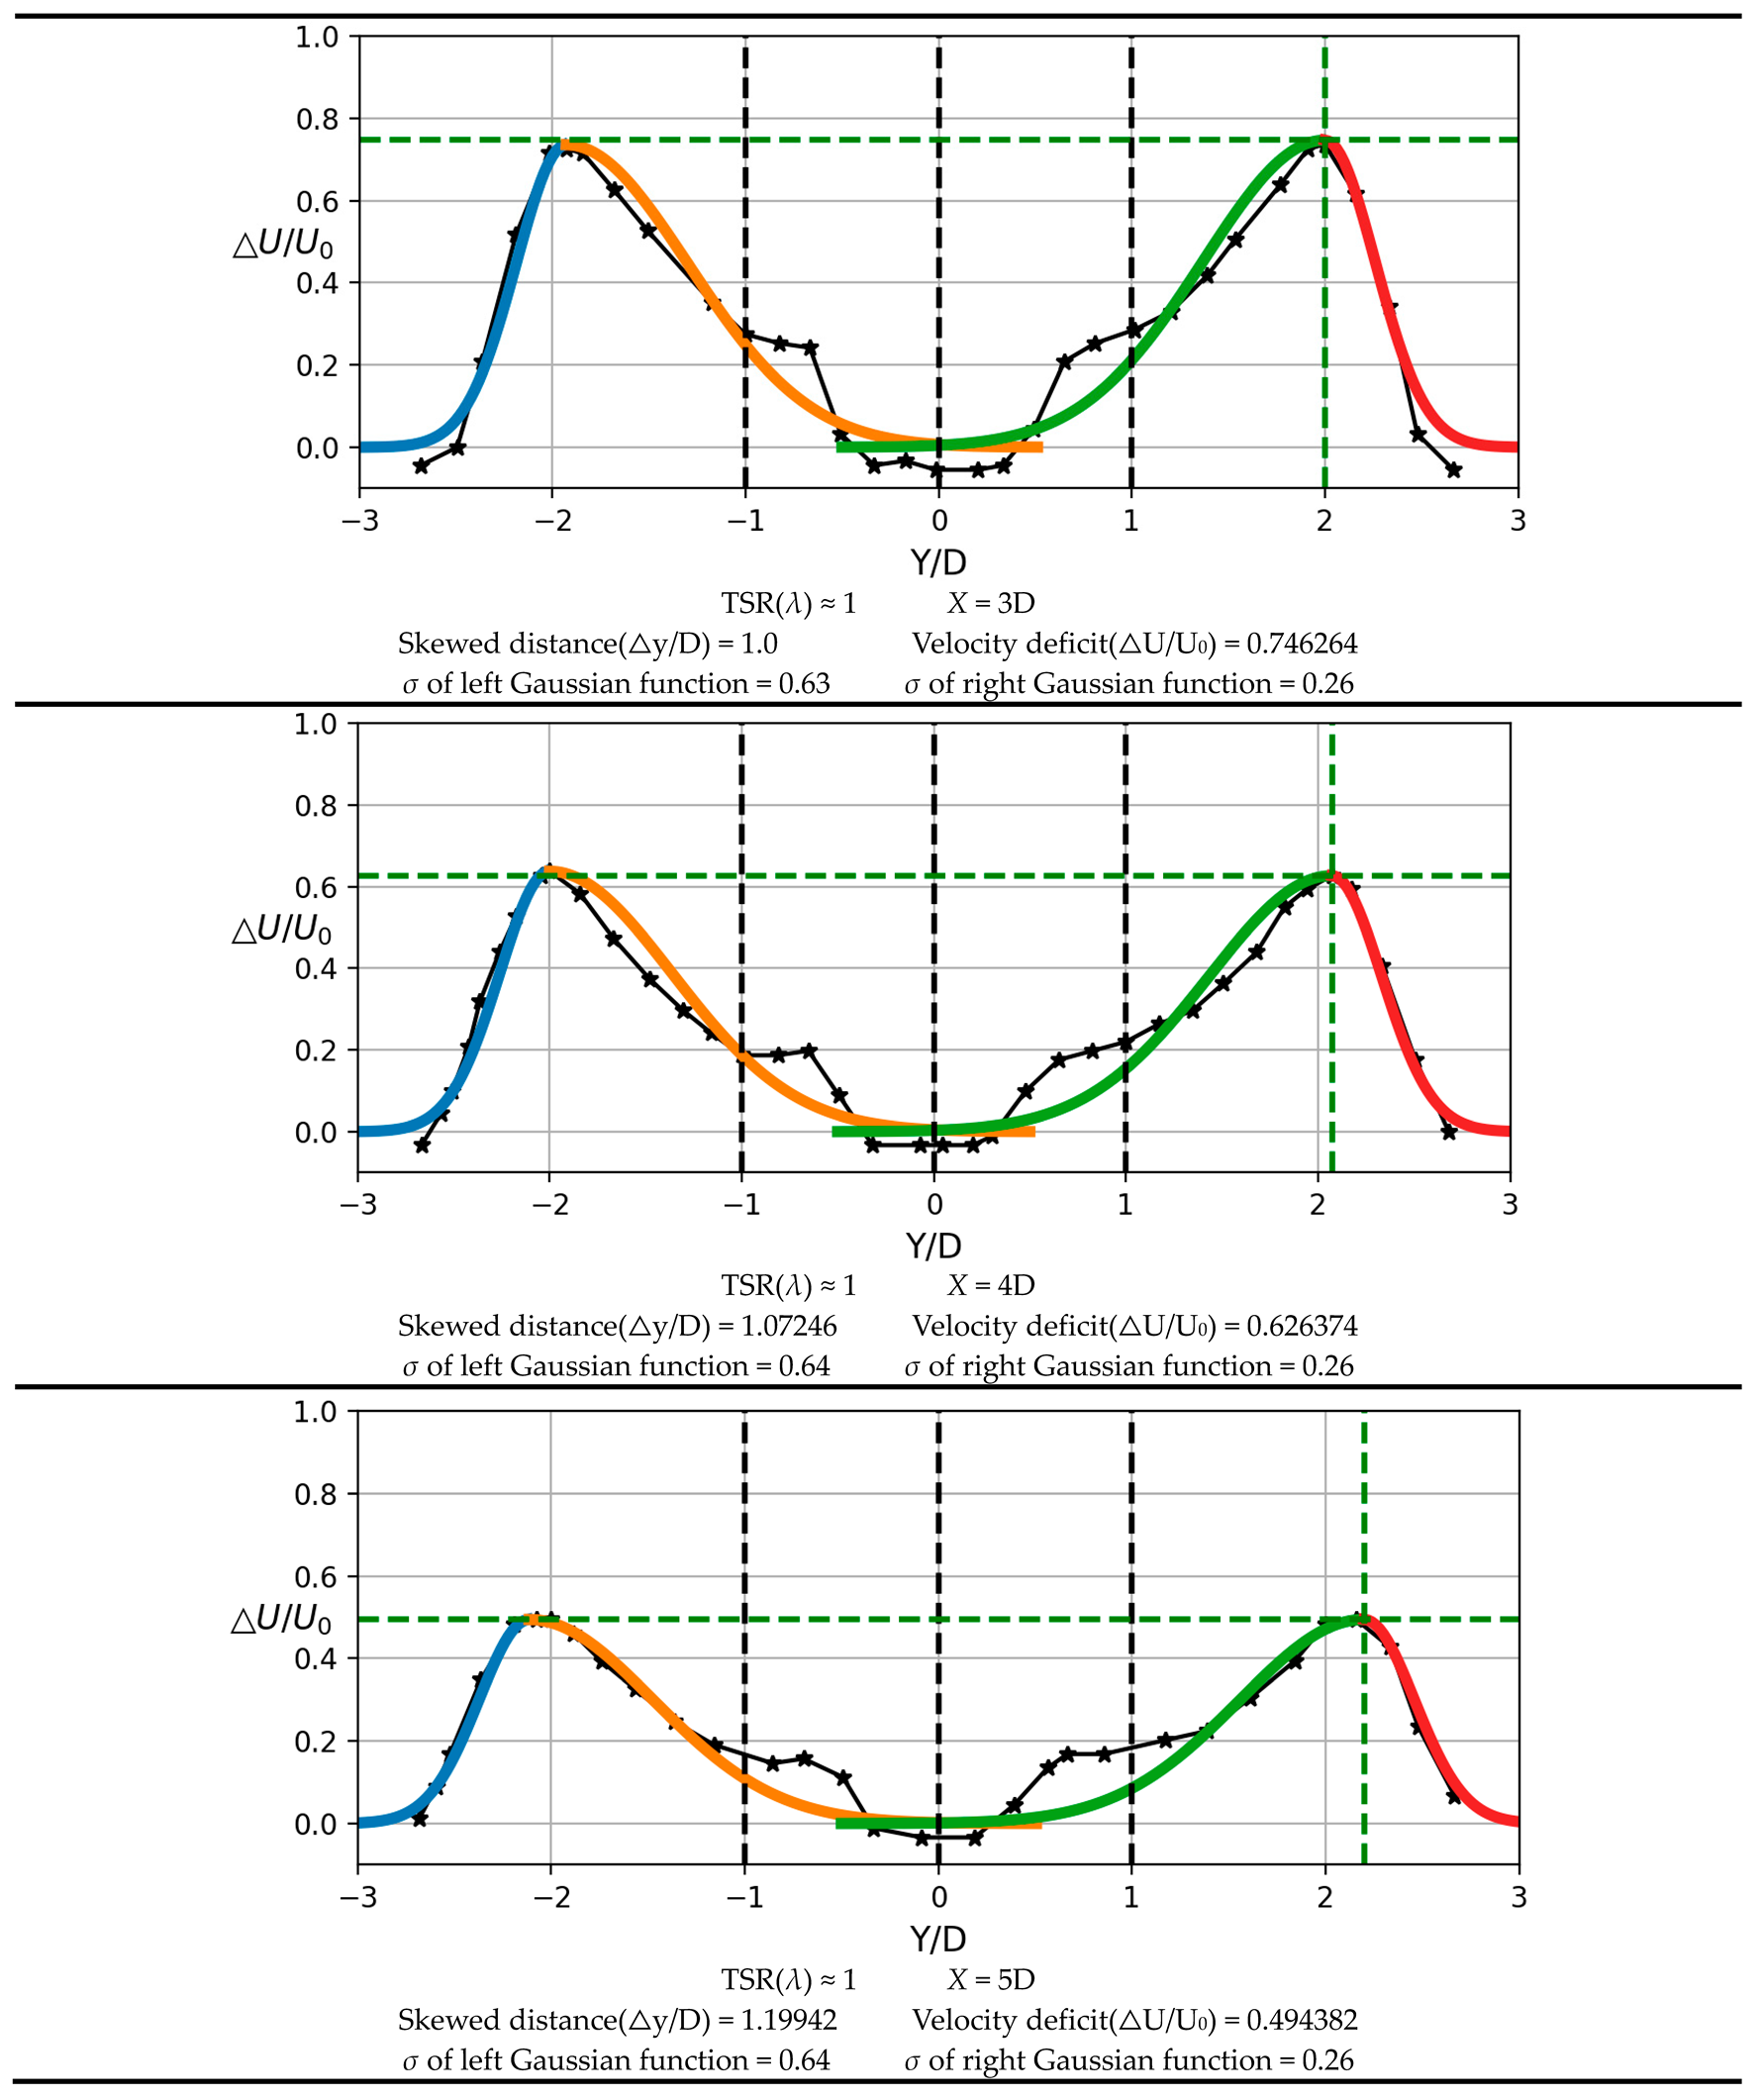
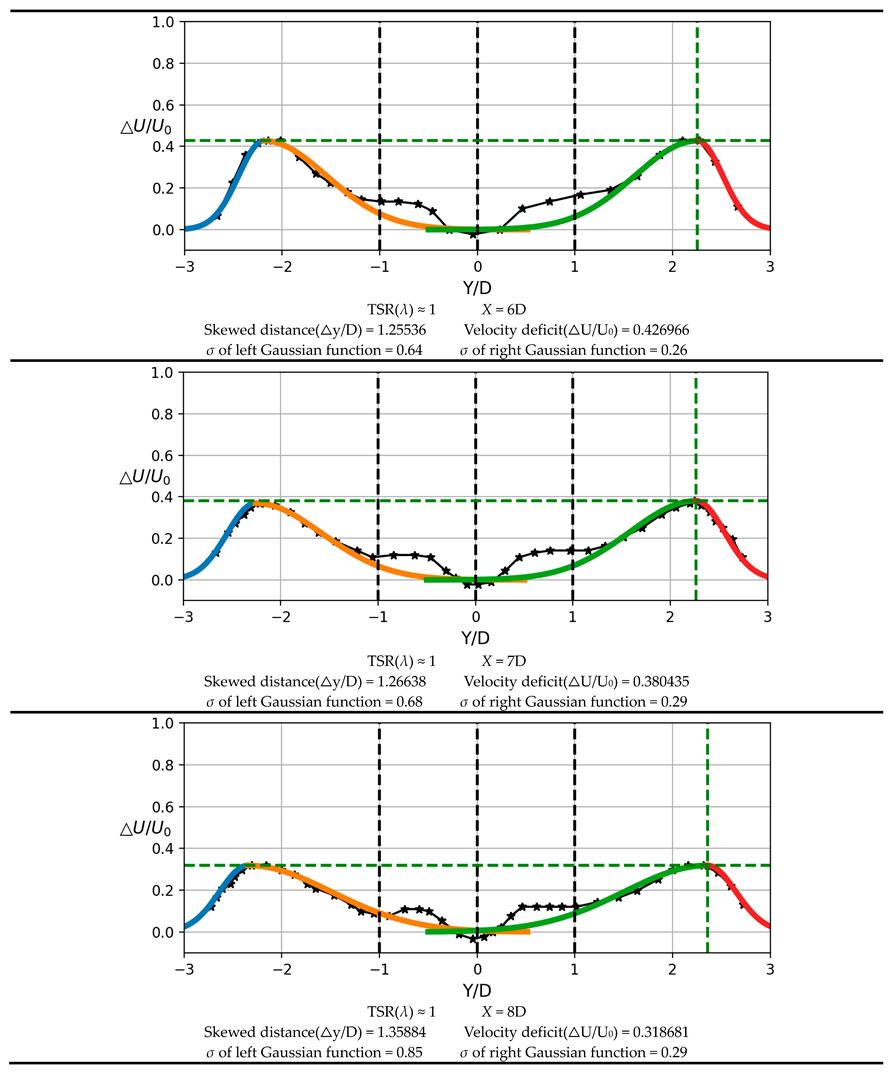
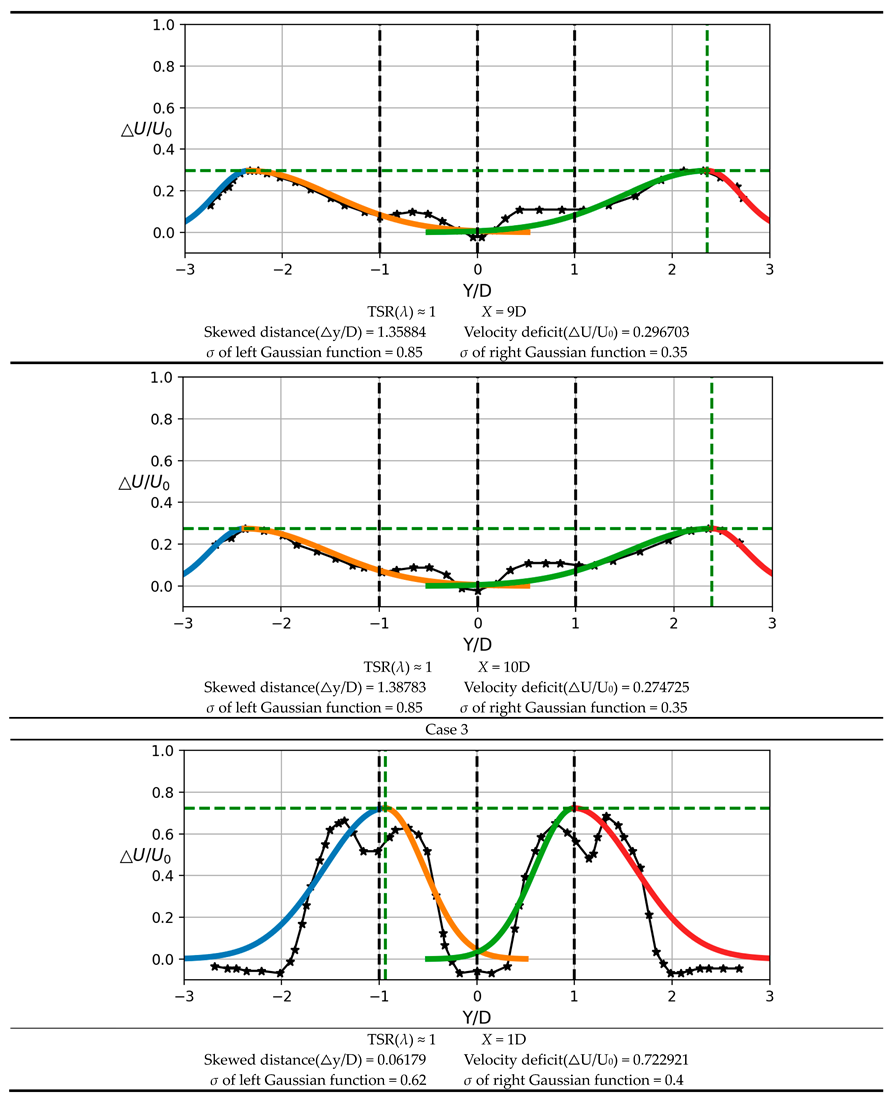
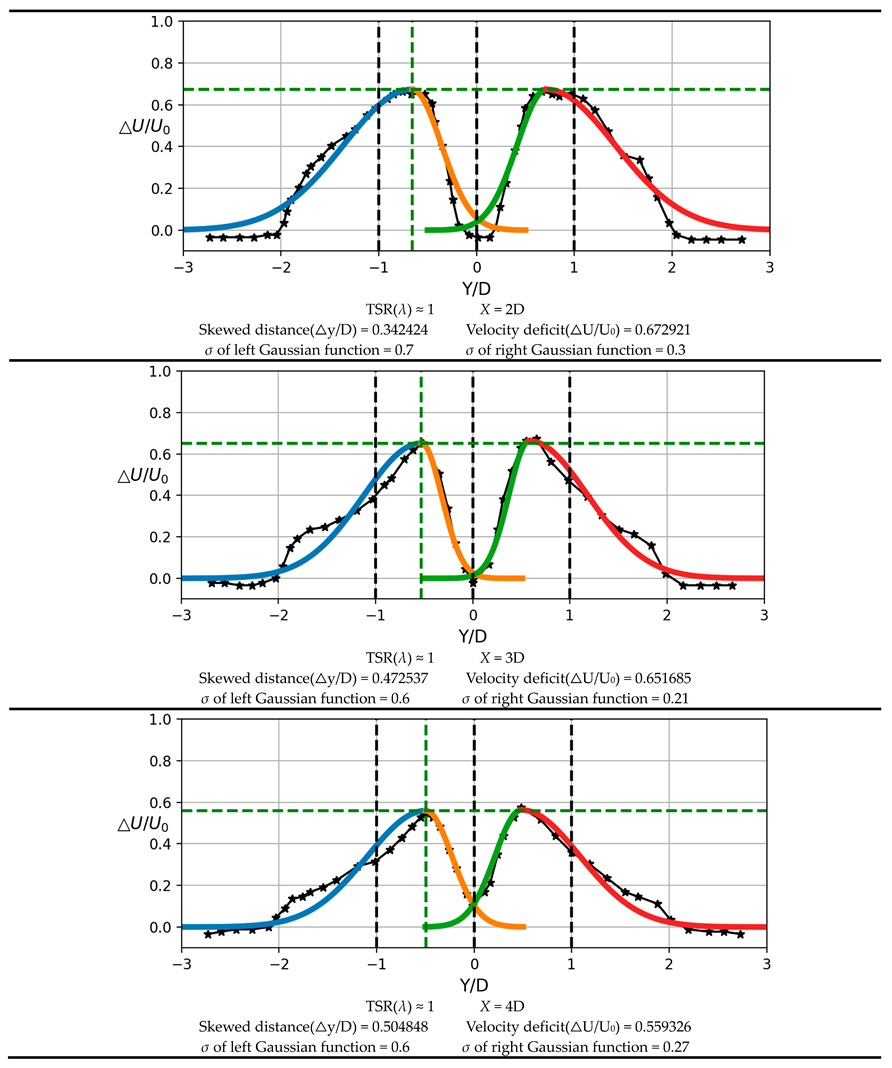
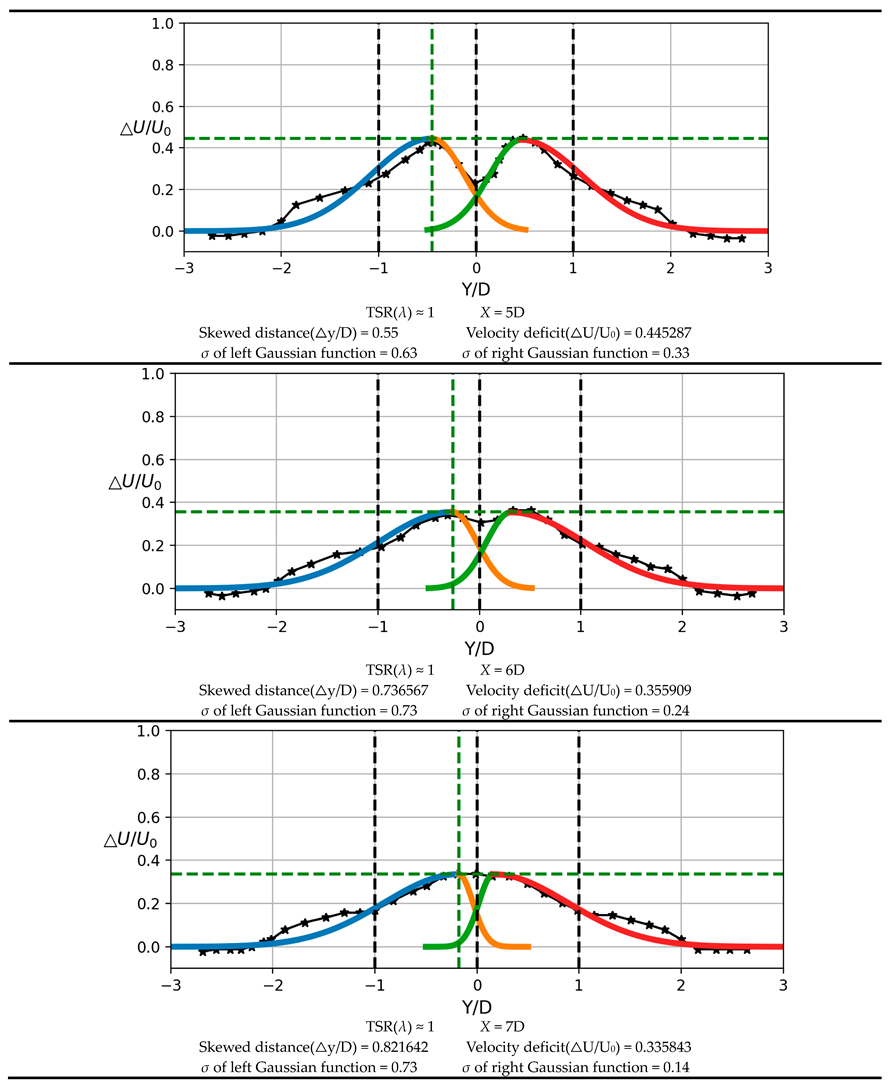
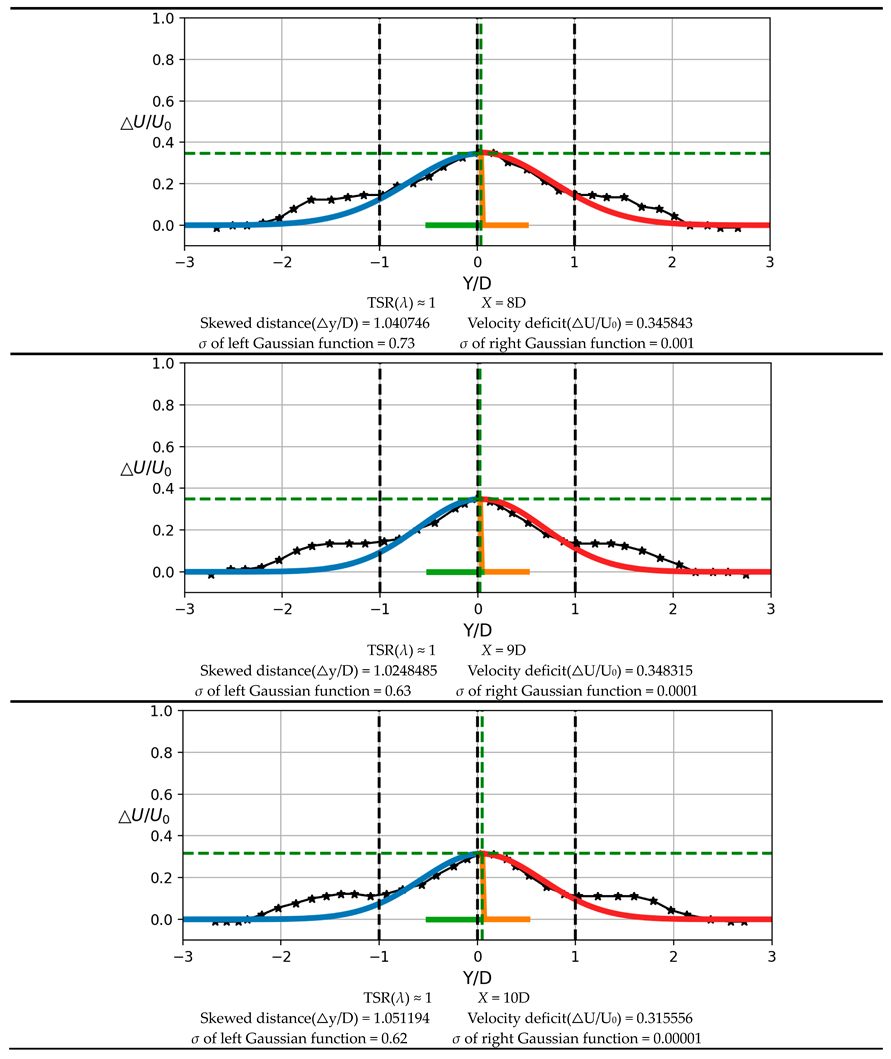
The velocity profiles of each measured section are fitted into the double semi Gaussian functions wake model. The fitting results and the four corresponding parameters (lateral displacement, maximum velocity deficit, left deviation and right deviation) are shown in detail in Appendix A. The lateral displacement (skewed distance) and deviation (σ) are dimensionless by the rotor diameter D, and the maximum velocity deficit is dimensionless by the inlet velocity U0. In order to unify the definition, the leeward side is defined as the left side, and the windward side is defined as the right side.
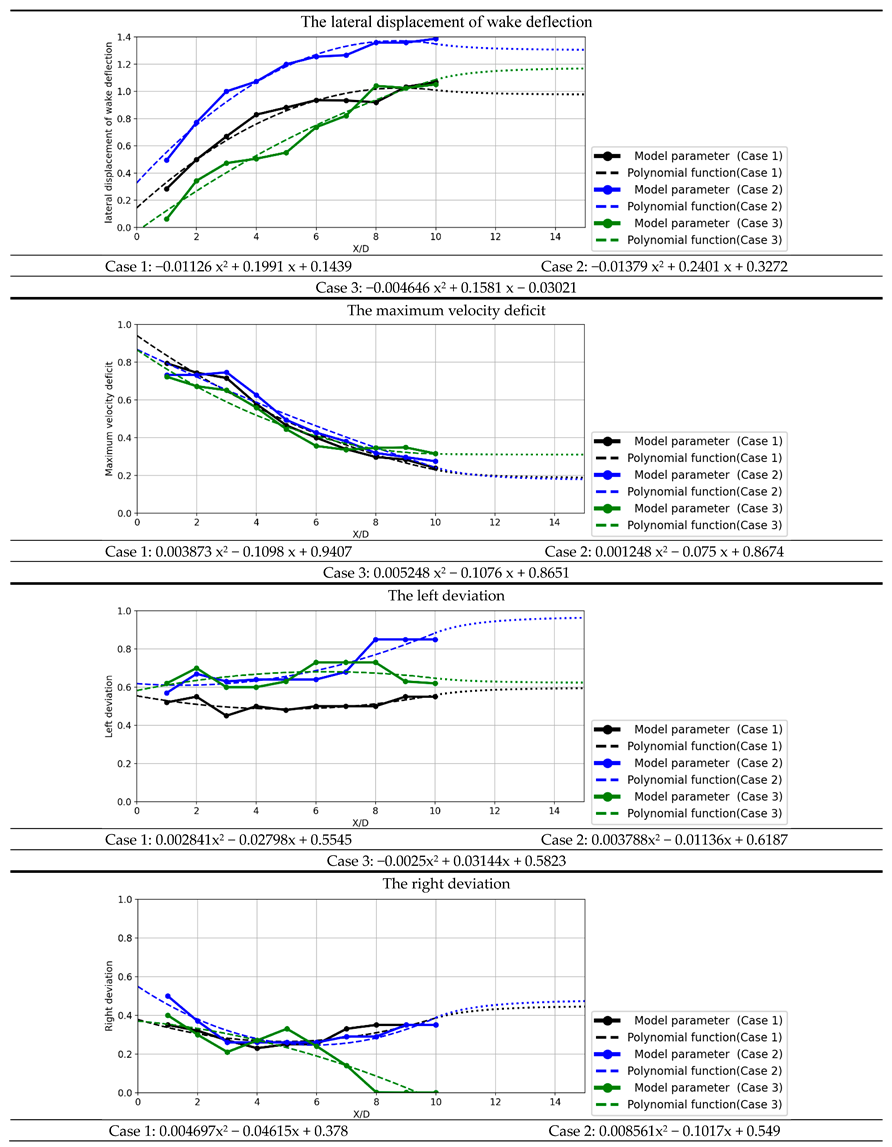
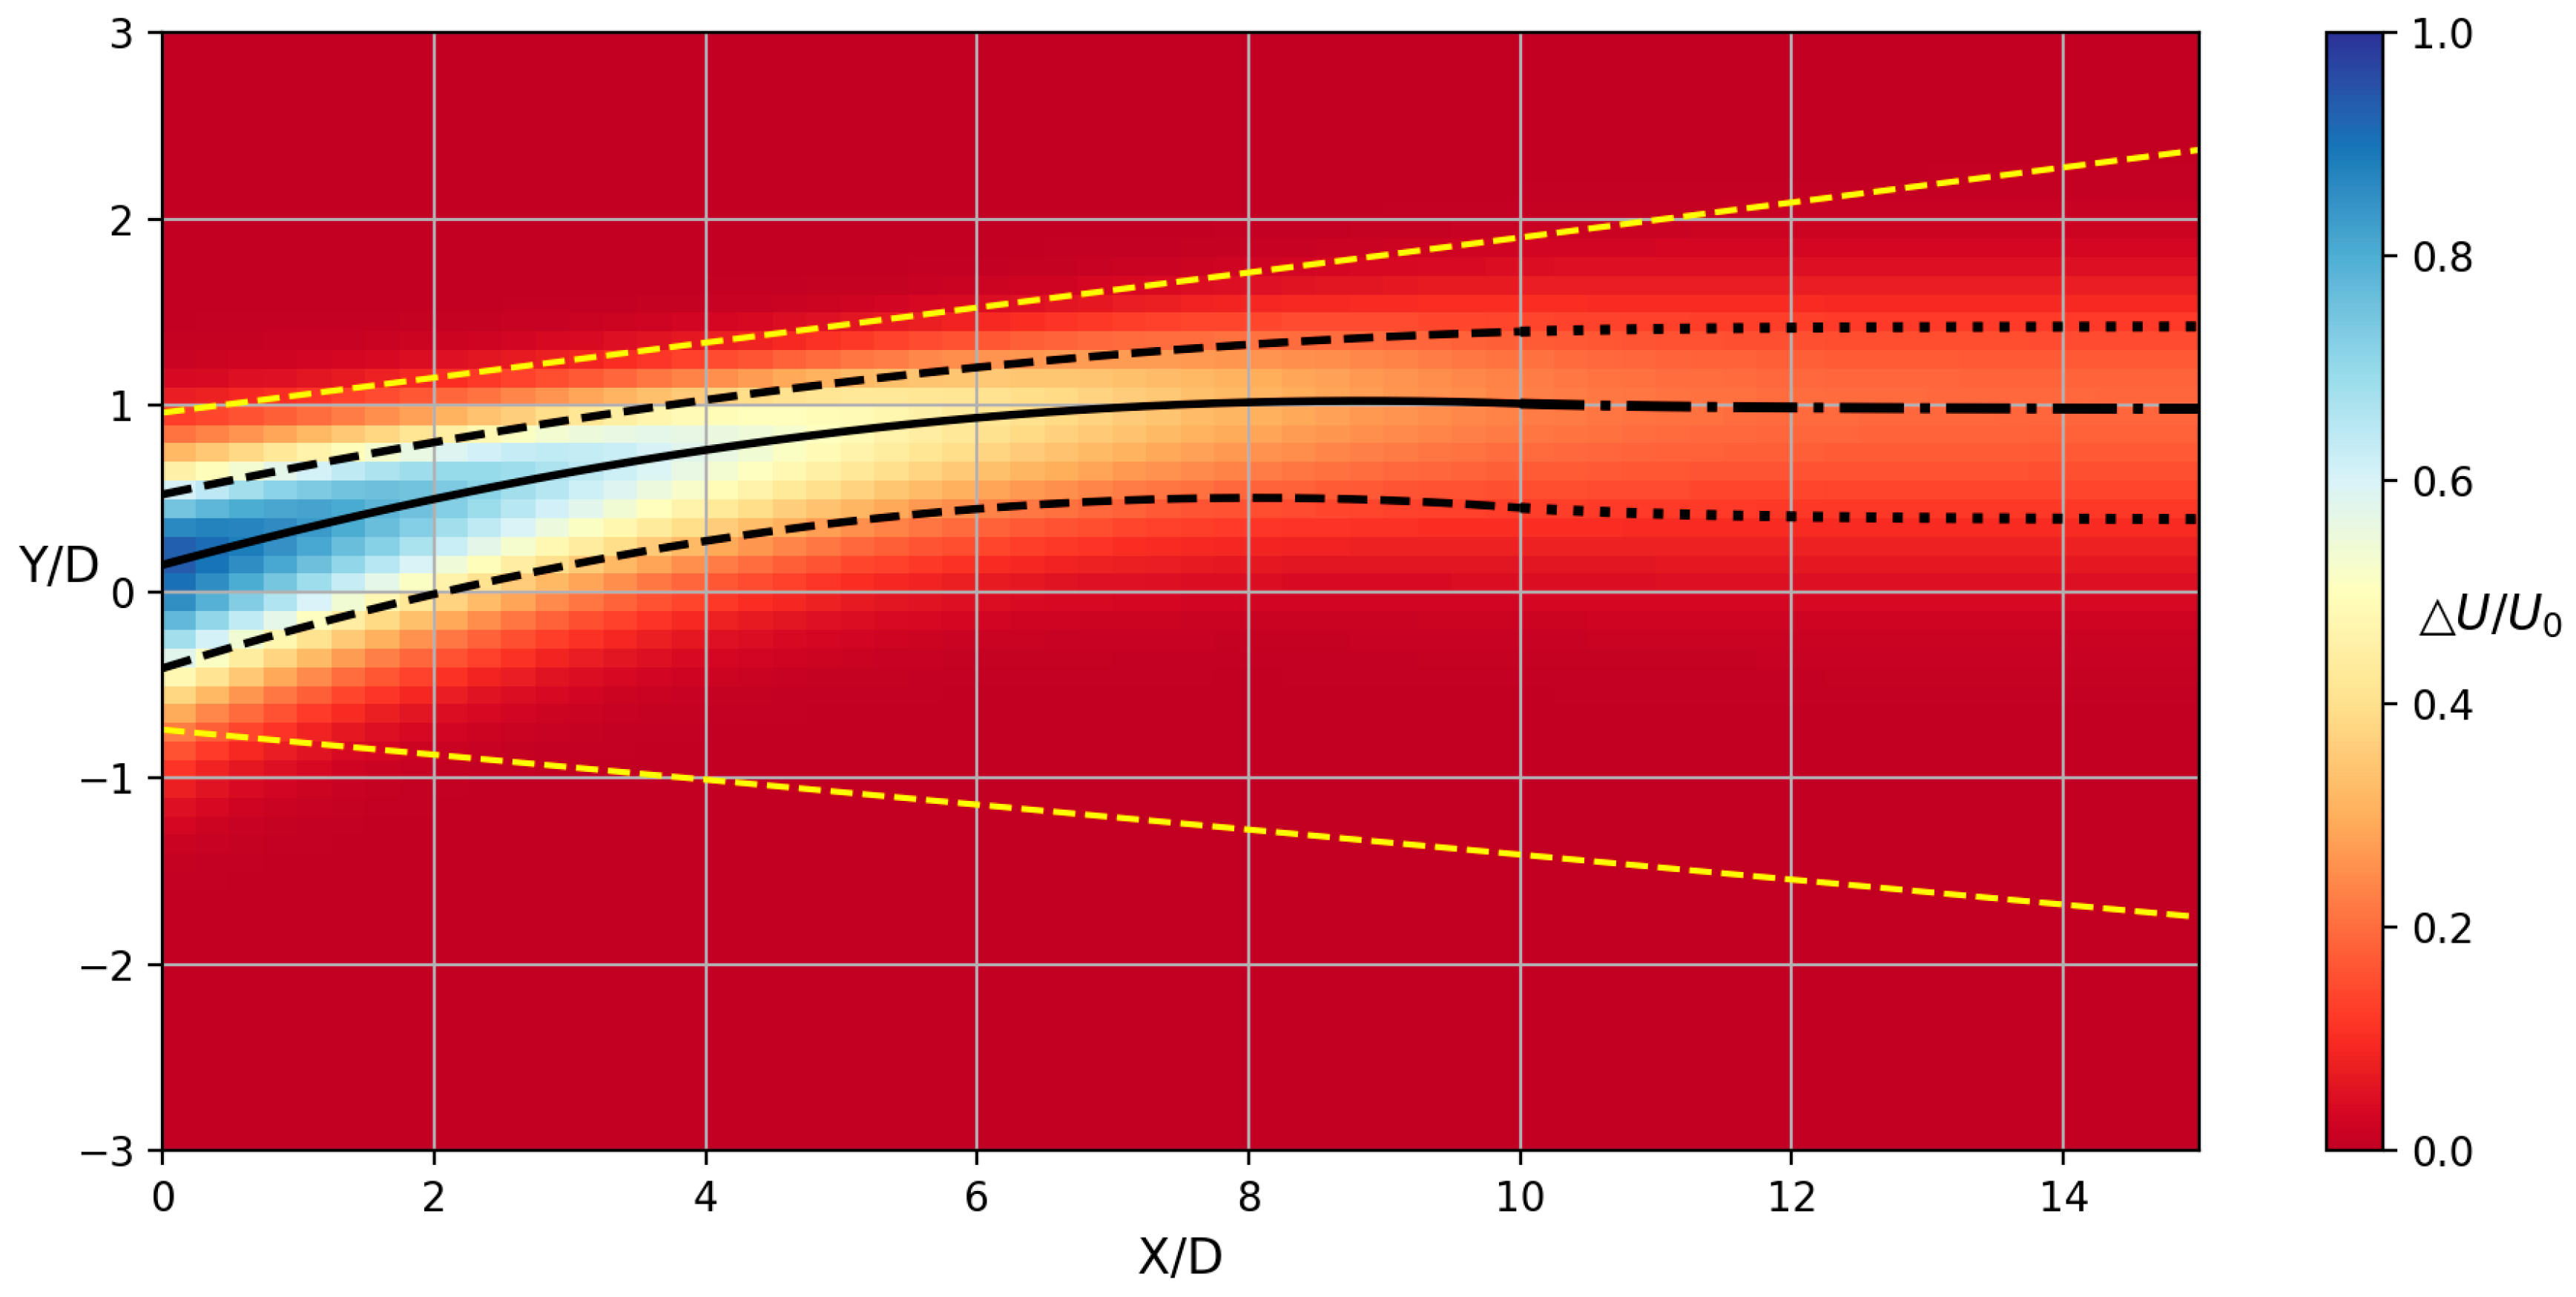
In order to obtain a better view of the flow field, the streamwise velocity contours are reproduced based on the wake model. It is worth mentioning that the velocity profiles of each cross section have been fitted into the proposed model, and the model parameters along the streamwise direction also need to be fitted into some related curves. In this paper, the polynomial function is used to fit the model parameters along the streamwise direction. It should be distinguished that the double semi Gaussian functions are fitted in the lateral direction of the wake, the polynomial function is fitted in the streamwise direction of the wake. Considering that the linear fitting may not be accurate enough for some cases, and the cubic polynomial may be over fitted and causes some non-physical results, the quadratic polynomial is used to fit the model parameters along the streamwise direction within 10D. Moreover, according to the observation of the far field [7,29], the velocity distribution would remain basically unchanged beyond 10D downstream; therefore, in the far field beyond 10D, the slopes of each fitting curve gradually approach zero, so that the curves remain at a nearly constant value in the far field. The corresponding quadratic polynomials are presented in the Appendix B. The reproduced velocity contours of these three cases are shown in Figure 3, Figure 4 and Figure 5.

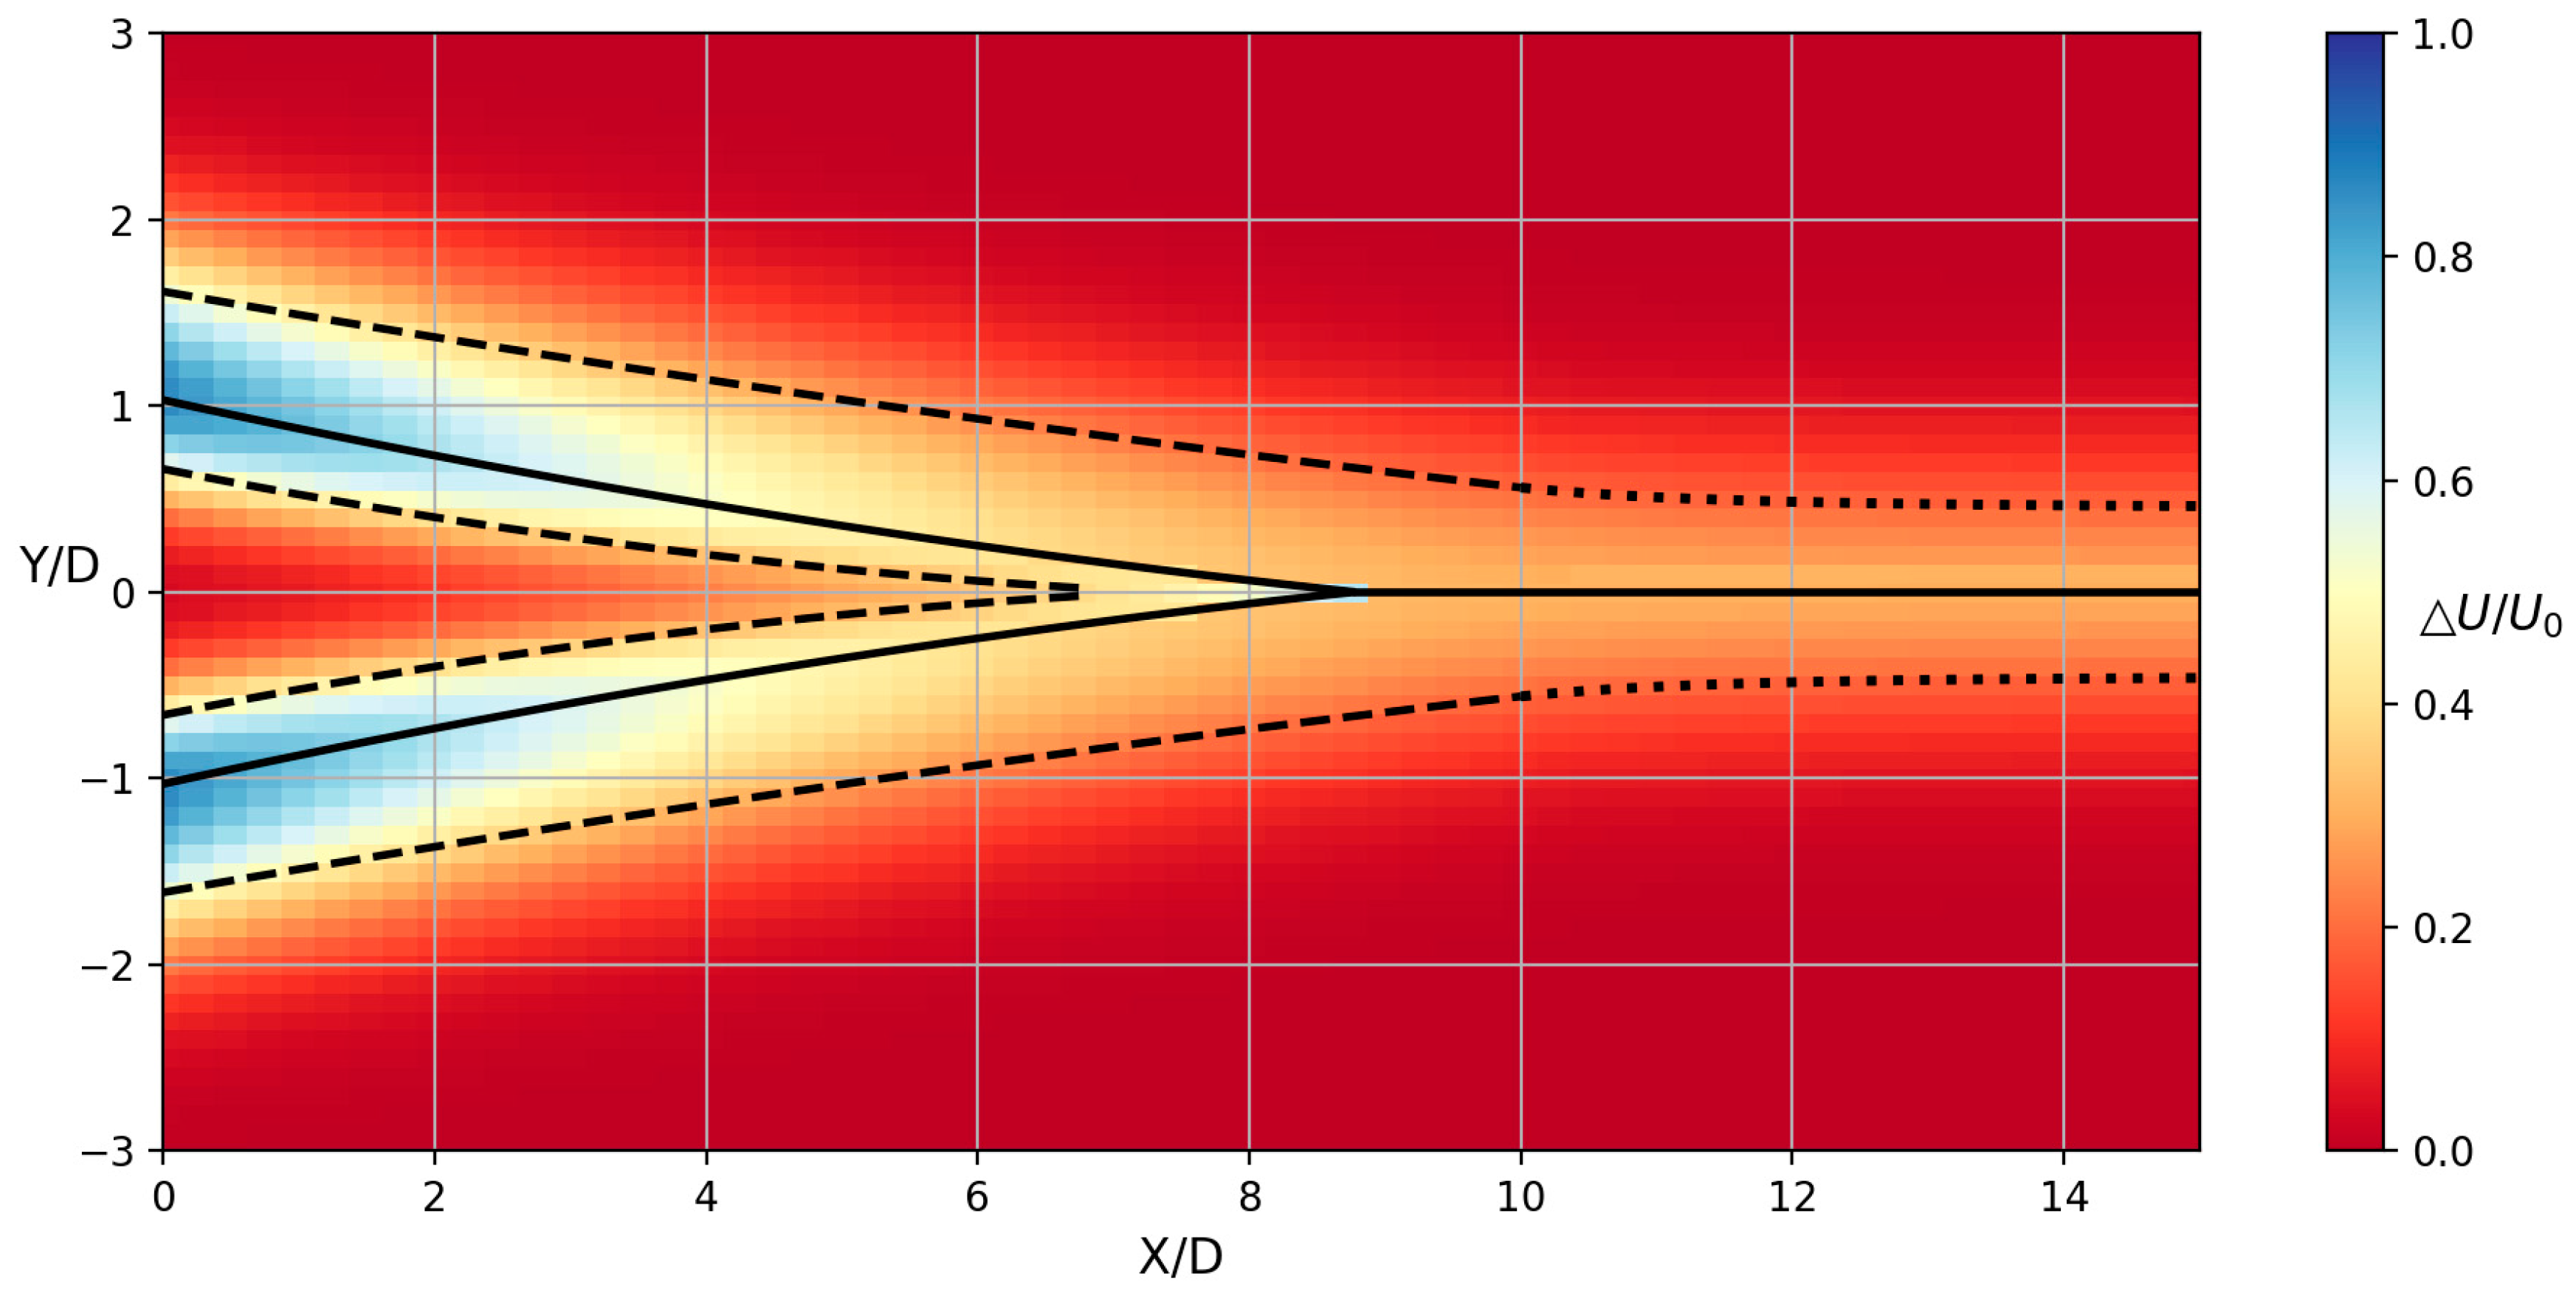
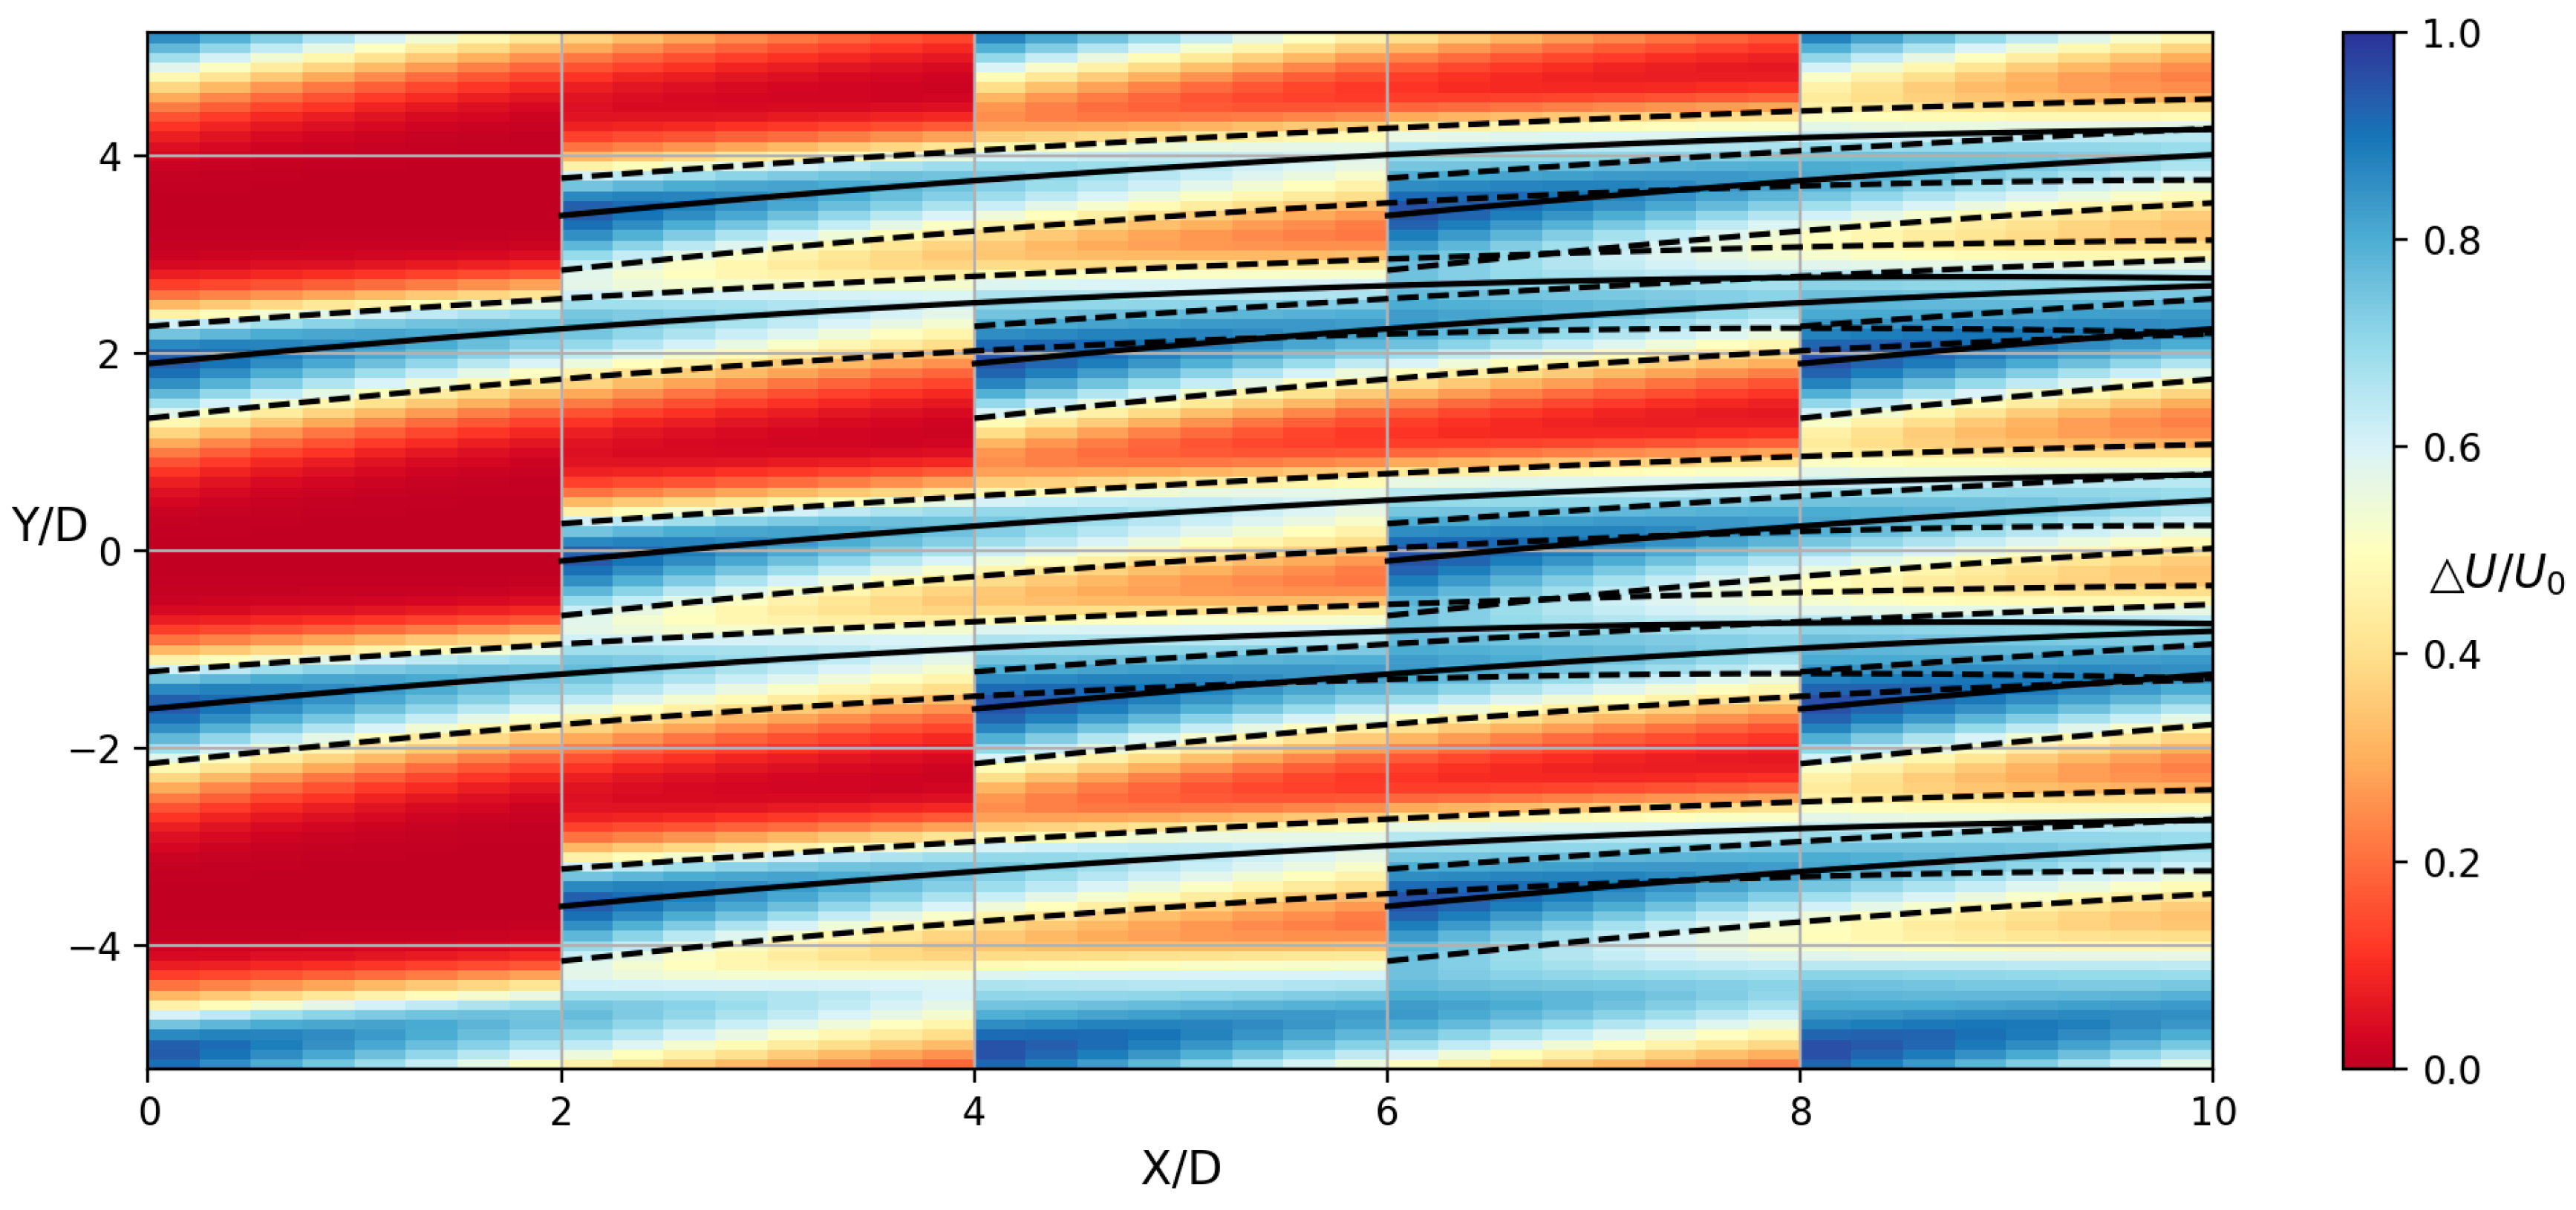
Figure 3.
The velocity contour of Case 1 (Single rotor). The color bar is the velocity deficit, the black solid line represents the position of the maximum velocity deficit, and the two black dashed lines represent the deviations of the two sides. The yellow dashed lines represent the wake edges model [15] under the same experimental condition.
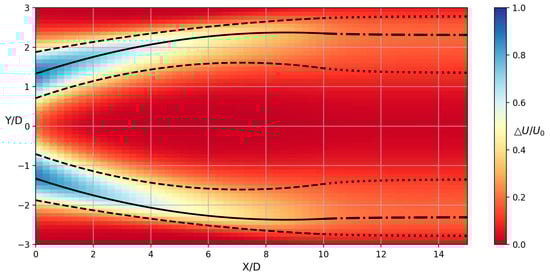
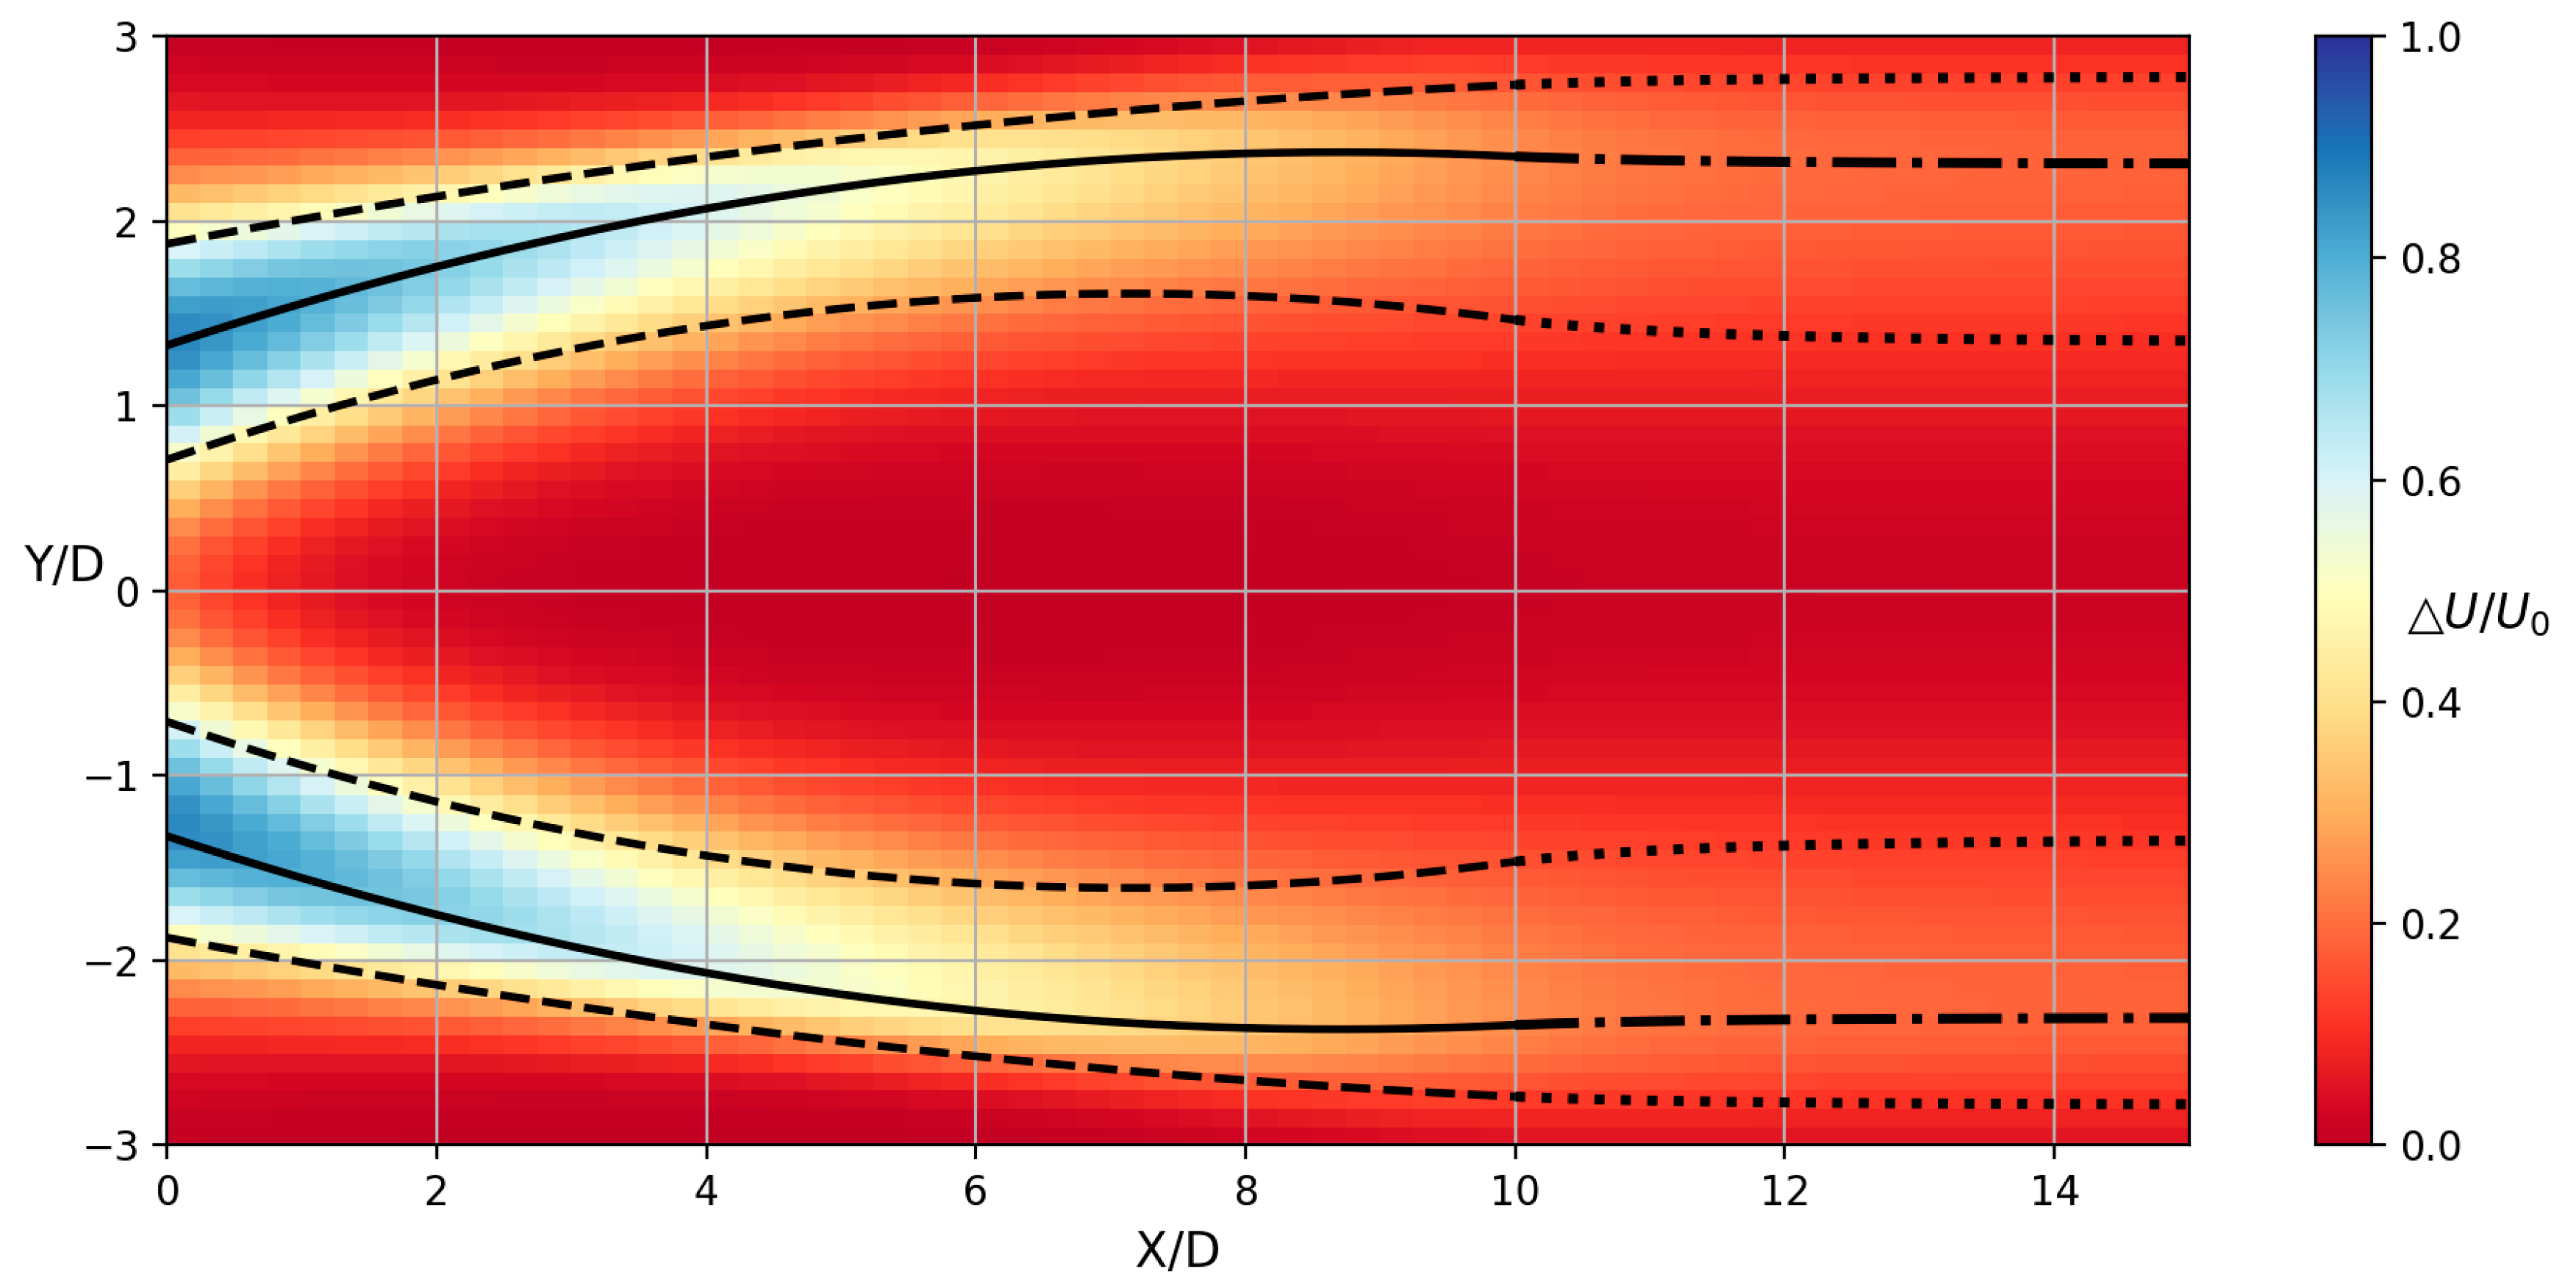
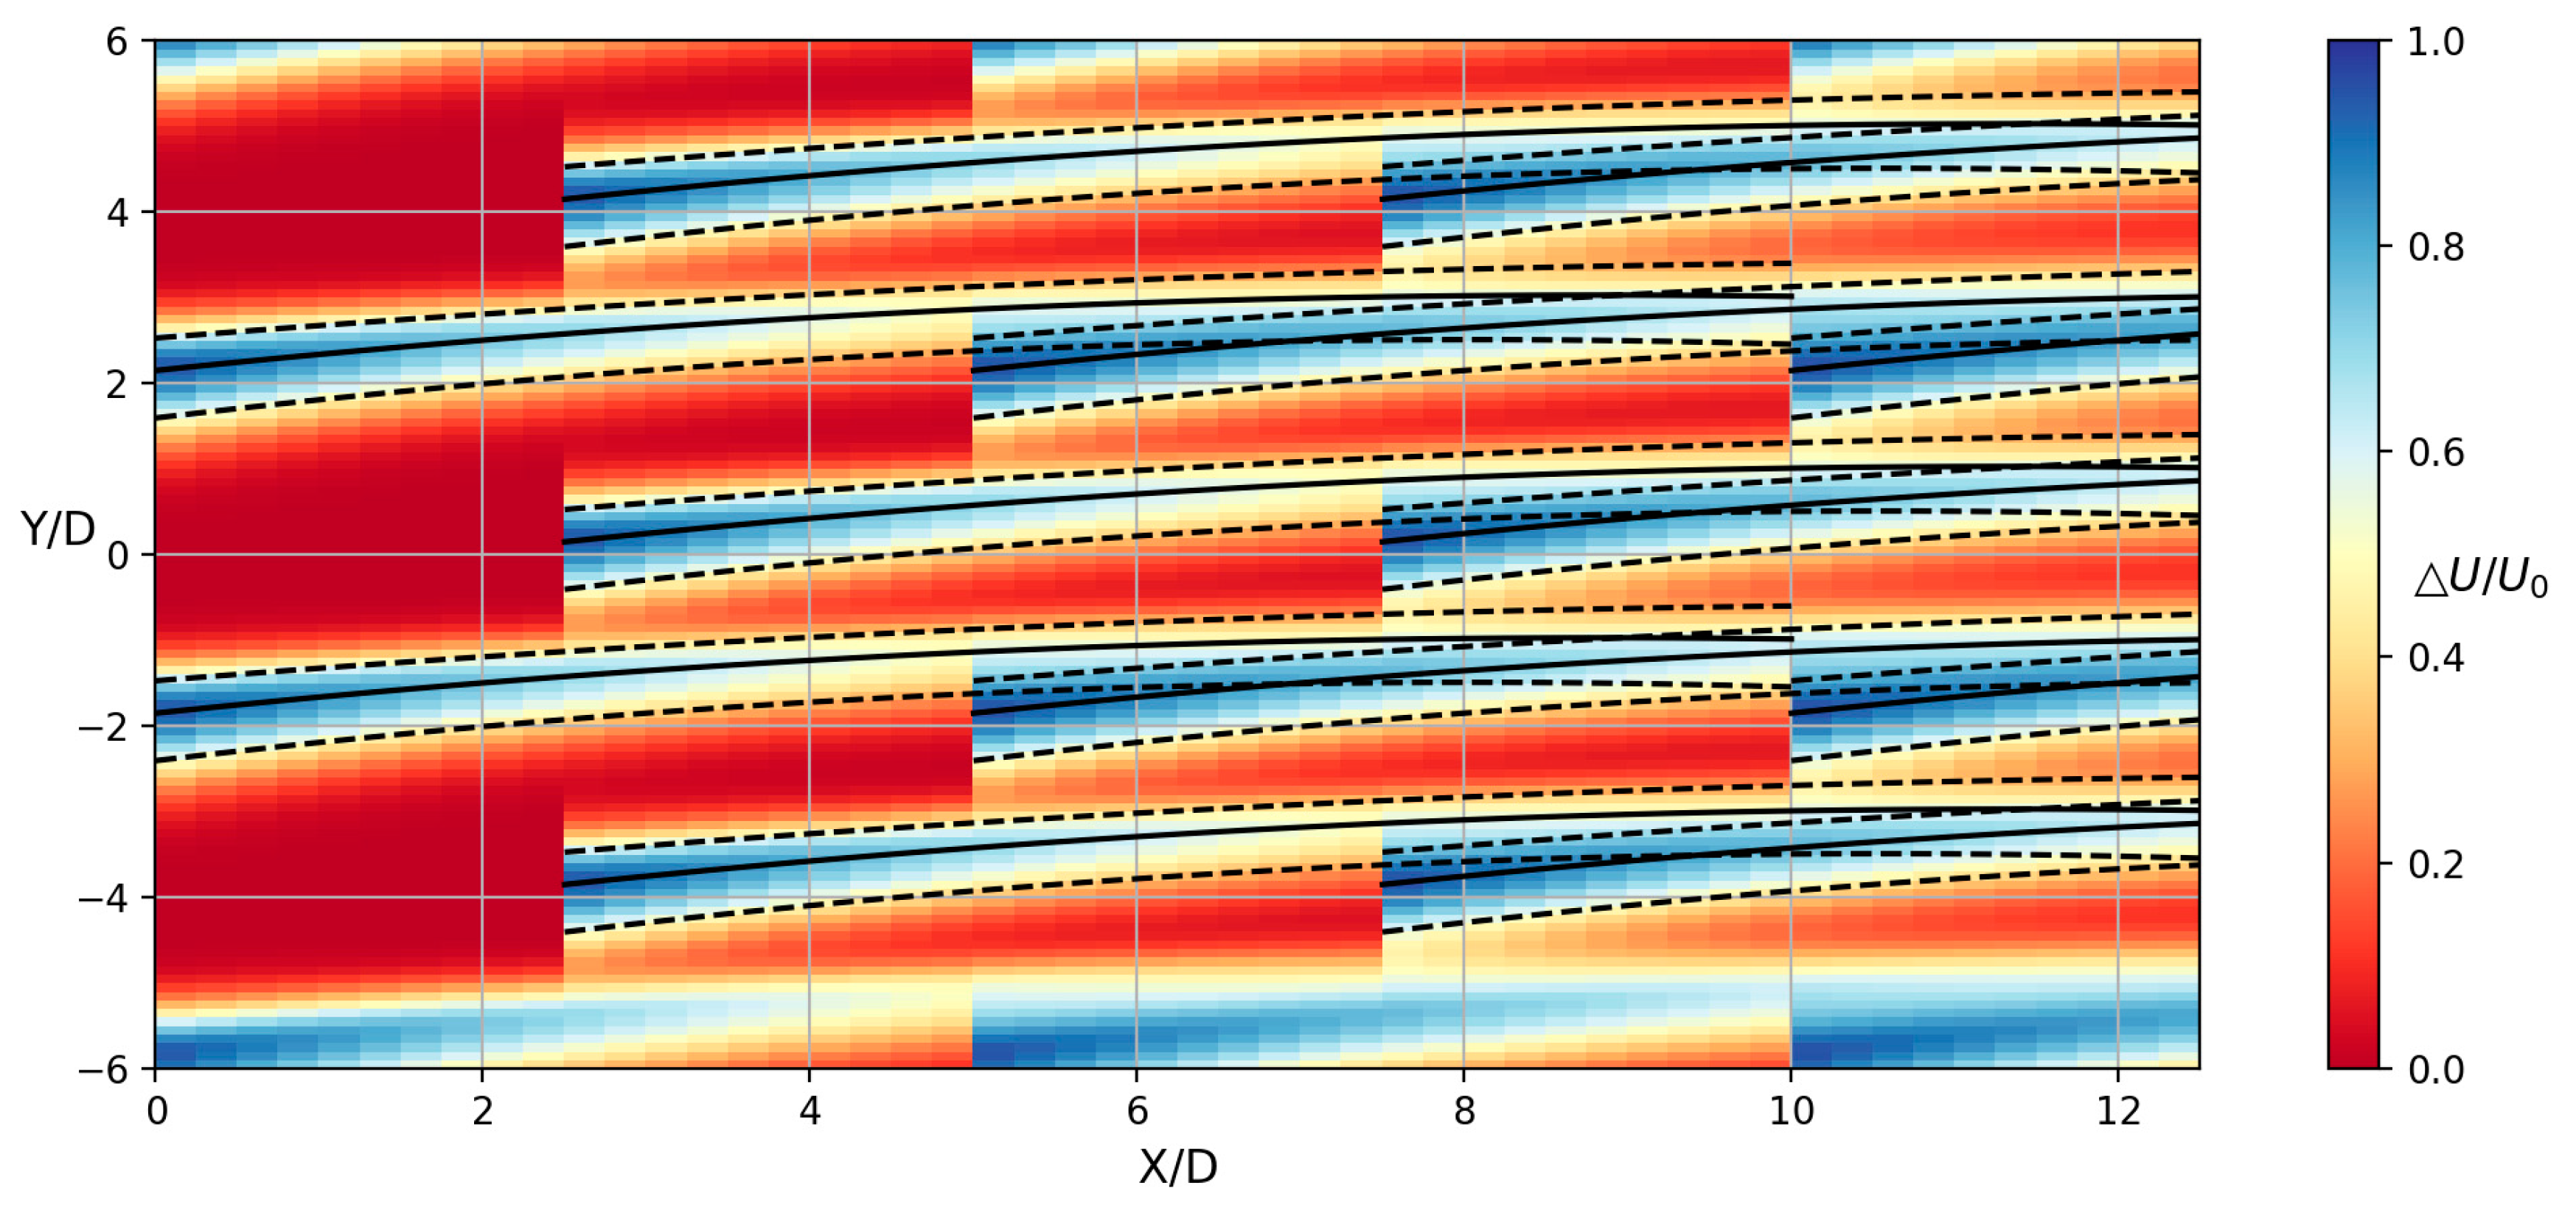
Figure 4.
The velocity contour of Case 2 (Counter-rotating twin turbines (backward)). The color bar is the velocity deficit, the black solid lines represent the position of the maximum velocity deficit, and the black dashed lines represent the deviations of the double semi Gaussian functions.
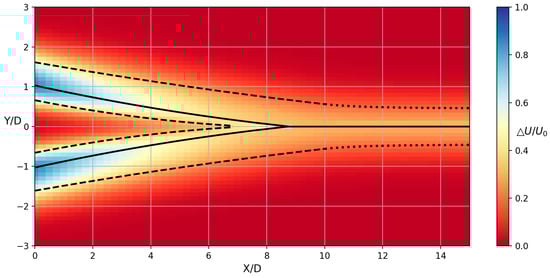
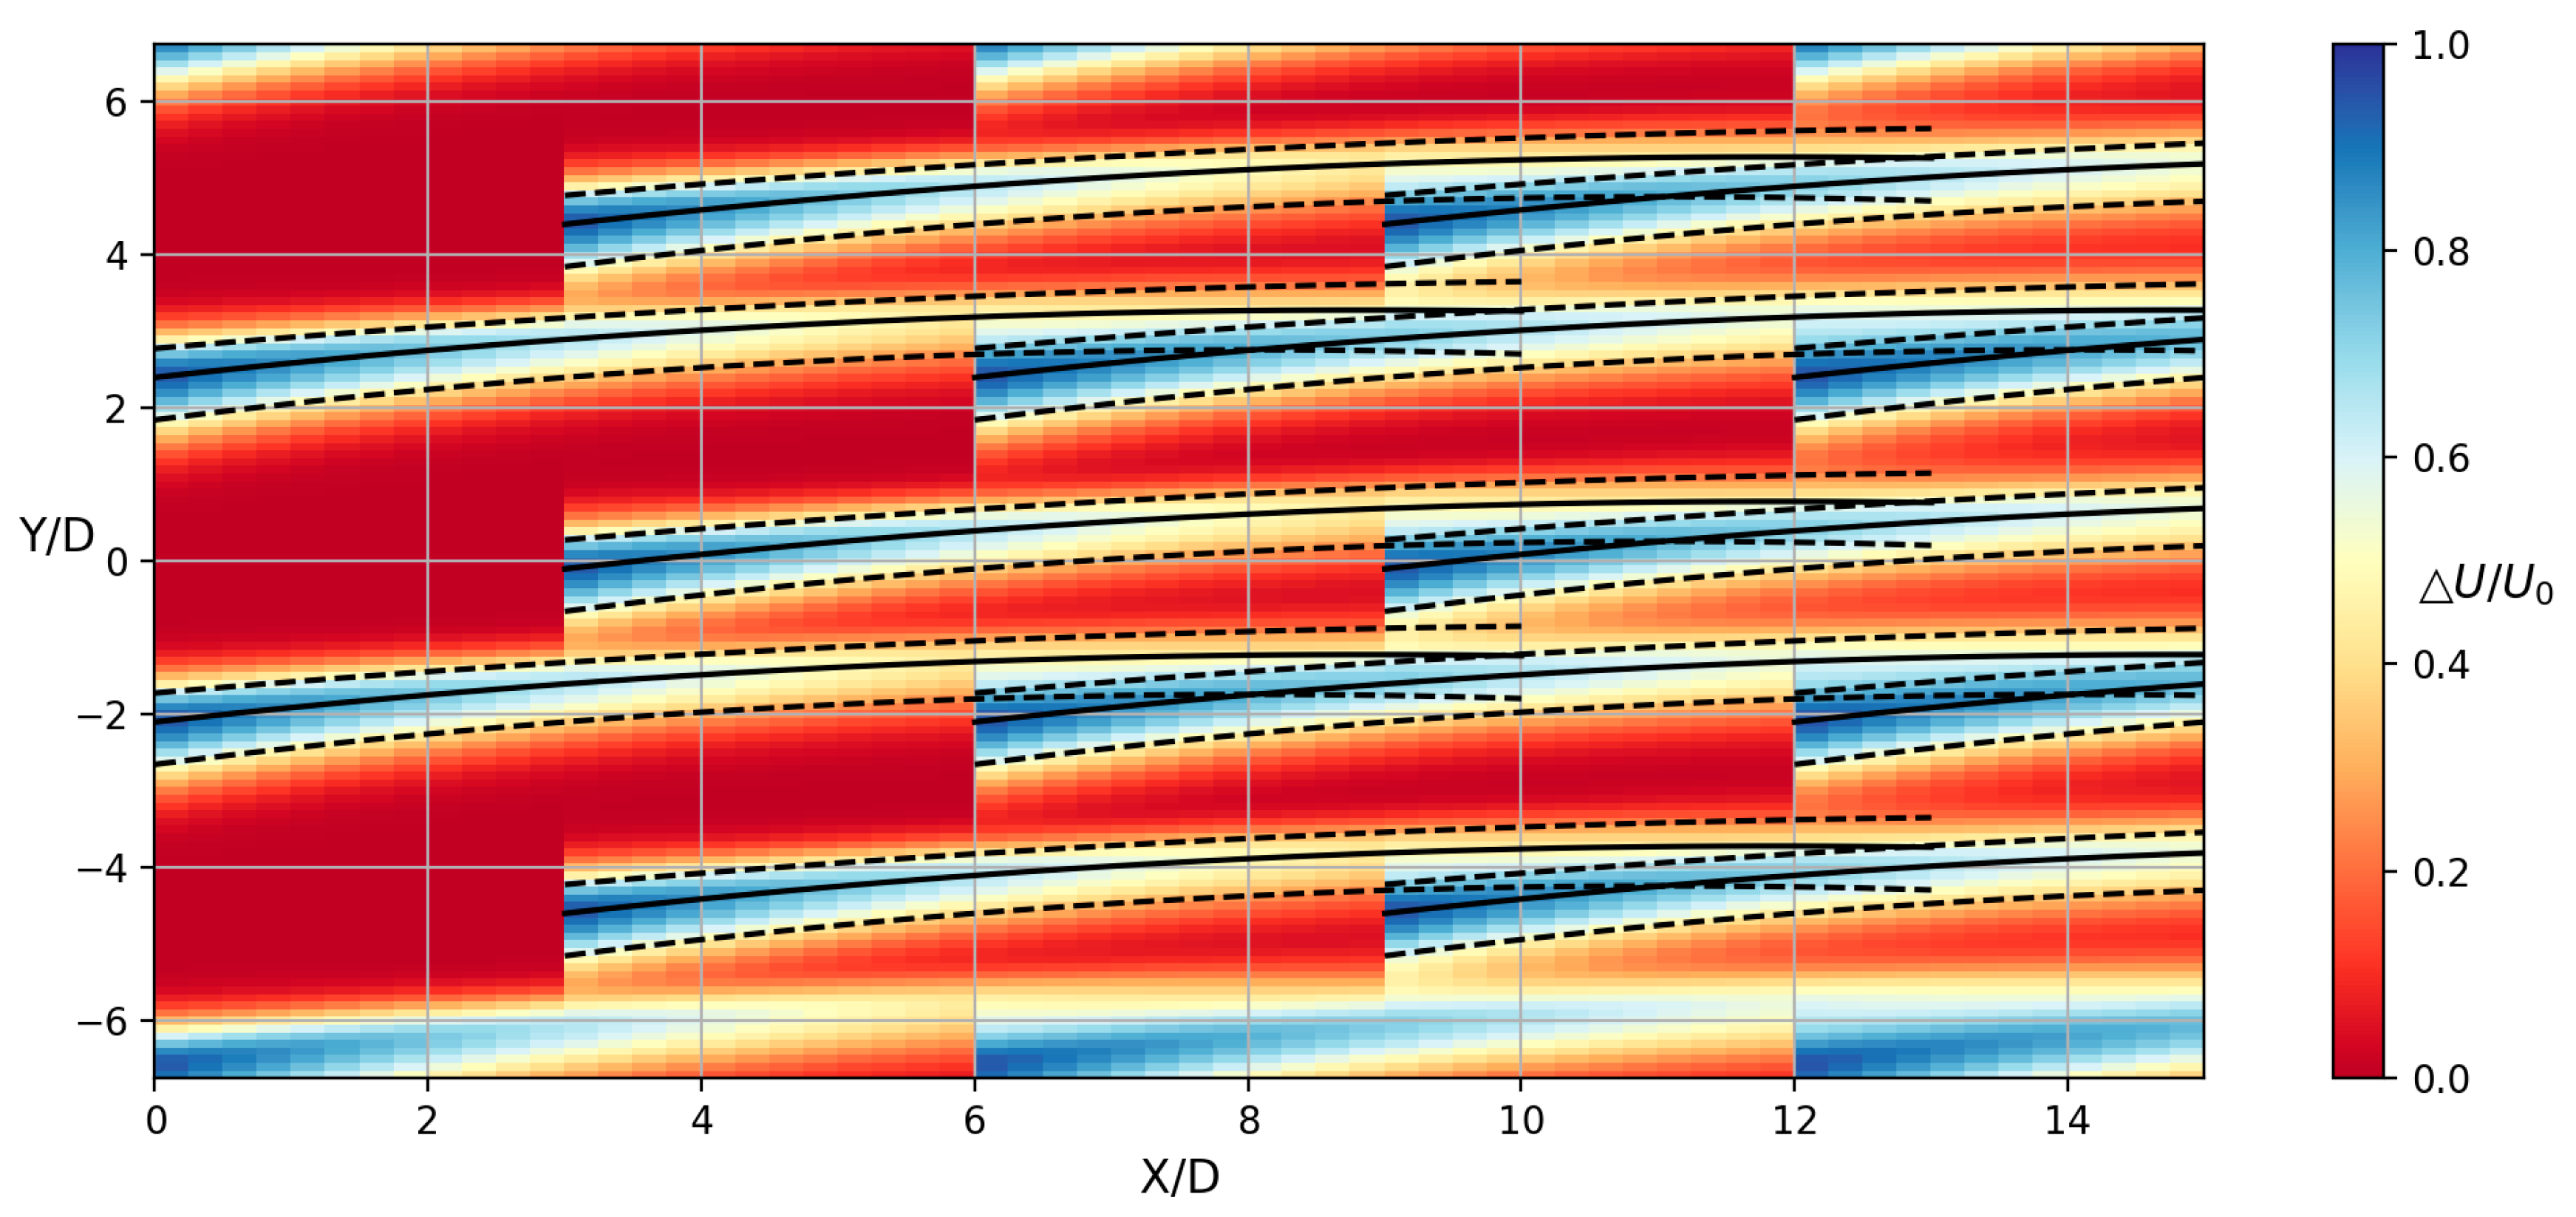
Figure 5.
The velocity contour of Case 3 (Counter-rotating twin turbines (forward)). The color bar is the velocity deficit, the black solid lines represent the position of the maximum velocity deficit, and the black dashed lines represent the deviations of the double semi Gaussian functions.
In Figure 3, there is a wake deflection in the velocity field, and the velocity distribution in the wake region is also asymmetric. The yellow dashed lines in Figure 3 represent the wake edges model, and the corresponding model parameters are provided in the paper [15]. By comparison, it can be found that, in the wake edges model, although the spreading rates of the wake edges are different and asymmetric, this model cannot well reproduce the wake field of a VAWT. At least, the proposed model (double semi Gaussian functions) is more accurate than the wake edges model.
By comparing with the original velocity contours which are presented in the reference [10], it can be found that the reproduced velocity contours in Figure 4 and Figure 5 are highly similar with the experimental results [10]. Although the reproduced velocity fields and fitting curves are not accurate enough within 1D in the near field, the wake simulation in the near field is not the focus, because the downstream rotor is generally not placed so close to the upstream rotor. Small errors within 1D would not affect the array optimization. In addition, it can be seen clearly in Figure 5, there are four deviations (dashed lines) and two center lines (solid lines) in the near field. At about 8D downstream, the center lines of the two wakes merge into one, and the two deviations on the windward side gradually approach zero, the other two deviations on the leeward side are not zero. These two nonzero deviations constitute the deviations of the far field wake on both sides. The behavior of wake merging is reproduced in this way, and it is one of the innovations of the proposed wake model.
4. The Optimal Array Arrangements under Different Criteria
From the work of Section 3, it has been proved that the double semi Gaussian functions can well reproduce the asymmetric VAWT wake, and the accuracy of the wake model is enough for the array design and optimization. In this paper, the array optimization of single turbine (case 1) is carried out.
In the previous studies of array optimization [25,30], optimization algorithms are often used. However, due to the inherent randomness of the optimization algorithm, the optimal arrangement is usually not regular, and it is difficult to analyze the irregular optimal arrangement. The irregular arrangement is not usual in engineering. Therefore, the optimization algorithm is not adopted in this paper; instead, the optimal solution can be found out by comparing the performance of array units in different arrangements. The performance of the array units is calculated one by one under the different distance parameters, and there are many conditions need to be calculated. Nevertheless, the wake model ensures that this process can still be carried out quickly.
In the VAWT array, there is no obvious wake interference in the first three columns of turbines. The wake interference becomes serious and should be considered from the fourth column to the further downstream. In the VAWT array, the velocity field in the downstream is similar to that in the upstream, the performance of upstream turbine is proportional to that of downstream turbine, and the performance of the whole array is proportional to that of the turbines in the fourth and fifth columns. Therefore, the performance of turbines in the fourth and fifth columns are enough to represent the performance of the whole array, and the region containing three rows and five columns of VAWTs is defined as the basic array unit in this paper. The turbines in the fourth and fifth columns are mainly studied, and the optimal arrangement can be found out by comparing the performance of the turbines in fourth and fifth columns. The schematic diagram of the array unit and the zoom-in view are shown in Figure 6.
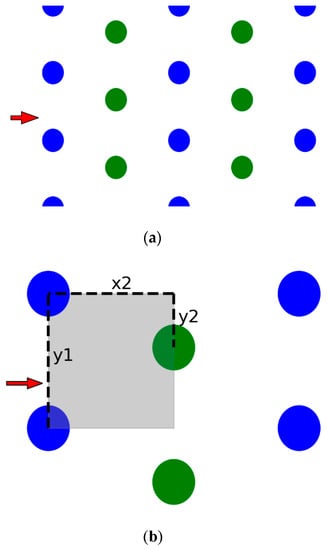
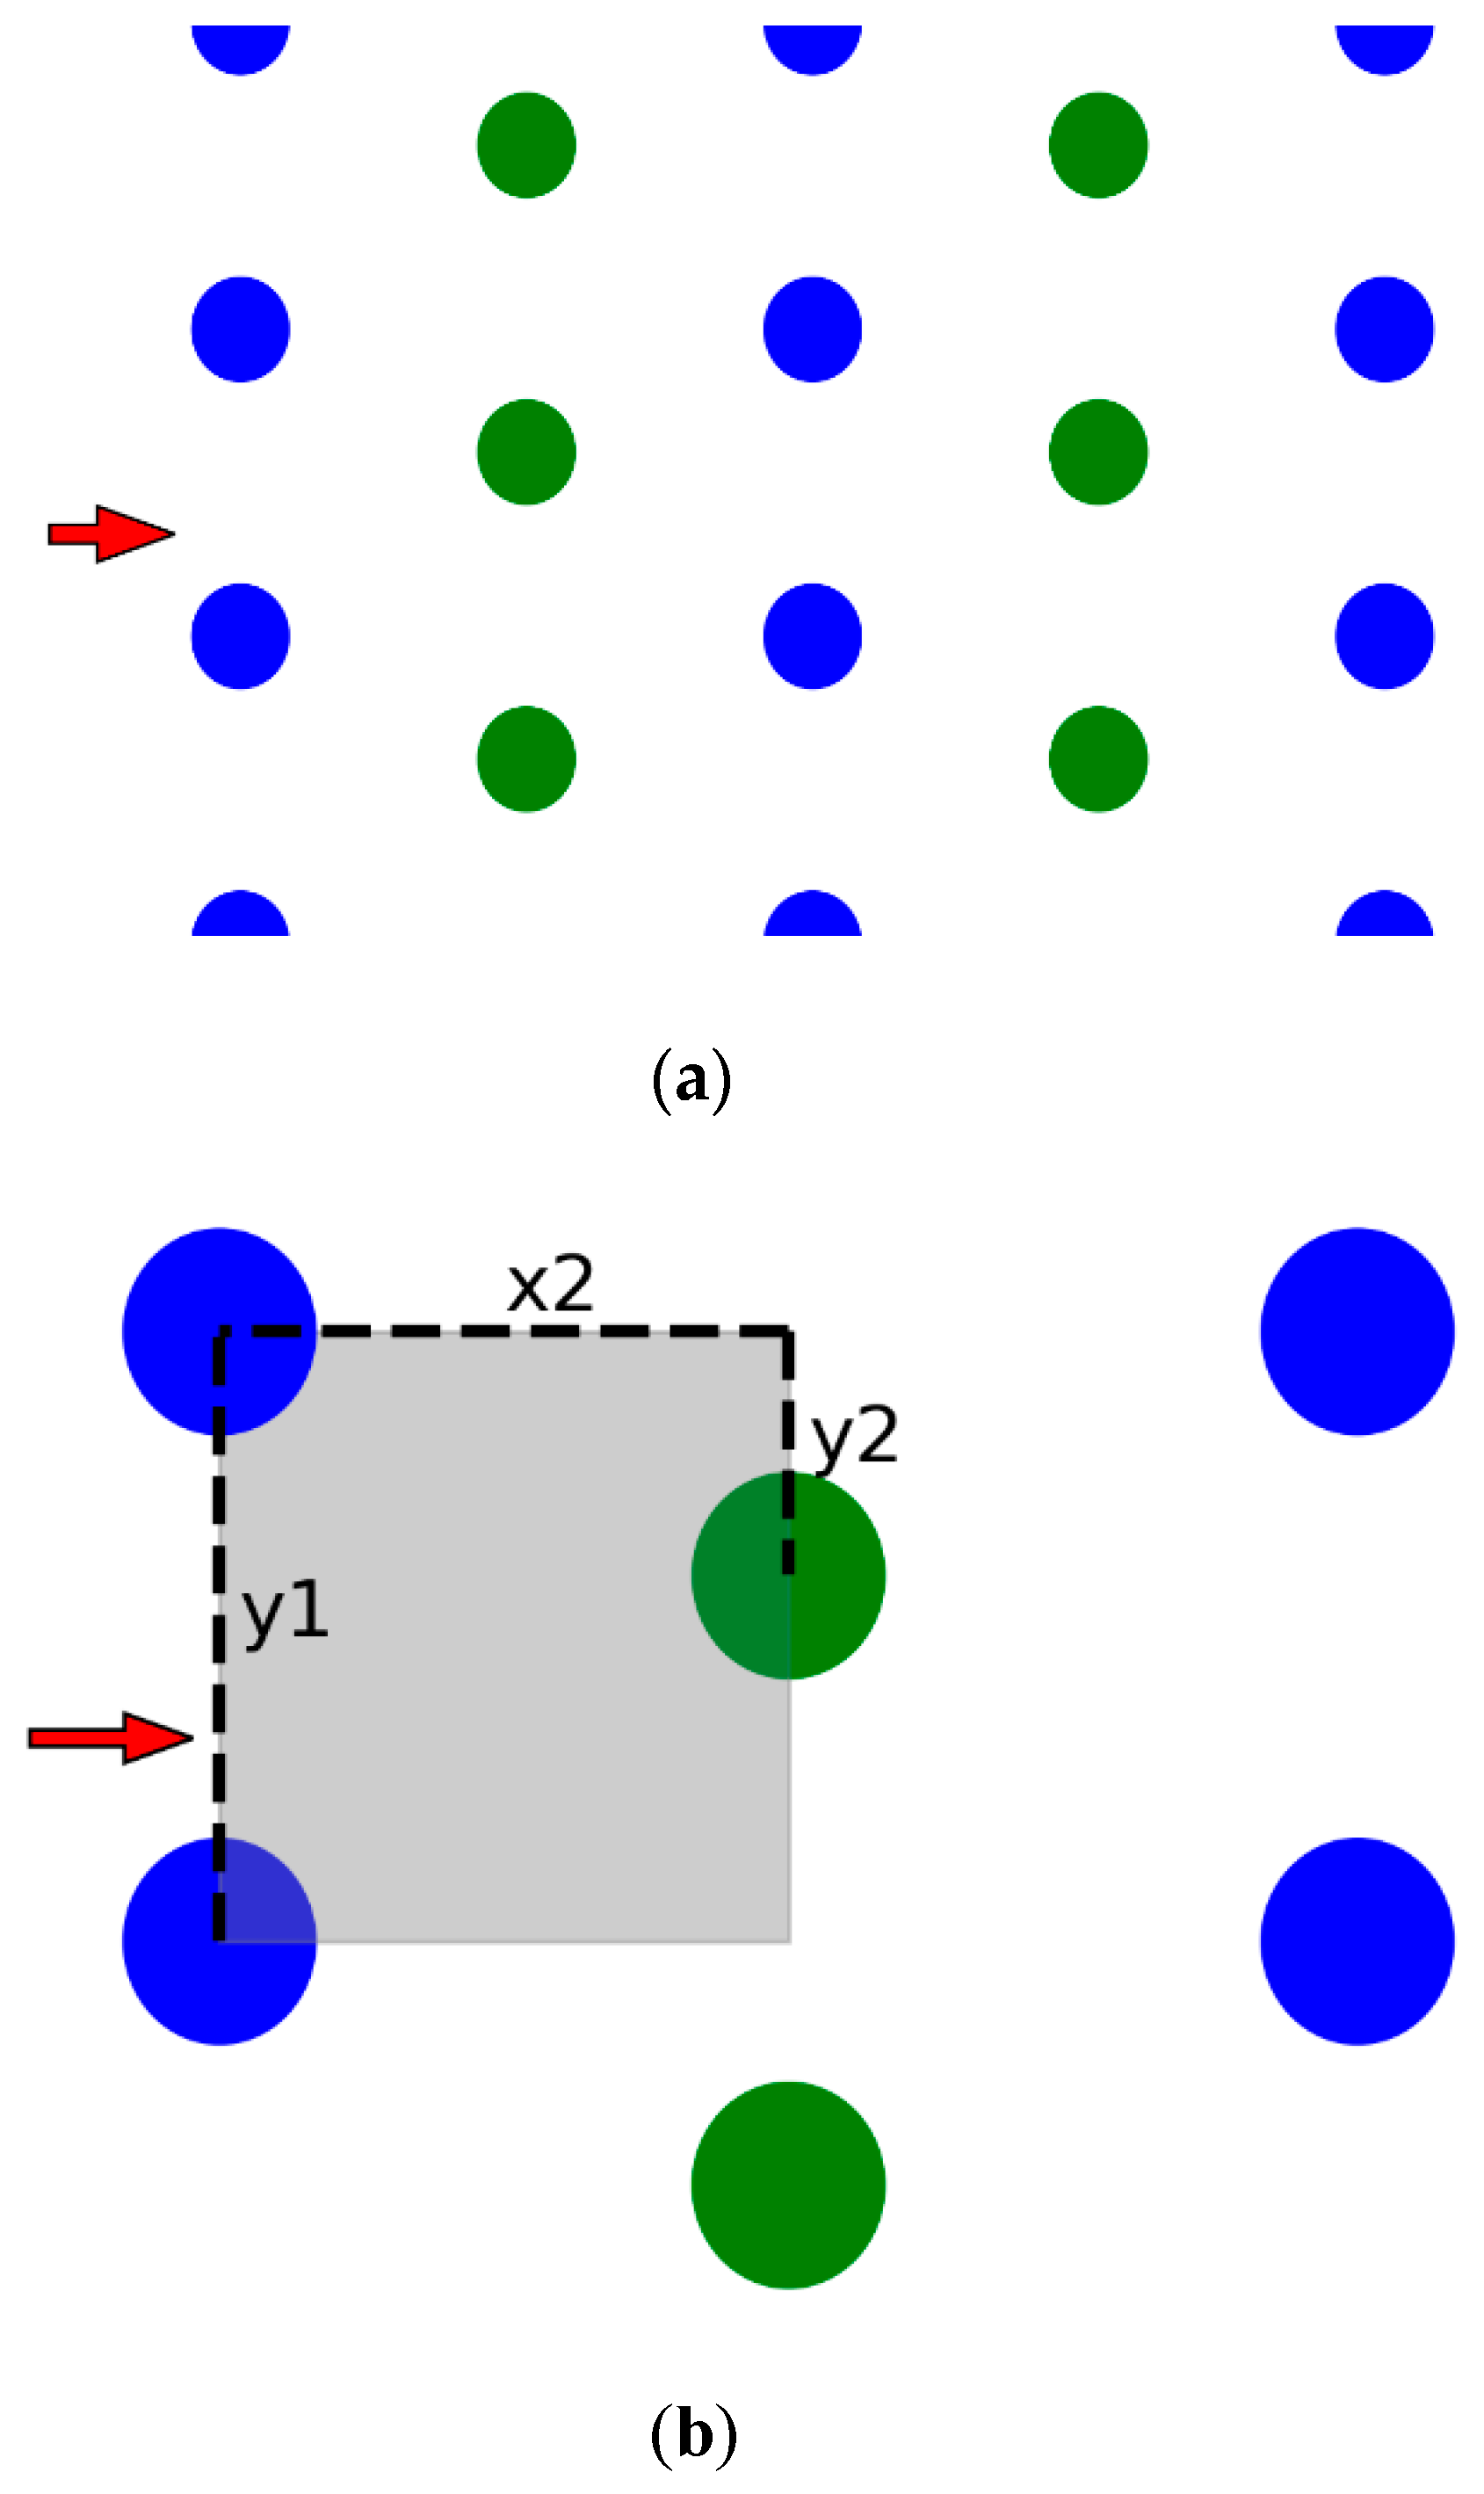
Figure 6.
The picture (a) is schematic diagram of VAWT array unit, the picture (b) is zoom-in view. The red arrow indicates the inflow direction. Odd and even columns are arranged in the staggered arrangement. Blue circles represent the VAWTs in the odd column. Green circles represent the VAWTs in the even column. All VAWTs are rotating anticlockwise. There are three distance parameters (y1, x2, y2) of the array. Symbol y1 represents the lateral distance between two turbines. Symbol x2 represents the streamwise distance between two columns. Symbol y2 represents the staggered distance between two columns, and y2 < y1 is satisfied. The gray region is defined as the unit area, which is y1 × x2.
The performance of wind farms is usually based on the power output. However, the power output is proportional to the cube of the inflow velocity, and the normalized velocity is also representative in the array optimization. When the inflow velocity of turbine is high, more wind energy could be captured by the wind turbine. Therefore, in the preliminary design of the VAWT array, the criterion of the array performance is based on the velocity field. There are two common criteria to measure the performance of the VAWT array [22]. The first criterion is the average inflow velocity () of the downstream turbine. Another criterion is the array power density (), which is the total array power output over array area [22].
In this paper, the average inflow velocity is calculated according to the following process: The inflow velocity of each turbine is the velocity integral on the projected length (diameter D), then sum the inflow velocities of the turbines in the fourth and fifth columns, and divide it by the number of turbines, the result obtained can be regarded as the average inflow velocity, as shown in Equation (1). The array power density is calculated according to the following process: As shown in Figure 6, the unit area is defined as y1 × x2. The inflow velocities of the two turbines are summed—one is in the fourth column and the other is in the fifth column—and then divided by the unit area (y1 × x2). The result obtained can be regarded as the array power density, as shown in Equation (2).
It is worth mentioning that both of these two criteria are single objective functions. The formulas are based on expert judgment rather than rigorous mathematical derivation. Additionally, the calculation process of these two criteria is not exactly the same in different papers. For example, the power density may be calculated by the cube of velocity, while the power density may be calculated by dividing the area of the whole array. These differences in the calculation process could change the absolute value of the criterion. However, optimization mainly focuses on the relative value, not the absolute value. The overall relativity would not be significantly affected by these details, and the final optimal solutions are still representative.
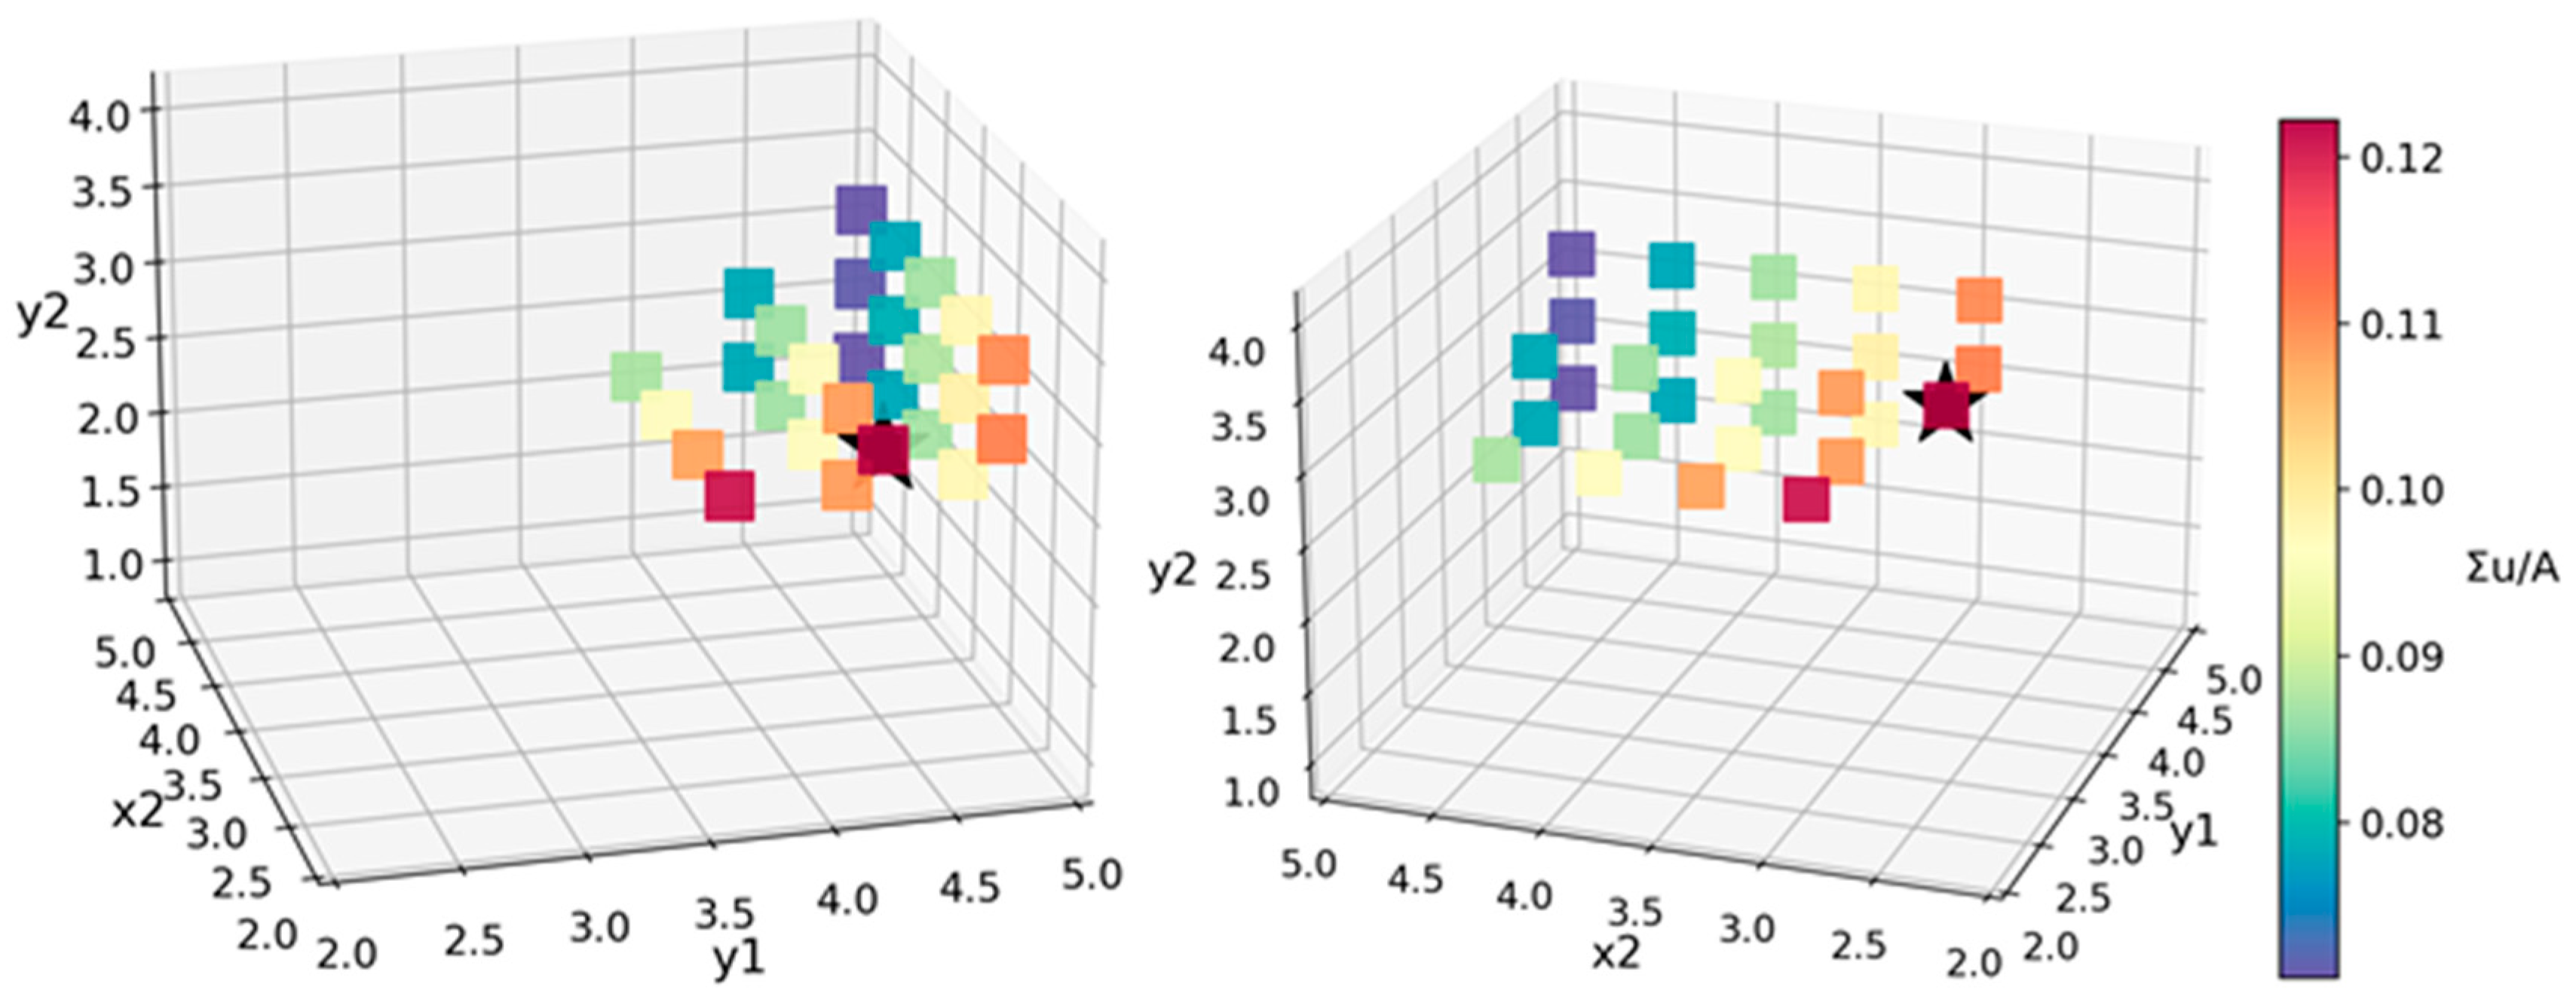
There are three distance parameters (y1, x2, y2) in the array configuration. By changing the distance parameters, the goal function of the corresponding array configuration is calculated. When all the array configurations have been calculated, the goal function of each configuration would be compared one by one, and the maximum of the goal function indicates that the corresponding array configuration is the optimal. The variables y1 and x2 change from 2 to 5 with an interval of 0.5, the variable y2 changes from 0 to y1 with an interval of 0.5. The three distance parameters (y1, x2, y2) are dimensionless by the rotor diameter D. The wake velocity is dimensionless by the inlet velocity U0. The average inflow velocity under different distance parameters is shown in Figure 7.
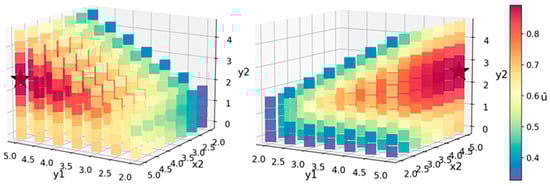
Figure 7.
The three-dimensional scatter diagram of average inflow velocity. The left and right pictures are two different side views of the scatter. The three axes are the three distance parameters (y1, x2, y2). The color bar represents the average inflow velocity. The black star represents the maximum average inflow velocity (its coordinates are y1 = 5, x2 = 5, y2 = 2.5).
As shown in Figure 7, it can be found that, when y1 = 5, x2 = 5, y2 = 2.5, the average inflow velocity is the maximum. The corresponding velocity contour under this distance parameters is shown in Figure 8. In Figure 8, the lateral distance (y1) and streamwise distance (y2) are quite big, there is no obvious wake interference in the downstream. In order to analyze the characteristic of average inflow velocity more clearly, the three-dimensional scatter diagram (Figure 7) is redrawn into several pieces of heat maps, which are shown in Figure 9.
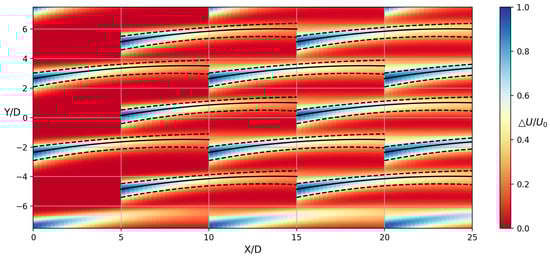
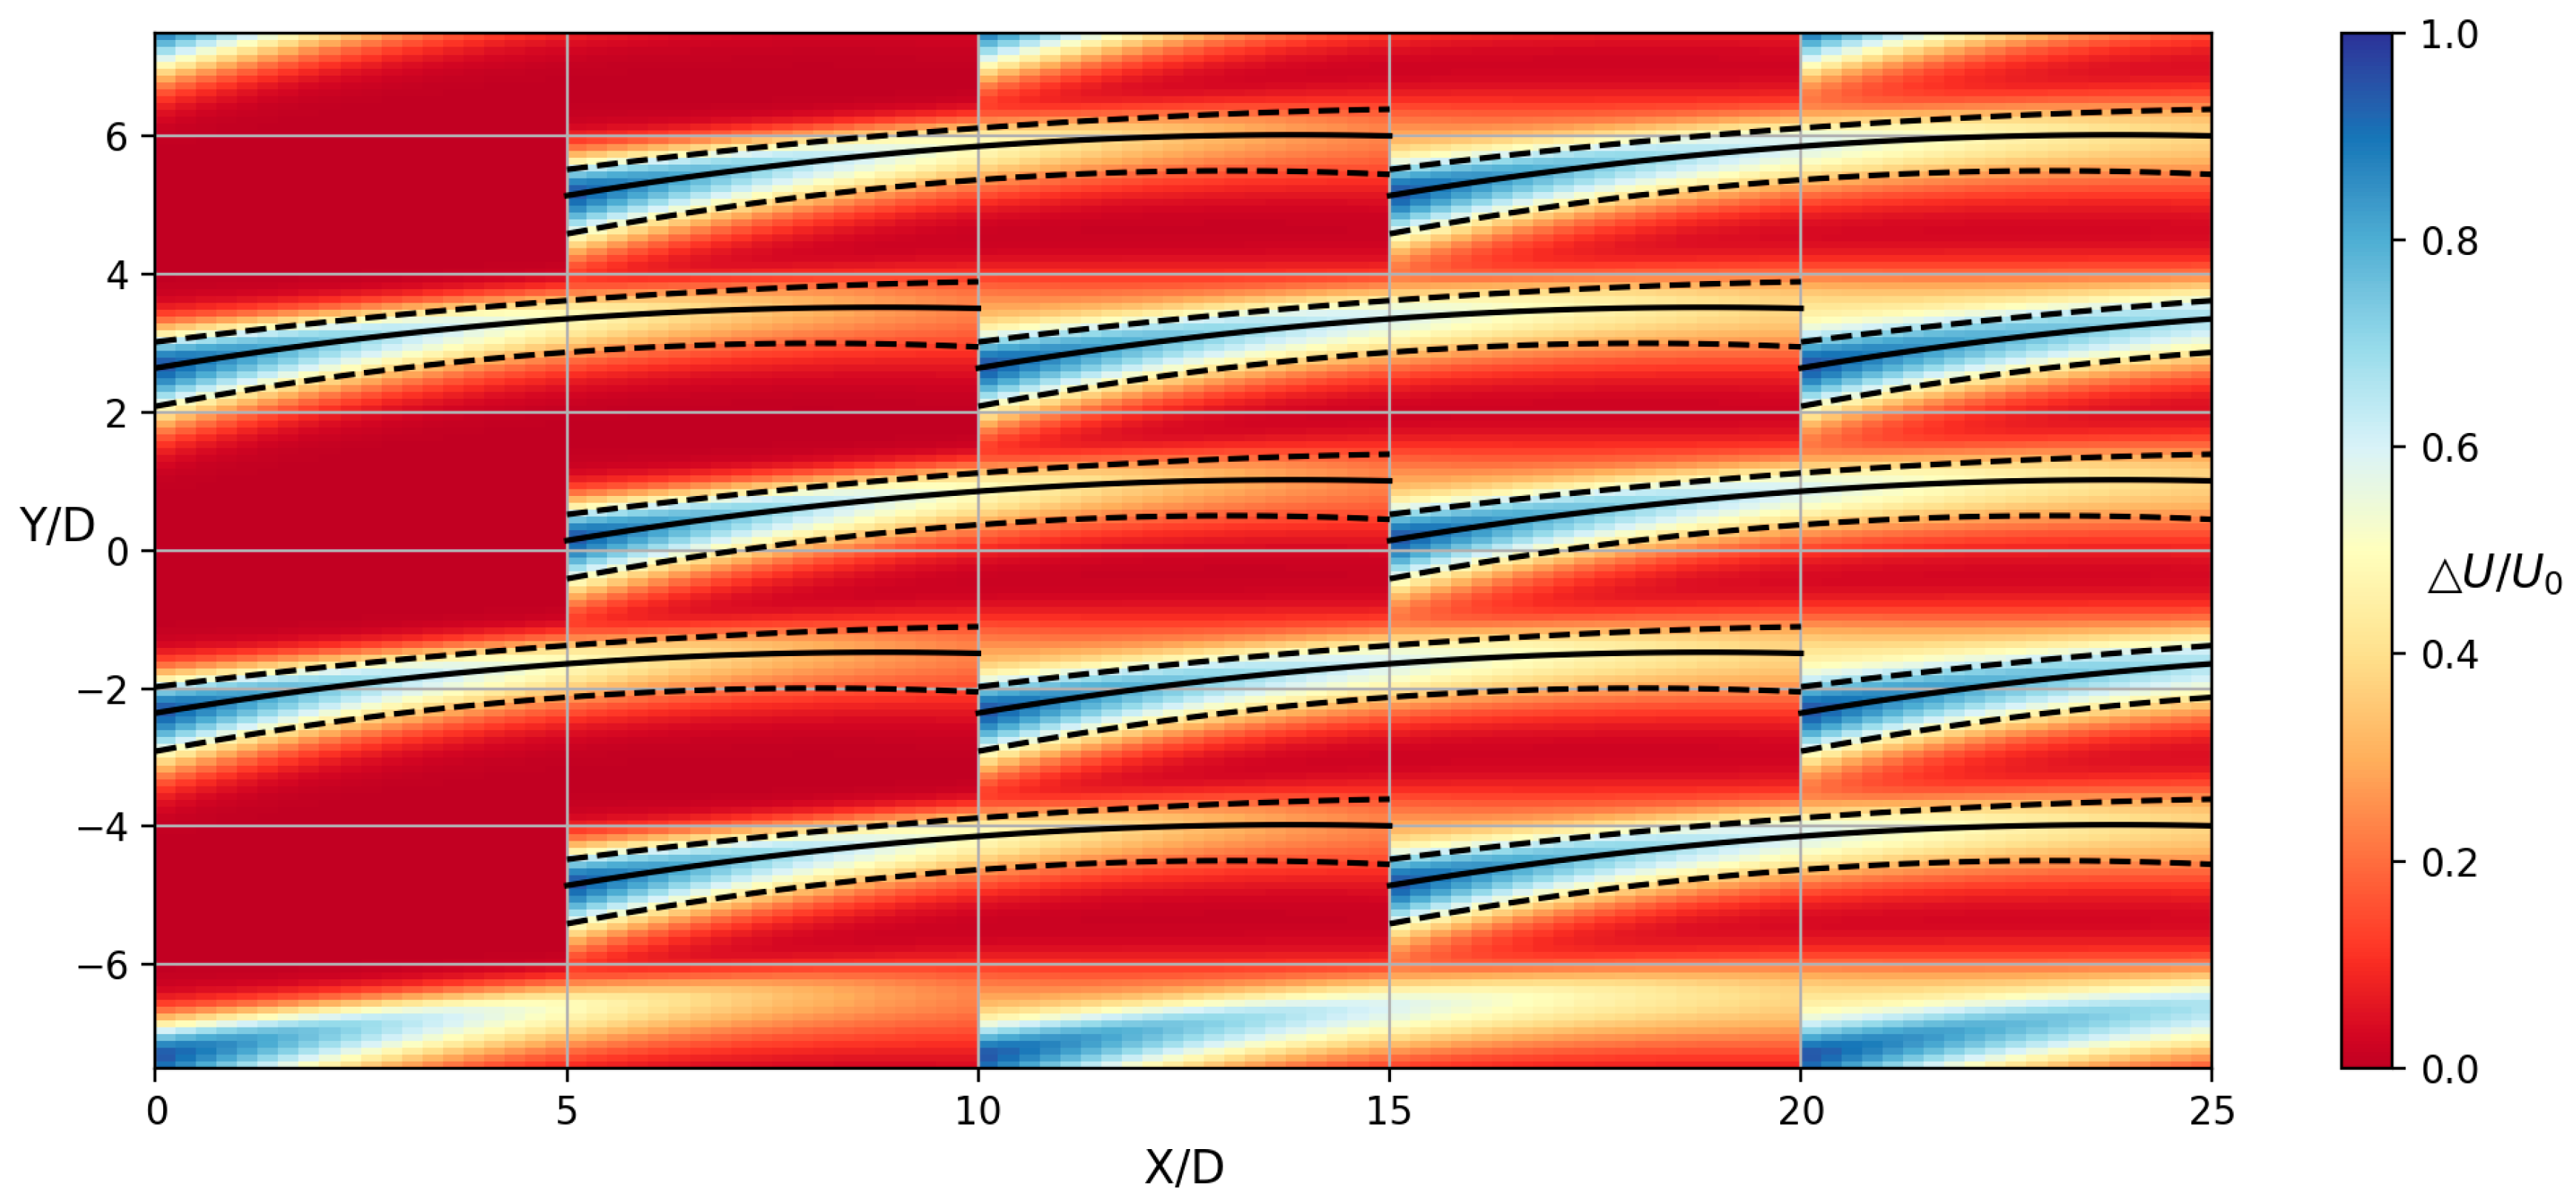
Figure 8.
The velocity contour of the array, which is the optimal arrangement under the criterion of average inflow velocity. y1 = 5, x2 = 5, y2 = 2.5. The color bar is the velocity deficit, the black solid lines represent the position of the maximum velocity deficit, and the black dashed lines represent the deviations of the double semi Gaussian functions.
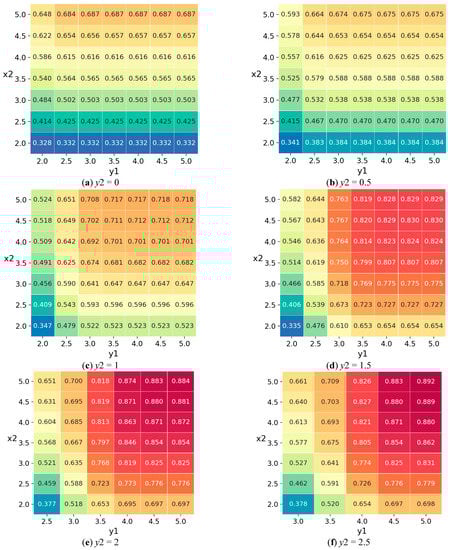
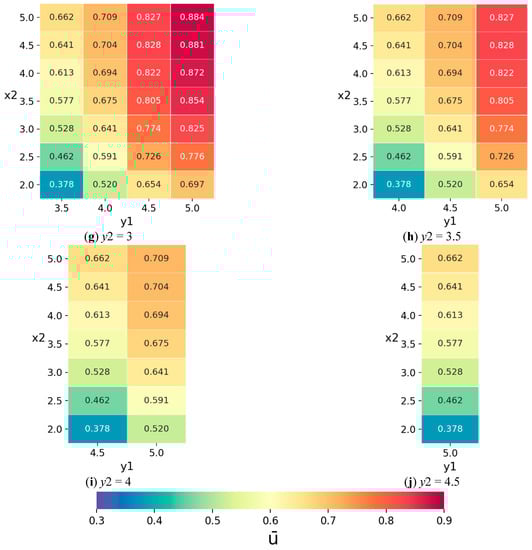
Figure 9.
The heat maps of average inflow velocity. Each map corresponds to a fixed y2. The color and the number inside represent the value of the average inflow velocity.
It is clear from Figure 9, no matter how big y2 is, that the average inflow velocity will increase with the increase in y1 and x2. This is because the larger the distance, the smaller the wake interference. When y2 is small (y2 < 1), x2 has a more obvious effect on the average inflow velocity than y1. However, when y2 is big enough (y2 > 2), y1 has a more obvious effect on the average inflow velocity than x2. Moreover, when y2 is more than 1.5, the average inflow velocity of these corresponding staggered arrangements is generally high. However, when the increasing y2 is close to y1 (for example y2 = 4.5, y1 = 5), the array is near the aligned arrangement, and the average inflow velocity becomes smaller again. It also proves that staggered arrangement (0 < y2 < y1) can achieve better performance than the aligned arrangement.
According to the criterion of average inflow velocity, in order to maximize the inflow velocity and the performance of VAWT array, the lateral distance (y1) and streamwise distance (x2) should be as large as possible. However, in real engineering practice, the land use of wind farms is usually limited, and the distances between turbines are also constrained [3]. The criterion of average inflow velocity is not applicable under the constraint of land use. However, there is another criterion that can be used under the constraint of land use, which is the array power density, which takes into account the area of the array. It can be used to measure the array performance per unit area. The array power density under different distance parameters is shown in Figure 10.
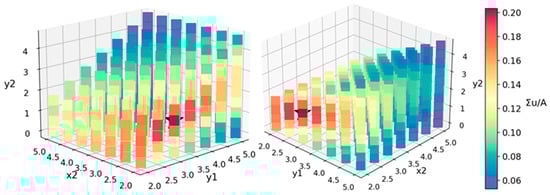
Figure 10.
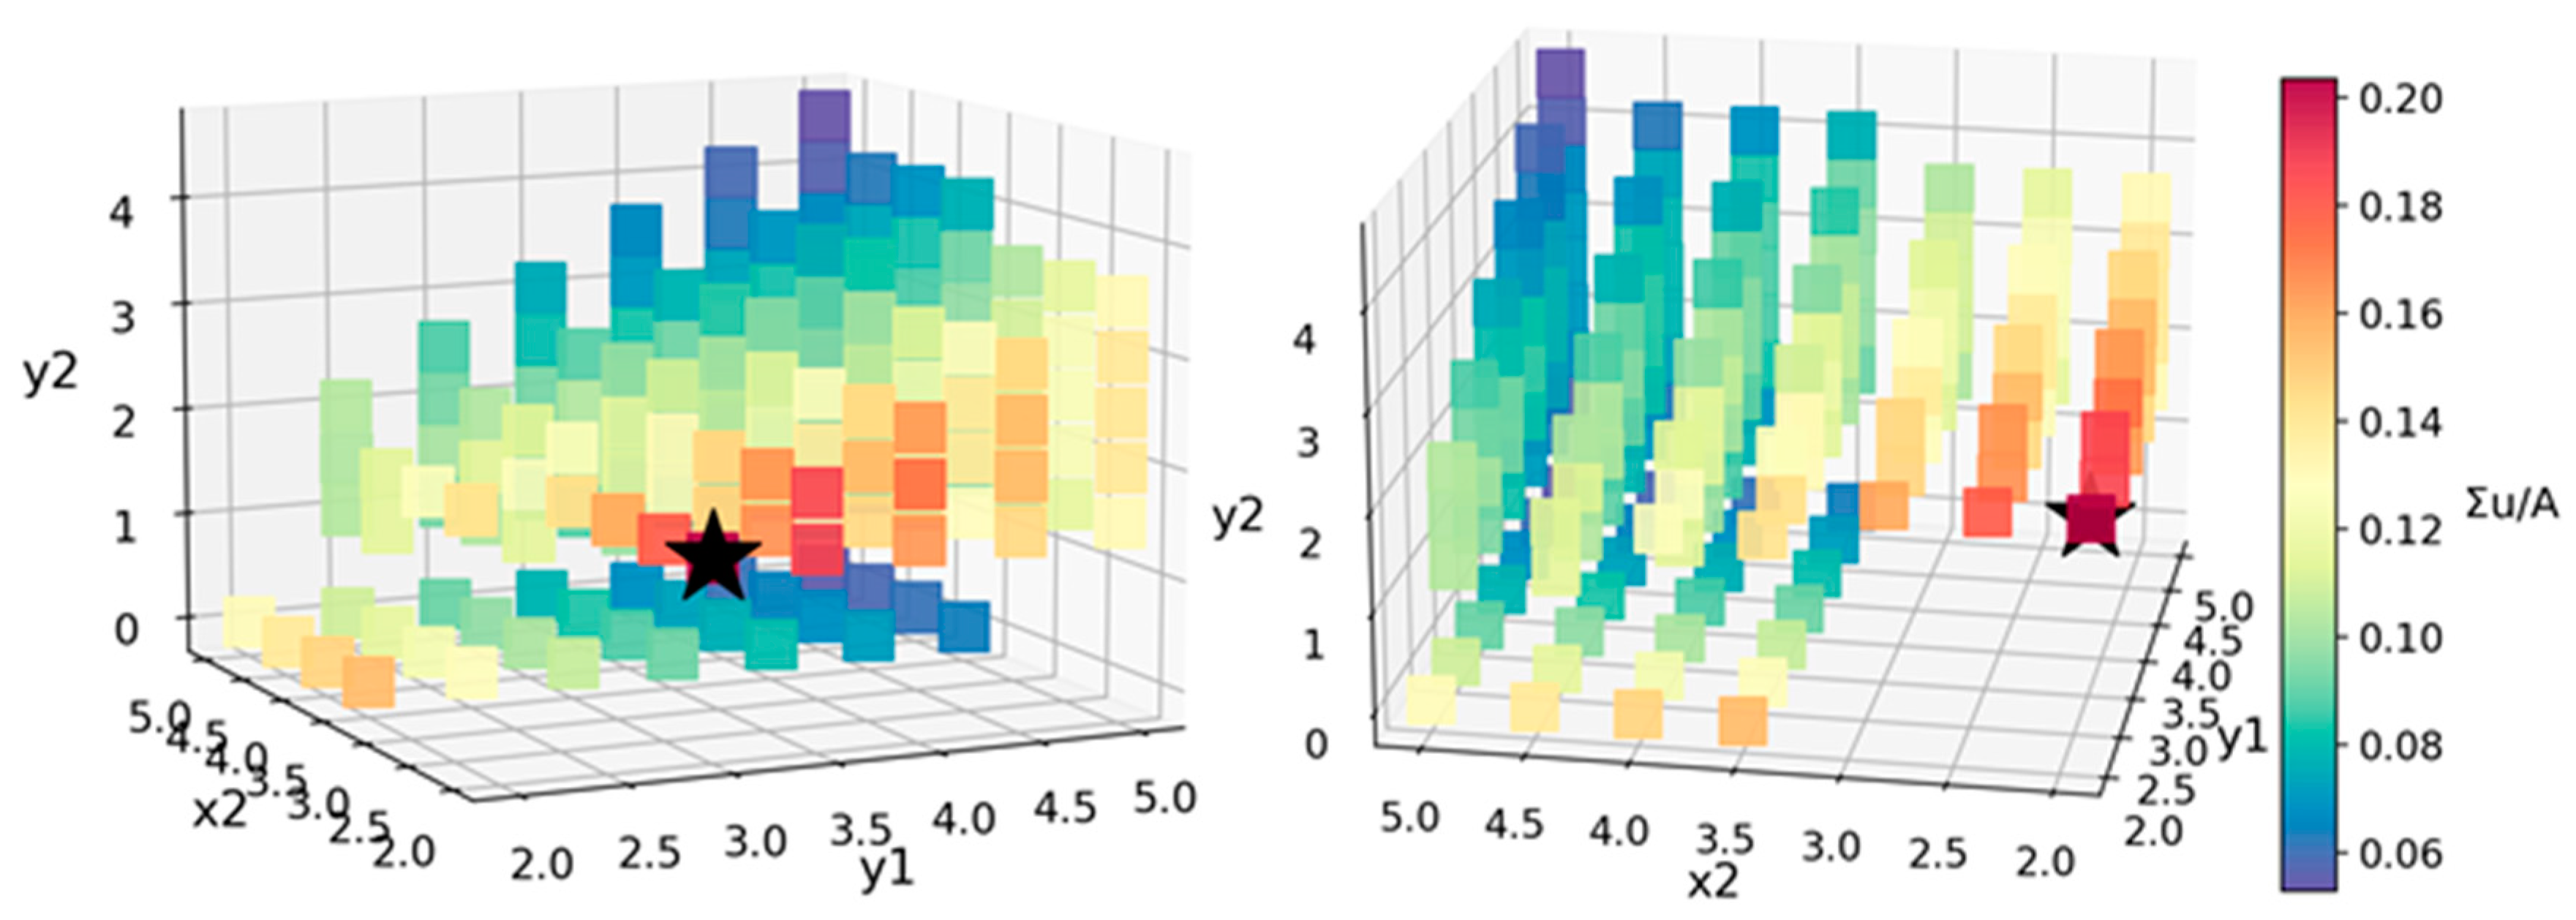
The three-dimensional scatter diagram of array power density. The left and right pictures are two different side views of the scatter. The three axes are the three distance parameters (y1, x2, y2). The color bar represents the array power density. The black star represents the maximum array power density (Its coordinates are y1 = 3, x2 = 2, y2 = 1.5).
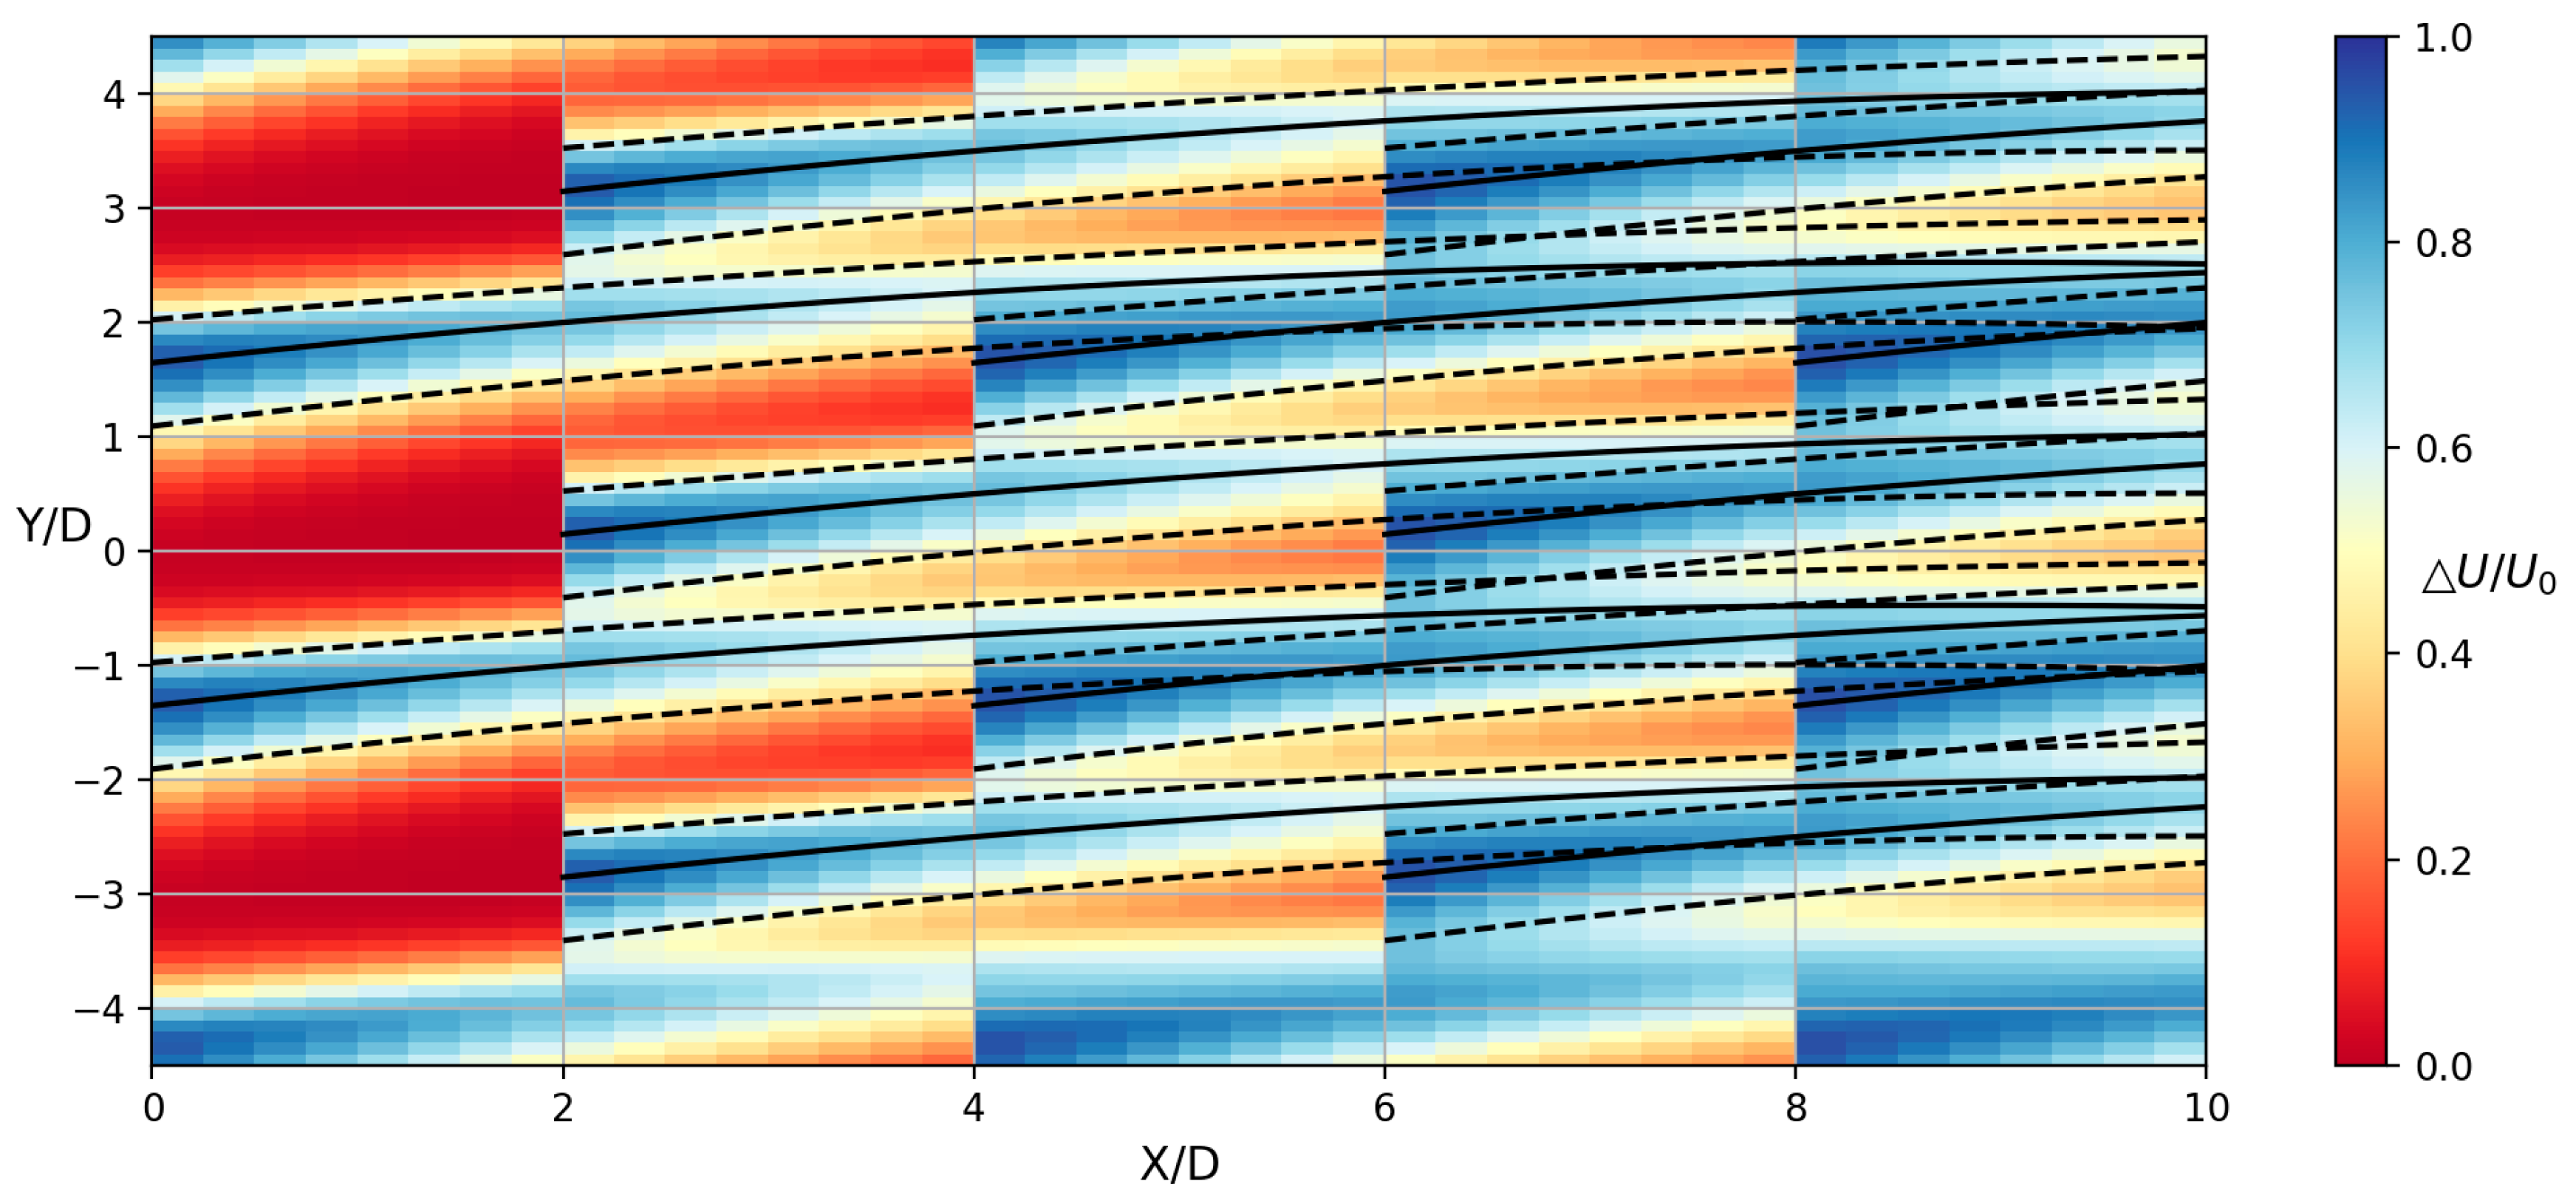
As shown in Figure 10, it can be found that, when y1 = 3, x2 = 2, y2 = 1.5, the array power density is the maximum. The corresponding velocity contour under this distance parameters is shown in Figure 11. By comparing the velocity contours (Figure 8 and Figure 11), it can be found that the optimal array arrangements under these two different criteria are quite different. In Figure 11, the lateral distance (y1) and streamwise distance (y2) are small, and the wake interference in the downstream is obvious. The downstream turbines work in the upstream wake, and the velocity deficit of the downstream turbine is bigger than that of the upstream turbine. In order to analyze the characteristics of array power density more clearly, the three-dimensional scatter diagram (Figure 10) is redrawn into several pieces of heat maps, which are shown in Figure 12.
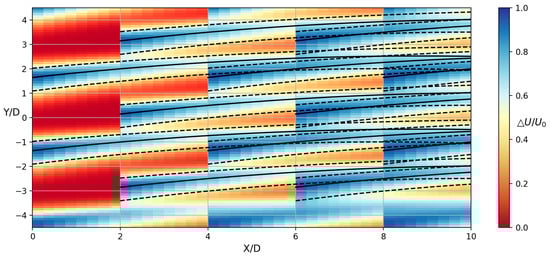
Figure 11.
The velocity contour of the array, which is the optimal arrangement under the criterion of array power density. y1 = 3, x2 = 2, y2 = 1.5. The color bar is the velocity deficit, the black solid lines represent the position of the maximum velocity deficit, and the black dashed lines represent the deviations of the double semi Gaussian functions.


Figure 12.
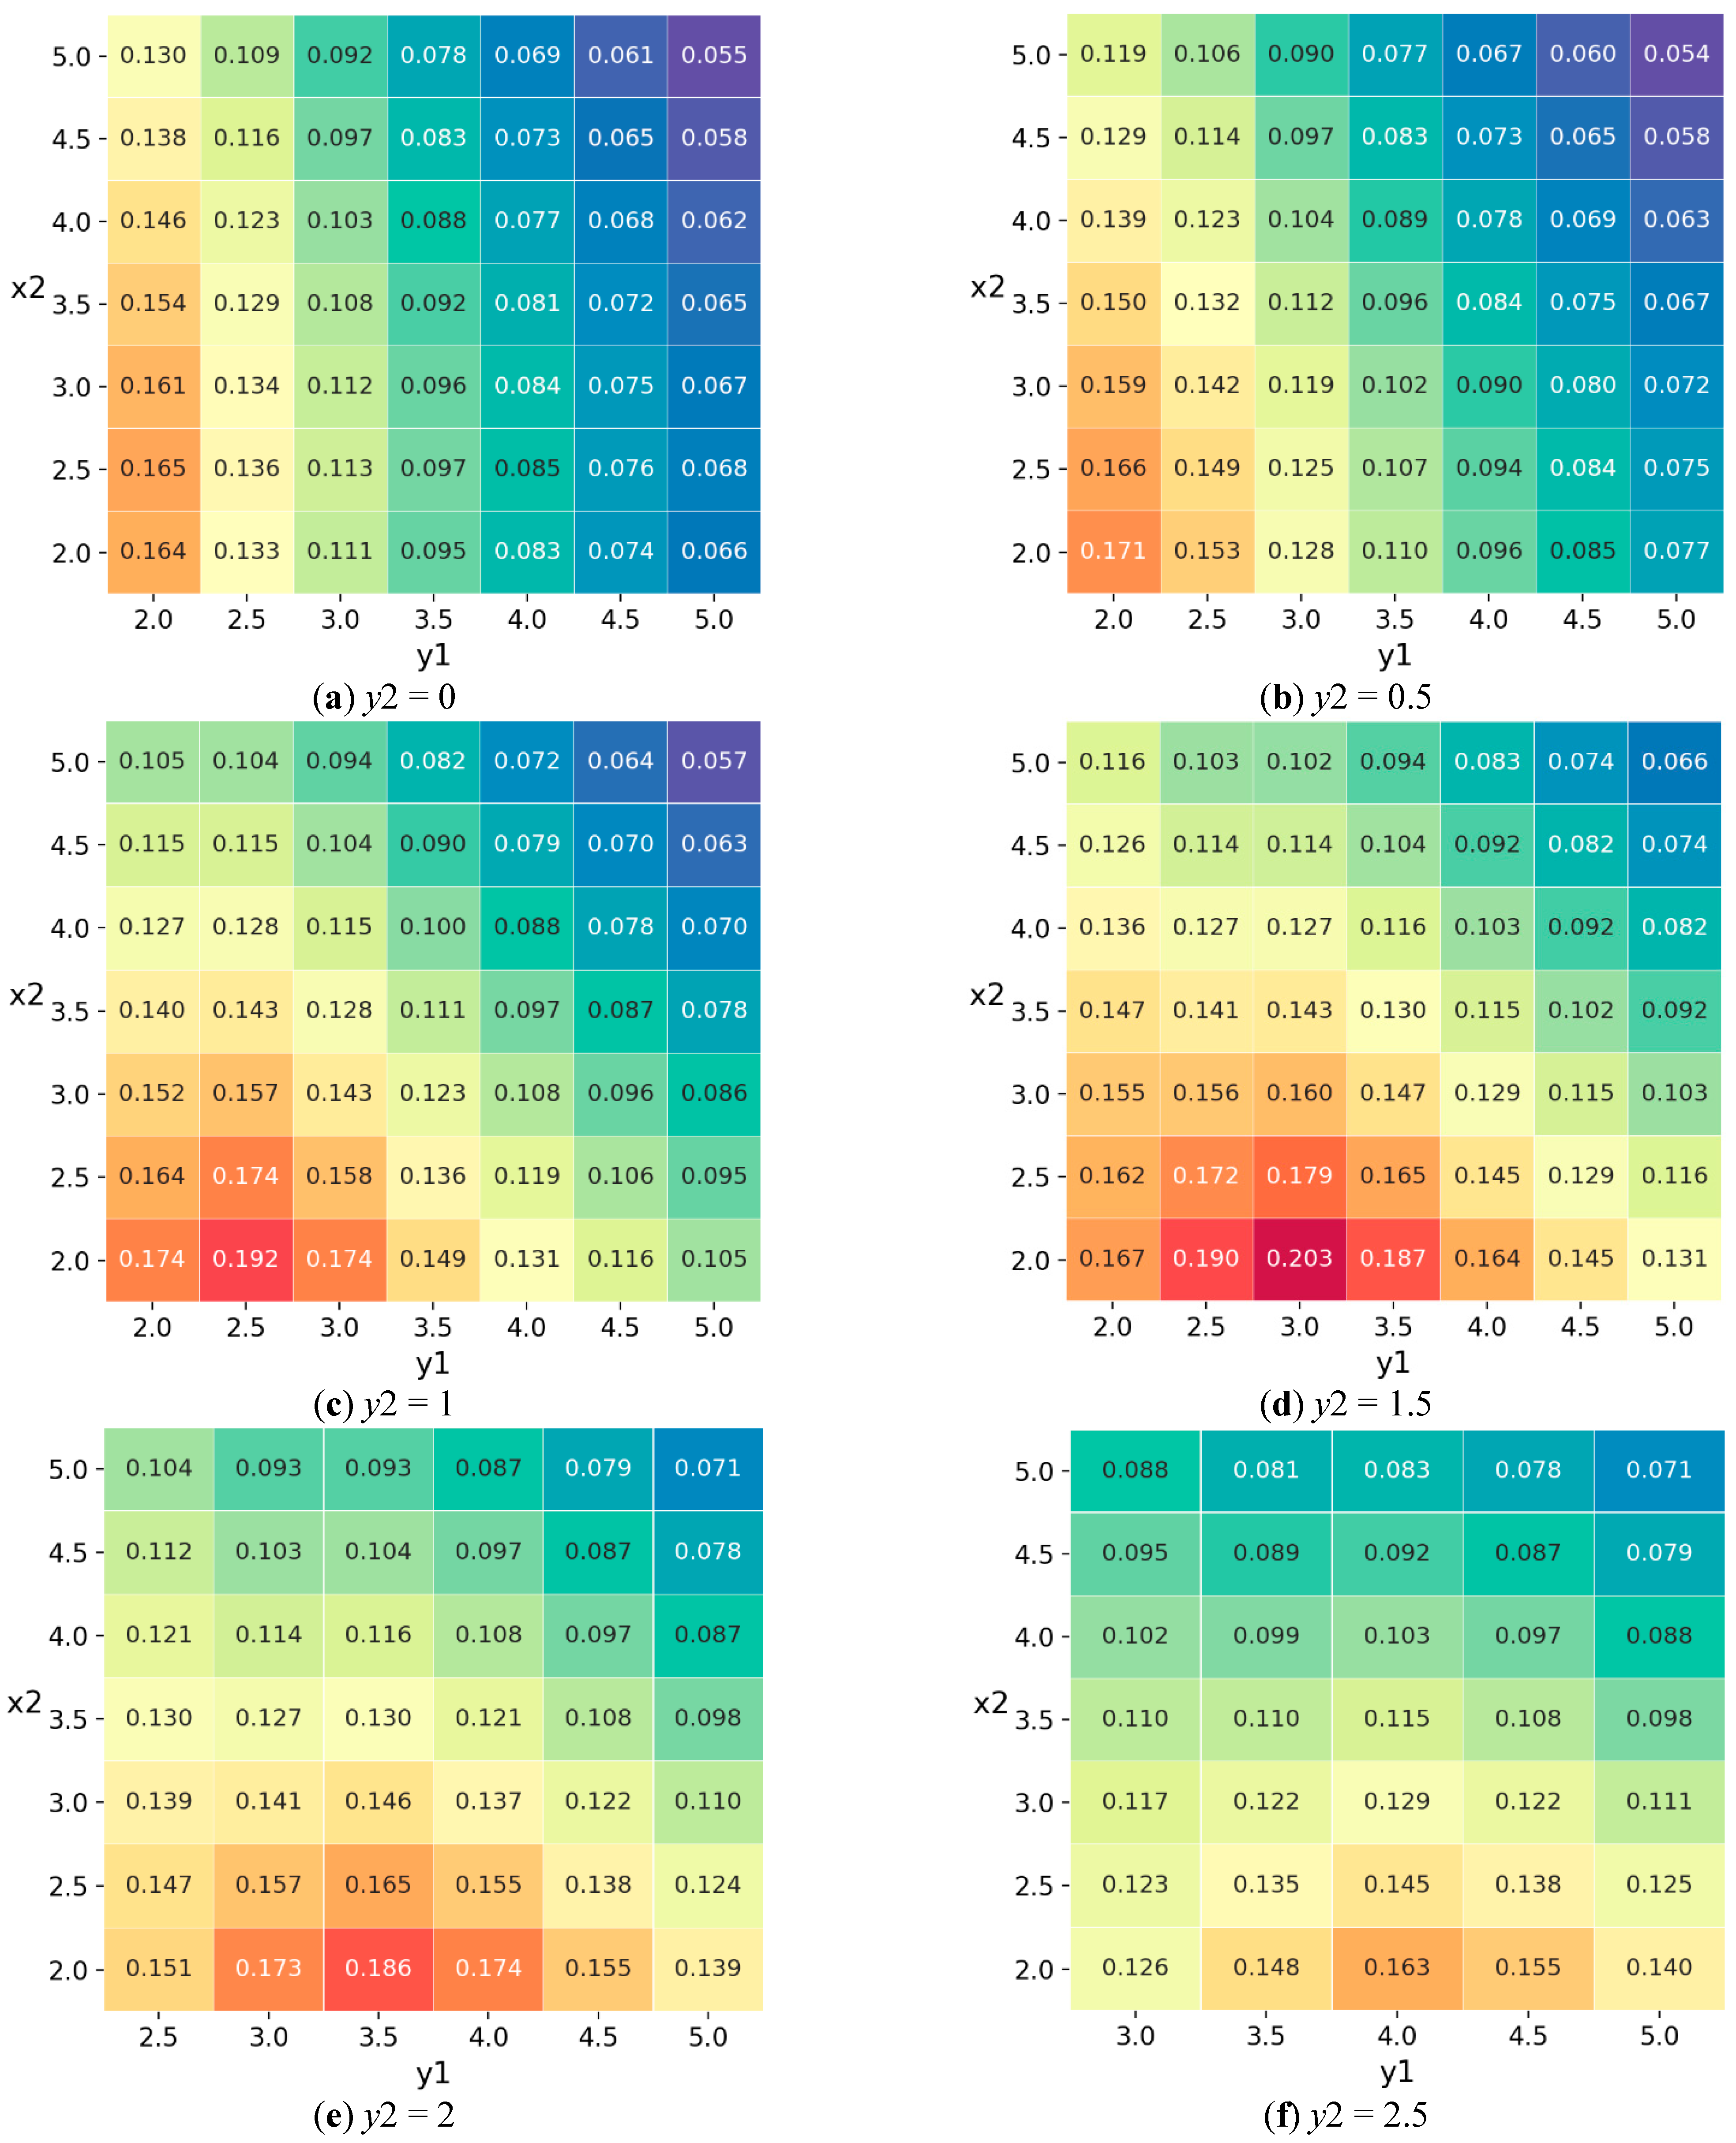
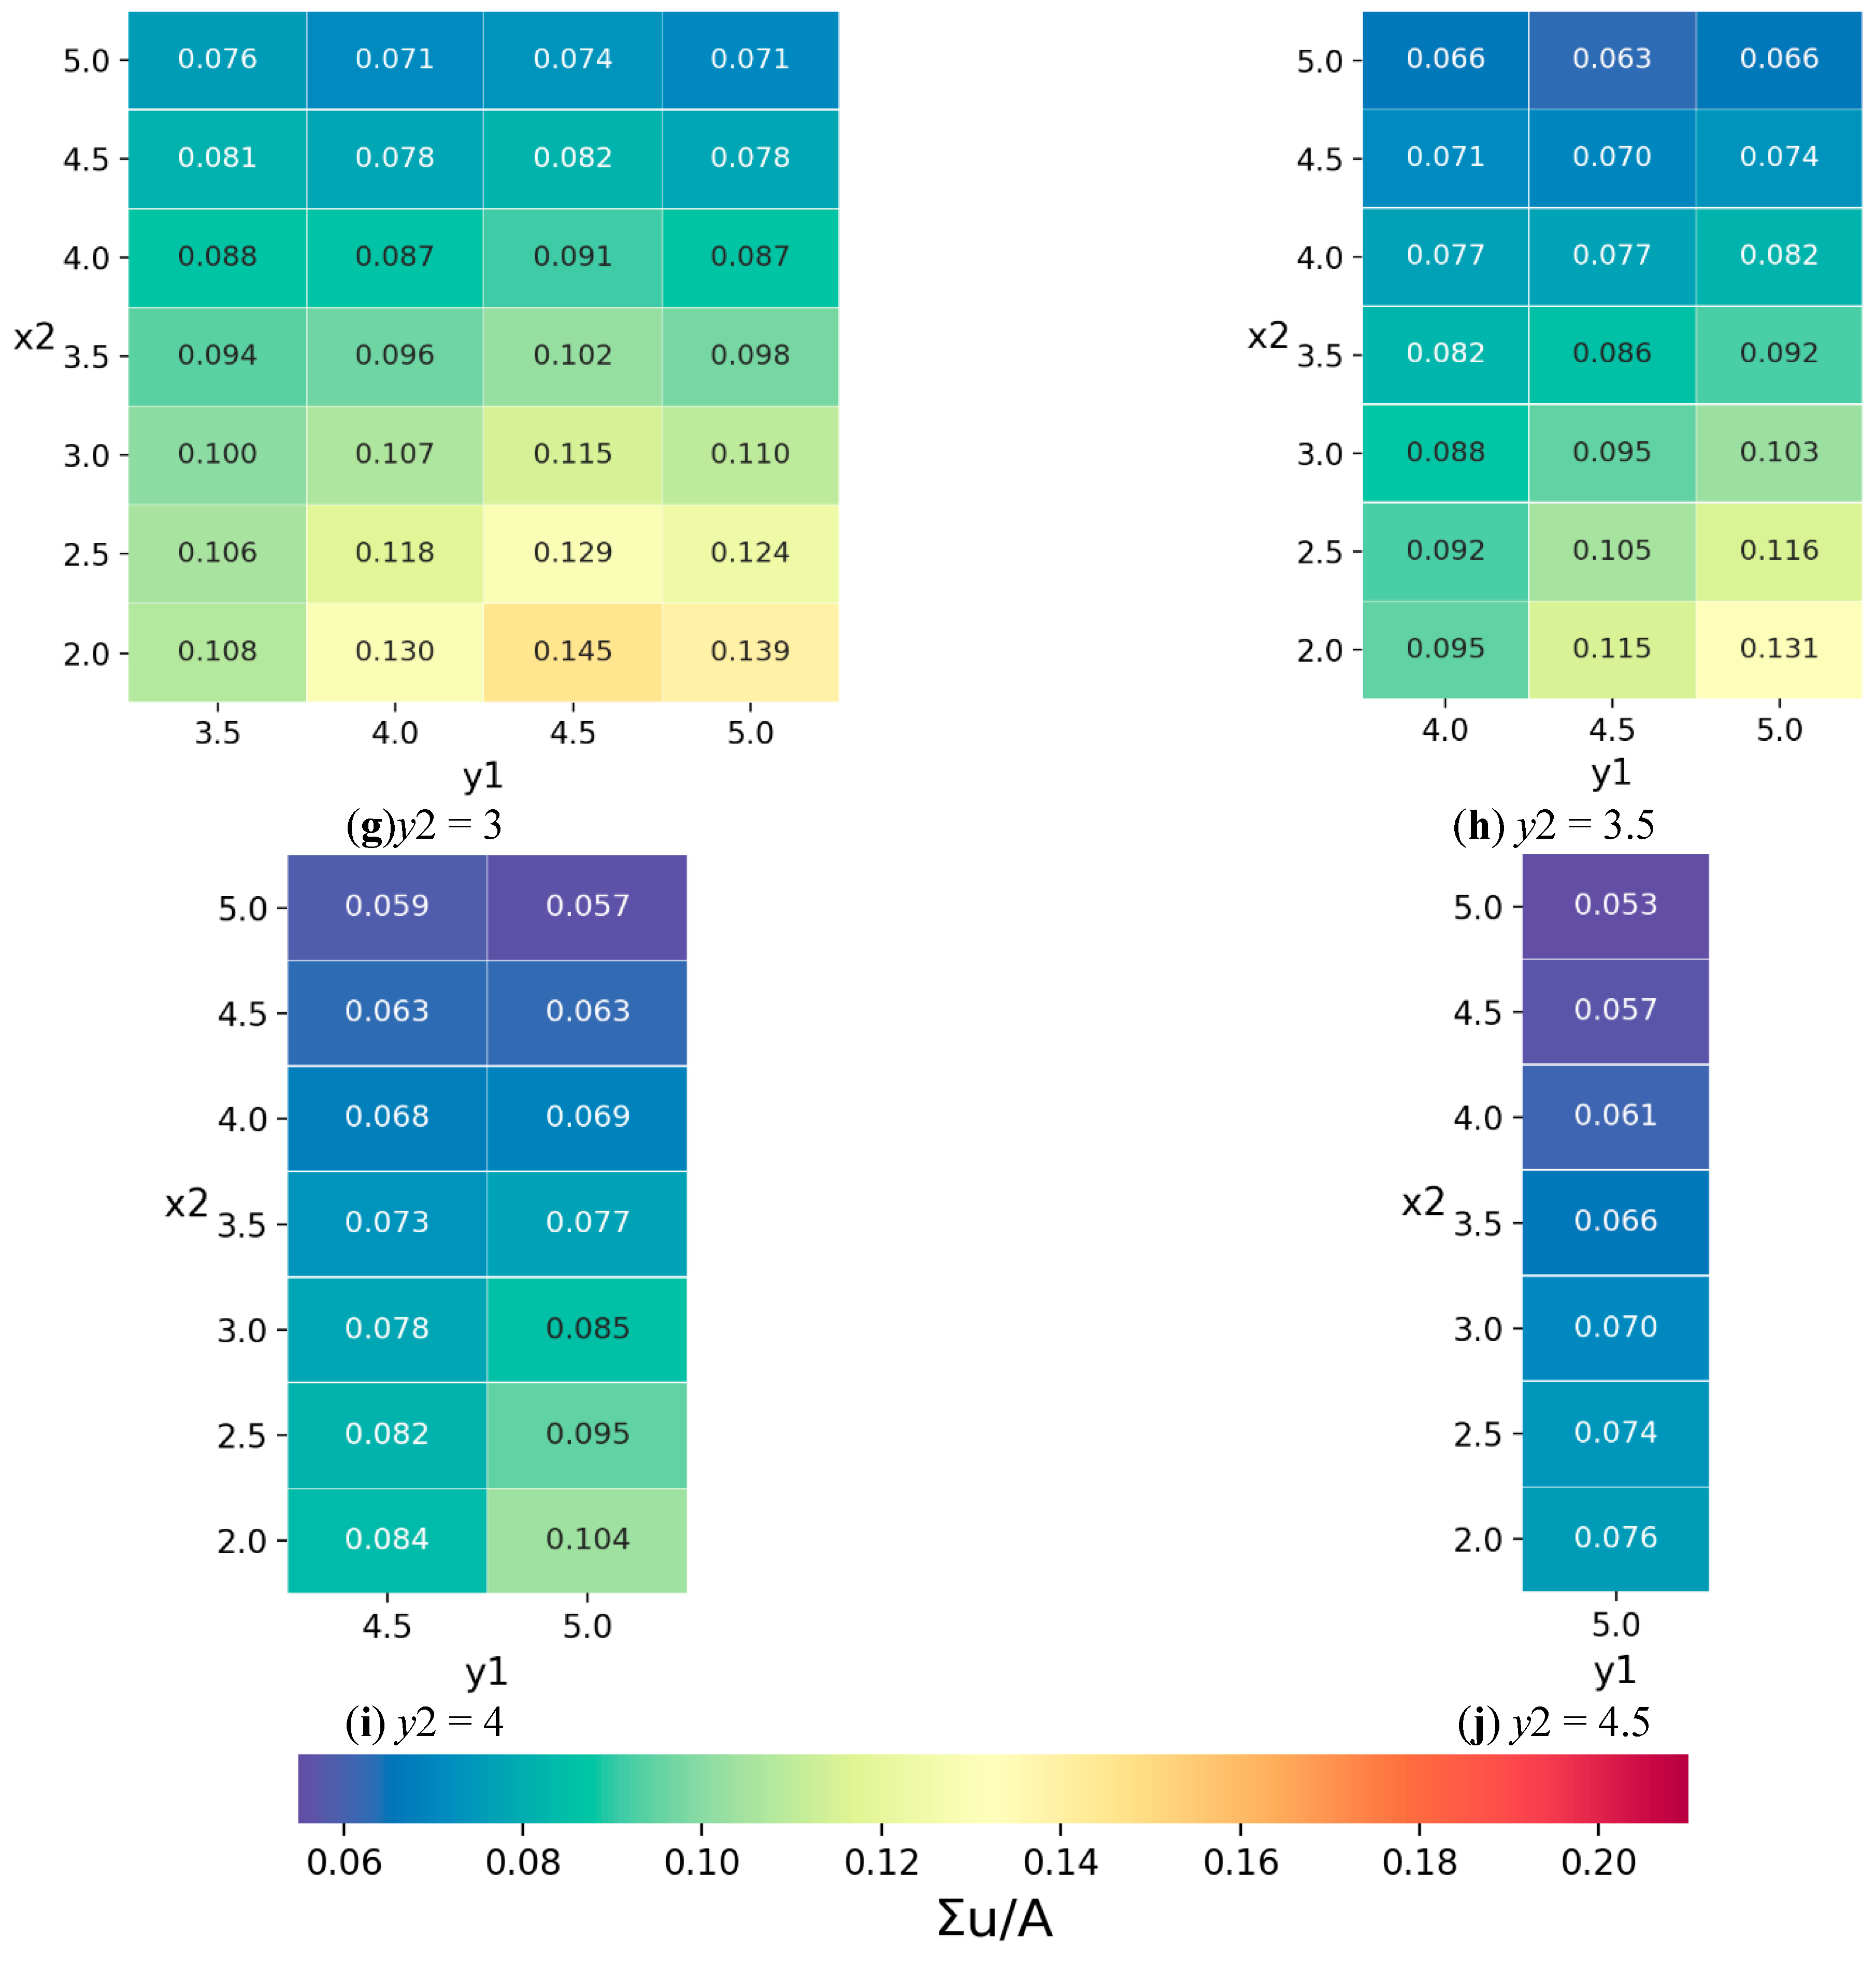
The heat maps of array power density. Each map corresponds to a fixed y2. The color and the number inside represent the value of the array power density.
From Figure 12, the array power density does not change monotonously with the distance parameters (y1 and x2), which is different from the average inflow velocity. At the optimal solution, the distances (y1 and x2) are not the smallest, and better performance can be achieved under a slightly larger lateral distance (y1), which is also in agreement with a previous study [22]. Moreover, when y2 is small (y2 < 1), x2 has a more obvious effect on the array power density than y1. However, when y2 is big enough (y2 ≥ 1), y1 has a more obvious effect on the array power density than x2. This finding is similar to that under the criterion of average inflow velocity.
Under the criterion of average inflow velocity, the distances (y1 and x2) should be as big as possible for the good performance. The y1 and x2 of the optimal solution are the maximum in the range (y1 = 5, x2 = 5). However, under the criterion of array power density, the distances (y1 and x2) should be as small as possible in general. Although the y1 of the optimal solution is not the minimum in the range, the distances are still quite small. By comparing the optimal arrangements under the two criteria, there is a big difference and the final optimal arrangement still cannot be determined. In order to solve this problem, the requirement of the rated inflow velocity is introduced and the relevant analysis is provided in Section 5.
5. The Optimal Array Arrangements under Different Truncation Ratios
No matter the horizontal axis wind turbine or the vertical axis wind turbine, there is an inflow velocity range at the rated working condition. The maximum of this inflow velocity range is the cut-out velocity, and the minimum of this inflow velocity range is the rated inflow velocity. When the inflow velocity is within this range, the output keeps at the rated power. When the inflow velocity is beyond the range, the output drops rapidly [25]. Therefore, in order to maintain a stable power output, the inflow velocities of the turbines should preferably be within the rated range.
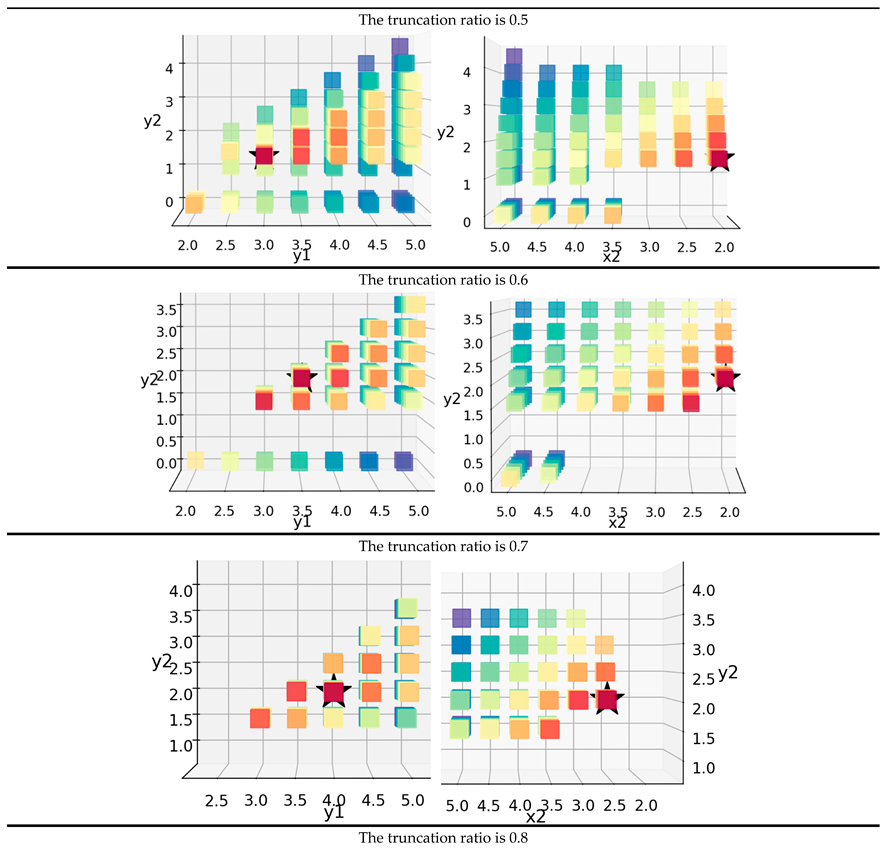
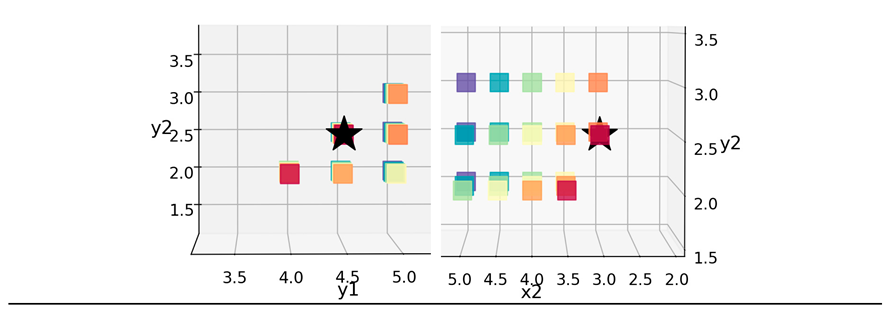
In this section, the inlet velocity U0 is defined as the maximum of the inflow velocity range. The truncation ratio is defined as the rated inflow velocity divided by inlet velocity U0. In some array arrangements, if the inflow velocity of the downstream turbine is lower than this truncation ratio, it means that the output of the downstream turbine does not reach the rated power, and these arrangements will be discarded. Under the criterion of average inflow velocity, the distance of the optimal arrangement is as large as possible, the inflow velocity of the downstream turbine is also big enough, different truncation ratios will not affect the optimal solution. However, under the criterion of array power density, the distance of the optimal arrangement is relatively small, wake interference is obvious and the small distance would make the downstream turbine unable to work at the rated condition. Therefore, the truncation ratio should be considered under the criterion of array power density, rather than the criterion of average inflow velocity. Moreover, the inflow velocity range and the rated working condition may vary depending on the prototype. Four different truncation ratios (0.5, 0.6, 0.7, 0.8) are compared, and the corresponding optimal arrangements under the criterion of array power density are analyzed. The side views of the three-dimensional scatter diagrams are shown in Figure 13, Figure 14, Figure 15 and Figure 16, and the front views of them are shown in Appendix C.

Figure 13.
The three-dimensional scatter diagram of array power density (truncation ratio is 0.5). The missing scatters represent that the inflow velocity under this distance parameters is less than the truncation ratio. The left and right pictures are two different side views of the scatter. The three axes are the three distance parameters (y1, x2, y2). The color bar represents the array power density. The black star represents the maximum array power density (its coordinates are y1 = 3, x2 = 2, y2 = 1.5).
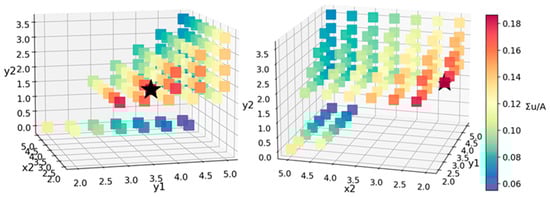
Figure 14.
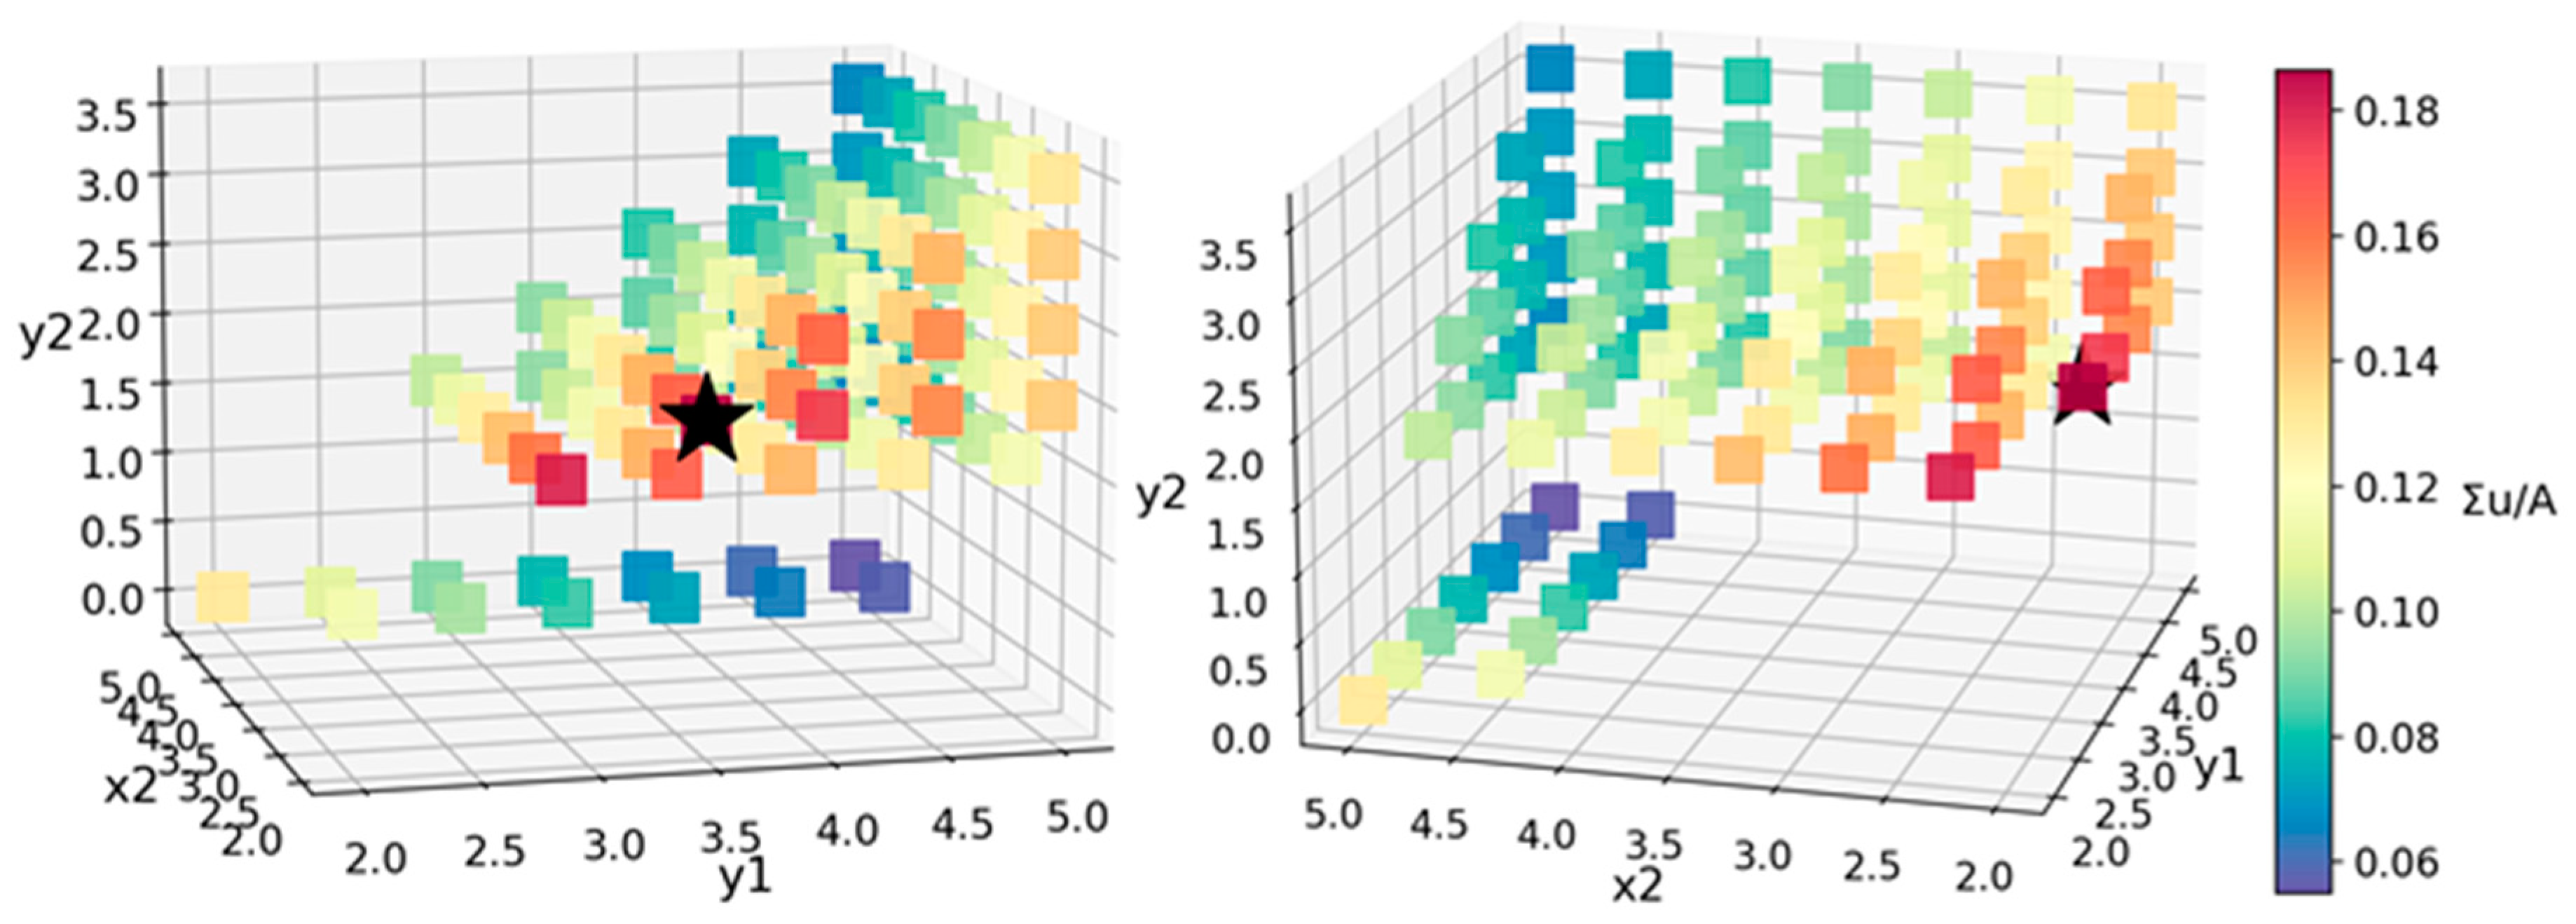
The three-dimensional scatter diagram of array power density (truncation ratio is 0.6). The missing scatters represent that the inflow velocity under this distance parameters is less than the truncation ratio. The left and right pictures are two different side views of the scatter. The three axes are the three distance parameters (y1, x2, y2). The color bar represents the array power density. The black star represents the maximum array power density (Its coordinates are y1 = 3.5, x2 = 2, y2 = 2).
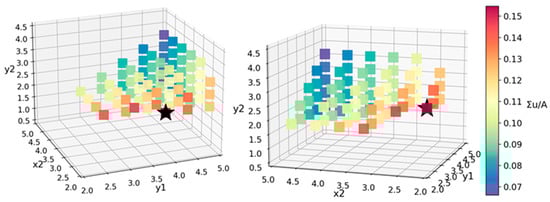
Figure 15.
The three-dimensional scatter diagram of array power density (truncation ratio is 0.7). The missing scatters represent that the inflow velocity under this distance parameters is less than the truncation ratio. The left and right pictures are two different side views of the scatter. The three axes are the three distance parameters (y1, x2, y2). The color bar represents the array power density. The black star represents the maximum array power density (Its coordinates are y1 = 4, x2 = 2.5, y2 = 2).

Figure 16.
The three-dimensional scatter diagram of array power density (truncation ratio is 0.8). The missing scatters represent that the inflow velocity under this distance parameters is less than the truncation ratio. The left and right pictures are two different side views of the scatter. The three axes are the three distance parameters (y1, x2, y2). The color bar represents the array power density. The black star represents the maximum array power density (Its coordinates are y1 = 4.5, x2 = 3, y2 = 2.5).
From Figure 13, Figure 14, Figure 15 and Figure 16, it can be found that, when the streamwise distance (x2) and staggered distance (y2) are small, the downstream turbine cannot work at the rated condition, and the corresponding scatter is discarded in the scatter diagram. When the truncation ratio is 0.5, the distance parameters of the optimal arrangement does not change compared with that without truncation. With the increase in truncation ratio, the distance parameters (y1, x2, y2) of the optimal arrangement are also increasing. That is to say, if the optimal arrangement is only measured by the criterion of array power density, the actual performance of the array is not optimal, because many downstream turbines would not work at the rated condition. It is better to combine the density criterion with the truncation ratio to measure the optimal arrangement.
By observing Figure 17, Figure 18 and Figure 19, it is clearer that, under the small truncation ratio, the distance parameters of the optimal arrangements are not big, and there is obvious wake interference in the downstream. However, with the increase in the truncation ratio, the wake interference of optimal arrangement becomes weaker. By comparing the distance parameters of the optimal arrangements under different truncation ratios, the staggered distance (y2) is about half of the lateral distance (y1), and the lateral distance (y1) is bigger than the streamwise distance (x2). Moreover, the distances (y1, x2) should not be too small, so that the downstream turbine can work at the rated condition. These findings could provide some suggestions for the preliminary design of the VAWT array.
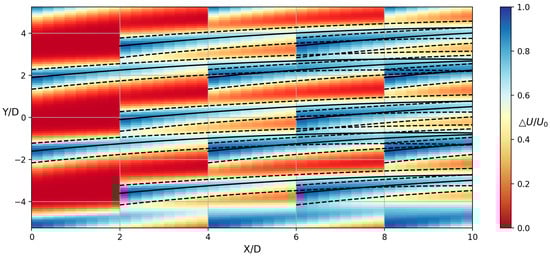
Figure 17.
The velocity contour of the array, which is the optimal arrangement under the criterion of array power density (truncation ratio is 0.6). y1 = 3.5, x2 = 2, y2 = 2. The color bar is the velocity deficit, the black solid lines represent the position of the maximum velocity deficit, and the black dashed lines represent the deviations of the double semi Gaussian functions.
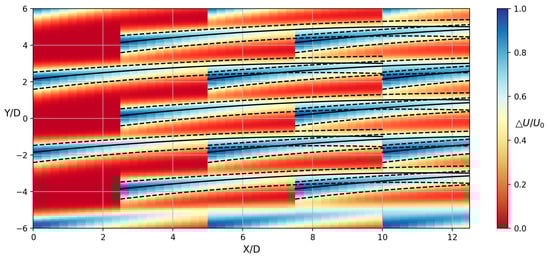
Figure 18.
The velocity contour of the array, which is the optimal arrangement under the criterion of array power density (truncation ratio is 0.7). y1 = 4, x2 = 2.5, y2 = 2. The color bar is the velocity deficit, the black solid lines represent the position of the maximum velocity deficit, and the black dashed lines represent the deviations of the double semi Gaussian functions.
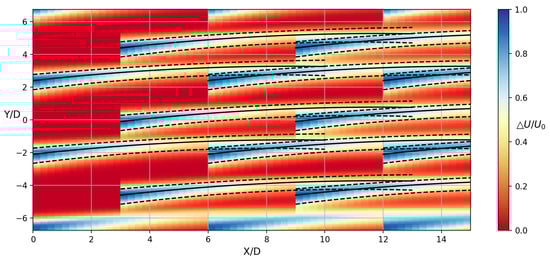
Figure 19.
The velocity contour of the array, which is the optimal arrangement under the criterion of array power density (truncation ratio is 0.8). y1 = 4.5, x2 = 3, y2 = 2.5. The color bar is the velocity deficit, the black solid lines represent the position of the maximum velocity deficit, and the black dashed lines represent the deviations of the double semi Gaussian functions.
6. Conclusions
A new VAWT wake model, double semi Gaussian functions, is proposed in this paper. It is simple in form and its model parameters can well represent the wake parameters. Compared with the traditional Gaussian and Top-hat models, it can better reflect the asymmetric characteristics of the VAWT wake, and it can also describe the wake merging in the case of counter-rotating twin turbines.
Based on the proposed wake model, three experimental cases are fitted into the proposed model. Then, the optimal arrangements under two different criteria are analyzed. To ensure the downstream turbine works within the rated range, the truncation ratio is introduced to the array optimization, and some relevant suggestions on the array design have been put forward.
This paper is mainly to propose a new VAWT wake model and optimize the array arrangement. Due to the limitations of the existing research, few wake models are used for the VAWT array optimization. At the present stage, there is no available array optimization for comparison. The comparison on array optimization will be carried out in the future when more relevant studies are published. Nevertheless, based on the comparison on the velocity profile, it can be preliminarily proved that the wake model proposed in this paper is more suitable than other traditional models. The higher fitting accuracy on velocity profile could make the array optimization more correct. We believe that the proposed model could be a promising approach for the VAWT array design, the optimal arrangements and corresponding suggestions could be helpful to the preliminary design of VAWT array.
Author Contributions
Methodology, Z.Y., Q.S., K.S., J.Z. and F.J.; Validation, X.Z.; Investigation, Z.Y.; Writing—Original draft preparation, Z.Y.; Writing—Review and editing, R.J.; Supervision, Q.S. and K.S. All authors have read and agreed to the published version of the manuscript.
Funding
This work was supported by the Key project of NSFC-Shandong joint research POW3C (U1906230) and the National Natural Science Foundation of China (No. 51879064, No. U1706227, No. 51979062, No. 52071094).
Institutional Review Board Statement
Not applicable.
Informed Consent Statement
Not applicable.
Data Availability Statement
Not applicable.
Conflicts of Interest
The authors declare no conflict of interest.
Appendix A. The Fitting Results of the Velocity Profiles and the Corresponding Model Parameters
Appendix B. The Model Parameters and Corresponding Polynomial Functions in Different Cases

Appendix C. The Front Views of the Three-Dimensional Scatter Diagrams under Different Truncation Ratios
References
- McKeogh, E. Offshore wind energy: Technology opportunities and challenges. In Vietnam Symposium on Advances in Offshore Engineering; Springer: Singapore, 2018; pp. 3–22. [Google Scholar]
- Kinzel, M.; Mulligan, Q.; Dabiri, J.O. Energy exchange in an array of vertical-axis wind turbines. J. Turbul. 2012, 13, N38. [Google Scholar] [CrossRef]
- Dabiri, J.O. Potential order-of-magnitude enhancement of wind farm power density via counter-rotating vertical-axis wind turbine arrays. J. Renew. Sustain. Energy 2011, 3, 043104. [Google Scholar] [CrossRef] [Green Version]
- Jiménez, Á.; Crespo, A.; Migoya, E. Application of a LES technique to characterize the wake deflection of a wind turbine in yaw. Wind Energy 2010, 13, 559–572. [Google Scholar] [CrossRef]
- Strom, B.; Polagye, B.; Brunton, S.L. Near-Wake Dynamics of a Vertical-Axis Turbine. arXiv 2021, arXiv:2103.00407. [Google Scholar]
- Tescione, G.; Ragni, D.; He, C.; Ferreira, C.S.; Van Bussel, G.J.W. Near wake flow analysis of a vertical axis wind turbine by stereoscopic particle image velocimetry. Renew. Energy 2014, 70, 47–61. [Google Scholar] [CrossRef]
- Ouro, P.; Runge, S.; Luo, Q.; Stoesser, T. Three-dimensionality of the wake recovery behind a vertical axis turbine. Renew. Energy 2019, 133, 1066–1077. [Google Scholar] [CrossRef] [Green Version]
- Rolin VF, C.; Porté-Agel, F. Experimental investigation of vertical-axis wind-turbine wakes in boundary layer flow. Renew. Energy 2018, 118, 1–13. [Google Scholar] [CrossRef]
- Peng, H.Y.; Lam, H.F.; Liu, H.J. Numerical investigation into the blade and wake aerodynamics of an H-rotor vertical axis wind turbine. J. Renew. Sustain. Energy 2018, 10, 053305. [Google Scholar] [CrossRef]
- Lam, H.F.; Peng, H.Y. Measurements of the wake characteristics of co-and counter-rotating twin H-rotor vertical axis wind turbines. Energy 2017, 131, 13–26. [Google Scholar] [CrossRef]
- Araya, D.; Dabiri, J. Transition to bluff body dynamics in the wake of vertical axis turbines. J. Fluid Mech. 2017, 813, 346–381. [Google Scholar] [CrossRef] [Green Version]
- Parker, C.M.; Araya, D.B.; Leftwich, M.C. Effect of chord-to-diameter ratio on vertical-axis wind turbine wake development. Exp. Fluids 2017, 58, 1–11. [Google Scholar] [CrossRef]
- Peng, H.Y.; Lam, H.F. Turbulence effects on the wake characteristics and aerodynamic performance of a straight-bladed vertical axis wind turbine by wind tunnel tests and large eddy simulations. Energy 2016, 109, 557–568. [Google Scholar] [CrossRef]
- Hohman, T.C.; Martinelli, L.; Smits, A.J. The effects of inflow conditions on vertical axis wind turbine wake structure and performance. J. Wind Eng. Ind. Aerodyn. 2018, 183, 1–18. [Google Scholar] [CrossRef]
- Peng, H.Y.; Lam, H.F.; Lee, C.F. Investigation into the wake aerodynamics of a five-straight-bladed vertical axis wind turbine by wind tunnel tests. J. Wind Eng. Ind. Aerodyn. 2016, 155, 23–35. [Google Scholar] [CrossRef]
- Maeda, T.; Kamada, Y.; Ogasawara, T.; Nakai, A.; Kasuya, T. Investigation of power performance and wake on a straight-bladed vertical axis wind turbine with field experiments. Energy 2017, 141, 1113–1123. [Google Scholar]
- Abkar, M.; Dabiri, J.O. Self-similarity and flow characteristics of vertical-axis wind turbine wakes: An LES study. J. Turbul. 2017, 18, 373–389. [Google Scholar] [CrossRef]
- Ouroa, P.; Lazennecc, M. Analytical models for the asymmetric wake of vertical axis wind turbines. arXiv 2020, arXiv:2010.00301. [Google Scholar]
- Huang, M.; Ferreira, C.; Sciacchitano, A.; Scarano, F. Experimental Comparison of the Wake of a Vertical Axis Wind Turbine and Planar Actuator Surfaces. J. Phys. Conf. Ser. 2020, 1618, 052063. [Google Scholar] [CrossRef]
- Tingey, E.B.; Ning, A. Parameterized vertical-axis wind turbine wake model using CFD vorticity data. In Proceedings of the 34th Wind Energy Symposium, San Diego, CA, USA, 4–8 January 2016; p. 1730. [Google Scholar]
- Hezaveh, S.H.; Bou-Zeid, E.; Dabiri, J.; Kinzel, M.; Cortina, G.; Martinelli, L. Increasing the power production of vertical-axis wind-turbine farms using synergistic clustering. Bound. Layer Meteorol. 2018, 169, 275–296. [Google Scholar] [CrossRef] [Green Version]
- Whittlesey, R.W.; Liska, S.; Dabiri, J.O. Fish schooling as a basis for vertical axis wind turbine farm design. Bioinspir. Biomim. 2010, 5, 035005. [Google Scholar] [CrossRef] [PubMed] [Green Version]
- Araya, D.B.; Craig, A.E.; Kinzel, M.; Dabiri, J.O. Low-order modeling of wind farm aerodynamics using leaky Rankine bodies. J. Renew. Sustain. Energy 2014, 6, 063118. [Google Scholar] [CrossRef] [Green Version]
- Brownstein, I.D.; Kinzel, M.; Dabiri, J.O. Performance enhancement of downstream vertical-axis wind turbines. J. Renew. Sustain. Energy 2016, 8, 053306. [Google Scholar] [CrossRef]
- Lam, H.F.; Peng, H.Y. Development of a wake model for Darrieus-type straight-bladed vertical axis wind turbines and its application to micro-siting problems. Renew. Energy 2017, 114, 830–842. [Google Scholar] [CrossRef]
- Kadum, H.; Friedman, S.; Camp, E.H.; Cal, R.B. Development and scaling of a vertical axis wind turbine wake. J. Wind Eng. Ind. Aerodyn. 2018, 174, 303–311. [Google Scholar] [CrossRef]
- Bromm, M.; Rott, A.; Beck, H.; Vollmer, L.; Steinfeld, G.; Kühn, M. Field investigation on the influence of yaw misalignment on the propagation of wind turbine wakes. Wind Energy 2018, 21, 1011–1028. [Google Scholar] [CrossRef]
- Radi, A.; Thompson, M.C.; Rao, A.; Hourigan, K.; Sheridan, J. Experimental evidence of new three-dimensional modes in the wake of a rotating cylinder. J. Fluid Mech. 2013, 734, 567. [Google Scholar] [CrossRef] [Green Version]
- Radi, A.; Thompson, M.C.; Rao, A.; Hourigan, K.; Sheridan, J. Experimental characterisation of the wake behind paired vertical-axis wind turbines. J. Wind Eng. Ind. Aerodyn. 2020, 206, 104353. [Google Scholar]
- Wu, C.; Yang, X.; Zhu, Y. On the design of potential turbine positions for physics-informed optimization of wind farm layout. Renew. Energy 2021, 164, 1108–1120. [Google Scholar] [CrossRef]


Publisher’s Note: MDPI stays neutral with regard to jurisdictional claims in published maps and institutional affiliations. |
© 2021 by the authors. Licensee MDPI, Basel, Switzerland. This article is an open access article distributed under the terms and conditions of the Creative Commons Attribution (CC BY) license (https://creativecommons.org/licenses/by/4.0/).