Article

On Socio-Economic Predictors of Religious Intolerance: Evidence from a Large-Scale Longitudinal Survey in the Largest Muslim Democracy

by
Arief Anshory Yusuf
1,*,
Akhmad Rizal Shidiq
2 and
Hariyadi Hariyadi
3
1
Department of Economics, Padjadjaran University, Bandung 40115, Indonesia
2
Leiden Institute for Area Studies, Leiden University, 2311 BZ Leiden, The Netherlands
3
Department of Sociology, Jenderal Soedirman University, Purwokerto 53142, Indonesia
*
Author to whom correspondence should be addressed.
Religions 2020, 11(1), 21; https://doi.org/10.3390/rel11010021
Submission received: 14 November 2019 / Revised: 20 December 2019 / Accepted: 27 December 2019 / Published: 31 December 2019

Abstract

:
Motivated by increasing religious intolerance, we study the socio-economic covariates of individual-level religious intolerance in Indonesia, the largest Muslim democracy in the world. We use panel data from 2007 and 2014 of more than 20,000 adult individuals (representing 83% of the population) and apply fixed-effect regression analysis to identify relevant socio-economic characteristics that are highly associated with religious intolerance at the individual level. We utilize survey questions on willingness to accept someone with different faith living in the same village, living in the same neighborhood, renting a house, marrying relatives or children, and building a place of worship in the neighborhood as our measures of religious intolerance. We find that higher individual income and educational attainment are positively correlated with the tolerance level. At the same time, a higher level of self-declared religiosity is negatively correlated with a tolerant attitude. For location-specific characteristics, higher income inequality and extent of poverty in the location where an individual resides are associated with a higher level of religious intolerance. These patterns are generally robust across different measures of religious intolerance, although there is heterogeneity in the magnitudes of the correlations, where these covariates have the smallest correlations with the willingness to accept interfaith marriage in the family.

1. Introduction

Religious tensions and violence have risen globally over the last decade. The Pew Research Center (2018), for example, has reported that 28% of countries had “high” or “very high” levels of government restrictions on religious freedom in 2016, a three percentage point increase from 2015. The report also mentioned that among the 25 most populous countries in the world, Egypt, Russia, India, Indonesia, and Turkey had the highest levels of religious freedom restrictions. Religious tensions have the potential to quickly turn violent. The Minority Rights Group International (2018), for example, has recorded that mass killings and other atrocities involving religious minorities have been increasing in many countries.
Despite the country’s progressive democratic reform after the fall of the Suharto regime in 1998, Indonesia has witnessed the rising political and social power of hard-line Islamists and a turn towards populist conservatism in recent years (Hadiz 2018; van Bruinessen 2013; Wilson 2017; Rakhmani 2017). More concerning, several micro-level surveys have indicated that religious intolerance among Indonesians has also been on the rise. The combination of rising Islamic political conservatism and religious intolerance attitudes has reduced social cohesion and is incompatible with democracy.
In this paper, we explore the socio-economic predictors for individual-level religious intolerance in Indonesia. To identify the relevant predictors, we consider religious intolerance as a variant of out-group prejudice and take theoretical insights from sociology and social psychology on the determinants of such prejudice. We do not lend any particular weight to specific theories in selecting our socio-economic predictors, but use all possible theoretical explanations from the scarce resources theory, threat theory, social contact theory, educational progressivism theory, and community theory, as predominantly summarized in Mulder and Krahn (2005) and Stolz (2006). We also consider that religiosity itself may shape intolerant attitudes (Allport 1966). While all of these theories have been confirmed by many empirical studies (see, e.g., Milligan 2012), to the best of our knowledge, no empirical study has tested these theories in the Indonesian context.
Methodologically, we run multivariate regressions of religious intolerance on several socio-economic covariates at an individual level, mainly from the longitudinal Indonesian Family Life Survey (IFLS) data from 2007 and 2014. We find that richer and more educated individuals tended to be more tolerant to people with a different faith, supporting the scarce resources and threat theories, and that more self-declaring religious individuals tended to be less tolerant. We also confirm that community is important: individuals who resided in an area with higher income inequality and a greater extent of poverty tended to have less religious tolerance. The associations between these predictors and religious intolerance were persistent across different measures of religious intolerance, despite the heterogeneity in the magnitudes of the correlations.
This paper is organized as follows. First, we provide an overview of religious intolerance in Indonesia, which motivates this study, in Section 2. Section 3 is a literature review specifically presented for developing an analytical framework for the empirical analysis. The methodology and econometric specifications are discussed in Section 4, followed by the empirical findings in Section 5. Section 6 concludes the paper.

2. Overview of Rising Conservatism and Religious Intolerance in Indonesia

With 225 million Muslims, which constitute 87% of its total population, Indonesia is the largest Muslim country in the world. Further, with sweeping democratization in 1998, it is also the largest Muslim democracy. Indonesia has also been known for having a history of religious harmony. However, since its independence in 1945, the country has seen a long history of political competition between nationalistic secularism and Islamism. The ‘latent’ force of Islamic identity in politics was repressed during the authoritarian New Order between 1966 to 1998. The collapse of this regime, which led to a democratic reform, provided room for everyone, including Islamic-based political organizations, to become more open and expressive. The World Gallup Poll1, for example, ranked Indonesia among the most religious countries in the world.
Religious tolerance has been one of the main features of Indonesian society, as described by numerous discourses and depicted by the mass media at least until the reform period starting in the early 2000s. During Suharto’s rule of power, Indonesian Muslims have been known, at home and abroad by the general public, academicians, and politicians, as moderate, friendly, and tolerant. At that time, most (if not almost all) scholarly accounts on Indonesian Islam described Muslims in the country as the perfect example of moderate Islam, particularly in comparison with their fellows in the Middle East (Wanandi 2002; Dibb 2001; Ni’am 2015).
However, post-New Order Indonesia has offered different narratives of Indonesian Islam. Following the end of Suharto’s era, jihadi movements, with the support of military factions and local interests, fought in religiously motivated armed confrontations in the Maluku and Central Sulawesi provinces (van Dijk and Kaptein 2017). Terrorists attacked churches in 2000 and a tourist destination in Bali in 2002, which was repeated annually until around three years later, and cited Islam as their source of inspiration (Bagir 2014, p. 29). The calling to re-include the Jakarta Charter (a document that placed an obligation on Muslims to abide by Islamic law) in the Constitution was made by a few political parties in 2001 and 2002. At the sub-national level, many provincial and district local governments have tried to implement Islamic law, initiated not only by Islamic political parties but also by the secular ones.
Muslim rejections of practices of different faiths, often followed by violent acts, as well as of the presence of houses of worship of other faiths, have also become more frequently reported in the media (van Dijk and Kaptein 2017, p. 14). In Bogor, West Java, against a Supreme Court Order, some Muslim hard-liner and local government groups continued to use force to prevent Christian churches from holding religious services in 2011. There were also attacks threatening Buddhist sites, along with the destruction of one of the last synagogues in Indonesia (Christian Solidarity Worldwide 2014).
Many of these intolerant acts have been perpetrated by the FPI (Islamic Defenders Front), a militia group established on 17 August 1998 by, as many believed, top figures in the military and police and their associates. Since then, the FPI, with their burgeoning number of followers—approximately two million, coordinated through local representatives in 26 provinces—and the fact that they seem to be able to escape law enforcement actions despite committing vigilante and sometimes violent acts, has been deemed by many observers to be a symbol of religious intolerance in Indonesia.
While the aforementioned cases were associated with minority-but-vocal Islamic hard-liners, attitudes on Islam and relationships with non-Muslims amongst Indonesian Muslims have been adversely transformed, too. This changing attitude has been exemplified by discrimination against Ahmadiya and Shia, as well as opposition to non-Muslims building places of worship in the area2.
Moreover, the emerging popularity of Hizbut Tahrir—a transnational organization championing the caliphate system over democracy—among young people in universities, particularly in non-denomination campuses and in high schools serves as another example of the rise of intolerance. The Hizbut Tahrir had one million followers in 34 provinces and 402 municipalities/cities in 2017 (Tempo Magazine 2017). The growing popularity of the Hizbut Tahrir among university students relative to KAMMI (Indonesian Muslim Student Action Movement)—another movement that has been conservative but more moderate since 1998—may suggest a shift toward right-wing conservatism among young educated Indonesians.
Some micro-evidence has also supported rising public intolerance, suggested by a series of incidents and the growing popularity of radical Islamist organizations. Recent evidence came from a nationally representative survey carried out by Lembaga Survei Indonesia (LSI) of about 1500 respondents, as shown in Figure 1. It showed a clear pattern of rising religious intolerance concerning elected official positions in the last three years. In just a short period between 2016 and 2018, the share of Indonesian Muslims who objected to a non-Muslim presidency increased by 11 percentage points, from 48 to 59 percent. Similar patterns also emerged for the lower ranks of elected public officials.
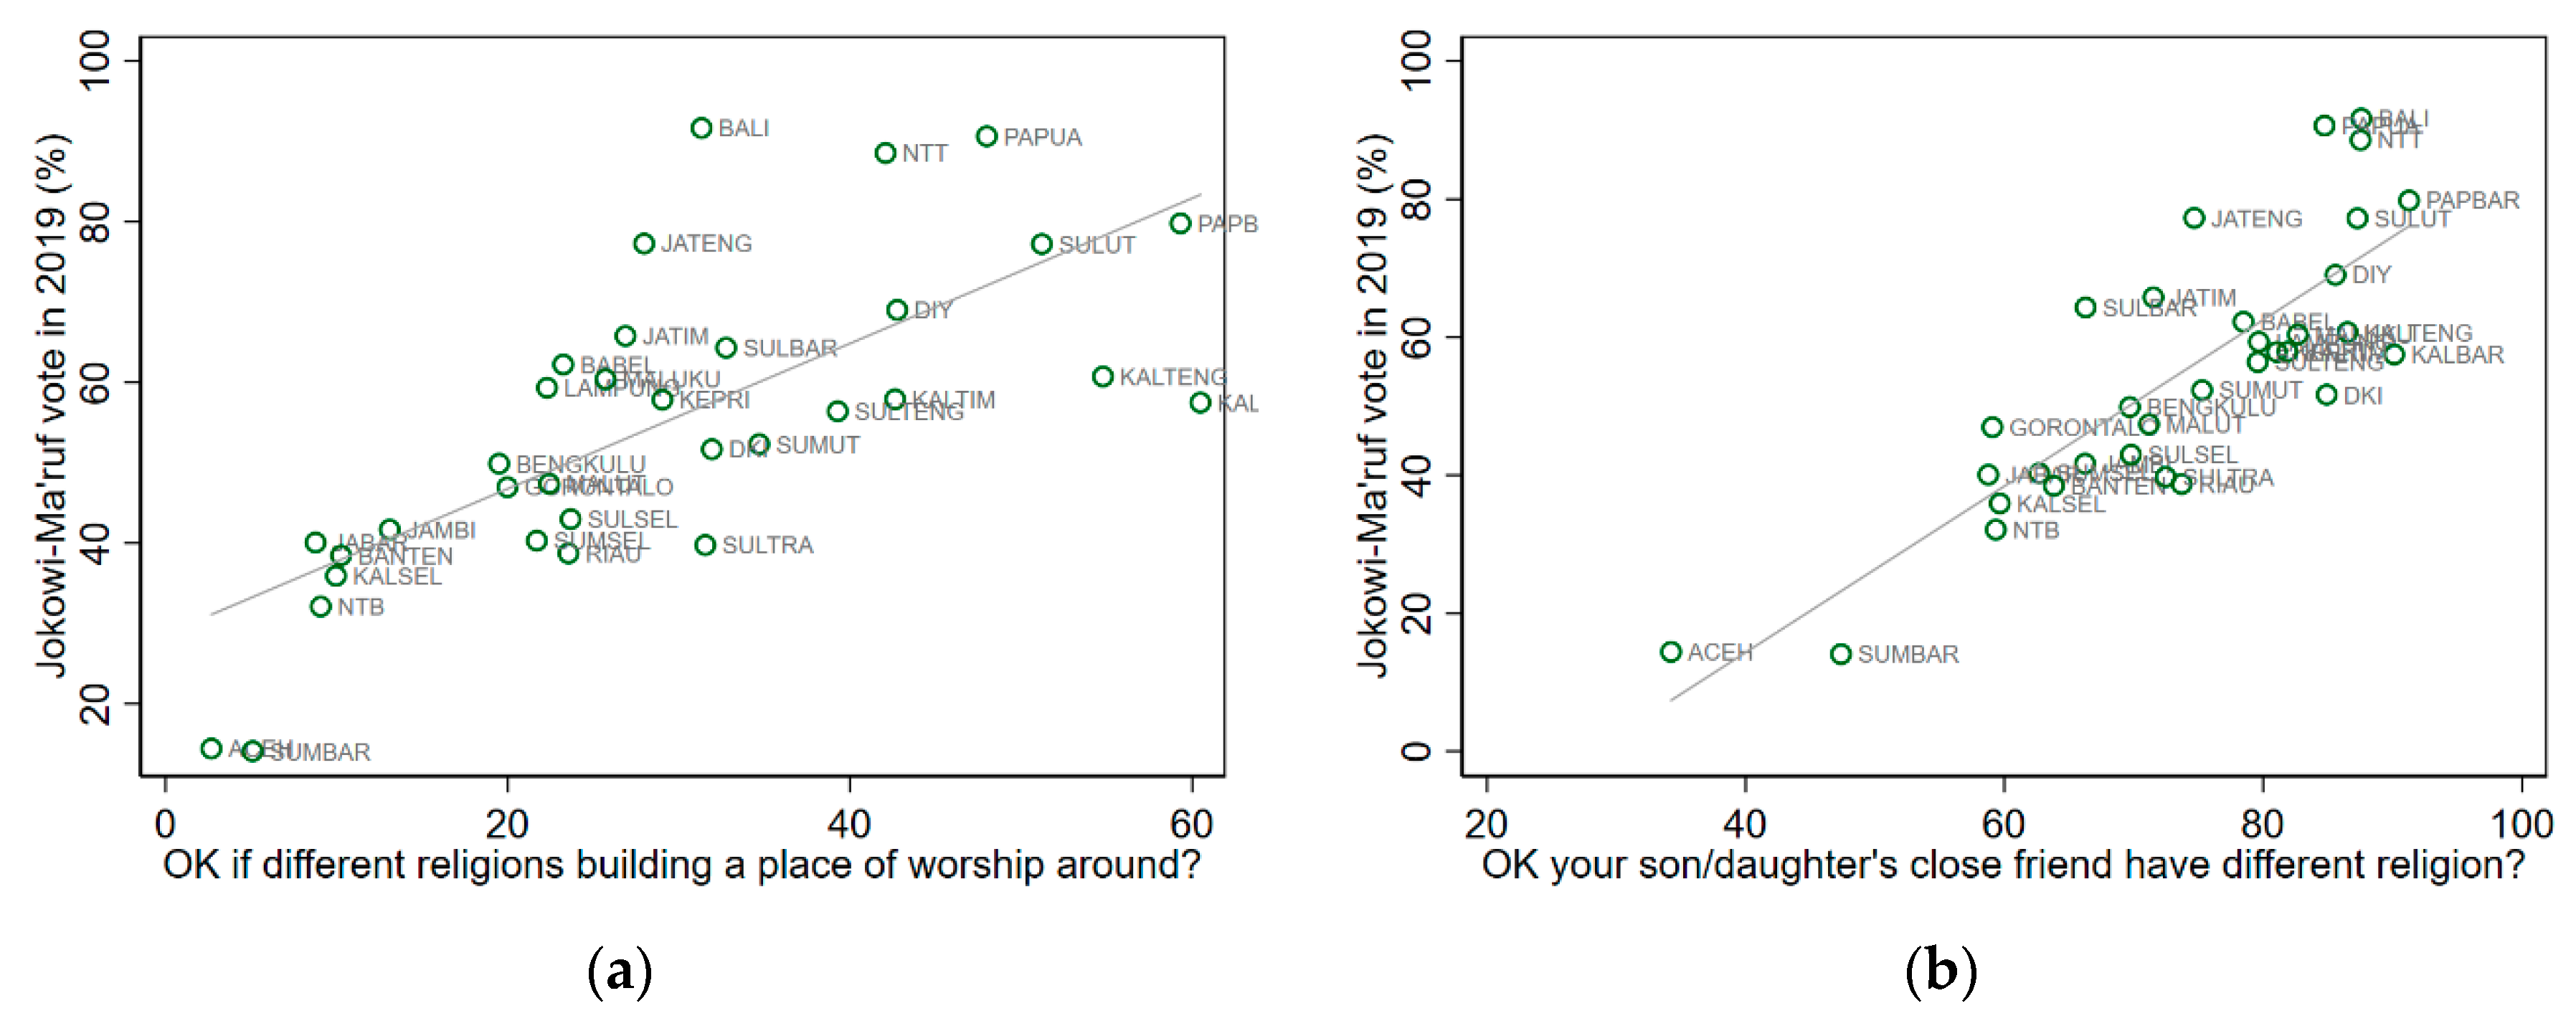
There is also initial evidence that the religious intolerance of voters may have effectively shaped Indonesian politics. A nationwide survey of intolerance of at least 300,000 households in 2014 (SUSENAS data) suggested a clear correlation between the 2019 presidential election results and the religious intolerance level in 2014. In the 2019 presidential election (as well as in the previous election in 2014), the president/vice president candidates Jokowi/Ma’ruf, perceived as nationalist and representing a more moderate form of Islam, directly competed against the candidates Prabowo/Sandi, who were supported by more conservative Islamists (Gueorguiev et al. 2018). Interestingly, as shown in Figure 2, we find strong cross-provincial correlations between various types of religious tolerance and votes for Jokowi/Ma’ruf in the 2019 election: in less tolerant provinces, the more moderate candidates Jokowi/Ma’ruf gained a lesser percentage of the total votes. The statistical correlations are too high to be ignored.
The effect of religious intolerance on electoral politics may also be illustrated by the case of the election of the governor in Jakarta in 2017. Basuki Tjahaja Purnama (a.k.a. Ahok), the outspoken incumbent non-Muslim governor of Jakarta, a rising star in Indonesian politics despite his minority background, was accused of committing blasphemy against Islam3 (Kato 2017, p. 79). After heavy media coverage of his trials, including a live reportage, Ahok was eventually sentenced to jail and lost in the election. Previously the most popular candidate, he could not survive public campaigns from Islamist groups against voting for the non-Muslim candidate.
Other than these electoral politics-related incidences, a series of one-time surveys on the topic have also provided static snapshots of a strong tendency for religious intolerance in recent years. For example, Pusat Pengkajian Islam dan Masyarakat of the State Islamic University (UIN) of Jakarta, in their survey of radicalism amongst 2237 school teachers, found that 50 percent of respondents supported the idea of a Muslim-only Indonesia. The same study found that 33 percent objected to having another faith’s place of worship built in the neighborhood (PPIM-UIN 2019). A survey conducted by the PPIM (Centre of Study for Islam and Society) of UIN (State Islamic University) revealed that more than 80 percent of five hundred Islamic teachers refused to have non-Muslim leaders or the establishment of a non-Islamic place of worship in their neighborhood. They also tended to reject the existence of non-Muslim teachers in their respective schools. The Centre of Study for Religion and Democracy of Paramadina University, the Wahid Institute, and the Ministry of Religious Affairs have also obtained more or less similar results in their research.
Earlier, PPIM-UIN (2018) also found a similar pattern among students. Eighty-seven percent of 1859 surveyed students agreed that the government should ban minorities whose religious practices did not adhere to (mainstream) Islam, such as Ahmadiyah. A survey by the Ministry of Religious Affairs and Wahid Foundation (Wahid Foundation 2016) found that 75 percent of 1600 senior high schoolers supported the caliphate system, around 30 percent understood jihad as fighting with arms against the infidels, and around 60 percent were ready to fight in conflict areas such as Palestine and Syria. Beyond surveys of perception, the Setara Institute (Setara Institute 2009, 2011, 2013) also reported an increasing trend of acts of intolerance between 2007 and 2012.

3. Literature Review

Where is all this rising Islamic conservatism rooted? We argue that there are strong socio-economic factors behind the rising religious intolerance in Indonesia. As a variant of prejudice against the outside group (such as race, ethnicity, or status-based migrant discrimination), the social and economic determinants of such intolerant attitudes at an individual level have been widely discussed and debated in the literature of various disciplines.
In this section, we discuss the relevant theoretical and empirical literature on the determinants of an individual’s prejudice toward outside groups, in order to develop our analytical framework. We adopt theoretical insights from sociology, psychology, and economics to generate possible explanations on why an individual could become less tolerant to an outside group, in general, and apply them to our specific context of religious intolerance. We also explore the related empirical studies, including (but not limited to) the determinants of religious intolerance. To the best of our knowledge, this paper will be the first quantitative study that connects religious intolerance and socio-economic variables at the individual level using large-scale longitudinal survey data in Indonesia—a country that is arguably among the most strategically important in the context of rising Islamic conservatism.
Drawing from the literature in sociology and psychology, Mulder and Krahn (2005) and Stolz (2006) have provided useful summaries of the classification of theoretical approaches on the determinants for outgroup intolerance: scarce resources theory, social contact theory, educational progressivism theory, and community theory.
The scarce resources theory views society as comprising opposing groups, with the most powerful controlling resources and attempting to maintain their advantaged positions (see, e.g., Smelser 1988; Dahrendorf 1959). In this setup, outsiders (such as religious minorities) are seen as threats or competitors that may potentially take away the resources of the majority through means such as labor-force advantages or business opportunities. A variant of this theory is referred to as social identity theory, which also predicts that inter-group conflict instigates feelings of intolerance (Milligan 2012), such that people with less economic security are more likely to feel vulnerable to minorities. The observable implication of these theories is that an individual with job market insecurity and lower economic status (i.e., low income) is more likely to be more intolerant of people with different faiths.
Social contact theory—also called intergroup contact theory in social psychology (see, e.g., Hodson 2011)—suggests that more experiences change attitudes. The argument goes that individuals with more contact with the outside groups (such as people with different faiths) will come to know them better, feel less threatened, and be more likely to accept them as part of their community. The empirical evidence of this theory has been well established. Pettigrew and Tropp (2006), for example, conducted a meta-analysis of 515 studies and found that intergroup contact typically reduced intergroup prejudice. One of the observable implications of this theory is that people who experience more mobility (socially or geographically) tend to be more tolerant.
Educational progressivism theory, as a part of modernization theory (see e.g., Lipset 1959), implies that education reduces prejudice. This idea relies on the role of (liberal) education in promoting acceptance toward outside groups and that an individual learns to become more tolerant through education. Empirically, Mulder and Krahn (2005), Guimond and Palmer (1989), and Chandler and Tsai (2001) confirmed that learning to be tolerant happens at schools, colleges, or universities. Educational attainment has been shown to generally lead to more appreciation and tolerance of other social groups (Jackman 1978; Coenders and Scheepers 1998). If this theory holds, individuals with higher educational attainment tend to be more intolerant to those with different religions.
Community theory, proposed by Mulder and Krahn (2005), argues that the spatial community—the location—plays a significant role by providing the context within which group interactions take place and attitudes and beliefs are shaped. Specific community characteristics, such as population density or social inequality, can generate negative attitudes toward people from different groups. The economic development of a community also affects individual prejudice, as demonstrated by Andersen and Fetner (2008), who found that a combination of economic growth and increasing inequality had a significant contribution to intolerant social attitudes and values. One observable implication of this theory is that poverty and inequality in the community where an individual lives have strong associations with higher religious intolerance, which has been confirmed by Milligan (2012) in his cross-country study.
Another strand of literature links prejudices with the level of religiosity (see, e.g., Scheepers et al. 2002). Starting with the seminal works of Allport and Kramer (1946) and Allport (1966) in social psychology, this line of thought suggests a positive correlation between religious commitment and prejudice (particularly, racial prejudice). While this theory has mainly focused on racial or ethnic prejudices, it is natural to expect an even stronger positive association between religiosity and the level of intolerance to people with different religions.
Specific to the determinants of religious intolerance, most existing empirical studies have agreed with the scarce resource and social identity theories. Lower job security, income, and other variables that measure social and economic status have been associated with higher intolerance to people of different religions. For example, Moors (2004), Reutter et al. (2006), and Haubert and Fussell (2006) found that income level affected the ability to tolerate minorities. Strabac and Listhaug (2008) also found similar effects with respect to an individual’s job security. On the other hand, Hughes (2013) and Moore and Ovadia (2006) confirmed that an individual’s level of religiosity is strongly associated with their level of religious intolerance, which serves as a confirmation of religiosity theory.
For the community theory, Milligan (2012) and Wilson (2017) found that an income or wealth gap in the location where an individual lives adversely affected religious tolerance. Millington (2016) and Finke and Stark (2003) showed that individuals who live in cities (urban settings) tended to be more tolerant, simply because they lived in a culturally, ethnically, or racially diverse environment, relative to those who live in rural areas.
Other than the theories of social behavior, an individual’s demographic variables (e.g., age, sex, and marital status) have also been proposed as potential predictors of religious intolerance (Franssen et al. 2013; Aydin et al. 2014; Kossowska and Sekerdej 2015).

4. Methodology

4.1. Econometric Specifications

We estimated the effects of the socio-economic covariates on an individual religious intolerance using the following specification:
y i j t * = X i t β j + α j i + u j i t ,
where y i j t * is a latent continuous variable of the ith individual’s level of intolerance toward j = 1, …, M types of religious intolerance at time t; X i t are the observed time-varying social, economic, demographic, and community characteristics of an individual i; α i are unobserved time-invariant individual effects that may affect religious intolerance (e.g., traits, personality, parental influences, exposure to violence/discrimination during childhood, etc.); β is the K × 1 vector of parameters to be estimated; and u i j t are idiosyncratic unobservable factors (i.e., the error term).
We observed that:
y i j t = { 1   0 i f i f y i j t * > 0 y i j t * 0 .
Therefore, our model became the probability of observing intolerance to various kinds of interactions with others of different religions, or:
Prob ( y i j t = 1 | X i t ) =   F ( β j X i t + α i j ) ,
where F(⋅) is a logistic cumulative distribution function, thus making the model a logit model with a fixed effect at the individual level. This model was first suggested by Chamberlain (1980). In particular, y = 1 if individual i is tolerant at time t and y = 0, otherwise the same applies where x is a vector of covariates. We have T observations (t = 1, …, T) within each of the N groups (i = 1, …, N). In this paper, t = {2007,2014} and i represents the individuals. Our primary concern was the estimation of β j , a parameter vector common to all groups. The role of α i j is to control for group-specific effects (i.e., for omitted variables that are time-invariant/constant within a group). The reason for using this model was from a strong theoretical basis—particularly from socio-psychological theory—which suggests that traits and personality may naturally affect prejudice, including tolerance of others with different faiths (see, e.g., Case et al. 2008; Sibley and Duckitt 2008; Ekehammar et al. 2004). Our choice of modeling strategy minimized the bias induced by unobservable confounding factors by controlling at least the time-invariant unobservable factors which may affect intolerance. The need to use such a model is more pronounced when there is reason to believe that these unobserved factors are correlated with x. Our x includes, for example, religiosity and educational attainment which are, by nature, correlated with traits and personality.
In addition to specific types (j) of religious intolerance measures, we also constructed the following aggregate index of religious intolerance:
z i t = j = 1 M y j i t ,
and regressed it on the following specification:
z i t = X i t β + α i + u i t ,
where z i t has a minimum value of 0 (the lowest level of intolerance) and a maximum value of M (the highest level of intolerance). An individual who objected to all M questions scored the maximum value of M. On the other hand, if they objected to none, then they scored 0. Those who objected to at least one of any of the M questions scored between 0 and M.
As discussed previously, our fixed-effect regression methodology offers a novelty in minimizing the effects of unobservable confounding factors. In finding relevant and important correlations with religious intolerance at the individual level, ignoring these unobservable confounding factors (which are very likely to be correlated with the other, observable factors) makes the estimated association between the observed factors on religious intolerance more likely to be biased or inconsistent. The best examples of such unobserved confounding factors are traits and personality, which naturally may affect prejudice, including tolerance of others with different faiths (see, e.g., Case et al. 2008; Sibley and Duckitt 2008). Our fixed-effect panel data regressions minimized bias out of these unobservable confounding factors by controlling the time-invariant unobservable factors that may have affected intolerance and been correlated with other observable factors (Maddala 1971; Amemiya 1971; Wooldridge 2002; Greene 2003).

4.2. Data and Variables

Our primary data set was the Indonesian Family Life Survey (IFLS), a longitudinal socio-economic and health survey representing approximately 83% of the Indonesian population and containing over 30,000 individuals living in 13 out of the 34 Indonesian provinces (Figure 3)4. Only a few large-scale longitudinal surveys are available for developing countries5, not to mention those containing information on various aspects of religious intolerance. In this respect, the IFLS is unique and among the exceptions. In this study, we utilized IFLS-4 (2007/2008) and IFLS-5 (2014) to generate the variables of an individual’s level of intolerance, economic status (income), education, age, marital status, religiosity, and employment status. To complement the IFLS, we constructed more location-specific information from the National Socio-Economic Surveys (SUSENAS) for 2007 and 2014. For this study, only individuals who were Muslim were included in the sample. As a result, we dropped the non-Muslims (10% of respondents) from the sample.
For the main dependent variable of religious intolerance level, we chose the following specific questions from IFLS 2007 and 2014 as our measures of an individual’s religious intolerance:
  • How would you feel if someone with a different faith from you lives in your village?
  • How would you feel if someone with a different faith from you lives in your neighborhood?
  • How would you feel if someone with a different faith from you rents a room from you?
  • How would you feel if someone with a different faith from you marries one of your close relatives or children?
  • What would you think if people who have a different faith from you built a house of worship in your community?
For each question, respondents were asked to choose the following set of options: (1) strongly objected; (2) objected; (3) no objection; or (4) no objection at all. We assigned the dependent variable (intolerance) y i j t = 1 if the respondent responded with 1 or 2; and y i j t = 0 , otherwise (3 or 4).
Based on the theoretical and empirical literature discussed above, our main individual-specific independent variables were income level, educational attainment, job security status, level of religiosity, and demography (age, gender, and marital status). We defined an individual’s income to be the logarithm of the monthly expenditure per person in the respondent’s household in nominal Indonesian currency (Rupiahs). In Indonesia, as in many other developing countries, using expenditure instead of income is more advisable, due to the level of uncertainty caused by the under-reporting of income. For education factors, we grouped respondent’s highest educational attainment into five ordinal categories: no primary school, primary school, junior secondary school, senior secondary school, or university. We classified an individual as having a secure job if he or she worked as a salaried government worker, a worker in the private sector, or owned a business employing at least one permanent/salaried worker. An individual who worked as a casual worker, family worker, or was self-employed without employing permanent workers was classified as having a non-secured job. Based on a respondent’s answer to a question on his/her religiosity, their level of religiosity was defined as one of four categories: not religious, somewhat religious, religious, or very religious.
Our location-specific independent variables were the urban status and poverty and inequality situation in the location where the respondent resided. We generated a respondent’s urban status from the IFLS and constructed poverty and inequality variables using SUSENAS. We used the number of poor people and Gini coefficients as the poverty and inequality variables. However, we also used an income share of 10%, 5%, or 1% richest households in the cities where they lived as alternative variables, for robustness checks. We used the official poverty line from the Indonesian Statistics Agency (BPS).
We also included demographic variables (i.e., age, sex, and marital status) as control variables.
Table 1 shows the summary statistics of both dependent variables and covariates.

5. Findings and Discussion

Our main findings are presented in Table 2 and Table 3. Table 2 gives the estimates based on the Conditional Fixed-effects Logit Model and Table 3 is based on the model where the index of a combination of five different intolerances was used as the dependent variable. We also present regression results, based on different measures of inequality indicators (Gini coefficient and Income share of the richest 10%, 5%, and 1%), in the Appendix A. Furthermore, for the purpose of comparison, we also report the regression results using the Linear Probability Model (LPM) in the Appendix A.
We found that, in general, an individual’s income level was negatively associated with their level of religious intolerance. Therefore, individuals with higher levels of income tended to be more tolerant of various kinds of interactions with others of different faiths, except for inter-faith marriage involving a relative. In other words, people with higher incomes (such as the rich) tended to have lower levels of religious intolerance, while people with lower incomes (such as the poor) tended to have stronger levels of religious intolerance. It should be noted that this relationship was conditional on our controlling for other factors that may have also affected religious intolerance. These correlations were in line with the predictions from social identity theory or scarce resource theory, which suggest that prejudice or intolerance against people outside their own religion is driven by a perceived threat to economic opportunities (Smelser 1988; Dahrendorf 1959).
To address the possibility of a non-linear relationship between income (per capita expenditure) and religious intolerance, we ran different regressions with different specifications for the income variables. Instead of using expenditure per capita as a continuous variable, we divided it into quintiles (five categories of expenditure per capita), from low to high income. We converted the category into four dummy variables (quantiles 2–5), with quintile 1 as the reference category. The results (Table 4) suggest that the coefficients of the quintile variables were noticeably different, suggesting a non-linear relationship. In particular, we found that only quintiles 3–5 had coefficients that were statistically significant at the standard level. The statistically insignificant coefficient of Quintile 2 suggests that income did not affect (reduce) religious intolerance in the low domain of income. In other words, we need to reach a certain point of income to find a negative association between income and intolerance.
Nevertheless, the relatively low correlation between income levels with acceptance of inter-faith marriage in the family merits an explanation: One possible explanation is that accepting a marriage to a non-Muslim, particularly for women, is probably the strongest form of tolerance as, based on standard Islamic teaching in most Muslim majority countries, inter-faith marriage is prohibited or is very difficult to do (Law Library of Congress 2015)6. This rule, however, is more relaxed for men, as men are still allowed to marry non-Muslim women under certain conditions (but not the other way around). Such a strict tolerance benchmark is reflected in the relatively low coefficients of income level for interfaith marriage. In the conditional fixed-effect logit model (correcting for the non-linearity of the prediction of non-tolerance), the level of income was not statistically significant.
Quality of employment has also generally been negatively associated with religious intolerance. Lending more support are the scarce resource or social-identity theories, where religious intolerance is an expression or response to what an individual considers to be a perceived economic threat from an outside group (in this case, religious minorities). The coefficients of having a secure job were negative and significant in three out of four regressions in the specification with overall intolerance index as the dependent variable.
Moreover, our regression analysis confirmed that education mattered, but only at a certain level of education. A statistically significant association only occurred when an individual’s educational attainment was higher than junior-secondary school, especially for university-level education or higher. In other words, people with a university education tended to have stronger level of tolerance of others with different religions than people who did not have a university education (after taking the effects of other variables into account). This finding supports either the education progressivism theory or the social contact theory. In line with social contact theory, in Indonesia, besides academic skills, university students have much wider opportunities to interact with a more diverse group of individuals coming from all over the country, including regions with a different religious majority (e.g., non-Islam North Sumatera or Eastern Indonesia). Educational progressivism theory is harder to explain, as there was no substantial evidence to suggest that tertiary education is significantly more progressive. In fact, many reports (see PPIM and UNDP 2018) have suggested that schools and universities, especially elite universities, tend to be breeding grounds for religious conservatives, even more so than the traditional educational institution of pesantren7.
Our findings that only exposure to tertiary education had a robust association with religious tolerance deserves further explanation: As suggested by various studies (e.g., Kurniawati et al. 2018), Indonesian basic and secondary education has not yet been translated into an improvement in learning. Thus, the non-significant influence of primary and secondary education on religious intolerance may simply reflect the general low quality of education in Indonesia. However, Beatty et al. (2018) showed that, in fact, learning outcomes are very low (and declining) at all educational levels, including the tertiary level. Combined with the reported rising trend of conservatism in universities, a more likely explanation is that exposure or contact with more diverse groups compensated for the non-existent or decreasing educational progressivism effects in schools and universities. The fact that education, particularly primary and secondary education, does not lead to social progressivism in Indonesia poses serious policy challenges.
We also found that the level of (self-declared) religiosity was highly associated with religious intolerance. In other words, individuals who believed that they were more religious tended to be more intolerant of others with a different faith. Using the baseline (or point of comparison) of an individual who claimed he/she was not religious, the size of the coefficients of the dummy variables of each level of self-declared religiosity increased. The significant positive associations between religiosity and religious intolerance were robust to all measures of intolerance and model specifications. In fact, religiosity was the only variable at the individual level that had a strong and statistically significant association with all kinds of religious intolerance, including inter-faith marriage.
Our findings on the strong influence of religiosity on intolerance in Indonesia agree with the general findings of the empirical literature on the subject (Allport and Kramer 1946; Allport 1966; Scheepers et al. 2002; Hughes 2013; Moore and Ovadia 2006). As discussed in the introduction, the rising tendencies of religious intolerance in Indonesia are concerning. The IFLS data of 2007 and 2014 show an increasing trend of religiosity. In 2007, for example, out of around 29,000 IFLS respondents, only 5.4% claimed to be ‘very religious’. Seven years later, in 2014, this figure increased to 16.4%. If religious tolerance is a desirable societal objective and target of policy intervention, then the government needs to find ways to mediate the effects of increasing religiosity on religious intolerance. One way of doing this is to promote and strengthen the teachings of moderate Islam, which have had a long tradition in the country.
Another cross-national study was undertaken by Norris and Inglehart (2011). They used the concept of existential security to explain that people under circumstances of existential insecurity tend to be more attracted to religion than people with a higher level of security do. They concluded that a sense of vulnerability driven by economic inequality enables the rise of religiosity. Our study provides an additional explanation for their thesis on the correlation between human development and religiosity. Unlike for our study, theirs did not specifically address whether people that are increasingly interested in religion (more religious), become increasingly less tolerant. However, they did find that there was no positive association between religiosity and tolerance in any countries (except for the U.S.A.) and that participation in religious activities is correlated with a low level of social capital, which could partially explain the rise of intolerant practices.
Furthermore, we used three variables to test the community theory: location (urban or rural area), inequality (Gini coefficient or income share of the richest within districts), and the extent of poverty. It turned out that residential status—living in an urban or rural area—was generally not associated with the individual level of religious intolerance. However, we found that inequality and the extent of poverty were strongly associated with the individual level of intolerance. Individuals living in municipalities with higher income inequality had a stronger tendency to be less tolerant of others with different religions, taking into account other factors that may affect intolerance. These associations were robust across all types of religious intolerance, as well as across the inequality measures considered: Gini coefficient and the income share of the richest 10%, 5%, and 1% of the population (see the Appendix A for the results using inequality indicators other than Gini coefficient). This result confirms the results several other studies, such as Andersen and Fetner (2008) and Milligan et al. (2014), both of which used World Value Survey data. The findings of Milligan et al. (2014), in particular, were closer to those of this paper, as they used individual-level data from 23 Muslim-majority and western countries. Specific to Indonesia, we observed that the period of rising Islamic conservatism and intolerance coincided with a period of rising inequality, culminating in 2011 when the national Gini coefficient reached a physiological threshold of 0.40 (Yusuf et al. 2014).
In support of the community theory, our regression analysis also suggested that individuals tended to be more intolerant if he/she lived in a city with a larger number of poor people. The coefficients of poverty—the number of people who live below the national poverty line—were positive and statistically significant in all model specifications. We interpret this as the visibility of poverty adversely affecting religious intolerance.
It is natural to argue that the effect of income on religious intolerance is more pronounced in mostly poor communities than in less poor communities. To test this, we included the interaction of expenditure per capita and the number of poor people in the communities. The result (as reported in Table A5 in the Appendix A) did not support such ideas, as the coefficient of the interacting variables were insignificant at the standard level in all types of intolerance regressions.
We compared and contrasted the results between the different dependent variables (different types of intolerance) by comparing the statistical significance and the strength of the association of the same variables on different kinds of intolerance (dependent variables). It should be noted that one can interpret moving from column one to column four as getting more personal, in terms of direct interaction. For example, the dependent variable in column one represents whether an individual objected to others with different religions living in the same village (i.e., sharing the same village). As we move to the second column, the dependent variable is whether an individual objected to others with different religions living in the same neighborhood (i.e., sharing the same neighborhood). In the third column, the dependent variable is whether an individual objected to others with different religions sharing a room in one’s house (cohabitation). Finally, column four is for the dependent variable of whether an individual objected to others with different religions marrying his/her relative. Thus, there is a gradient of personalization of interaction from the dependent variable in column 1 to column 4. The dependent variable in the last column (whether an individual objected to others with different religions building a place of worship) should be regarded as not directly related to the gradient of closeness of potential interaction. That being said, we noticed that the association between religiosity and intolerance was similarly strong across the different dependent variables.
By comparing the strength of the influence of the same variables on different types of intolerance, we highlight the following: First, for at least the three variables of income, job security, and having a university education, the effect on intolerance was weakened as we move from the intolerance of others with a different religion living in the same village, then the same neighborhood, and then the same house. In other words, the more personal the interaction, the less powerful the effect of those variables on reducing intolerance. As discussed previously, none of these three variables were associated with intolerance to inter-faith marriage to family members. Second, we did not see any systematic pattern across different dependent variables on the effect of religiosity among the most robust predictors of intolerance, as well as intolerance itself. However, unlike the effects of income, job security, and tertiary education, intolerance of inter-faith marriage to family members was strongly affected by level of religiosity. Finally, the effects of inequality and poverty were practically similar across different types of intolerance.
Our findings that inequality is strongly correlated with religious intolerance contribute to the already political economic debates on the issue. With an increasing trend of inequality in many countries, including Indonesia, our findings provide additional support for the urgency of reducing inequality and poverty beyond economic redistribution, as both also undermine social cohesion and increase divisive identity politics. Policy-wise, our findings also lend support for the development of better social protection and related taxation policies.

6. Conclusions

In this paper, we have shown that Indonesia, the largest Muslim democracy, faces both democratization and rising Islamic conservatism. The rise of conservatism has also been accompanied by an increase in religious intolerance amongst Indonesians, posing a serious threat to the idea of pluralist democracy and a moderate Islam.
Against this backdrop and drawing from the sociological and psychological literature, we developed possible predictors for an individual’s level of religious intolerance in Indonesia. We then tested the plausibility of those predictors in explaining the recent rise of religious intolerance at the individual level by using longitudinal Indonesian Family Life Survey (IFLS) data from 2007 and 2014 and employing fixed-effects regression analysis.
Our results support the scarce resource theory, as we found that an individual’s income level and quality of employment were generally positively associated with his or her level of religious tolerance. We also found that having a tertiary education was positively associated with religious tolerance and tended to assign effects confirming the social contact theory, instead of observing the effects of educational progressivism. We also found that religiosity was associated with a stronger level of religious intolerance. This finding confirms what is known as the religiosity theory of intolerance. In support of the community theory, we found a strong and robust association between the level of inequality and the extent of poverty in the district where an individual resides with his/her level of religious intolerance. Individuals living in municipalities with higher income inequality and a larger number of poor people tended to have a stronger level of religious intolerance.
If religious tolerance is a socially desirable objective, as well as a subject of public policies, what can these findings tell us? Our analysis provides some clues as to the best predictors of the rising religious intolerance in the 2000s. In the 2000s, income inequality rose rapidly and Islamic conservatism showed an increasing trend. These two factors were among the most robust predictors of religious intolerance based on our regression analysis. Meanwhile, in order to reduce religious intolerance, the following policies should be consistent with our findings: The first involves supporting more moderate Islamic teaching, which already has a long tradition in the country. Moderate Islam may support the notion that being religious is not mutually exclusive with being tolerant. The second involves accelerating the increase in access to higher education. Not only this will increase the skills of Indonesian youth, but it will also expose them to a diverse, multi-cultural, and plural society. Thirdly, any policies to reduce income inequality should be supported, not only based on economic justice, but also based on the ideal of religious harmony.
Finally, we acknowledge that our study has several shortcomings. First, our analysis does not establish causation. To identify causation, we need to assume the exogeneity (pure randomness) of all the covariates, which was not the case, or to find other methods to correct for endogeneity in the covariates, such as using instrumental variables. Finding these exogenous instruments can be a challenge. Secondly, in testing the community theory, such as the effect of inequality on religious intolerance, many individuals within the same community are exposed to the same level of inequality. A multi-level regressions analysis can potentially do better in drawing statistical inferences in this kind of situation. While acknowledging these important shortcomings, we leave them for further research.

Author Contributions

Conceptualization, A.A.Y.; Literature Review, A.A.Y., H.H., and A.R.S.; Methodology, A.A.Y. and A.R.S.; Software, A.A.Y.; Validation, A.A.Y. and A.R.S.; Formal analysis, A.A.Y. and A.R.S.; Investigation, A.A.Y. and A.R.S.; Resources, A.A.Y. and A.R.S.; Data curation, A.A.Y.; Writing—original draft preparation, A.A.Y., A.R.S., and H.H.; writing—review and editing, A.A.Y., A.R.S., and H.H.; visualization, A.A.Y. All authors have read and agreed to the published version of the manuscript.

Funding

This research received no external funding.

Acknowledgments

We would like to thank the Ministry of Research, Technology and Higher Education of Indonesia for providing funding for the corresponding author to visit Leiden University to finalize this paper under the Scheme of Academic Mobility and Exchange (SAME) 2019. This research was partially funded by the Indonesian Ministry of Research, Technology and Higher Education under the World Class University (WCU) Program managed by Institut Teknologi Bandung. The research assistance of Putri Riswani and Megananda Suryana of Universitas Padjadjaran is also appreciated. We also thank three anonymous referees for their helpful comments and suggestions.

Conflicts of Interest

The authors declare no conflict of interest.

Appendix A

Table A1. Regression results (Fixed-effect liner probability Model with Gini coefficient).
SHRVILLSHRNEIGSHRROMMARRYBUILD
(1)(2)(3)(4)(5)
Per capita expenditure (log)−0.0270 ***−0.0262 ***−0.0269 ***−0.0157 ***−0.0349 ***
(0.00640)(0.00633)(0.00720)(0.00533)(0.00699)
Secured job [1,0]−0.0154 *−0.0102−0.01040.00156−0.0129
(0.00801)(0.00808)(0.00975)(0.00732)(0.00965)
Education
Primary education [1,0]0.0267−0.000649−0.04370.0118−0.0131
(0.0292)(0.0284)(0.0309)(0.0244)(0.0275)
Junior secondary education [1,0]0.00593−0.0258−0.02650.0176−0.00741
(0.0359)(0.0348)(0.0378)(0.0293)(0.0342)
Senior secondary education [1,0]−0.0303−0.0513−0.0720 *0.0122−0.0581
(0.0387)(0.0382)(0.0416)(0.0320)(0.0381)
Tertiary education [1,0]−0.0680−0.0782 *−0.0923 **0.00474−0.0703 *
(0.0415)(0.0414)(0.0461)(0.0349)(0.0427)
Religiosity
Very religious [1,0]0.0628 ***0.0789 ***0.0479 *0.0416 *0.0838 ***
(0.0223)(0.0220)(0.0251)(0.0219)(0.0246)
Religious 1[1,0]0.0590 ***0.0727 ***0.0698 ***0.0509 **0.0753 ***
(0.0197)(0.0193)(0.0226)(0.0204)(0.0225)
Somewhat religious [1,0]0.02480.0320 *0.0497 **0.0483 **0.0605 ***
(0.0195)(0.0191)(0.0226)(0.0205)(0.0226)
Community characteristics
Urban areas [1,0]0.0348 ***0.003740.01360.003510.0128
(0.0129)(0.0131)(0.0140)(0.0101)(0.0136)
Gini coefficient of inequality 0.310 ***0.411 ***0.396 ***0.154 ***0.00725
(0.0652)(0.0660)(0.0767)(0.0567)(0.0756)
Number of poor people (Log)0.0340 ***0.0393 ***0.0612 ***0.0143 *0.0891 ***
(0.00859)(0.00888)(0.0108)(0.00738)(0.0107)
Constant0.380 *0.137−0.1940.488 ***0.229
(0.225)(0.231)(0.250)(0.187)(0.238)
Individual fixed effectYESYESYESYESYES
Year effectYESYESYESYESYES
Island dummiesYESYESYESYESYES
Demographic controls
Age (and age-squared)YESYESYESYESYES
Marital statusYESYESYESYESYES
No. of Observations49,58449,58449,58449,58449,584
R-squared0.0080.0090.0080.0090.010
Number of pid32,92032,92032,92032,92032,920
Note: Robust standard errors in parentheses; *** p < 0.01, ** p < 0.05, * p < 0.1; [1,0] indicates a dummy variable. SHRVILL = Do you object if someone with different faith from you live in your village? [1,0] SHRNEIG = Do you object if someone with different faith from you live in your neighborhood? [1,0]. SHRROM = Do you object if someone with different faith from you rent a room from you? [1,0]. MARRY = Do you object if someone with different faith marry one of your close relatives or children? BUILD = Do you object if people who have different faith build a house of worship in your community? [1,0].
Table A2. Regression results (Fixed-effect conditional logit Model), Richest 1%.
SHRVILLSHRNEIGSHRROMMARRYBUILD
(1)(2)(3)(4)(5)
Per capita expenditure (log)−0.176 ***−0.164 ***−0.143 ***−0.156 **−0.204 ***
(0.0540)(0.0448)(0.0427)(0.0637)(0.0457)
Secured job [1,0]−0.135 **−0.0844−0.05570.00862−0.0732
(0.0671)(0.0649)(0.0568)(0.0624)(0.0622)
Education
Primary education [1,0]0.153−0.0274−0.2250.0837−0.0507
(0.158)(0.192)(0.149)(0.186)(0.175)
Junior secondary education [1,0]0.0240−0.194−0.1350.154−0.0328
(0.207)(0.216)(0.158)(0.250)(0.227)
Senior secondary education [1,0]−0.282−0.372−0.409 *0.137−0.337
(0.238)(0.262)(0.211)(0.320)(0.252)
Tertiary education [1,0]−0.663 **−0.643 **−0.526 **0.0927−0.426
(0.284)(0.314)(0.250)(0.352)(0.306)
Religiosity
Very religious [1,0]0.449 ***0.577 ***0.284 *0.295 **0.453 ***
(0.141)(0.177)(0.171)(0.147)(0.123)
Religious 1[1,0]0.462 ***0.546 ***0.411 **0.390 ***0.408 ***
(0.133)(0.168)(0.160)(0.146)(0.103)
Somewhat religious [1,0]0.1940.2580.287 *0.375 **0.334 ***
(0.140)(0.182)(0.158)(0.159)(0.105)
Community characteristics
Urban areas [1,0]0.259 ***0.07650.09960.08560.106
(0.0824)(0.0886)(0.0915)(0.122)(0.0821)
Income share of the richest 1% 5.226 ***6.588 ***6.174 ***−0.5631.498
(1.379)(1.140)(1.274)(1.528)(0.965)
Number of poor people (Log)0.316 ***0.282 ***0.321 ***0.167 *0.506 ***
(0.0807)(0.0637)(0.0751)(0.0871)(0.0663)
Individual fixed effectYESYESYESYESYES
Year effectYESYESYESYESYES
Island dummiesYESYESYESYESYES
Demographic controls
Age (and age-squared)YESYESYESYESYES
Marital statusYESYESYESYESYES
No. of Observations9466955012,304667211,552
Number of pid47334775615233365776
Note: Bootstrapped standard errors in parentheses; *** p < 0.01, ** p < 0.05, * p < 0.1; [1,0] indicates a dummy variable. SHRVILL = Do you object if someone with different faith from you live in your village? [1,0]. SHRNEIG = Do you object if someone with different faith from you live in your neighborhood? [1,0]. SHRROM = Do you object if someone with different faith from you rent a room from you? [1,0]. MARRY = Do you object if someone with different faith marry one of your close relatives or children? BUILD = Do you object if people who have different faith build a house of worship in your community? [1,0].
Table A3. Regression results (Fixed-effect conditional logit Model), Richest 5%.
SHRVILLSHRNEIGSHRROMMARRYBUILD
(1)(2)(3)(4)(5)
Per capita expenditure (log)−0.170 ***−0.156 ***−0.140 ***−0.152 ***−0.204 ***
(0.0390)(0.0519)(0.0392)(0.0475)(0.0359)
Secured job [1,0]−0.139 **−0.0904−0.05630.00880−0.0738
(0.0646)(0.0756)(0.0557)(0.0796)(0.0522)
Education
Primary education [1,0]0.154−0.0276−0.2270.0883−0.0517
(0.184)(0.155)(0.146)(0.211)(0.179)
Junior secondary education [1,0]0.0215−0.198−0.1320.173−0.0347
(0.217)(0.193)(0.182)(0.253)(0.234)
Senior secondary education [1,0]−0.284−0.375−0.408 **0.152−0.337
(0.274)(0.272)(0.199)(0.267)(0.233)
Tertiary education [1,0]−0.670 **−0.656 **−0.529 **0.116−0.429
(0.283)(0.292)(0.222)(0.338)(0.264)
Religiosity
Very religious [1,0]0.456 **0.579 ***0.292 *0.299 **0.453 ***
(0.180)(0.160)(0.149)(0.139)(0.139)
Religious 1[1,0]0.469 ***0.545 ***0.417 ***0.393 ***0.407 ***
(0.158)(0.158)(0.129)(0.130)(0.113)
Somewhat religious [1,0]0.2010.2570.291 **0.378 ***0.333 ***
(0.159)(0.158)(0.123)(0.135)(0.124)
Community characteristics
Urban areas [1,0]0.247 ***0.05690.08140.08850.102
(0.0772)(0.0838)(0.0744)(0.116)(0.0695)
Income share of the richest 5%4.237 ***5.514 ***4.643 ***1.0900.822
(0.710)(0.683)(0.806)(0.965)(0.584)
Number of poor people (Log)0.316 ***0.287 ***0.328 ***0.172 **0.507 ***
(0.0639)(0.0804)(0.0638)(0.0803)(0.0686)
Individual fixed effectYESYESYESYESYES
Year effectYESYESYESYESYES
Island dummiesYESYESYESYESYES
Demographic controls
Age (and age-squared)YESYESYESYESYES
Marital statusYESYESYESYESYES
No. of Observations9466955012,304667211,552
Number of pid47334775615233365776
Note: Bootstrapped standard errors in parentheses; *** p < 0.01, ** p < 0.05, * p < 0.1; [1,0] indicates a dummy variable. SHRVILL = Do you object if someone with different faith from you live in your village? [1,0]. SHRNEIG = Do you object if someone with different faith from you live in your neighborhood? [1,0]. SHRROM = Do you object if someone with different faith from you rent a room from you? [1,0]. MARRY = Do you object if someone with different faith marry one of your close relatives or children? BUILD = Do you object if people who have different faith build a house of worship in your community? [1,0].
Table A4. Regression results (Fixed-effect conditional logit Model), Richest 10%.
SHRVILLSHRNEIGSHRROMMARRYBUILD
(1)(2)(3)(4)(5)
Per capita expenditure (log)−0.173 ***−0.159 ***−0.142 ***−0.153 ***−0.205 ***
(0.0448)(0.0428)(0.0492)(0.0465)(0.0432)
Secured job [1,0]−0.139 **−0.0915−0.05750.00832−0.0742 *
(0.0651)(0.0687)(0.0593)(0.0686)(0.0427)
Education
Primary education [1,0]0.149−0.0280−0.2290.0892−0.0533
(0.150)(0.137)(0.142)(0.218)(0.177)
Junior secondary education [1,0]0.0204−0.198−0.1390.174−0.0361
(0.217)(0.200)(0.187)(0.255)(0.177)
Senior secondary education [1,0]−0.280−0.366−0.412 *0.154−0.339 *
(0.290)(0.254)(0.217)(0.279)(0.199)
Tertiary education [1,0]−0.674 **−0.660 **−0.531 **0.118−0.428 *
(0.338)(0.291)(0.261)(0.340)(0.244)
Religiosity
Very religious [1,0]0.456 ***0.578 ***0.288 *0.299 *0.455 ***
(0.160)(0.137)(0.147)(0.155)(0.161)
Religious 1[1,0]0.467 ***0.545 ***0.414 ***0.393 ***0.408 ***
(0.162)(0.131)(0.126)(0.130)(0.155)
Somewhat religious [1,0]0.1970.253 *0.288 **0.378 ***0.333 **
(0.170)(0.137)(0.125)(0.129)(0.143)
Community characteristics
Urban areas [1,0]0.240 **0.04850.07680.08610.102
(0.104)(0.0755)(0.0720)(0.102)(0.0807)
Income share of the richest 10% 3.108 ***4.214 ***3.275 ***1.0140.236
(0.716)(0.799)(0.661)(0.769)(0.592)
Number of poor people (Log)0.317 ***0.288 ***0.326 ***0.172 **0.504 ***
(0.0657)(0.0836)(0.0566)(0.0855)(0.0583)
Individual fixed effectYESYESYESYESYES
Year effectYESYESYESYESYES
Island dummiesYESYESYESYESYES
Demographic controls
Age (and age-squared)YESYESYESYESYES
Marital statusYESYESYESYESYES
No. of Observations9466955012304667211,552
Number of pid47334775615233365776
Note: Bootstrapped standard errors in parentheses; *** p < 0.01, ** p < 0.05, * p < 0.1; [1,0] indicates a dummy variable. SHRVILL = Do you object if someone with different faith from you live in your village? [1,0]. SHRNEIG = Do you object if someone with different faith from you live in your neighborhood? [1,0]. SHRROM = Do you object if someone with different faith from you rent a room from you? [1,0]. MARRY = Do you object if someone with different faith marry one of your close relatives or children? BUILD = Do you object if people who have different faith build a house of worship in your community? [1,0].
Table A5. Regression results (Fixed-effect conditional logit Model), Income–Poverty interaction.
SHRVILLSHRNEIGSHRROMMARRYBUILD
(1)(2)(3)(4)(5)
Per capita expenditure (log)−0.0144−0.3620.1000.2450.206
(0.376)(0.335)(0.285)(0.470)(0.274)
Secured job [1,0]−0.139 **−0.0935−0.05680.00803−0.0721
(0.0687)(0.0741)(0.0532)(0.0571)(0.0570)
Education
Primary education [1,0]0.148−0.0280−0.2290.0928−0.0487
(0.189)(0.177)(0.173)(0.180)(0.190)
Junior secondary education [1,0]0.0223−0.193−0.1410.180−0.0313
(0.205)(0.238)(0.236)(0.247)(0.216)
Senior secondary education [1,0]−0.272−0.356−0.412 *0.160−0.338
(0.240)(0.246)(0.217)(0.291)(0.218)
Tertiary education [1,0]−0.677 **−0.656 **−0.540 **0.113−0.433 *
(0.321)(0.271)(0.248)(0.344)(0.248)
Religiosity
Very religious [1,0]0.457 ***0.584 ***0.287 *0.2990.452 ***
(0.177)(0.189)(0.170)(0.182)(0.132)
Religious 1[1,0]0.468 ***0.551 ***0.412 ***0.393 ***0.404 ***
(0.159)(0.178)(0.143)(0.152)(0.112)
Somewhat religious [1,0]0.1990.2550.289 **0.378 ***0.331 ***
(0.161)(0.177)(0.141)(0.143)(0.0995)
Community characteristics
Urban areas [1,0]0.233 **0.04420.07420.07920.105
(0.0940)(0.0833)(0.0821)(0.136)(0.0753)
Gini coefficient of inequality 2.398 ***3.014 ***2.246 ***1.192 **0.0605
(0.520)(0.513)(0.430)(0.587)(0.456)
Number of poor people (Log)0.5070.07940.611 *0.6270.975 ***
(0.430)(0.358)(0.347)(0.525)(0.316)
Expenditure p.c. X No. Poor−0.01370.0171−0.0210−0.0342−0.0356
(0.0322)(0.0271)(0.0247)(0.0409)(0.0232)
Individual fixed effectYESYESYESYESYES
Year effectYESYESYESYESYES
Island dummiesYESYESYESYESYES
Demographic controls
Age (and age-squared)YESYESYESYESYES
Marital statusYESYESYESYESYES
No. of Observations9466955012,304667211,552
Number of pid47334775615233365776
Note: Bootstrapped standard errors in parentheses; *** p < 0.01, ** p < 0.05, * p < 0.1; [1,0] indicates a dummy variable. SHRVILL = Do you object if someone with different faith from you live in your village? [1,0]. SHRNEIG = Do you object if someone with different faith from you live in your neighborhood? [1,0]. SHRROM = Do you object if someone with different faith from you rent a room from you? [1,0]. MARRY = Do you object if someone with different faith marry one of your close relatives or children? BUILD = Do you object if people who have different faith build a house of worship in your community? [1,0].

References

  1. Allport, Gordon W. 1966. The religious context of prejudice. Journal for the Scientific Study of Religion 5: 447–57. [Google Scholar] [CrossRef]
  2. Allport, Gordon W., and Bernard M. Kramer. 1946. Some roots of prejudice. The Journal of Psychology 22: 9–39. [Google Scholar] [CrossRef] [PubMed]
  3. Amemiya, Takeshi. 1971. The estimation of the variances in a variance-components model. International Economic Review 12: 1–13. [Google Scholar] [CrossRef]
  4. Andersen, Robert, and Tina Fetner. 2008. Economic inequality and intolerance: Attitudes toward homosexuality in 35 democracies. American Journal of Political Science 52: 942–58. [Google Scholar] [CrossRef]
  5. Aydin, Nilüfer, Joachim I. Krueger, Dieter Frey, Andreas Kastenmüller, and Peter Fischer. 2014. Social exclusion and xenophobia: Intolerant attitudes toward ethnic and religious minorities. Group Processes & Intergroup Relations 17: 371–87. [Google Scholar]
  6. Bagir, Zainal Abidin. 2014. Advocacy for Religious Freedom in Democratizing Indonesia. The Review of Faith & International Affairs 12: 27–39. [Google Scholar]
  7. Beatty, Amanda, Emelie Berkhout, Luhur Bima, Thomas Coen, Menno Pradhan, and Daniel Suryadarma. 2018. Indonesia Got Schooled: 15 Years of Rising Schooling and Flat Learning Profiles. RISE Working Paper 18/026. Oxford: Research on Improving Systems of Education. [Google Scholar]
  8. Case, Kim A., Harold. D. Fishbein, and Ritchey P. Neal. 2008. Personality, prejudice, and discrimination against women and homosexuals. Current Research in Social Psychology 14: 23–38. [Google Scholar]
  9. Chamberlain, Gary. 1980. Analysis of Covariance with Qualitative Data. The Review of Economic Studies 47: 225–38. [Google Scholar] [CrossRef] [Green Version]
  10. Chandler, Charles R., and Yung-Mei Tsai. 2001. Social factors influencing immigration attitudes: An analysis of data from the General Social Survey. The Social Science Journal 38: 177–88. [Google Scholar] [CrossRef]
  11. Christian Solidarity Worldwide. 2014. Indonesia: Pluralism in Peril. The Rise of Religious Intolerance across the Archipelago. London: CSW. [Google Scholar]
  12. Coenders, Marcel, and Peer Scheepers. 1998. Support for ethnic discrimination in the Netherlands 1979–1993: Effects of period, cohort, and individual characteristics. European Sociological Review 14: 405–22. [Google Scholar] [CrossRef]
  13. Dahrendorf, Ralf. 1959. Class and Class Conflict in Industrial Society. Stanford: Stanford University Press, vol. 15. [Google Scholar]
  14. Dibb, Paul. 2001. Indonesia: The key to South-East Asia’s security. International Affairs 77: 829–42. [Google Scholar] [CrossRef]
  15. Ekehammar, Bo, Nazar Akrami, Magnus Gylje, and Ingrid Zakrisson. 2004. What matters most to prejudice: Big five personality, social dominance orientation, or right-wing authoritarianism? European Journal of Personality 18: 463–82. [Google Scholar] [CrossRef]
  16. Finke, Roger, and Rodney Stark. 2003. The dynamics of religious economies. In Handbook of the Sociology of Religion. Cambridge: Cambridge University Press, pp. 96–109. [Google Scholar]
  17. Franssen, Vicky, Kristof Dhont, and Alain van Hiel. 2013. Age-Related Differences in Ethnic Prejudice: Evidence of the Mediating Effect of Right-Wing Attitudes. Journal of Community & Applied Social Psychology 23: 252–57. [Google Scholar]
  18. Greene, William H. 2003. Econometric Analysis, 5th ed. Upper Saddle River: Prentice Hall. [Google Scholar]
  19. Gueorguiev, Dimitar, Kai Ostwald, and Paul Schuler. 2018. Rematch: Islamic politics, mobilisation, and the Indonesian presidential election. Political Science 70: 240–52. [Google Scholar] [CrossRef]
  20. Guimond, Serge, and Douglas L. Palmer. 1989. Education, academic program and intergroup attitudes. Canadian Review of Sociology/Revue Canadienne de Sociologie 26: 193–216. [Google Scholar] [CrossRef]
  21. Hadiz, Vedi R. 2018. Imagine all the people? Mobilising Islamic populism for right-wing politics in Indonesia. Journal of Contemporary Asia 48: 566–83. [Google Scholar] [CrossRef]
  22. Haubert, Jeannie, and Elizabeth Fussell. 2006. Explaining pro-immigrant sentiment in the US: Social class, cosmopolitanism, and perceptions of immigrants. International Migration Review 40: 489–507. [Google Scholar] [CrossRef]
  23. Hodson, Gordon. 2011. Do ideologically intolerant people benefit from intergroup contact? Current Directions in Psychological Science 20: 154–59. [Google Scholar] [CrossRef]
  24. Hughes, Philip. 2013. Spirituality and Religious Tolerance. Implicit Religion 16. [Google Scholar] [CrossRef]
  25. Jackman, Mary R. 1978. General and applied tolerance: Does education increase commitment to racial integration? American Journal of Political Science 22: 302–24. [Google Scholar] [CrossRef]
  26. Kato, Hisanori. 2017. The Challenge to Religious Tolerance: Fundamentalist Resistance to a Non-Muslim Leader in Indonesia. Comparative Civilizations Review 77: 8. [Google Scholar]
  27. Kossowska, Małgorzata, and Maciej Sekerdej. 2015. Searching for certainty: Religious beliefs and intolerance toward value-violating groups. Personality and Individual Differences 83: 72–76. [Google Scholar] [CrossRef]
  28. Kurniawati, Sandra, Daniel Suryadarma, Luhur Bima, and Asri Yusrina. 2018. Education in Indonesia: A White Elephant? Journal of Southeast Asian Economies 35: 185–99. [Google Scholar] [CrossRef]
  29. The Law Library of Congress. Prohibition of Interfaith Marriage; The Law Library of Congress, Global Legal Research Center. Available online: https://www.loc.gov/law/help/marriage/prohibition-of-interfaith-marriage.pdf (accessed on 1 October 2019).
  30. Lembaga Survei Indonesia. 2019. Tantangan Intoleransi dan Kebebasan Sipil serta Modal Kerja Pada Periode Kedua Pemerintahan Joko Widodo, Report. Available online: http://www.lsi.or.id/file_download/175 (accessed on 30 December 2019).
  31. Lipset, Seymour Martin. 1959. Some social requisites of democracy: Economic development and political legitimacy. American Political Science Review 53: 69–105. [Google Scholar] [CrossRef]
  32. Maddala, Gangadharrao Soundalyarao. 1971. The use of variance components models in pooling cross section and time series data. Econometrica 39: 341–58. [Google Scholar] [CrossRef]
  33. Menchik, Jeremy. 2016. Strengthening Tolerance in Indonesia. RSIS Commentaries. Singapore: Nanyang Institute of Technology, Available online: https://dr.ntu.edu.sg/handle/10220/41986 (accessed on 9 November 2018).
  34. Milligan, Scott. 2012. Economic inequality, poverty, and tolerance: Evidence from 22 countries. Comparative Sociology 11: 594–619. [Google Scholar] [CrossRef]
  35. Milligan, Scott, Robert Andersen, and Robert Brym. 2014. Assessing Variation in Tolerance in 23 Muslim-Majority and Western Countries. Canadian Review of Sociology/Revue Canadienne de Sociologie 51: 239–61. [Google Scholar] [CrossRef]
  36. Millington, Gareth. 2016. The cosmopolitan contradictions of planetary urbanization. The British Journal of Sociology 67: 476–96. [Google Scholar] [CrossRef]
  37. Minority Rights Group International. 2018. Peoples under Threat 2018. Available online: http://minorityrights.org/wp-content/uploads/2018/06/Peoples-under-Threat-briefing-2018.pdf (accessed on 6 February 2019).
  38. Moore, Laura M., and Seth Ovadia. 2006. Accounting for spatial variation in tolerance: The effects of education and religion. Social Forces 84: 2205–22. [Google Scholar] [CrossRef]
  39. Moors, Guy. 2004. Facts and artefacts in the comparison of attitudes among ethnic minorities. A multigroup latent class structure model with adjustment for response style behavior. European Sociological Review 20: 303–20. [Google Scholar] [CrossRef]
  40. Mulder, Marlene, and Krahn Harvey. 2005. Individual-and Community-level Determinants of Support for Immigration and Cultural Diversity in Canada. Canadian Review of Sociology/Revue Canadienne de Sociologie 42: 421–44. [Google Scholar] [CrossRef]
  41. Ni’am, Syamsun. 2015. Pesantren: The miniature of moderate Islam in Indonesia. Indonesian Journal of Islam and Muslim Societies 5: 111–34. [Google Scholar] [CrossRef] [Green Version]
  42. Norris, Pippa, and Ronald Inglehart. 2011. Sacred and Secular: Religion and Politics Worldwide, 2nd ed. Cambridge: Cambridge University Press. [Google Scholar]
  43. Pettigrew, Thomas F., and Linda R. Tropp. 2006. A meta-analytic test of intergroup contact theory. Journal of Personality and Social Psychology 90: 751. [Google Scholar] [CrossRef] [PubMed] [Green Version]
  44. Pew Research Center. 2018. Key Findings on the Global Rise in Religious Restrictions. Available online: https://www.pewresearch.org/fact-tank/2018/06/21/key-findings-on-the-global-rise-in-religious-restrictions/ (accessed on 6 February 2019).
  45. PPIM, and UNDP. 2018. The Threat of Radicalism at School. Policy Brief Series Issue 4. Jakarta: Pusat Pengkajian Islam dan Masyarakat, vol. 1. [Google Scholar]
  46. PPIM-UIN. 2018. Gen Z: Kegalauan Identitas Keagamaan. Jakarta: Pusat Pengkajian Islam dan Masyarakat. [Google Scholar]
  47. PPIM-UIN. 2019. Pelita Yang Meredup: KeberAGAMAan GURU Sekolah/Madrasah di Indonesia. Report. Jakarta: PPIM UIN. [Google Scholar]
  48. Rakhmani, Inaya. 2017. Mainstreaming Islam in Indonesia. London: Palgrave Macmillan. [Google Scholar]
  49. Reutter, Linda I., Gerry Veenstra, Miriam J. Stewart, Dennis Raphael, Rhonda Love, Edward Makwarimba, and Susan McMurray. 2006. Public attributions for poverty in Canada. Canadian Review of Sociology/Revue Canadienne de Sociologie 43: 1–22. [Google Scholar] [CrossRef]
  50. Schäfer, Saskia. 2018. Islam in the Echo Chamber: Ahmadiyya and Shi’a Identities in Indonesian and Malaysian Online Discourses. Asiascape: Digital Asia 5: 124–58. [Google Scholar] [CrossRef]
  51. Scheepers, Peer, Merove Gijsberts, and Evelyn Hello. 2002. Religiosity and prejudice against ethnic minorities in Europe: Cross-national tests on a controversial relationship. Review of Religious Research 43: 242–65. [Google Scholar] [CrossRef]
  52. Setara Institute. 2009. Siding and Acting Intolerantly: Intolerance by Society and Restriction by the State in Freedom of Religion/Belief in Indonesia. Report. Available online: http://www.setarainstitute.org/en/content/report-freedom-religion-and-belief-2008 (accessed on 6 February 2019).
  53. Setara Institute. 2011. Report on Freedom of Religion and Belief in 2011. Report. Available online: http://www.setarainstitute.org/en/content/report-freedom-religion-and-belief-2011 (accessed on 6 February 2019).
  54. Setara Institute. 2013. Report on Freedom of Religion and Belief in 2012. Report. Available online: http://www.setarainstitute.org/en/content/report-freedom-religion-and-belief-2012 (accessed on 6 February 2019).
  55. Sibley, Chris G., and John Duckitt. 2008. Personality and prejudice: A meta-analysis and theoretical review. Personality and Social Psychology Review 12: 248–79. [Google Scholar] [CrossRef]
  56. Smelser, Neil J. 1988. Handbook of Sociology. Newbury Park: Sage Publication. [Google Scholar]
  57. Stolz, Jörg. 2006. Explaining Islamophobia. A test of four theories based on the case of a Swiss city. Schweizerische Zeitschrift für Soziologie 31: 547–66. [Google Scholar]
  58. Strabac, Zan, and Ola Listhaug. 2008. Anti-Muslim prejudice in Europe: A multilevel analysis of survey data from 30 countries. Social Science Research 37: 268–86. [Google Scholar] [CrossRef]
  59. Sunyoto, Agus. 1987. Sunan Ampel: Taktik dan Strategi Dakwah Islam di Jawa Abad 14–15. (Sunan Ampel: Tactics and Strategy of Islamic Dawah in Java 14–15 Century). Surabaya: LPLI Sunan Ampel. [Google Scholar]
  60. Suryana, Aan. 2017. Discrepancy in State Practices: The Cases of Violence against Ahmadiyah and Shi’a Minority Communities during the Presidency of Susilo Bambang Yudhoyono. Al-Jami’ah: Journal of Islamic Studies 55: 71–104. [Google Scholar] [CrossRef] [Green Version]
  61. Tempo Magazine. 2017. Clear and Present Danger: Hizbut Tahrir in Indonesia. Available online: https://magz.tempo.co/read/33149/clear-and-present-danger-hizbut-tahrir-indonesia (accessed on 14 November 2019).
  62. van Bruinessen, Martin. 2013. Overview of Muslim Organisations, Associations, and Movements in Indonesia. In Contemporary Developments in Indonesian Islam: Explaining the Conservative Turn. Singapore: ISEAS, pp. 21–59. [Google Scholar]
  63. van Dijk, Kees, and Nico J. G. Kaptein. 2016. Islam, Politics and Change: The Indonesian Experience after the Fall of Suharto. Leiden: Leiden University Press. [Google Scholar]
  64. Wahid Foundation. 2016. Potensi Intoleransi dan Radikalisme Sosial Keagamaan di Kalangan Muslim Indonesia. Report. Jakarta: Wahid Foundation. [Google Scholar]
  65. Wanandi, Jusuf. 2002. Islam in Indonesia: Its history, development and future challenges. Asia Pacific Review 9: 104–12. [Google Scholar] [CrossRef]
  66. Wilson, Ian. 2017. The Political Economy of Rising Religious Intolerance in Indonesia. A submission to the Department of Foreign Affairs and Trade Foreign Policy White Paper 2017 Taskforce. Available online: https://www.fpwhitepaper.gov.au/sites/default/files/submission/170227-295-dr-ian-wilson.pdf (accessed on 13 November 2019).
  67. Wooldridge, Jeffrey M. 2002. Econometric Analysis of Cross Section and Panel Data MIT Press. Cambridge: MIT Press. [Google Scholar]
  68. Yusuf, Arief Anshory, Andy Sumner, and Irlan Adiyatma Rum. 2014. Twenty years of expenditure inequality in Indonesia, 1993–2013. Bulletin of Indonesian Economic Studies 50: 243–54. [Google Scholar] [CrossRef]
  69. Zulkifli. 2013. The Struggle of the Shi‘is in Indonesia. Canberra: ANU E Press. [Google Scholar]
1
2
Ahmadiya has followers from all around the world, but most Muslim majority countries do not officially recognize its existence, due to their claim that Mirza Gulam Ahmad, their founder, was a prophet; this was deemed by many Muslims as contradicting an important Islamic principle of there being no prophet after Muhammad. In Indonesia, Ahmadiya followers have been banned in some local areas, their mosques shut down by force by local authorities, and their faith has been declared as “a misguided sect” by MUI’s Central Committee. Despite physical violence against this sect having also been perpetrated locally long before the New Order period and even before Indonesian Independence in 1945 (Menchik 2016, pp. 593–94), the most violent act on Ahmadiya to date occurred in 2011 in West Java. In this incident, three or more members of the Ahmadiya sect were killed in front of policemen. Some observers considered that there was a link between the anti-Ahmadiya fatwa (religious edict) released by MUI (Indonesian Islamic Scholar Council) and the violence, even if both the MUI and some Ahmadiya followers doubt this and hard proof could not be obtained (Schäfer 2018). Resistance against the Shi’a sect has also existed since long before Indonesian Independence, despite the fact that some Shi’a traditions were taught by few popular Muslim saints in Java, notably by Sunan Kalijaga and his followers (Sunyoto 1987). Shi’a remains controversial for the majority of Sunni-based Indonesian Muslim communities, with varying levels of objection (Zulkifli 2013). The most brutal attack on Shi’a communities took place in 2012, when Sunni followers in Sampang, Madura, raided and expelled Shi’a followers from their homeland. This heinous act was motivated partly by local East Java’s MUI decree that Shi’a is blasphemous. A discrepancy of responses between central and local government officials on violence against Shi’a and Ahmadiya did not help either community (Suryana 2017).
3
Ahok referred to a passage of the Qur’an in a speech at a local gathering, which hard-liner Islamist groups claimed as insulting the Holy Book. The charge was made by police after a supporter of the Muslim candidate for governor edited the recording of the speech and made it viral, sparking outrage from MUI and Muslim communities all around the country.
4
The first IFLS (IFLS 1) was fielded in 1993, collecting a sample of almost 7000 households and 24,000 individuals, which was carried out by the RAND Corporation (U.S.A.), in collaboration with the Demographic Institute of the University of Indonesia. IFLS2 and IFLS2+ were conducted in 1997 and 1998, respectively, by RAND in collaboration with UCLA and Lembaga Demografi, University of Indonesia. IFLS2+ covered a 25% sub-sample of the IFLS households. IFLS3, fielded in 2000 and covering the full sample, was conducted by RAND in collaboration with the Population Research Center, University of Gadjah Mada. The fourth wave of the IFLS (IFLS4), fielded in 2007/2008, covered the full sample and was conducted by RAND, the Center for Population and Policy Studies of the University of Gadjah Mada, and Survey METER. The fifth wave of the IFLS (IFLS-5) was fielded in 2014/15. In 2012, SurveyMETER fielded a special IFLS survey in the eastern provinces of Indonesia; this was called the IFLS EAST. IFLS data are publicly available for download at the following URL: https://www.rand.org/well-being/social-and-behavioral-policy/data/FLS/IFLS.html.
5
6
7
The effects of university education ideally should be differentiated by the type of higher education (i.e., secular versus religious-based). However, our data set did not have information on this.
Figure 1. Share of respondents (in %) who would object if a non-Muslim became President, Vice President, Governor, or Mayor. Source: Lembaga Survei Indonesia (2019).
Religions 11 00021 g001
Figure 2. (a) Cross-province association between Jokowi/Ma’ruf vote in 2019 election (%) and percentage of population who do not object a place of worship of different religion being built in their neighborhood (%); and (b) Cross-province association between Jokowi/Ma’ruf vote in 2019 election (%) and percentage of population who do not object to their children having friends of different religions (%). Source: SUSENAS 2014, calculation by author.
Religions 11 00021 g002
Figure 3. Indonesian Family Life Survey (IFLS) regional coverage.
Religions 11 00021 g003
Table 1. Summary statistics of variables used in the regression analysis.
VariablesMeanStd. Dev.MinMaxObs
Religious intolerance
Object to living in the same village [1,0]0.2390.4270154,345
Object to living in the same neighborhood [1,0]0.2560.4360154,345
Object to sharing a house [1,0]0.5120.5000154,345
Object to marrying relatives [1,0]0.8480.3590154,345
Object to building place of worship [1,0]0.6230.4850154,345
Per capita expenditure (log)13.3120.76210.81416.94152,089
Secured job (1 = Yes; 0 = Otherwise)0.2860.4520154,345
Level of education
Primary education (1 = Yes; 0 = Otherwise)0.3340.4720154,231
Junior secondary education (1 = Yes; 0 = Otherwise)0.2060.4050154,231
Senior secondary education (1 = Yes; 0 = Otherwise)0.2910.4540154,231
Tertiary education (1 = Yes; 0 = Otherwise)0.1060.3080154,231
Religiosity
Very religious (1 = Yes; 0 = Otherwise)0.1030.3040154,233
Religious (1 = Yes; 0 = Otherwise)0.6630.4730154,233
Somewhat religious (1 = Yes; 0 = Otherwise)0.2060.4040154,233
Community characteristics
Urban areas (1 = Yes; 0 = Rural areas)0.5640.4960154,345
Inequality—Gini coefficient0.3000.0640.1560.49954,157
Inequality—Income share of richest 1%0.0490.0200.0180.19954,157
Inequality—Income share of richest 5%0.1550.0370.0830.32254,157
Inequality—Income share of richest 10%0.2490.0450.160.4154,157
Number of poor people in the city (Log)11.4221.0167.82413.16154,157
Other demographics
Age (years)36.95915.16914.00097.00054,231
Marital status (1 = Married; 0 = Otherwise)0.7140.4520154,231
Source: Author’s calculation, based on IFLS 2007 and 2014 and SUSENAS 2007 and 2014.
Table 2. Regression results (Fixed-effect conditional logit Model).
SHRVILLSHRNEIGSHRROMMARRYBUILD
(1)(2)(3)(4)(5)
Per capita expenditure (log)−0.174 ***−0.162 ***−0.143 ***−0.151 ***−0.205 ***
(0.0405)(0.0401)(0.0365)(0.0482)(0.0503)
Secured job [1,0]−0.140 *−0.0933−0.05780.00716−0.0744
(0.0741)(0.0705)(0.0477)(0.0731)(0.0598)
Education
Primary education [1,0]0.147−0.0282−0.2280.0921−0.0537
(0.174)(0.184)(0.149)(0.207)(0.169)
Junior secondary education [1,0]0.0221−0.195−0.1410.181−0.0362
(0.203)(0.228)(0.205)(0.256)(0.235)
Senior secondary education [1,0]−0.273−0.357−0.411 **0.163−0.340
(0.225)(0.243)(0.208)(0.301)(0.244)
Tertiary education [1,0]−0.674 **−0.662 **−0.534 **0.124−0.428
(0.301)(0.305)(0.265)(0.305)(0.305)
Religiosity
Very religious [1,0]0.460 ***0.581 ***0.289 **0.303 **0.455 ***
(0.161)(0.153)(0.138)(0.149)(0.160)
Religious 1[1,0]0.471 ***0.546 ***0.415 ***0.397 ***0.408 ***
(0.144)(0.143)(0.123)(0.146)(0.140)
Somewhat religious [1,0]0.1990.253 *0.289 **0.380 ***0.333 **
(0.142)(0.153)(0.116)(0.144)(0.144)
Community characteristics
Urban areas [1,0]0.234 **0.04340.07310.08060.102
(0.0929)(0.0729)(0.0838)(0.121)(0.0941)
Gini coefficient of inequality 2.421 ***2.986 ***2.280 ***1.234 **0.102
(0.566)(0.529)(0.448)(0.569)(0.440)
Number of poor people (Log)0.329 ***0.303 ***0.334 ***0.178 *0.504 ***
(0.0719)(0.0777)(0.0669)(0.0943)(0.0615)
Individual fixed effectYESYESYESYESYES
Year effectYESYESYESYESYES
Island dummiesYESYESYESYESYES
Demographic controls
Age (and age-squared)YESYESYESYESYES
Marital statusYESYESYESYESYES
No. of Observations9466955012,304667211,552
Number of individuals47334775615233365776
Note: [1,0] means (1 = Yes; 0 = Otherwise); Bootstrapped standard errors in parentheses; *** p < 0.01, ** p < 0.05, and * p < 0.1; [1,0] indicates a dummy variable. SHRVILL = Do you object if someone with different faith from you live in your village? [1,0]. SHRNEIG = Do you object if someone with different faith from you live in your neighborhood? [1,0]. SHRROM = Do you object if someone with different faith from you rent a room from you? [1,0]. MARRY = Do you object if someone with different faith marry one of your close relatives or children? BUILD = Do you object if people who have different faith build a house of worship in your community? [1,0].
Table 3. Regression results (Dependent variable: Index of overall religious intolerance).
(1)(2)(3)(4)
Per capita expenditure (log)−0.131 ***−0.131 ***−0.129 ***−0.130 ***
(0.0217)(0.0217)(0.0217)(0.0217)
Secured job [1,0]−0.0474 *−0.0457−0.0466 *−0.0470 *
(0.0279)(0.0279)(0.0279)(0.0279)
Highest education attainment
Primary education [1,0]−0.0190−0.0187−0.0171−0.0185
(0.0987)(0.0987)(0.0988)(0.0987)
Junior secondary education [1,0]−0.0361−0.0356−0.0344−0.0356
(0.119)(0.119)(0.119)(0.119)
Senior secondary education [1,0]−0.200−0.201−0.198−0.199
(0.130)(0.130)(0.130)(0.130)
Tertiary education [1,0]−0.304 **−0.298 **−0.299 **−0.301 **
(0.140)(0.140)(0.140)(0.140)
Religiosity
Very religious [1,0]0.315 ***0.316 ***0.315 ***0.314 ***
(0.0790)(0.0790)(0.0791)(0.0791)
Religious 1[1,0]0.328 ***0.330 ***0.327 ***0.327 ***
(0.0708)(0.0708)(0.0709)(0.0708)
Somewhat religious [1,0]0.215 ***0.218 ***0.215 ***0.215 ***
(0.0703)(0.0703)(0.0704)(0.0703)
Community characteristics
Urban areas [1,0]0.06850.0842 **0.0736 *0.0707 *
(0.0420)(0.0419)(0.0419)(0.0419)
Number of poor people (Log)0.238 ***0.232 ***0.235 ***0.234 ***
(0.0300)(0.0300)(0.0300)(0.0300)
Inequality
Gini coefficient1.278 ***
(0.226)
Share of the top 1% 3.118 ***
(0.598)
Share of the top 5% 2.440 ***
(0.350)
Share of the top 10% 1.727 ***
(0.295)
Individual fixed effectYESYESYESYES
Year effectYESYESYESYES
Island dummiesYESYESYESYES
Demographic controls
Age (and age-squared)YESYESYESYES
Marital statusYESYESYESYES
No. of Observations49,58449,58449,58449,584
Number of individuals32,92032,92032,92032,920
Note: [1,0] means (1 = Yes; 0 = Otherwise); Robust standard errors in parentheses; *** p < 0.01, ** p < 0.05, * p < 0.1; [1,0] indicates a dummy variable.
Table 4. Regression results (Fixed-effect conditional logit Model) with quintile of expenditure per capita as a measure of income.
SHRVILLSHRNEIGSHRROMMARRYBUILD
(1)(2)(3)(4)(5)
Expenditure per capita quintile
Quintile 2−0.103−0.0887−0.01790.0146−0.0568
(0.0674)(0.0570)(0.0570)(0.0856)(0.0549)
Quintile 3−0.207 ***−0.210 ***−0.194 ***−0.170 *−0.126 *
(0.0792)(0.0722)(0.0657)(0.0889)(0.0703)
Quintile 4−0.202 **−0.222 ***−0.145 **−0.185 *−0.244 ***
(0.0856)(0.0796)(0.0675)(0.103)(0.0692)
Quintile 5−0.292 ***−0.303 ***−0.231 ***−0.271 **−0.290 ***
(0.0870)(0.0904)(0.0790)(0.112)(0.0719)
Secured job [1,0]−0.145 **−0.0965−0.06090.0103−0.0749
(0.0624)(0.0645)(0.0547)(0.0704)(0.0545)
Education
Primary education [1,0]0.143−0.0311−0.2290.0855−0.0579
(0.132)(0.173)(0.177)(0.201)(0.189)
Junior secondary education [1,0]0.0223−0.193−0.1400.169−0.0411
(0.190)(0.187)(0.199)(0.250)(0.223)
Senior secondary education [1,0]−0.278−0.359 *−0.420 **0.152−0.348 *
(0.247)(0.214)(0.198)(0.295)(0.208)
Tertiary education [1,0]−0.684 **−0.669 **−0.540 **0.111−0.440 *
(0.302)(0.265)(0.242)(0.338)(0.241)
Religiosity
Very religious [1,0]0.460 ***0.575 ***0.298 *0.309 *0.455 ***
(0.165)(0.150)(0.157)(0.168)(0.119)
Religious 1[1,0]0.471 ***0.542 ***0.424 ***0.405 ***0.412 ***
(0.156)(0.136)(0.140)(0.153)(0.113)
Somewhat religious [1,0]0.1980.247 *0.296 **0.388 ***0.336 ***
(0.140)(0.140)(0.149)(0.149)(0.124)
Community characteristics
Urban areas [1,0]0.232 ***0.04550.06980.07610.0928
(0.0798)(0.0869)(0.0765)(0.127)(0.0840)
Gini coefficient of inequality 2.390 ***2.973 ***2.263 ***1.223 **0.0862
(0.462)(0.477)(0.338)(0.548)(0.487)
Number of poor people (Log)0.333 ***0.308 ***0.337 ***0.1800.510 ***
(0.0909)(0.0784)(0.0565)(0.112)(0.0627)
Individual fixed effectYESYESYESYESYES
Year effectYESYESYESYESYES
Island dummiesYESYESYESYESYES
Demographic controls
Age (and age-squared)YESYESYESYESYES
Marital statusYESYESYESYESYES
No. of Observations9466955012,304667211,552
Number of individuals47334775615233365776
Note: [1,0] means (1 = Yes; 0 = Otherwise); Bootstrapped standard errors in parentheses; *** p < 0.01, ** p < 0.05, * p < 0.1; [1,0] indicates a dummy variable. SHRVILL = Would you object if someone with a different faith from you live in your village? [1,0]. SHRNEIG = Would you object if someone with a different faith from you live in your neighborhood? [1,0]. SHRROM = Would you object if someone with a different faith from you rent a room from you? [1,0]. MARRY = Would you object if someone with a different faith marry one of your close relatives or children? BUILD = Would you object if people who have a different faith build a house of worship in your community? [1,0].

