Biodiversity in Music Scores


1
Department of Aquatic Sciences and Assessment, Swedish University of Agricultural Sciences, Box 7050, 750 07 Uppsala, Sweden
2
School of Natural Resources, University of Nebraska–Lincoln, Lincoln, NE 68583-0961, USA
Challenges 2020, 11(1), 7; https://doi.org/10.3390/challe11010007
Submission received: 15 April 2020
/
Revised: 4 May 2020
/
Accepted: 11 May 2020
/
Published: 14 May 2020
(This article belongs to the Section Social Climate, Challenges, Trends, and Transitions)
Abstract
Nature has inspired music since the dawn of humankind and has contributed to the creation and development of music as an art form. However, attempts to use the science of nature (i.e., quantitative ecology) to inform music as a broader art-science system is comparatively underdeveloped. In this paper an approach from biodiversity assessments is borrowed to quantify structural diversity in music scores. The approach is analogous in its nature and considers notations with distinct pitches and duration as equivalents of species in ecosystems, measures within a score as equivalents of ecosystems, and the sum of measures (i.e., the entire score) as a landscape in which ecosystems are embedded. Structural diversity can be calculated at the level of measures (“alpha diversity”) and the entire score (“gamma diversity”). An additional metric can be derived that quantifies the structural differentiation between measures in a score (“beta diversity”). The approach is demonstrated using music scores that vary in complexity. The method seems particularly suitable for hypothesis testing to objectively identify many of the intricate phenomena in music. For instance, questions related to the variability within and between musical genres or among individual composers can be addressed. Another potential application is an assessment of ontogenetic structural variability in the works of composers during their lifetime. Such information can then be contrasted with other cultural, psychological, and historical variables, among others. This study shows the opportunities that music and ecology offer for interdisciplinary research to broaden our knowledge of complex systems of people and nature.
1. Introduction
Nature has informed music ever since the dawn of humanity, and it has played key roles in the formation and evolution of music as an art form and humans as complex beings. In contrast, the science of nature (e.g., ecology) has been comparatively less influential in analyzing music, both as an art form and as a scientific discipline. Specifically, the alienation between music and scientific ecology is manifested in the lack of application of quantitative tools used by ecologists to unravel patterns and processes in other fields such as music. This paper makes a first step to bridge this divide. While the idea of the application of statistical tools to music is not new, it introduces an approach used in ecology to quantify biodiversity and applies it to assess structural diversity in music scores.
A gamut of mathematical and statistical methods used across disparate sciences such as physics, ecology, speech recognition, bioinformatics and economics has been used to identify information content and complexity in music. Such methods include (see overview in [1]): exploratory data mining in musical spaces, global measures of structure and randomness, time series analysis, hierarchical modeling, Markov chain Monte Carlo (MCMC) models, circular statistics, principal component analysis, discriminant analysis and nonparametric multidimensional scaling. From a computational perspective, a significant increase in algorithm accuracy and efficiency in recent years helped improve quantification, furthering our knowledge related to, for instance, melody and chord estimation, beat tracking, mood and genre estimation, and pattern analysis [2]. In addition to methods broadly used across sciences, quantitative methods have been developed that have not transcended the frontiers of their field-specific disciplines, despite their clear potentials. For instance, Sundstrom et al. [3] have shown that quantitative tools developed in ecology, specifically resilience assessments, can be successfully applied in other fields such as economy and anthropology. This study extends this line of research building on the rationale that interdisciplinary application of methods can further develop musicology [4] and more broadly music as a combined art-science system.
This paper borrows an analysis approach from ecology to quantify structure and diversity in music scores. The rationale builds on the recognition that patterns in ecology [5] and music, at the composition [6] and socio-musicological system level [7], are hierarchically structured (but see, for instance, [8] for a non-hierarchical view related to composing music). Such structuring is inherent in the general theory of systems [3,9], building on the notion that musical and ecological entities comprise both a part and a whole (i.e., holons). In music, structure has been identified to occur at the scale of a section, phrase or motif and at the scale that spans the entire work [10]. From a more time-explicit point of view, sound structure can occur at the micro-time (few nanoseconds to a few milliseconds), meso-time (centiseconds to a few seconds) and macro-time scale (sound structure composed of several events that result from interactions among lower-level processes) [11]. Ecological systems have similar spatiotemporal structuring, whereby structure at the scale of an individual ecosystem and the scale of an entire region in which ecosystems are embedded can be considered analogous to the structure present in music.
Georgescu and Georgescu [12] provided an example of a systems approach, which strikingly matches ecological theory regarding ecosystem organization. They recognize three structural core concepts that allow contextualizing ecological approaches to the quantification of structure in music, thereby serving as a suitable analogy connecting music and ecology. Their first concept relates to “wholeness”, which refers to the emergence of structure beyond the sum of components. This concept is related to the scale of an entire musical score or a region of ecosystems. Their second concept emphasizes “order”, which they define as the subsystems that can be isolated and studied. Ecosystems embedded in a region can be considered such subsystems and are analogous to specific sections in a score. Their third concept is “centralization”, an integrative feature that pulls a work together and makes units subservient to a single organizing principle, harmonic progression. The progression aspect is considered as a manifestation of how patterns of combinations of different pitches and duration of notations change from one measure to the next in an entire score (“turnover”). Similarly, in an ecosystem turnover manifests in how sets of species differ across ecosystems in a region.
A benefit that may be obtained from the biodiversity analysis approach presented here is that different phenomena in musical scores can be studied simultaneously. Ecologists use different diversity measures to represent different aspects of complex assemblages of animals and plants in the environment. These different measures thus help making nature’s complexity more tractable. It follows that biodiversity analysis in music can also reveal aspects of structural complexity, which can be undoubtedly high [6], for instance in the compositions of the New Complexity genre [13]. Objectively analyzing and understanding such structural complexity, for which music scores can provide the basis, has long intrigued music scholars. Studying structural diversity in music scores using the ecological approach demonstrated in this paper can assist them as a complement to existing modeling methods in their endeavors to scrutinize complexity.
Based on this rationale, an ecological analysis approach for quantifying structure in music is contextualized. The aim is not to develop a theory based on perception and cognition, but rather the interdisciplinary application of the approach focusing on structure in scores, which may be interesting to historical musicology and the study of musical style. In acknowledging that the subjective categorization of music elements as equivalents of species and ecosystems deviates from structural characterizations so far used by musicologists, it is emphasized upfront that the approach, rather than a one-to-one translation, must be understood as an analogical model. In the next sections the suitability of the presented approach is discussed, making structural analogies between ecology and music. Next the ecological analysis approach using examples of music scores that vary in their degrees of complexity is demonstrated. It is hypothesized that approaches from biodiversity research can assess structural complexity in music scores. The paper concludes with discussing potential applications within musicology research and the development of music as a combined and holistic art-science system.
2. Materials and Methods
2.1. Music Meets Biodiversity Research
The ecological approach presented here has a long tradition in ecology and has been originally designed to study the structure and richness of natural communities. This line of study is nowadays commonly referred to as biodiversity research, which ranges from genes to individuals, to communities and ecosystems, and includes structural and functional approaches. Such studies are often motivated by the loss of animal and plant species due to environmental change pressures, like global warming or exotic species invasions. Ecologists have used a plethora of measures to quantify different properties of biodiversity. That is, biodiversity has become an umbrella term for different diversity phenomena; for instance: (1) Species richness, or simply richness, quantifies the number of animal and plant species within an ecosystem (e.g., a lake). Richness alone ignores how abundant species are. (2) Shannon entropy (expH’), a measure derived from information theory, integrates both the occurrence of species and their abundances in a single metric. This measure is often referred to as diversity to discern it from richness. Shannon entropy has also a broad and long application tradition in musicology for assessing structural complexity [14,15,16,17], although the validity of its usage has been sometimes questioned. For instance, it has been considered a numerical formula that is divorced from musical experience ([18] cited in [19]), contributing to a form of “number fetishism” within a purely academic and narrow pursuit [19]. (3) Evenness assesses the equality of species in term of their abundances in an ecosystem. It essentially compares the dominance structure across species in ecosystems and summarizes it in a single metric. It is derived by division of diversity with richness and the resulting values are bound between 0 (a highly uneven community; a few species are highly dominant) to 1 (every species has the same abundances; perfect evenness).
These metrics can be used for studying patterns at different scales. Briefly, in ecology measures of richness, diversity and evenness can be assessed for a single ecosystem (e.g., a lake), which ecologists refer to as alpha diversity, and for a number of ecosystems within a region (e.g., a number of lakes within a region; gamma diversity). How assemblages of plants and animals differ across ecosystems in a region can also be quantified and expressed by a measure of differentiation (beta diversity). That is, beta diversity accounts both for the relationship between the diversity at the scale of individual ecosystems and the degree of differentiation among ecosystems. It is beyond the scope of this paper to present detailed information about mathematical deduction and the pure ecological meaning of the biodiversity measures used in this study. Such information can be found in [20,21,22,23,24]. For a more general description of biodiversity in ecology and a practical example see [25] and [26], respectively.
This study applies the ecological concept of alpha, beta and gamma diversity and contextualizes it within music, as shown in Table 1. Music scores are regarded as analogues of ecological systems, which share structural properties that are conducive to biodiversity measurements. Specifically, notes are the elemental symbols representing sonic events in instrumental music and comprise the basic building blocks of scores. Notes are therefore regarded as analogues of species. Measures are elements of metric-tonal units inherent in scores. Although they are notational constructs that bear no relationship with actual sound results, they can be considered to be analogous to single ecosystems for our purpose. The sum of measures within the entire score can be regarded as the landscape composed of ecosystems, as shown in Table 1. Although these descriptors are subjectively defined, they can be regarded to comprise equivalents for calculating alpha diversity (at the scale of measure), gamma diversity (at the scale of the score) and beta diversity (differentiation across measures) in music scores, as displayed in Table 1. It is acknowledged that the ecological approach, which is often spatially explicit, is adopted in a sequential context with regard to the music scores. However, emphasizing the analogous nature of our comparisons, the spatial vs. sequential assumptions can be relaxed. This allows aligning alpha, beta and gamma diversity equivalents with elements in music suggested in theoretical systems approaches [11].
2.2. Study Examples
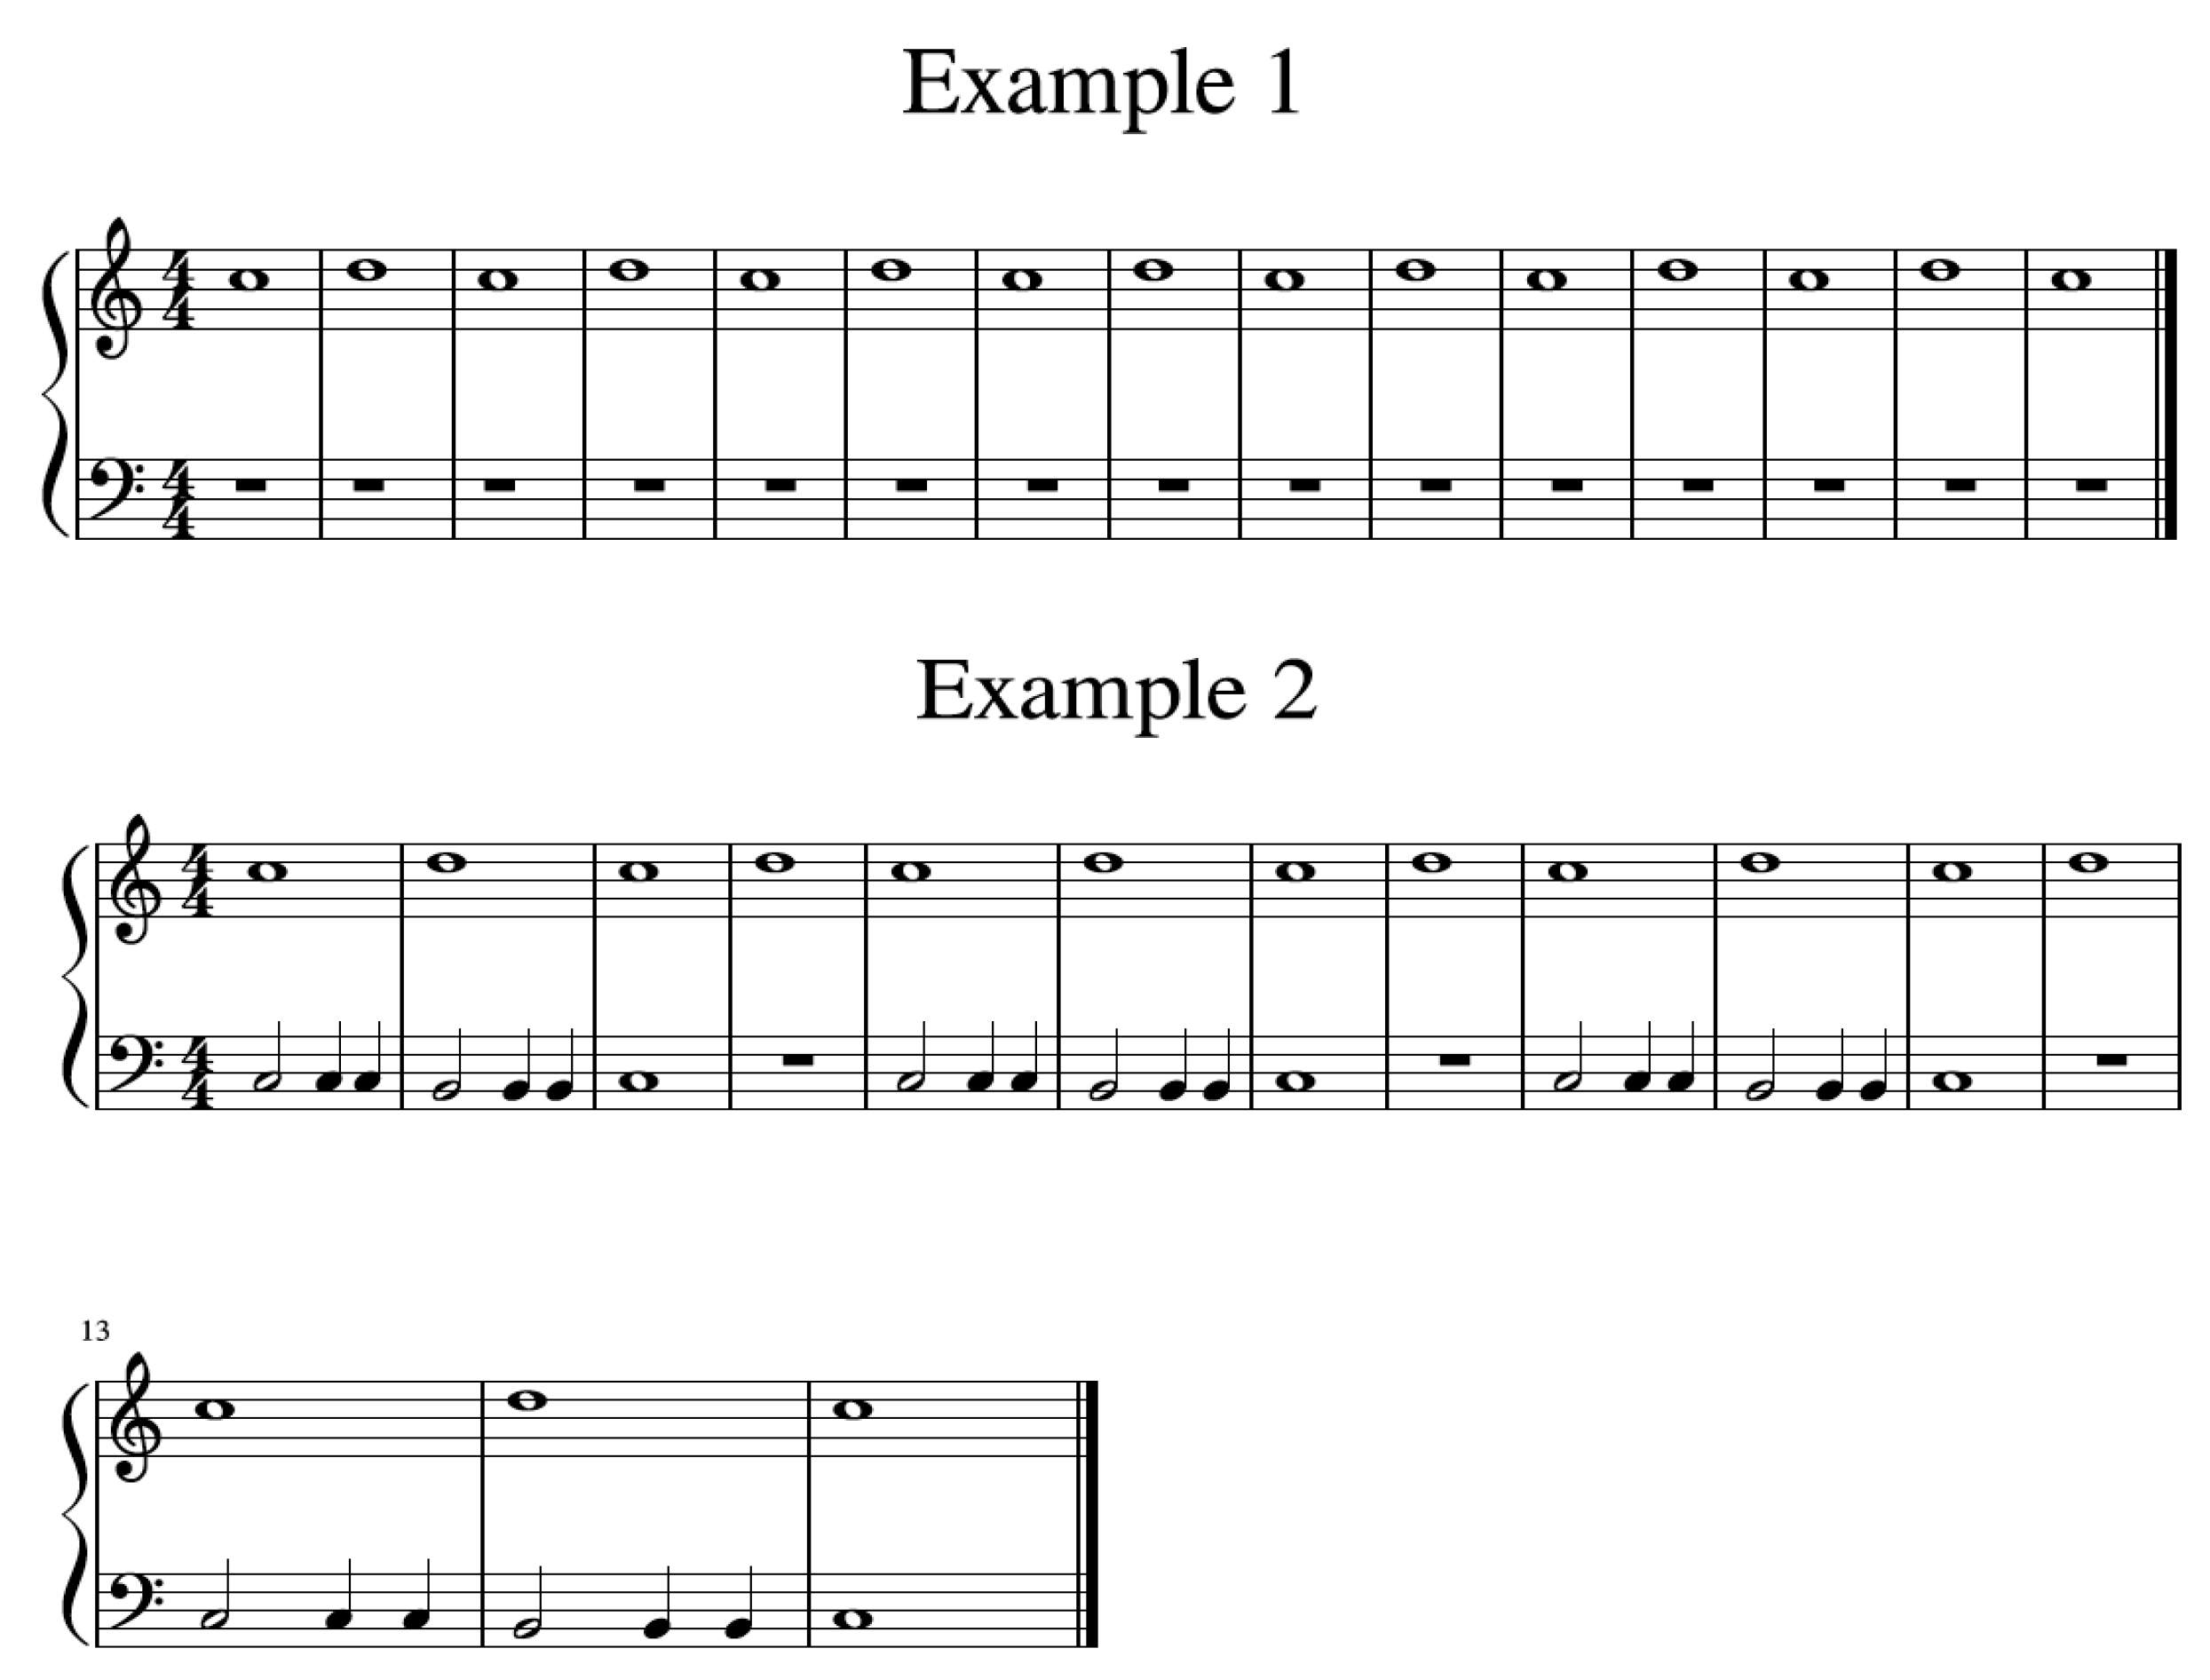
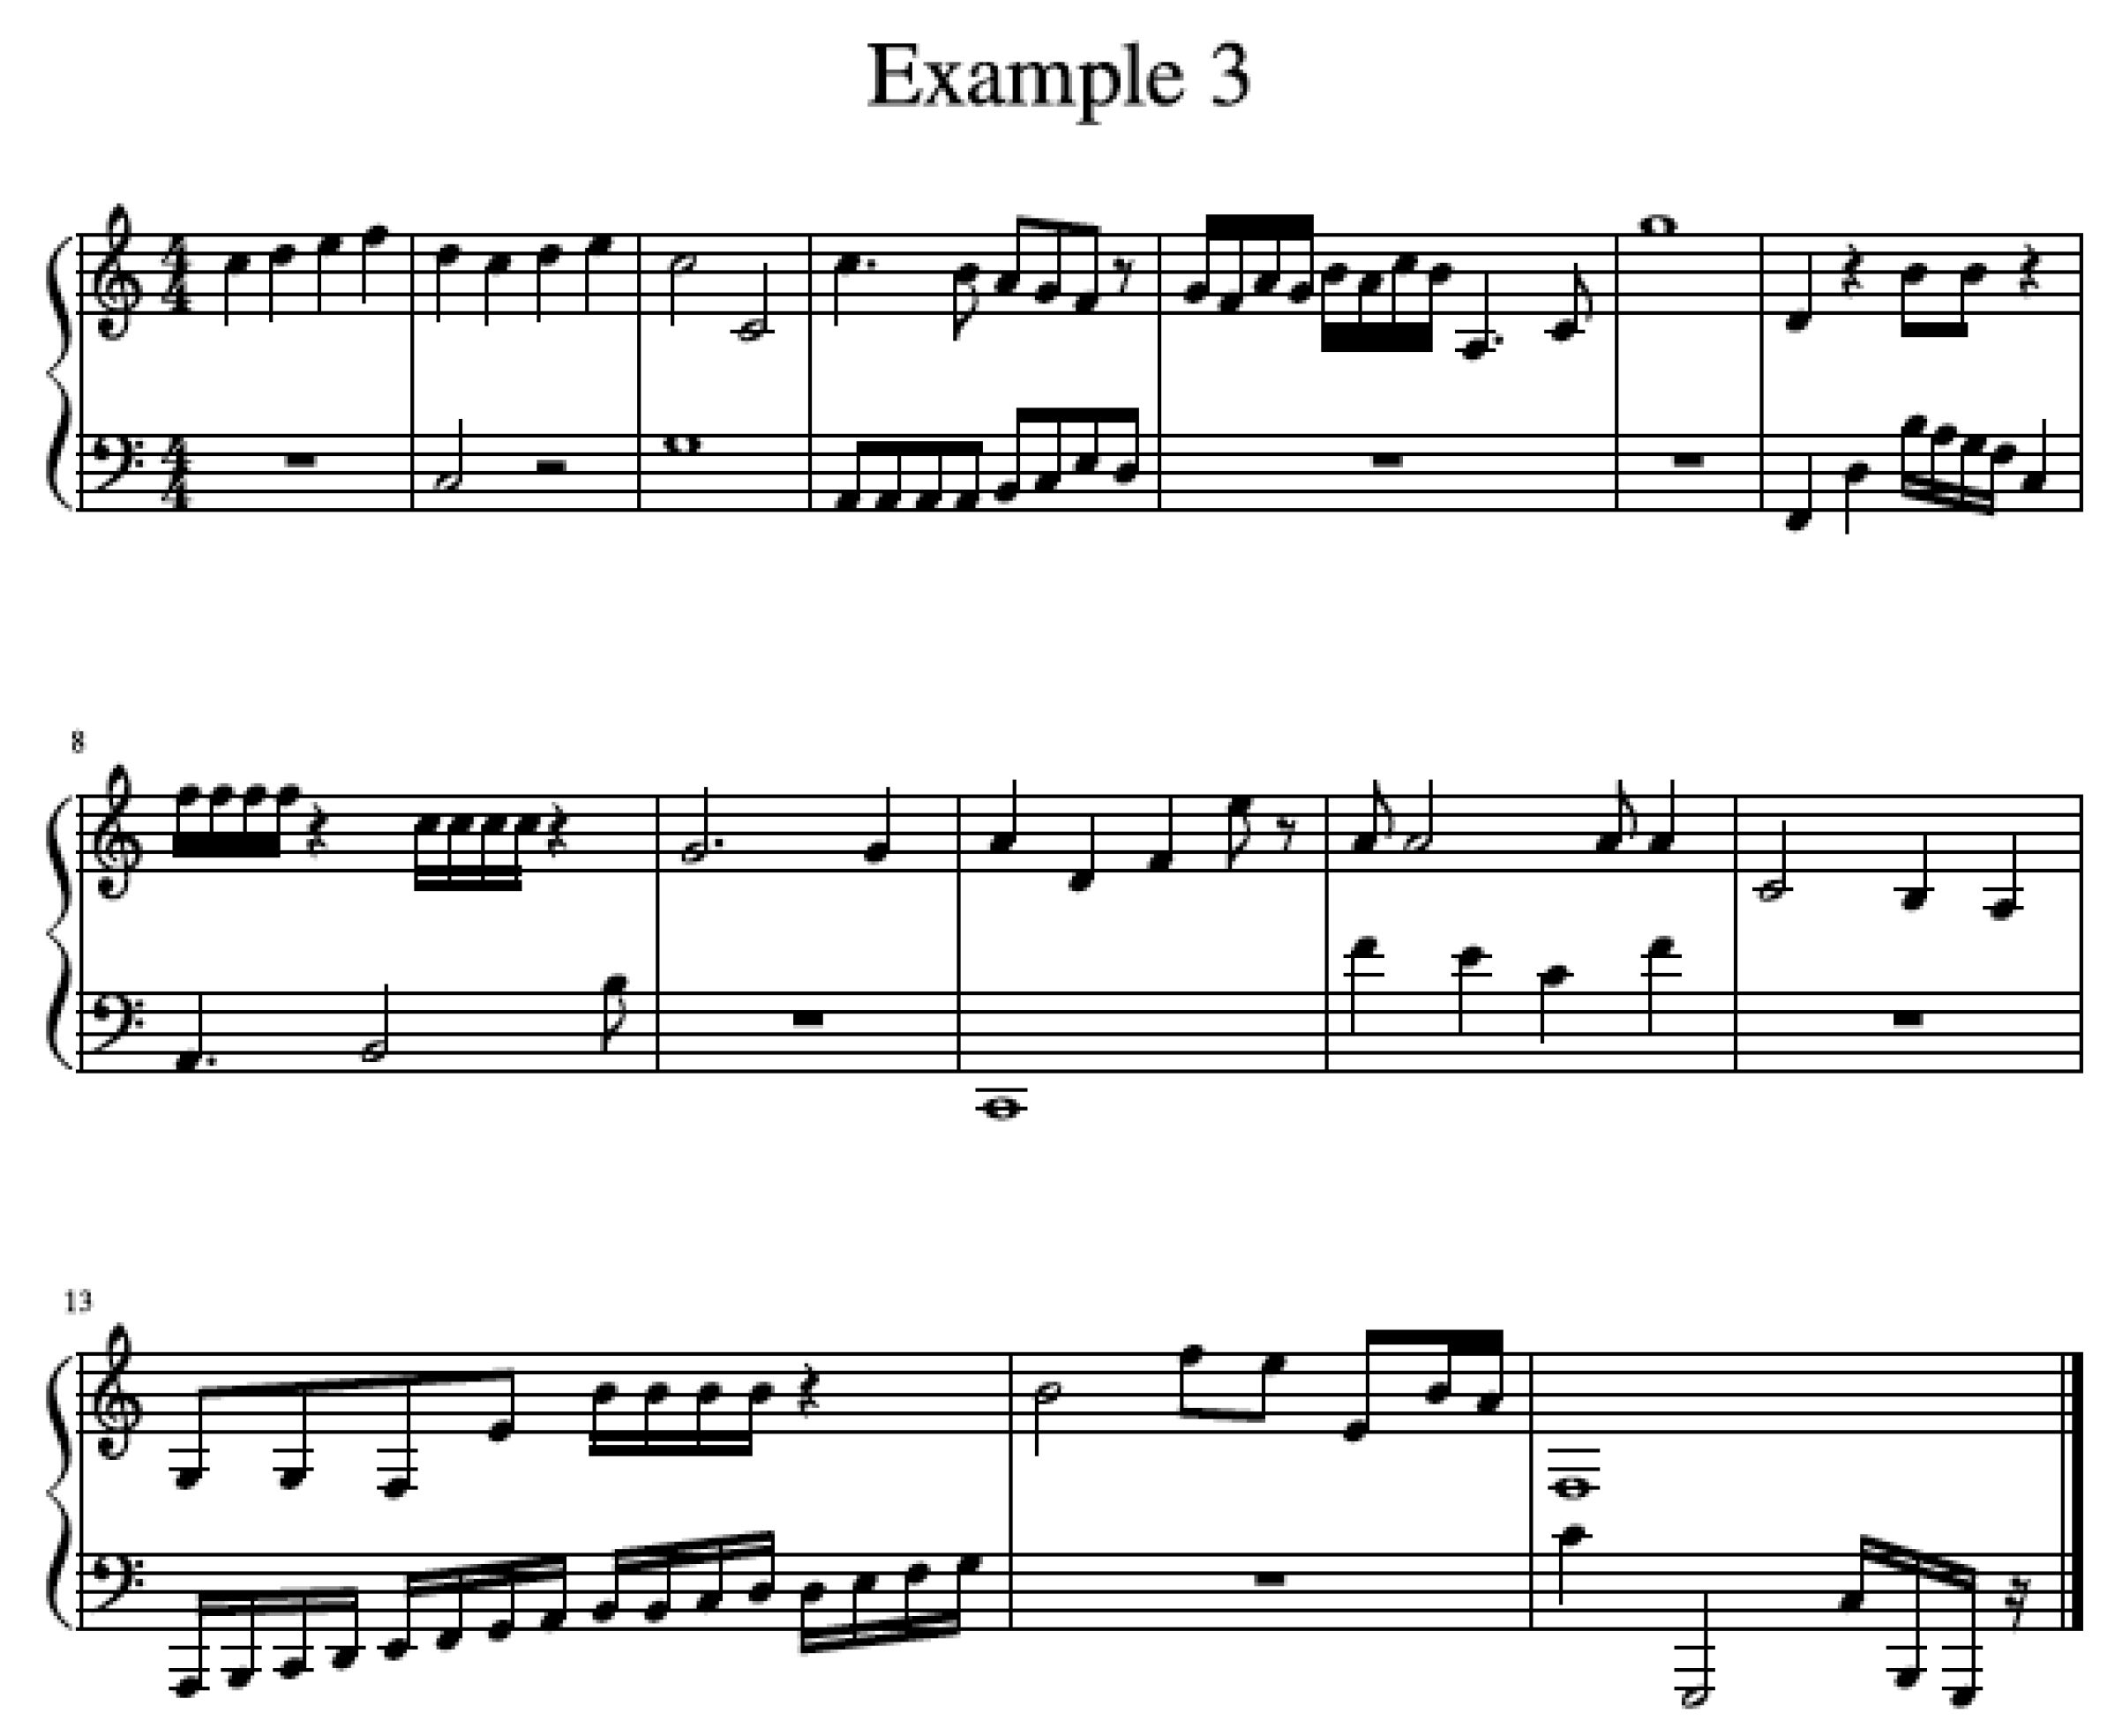
To demonstrate the approach for assessing alpha, beta and gamma diversity, three examples were composed for the piano. These examples are meant only for fulfilling the role of numerical quantification of structure in the musical scores (i.e., they are not meant to play an aesthetic function). The approach is specifically designed for instrumental music. Specifically, for demonstrating the approach, diversity was quantified for both piano voices together; however, this does not preclude that diversity can be calculated for each voice separately, or for a whole range of instruments in an orchestra. The examples were composed in the freeware MuseScore 2.0.3. It is recommended to gauge the performance of numerical approaches in the analysis of music [27]. The examples therefore had an ascending level of complexity and followed certain rules. That is, all three examples were in C major, used a 4/4 time signature and had 15 measures, as shown in Figure 1. The first example was the most basic. Every measure consisted of one whole note (treble clef) and one whole rest (bass clef). The notes c2 and d2 alternated between measures in the treble clef, while whole rests were applied in the bass clef throughout all measures. Complexity was increased in the second example, as displayed in Figure 1. In this example, the same treble clef notation was maintained while variation in the bass clef notation was added relative to example 1. This variation was comprised of a whole rest in addition to different notes and their duration patterns among measures. These patterns were repeated every four measures. The third example was the most complex, as shown in Figure 1. It was composed to have unique combinations and duration of notes and rests in each measure. Note that this example was composed entirely randomly and is not meant to represent a harmonic sound structure.
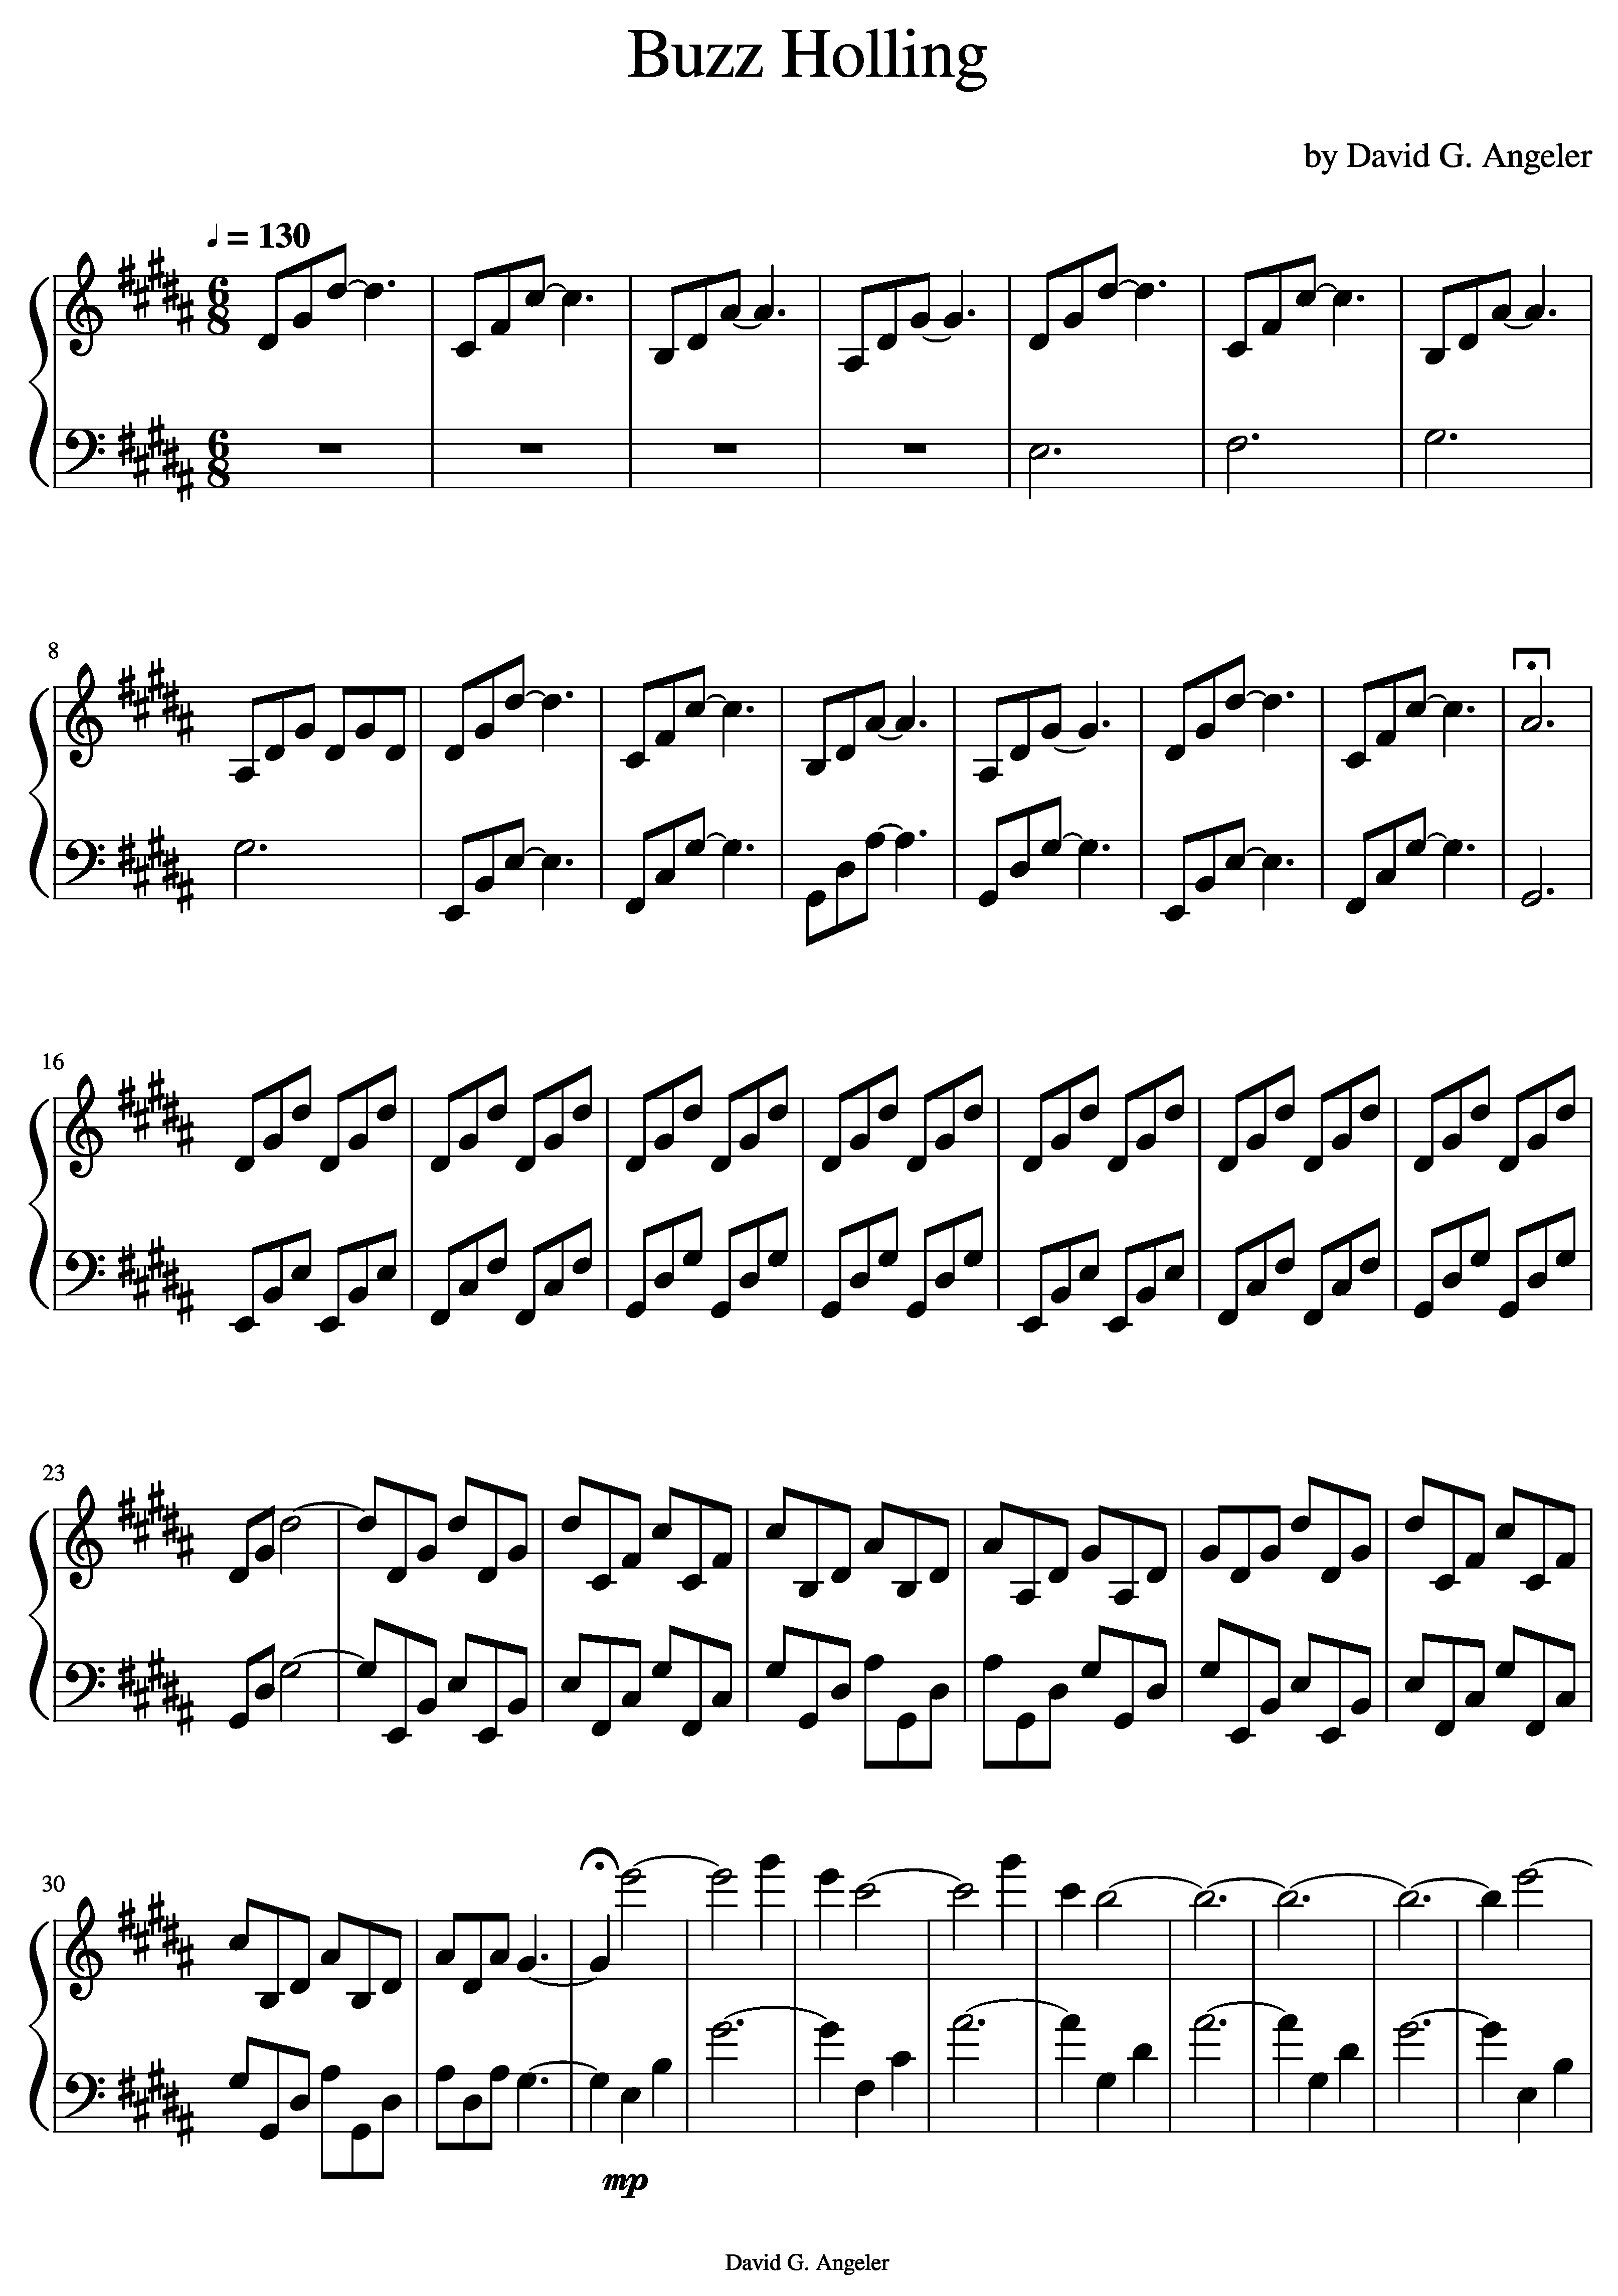
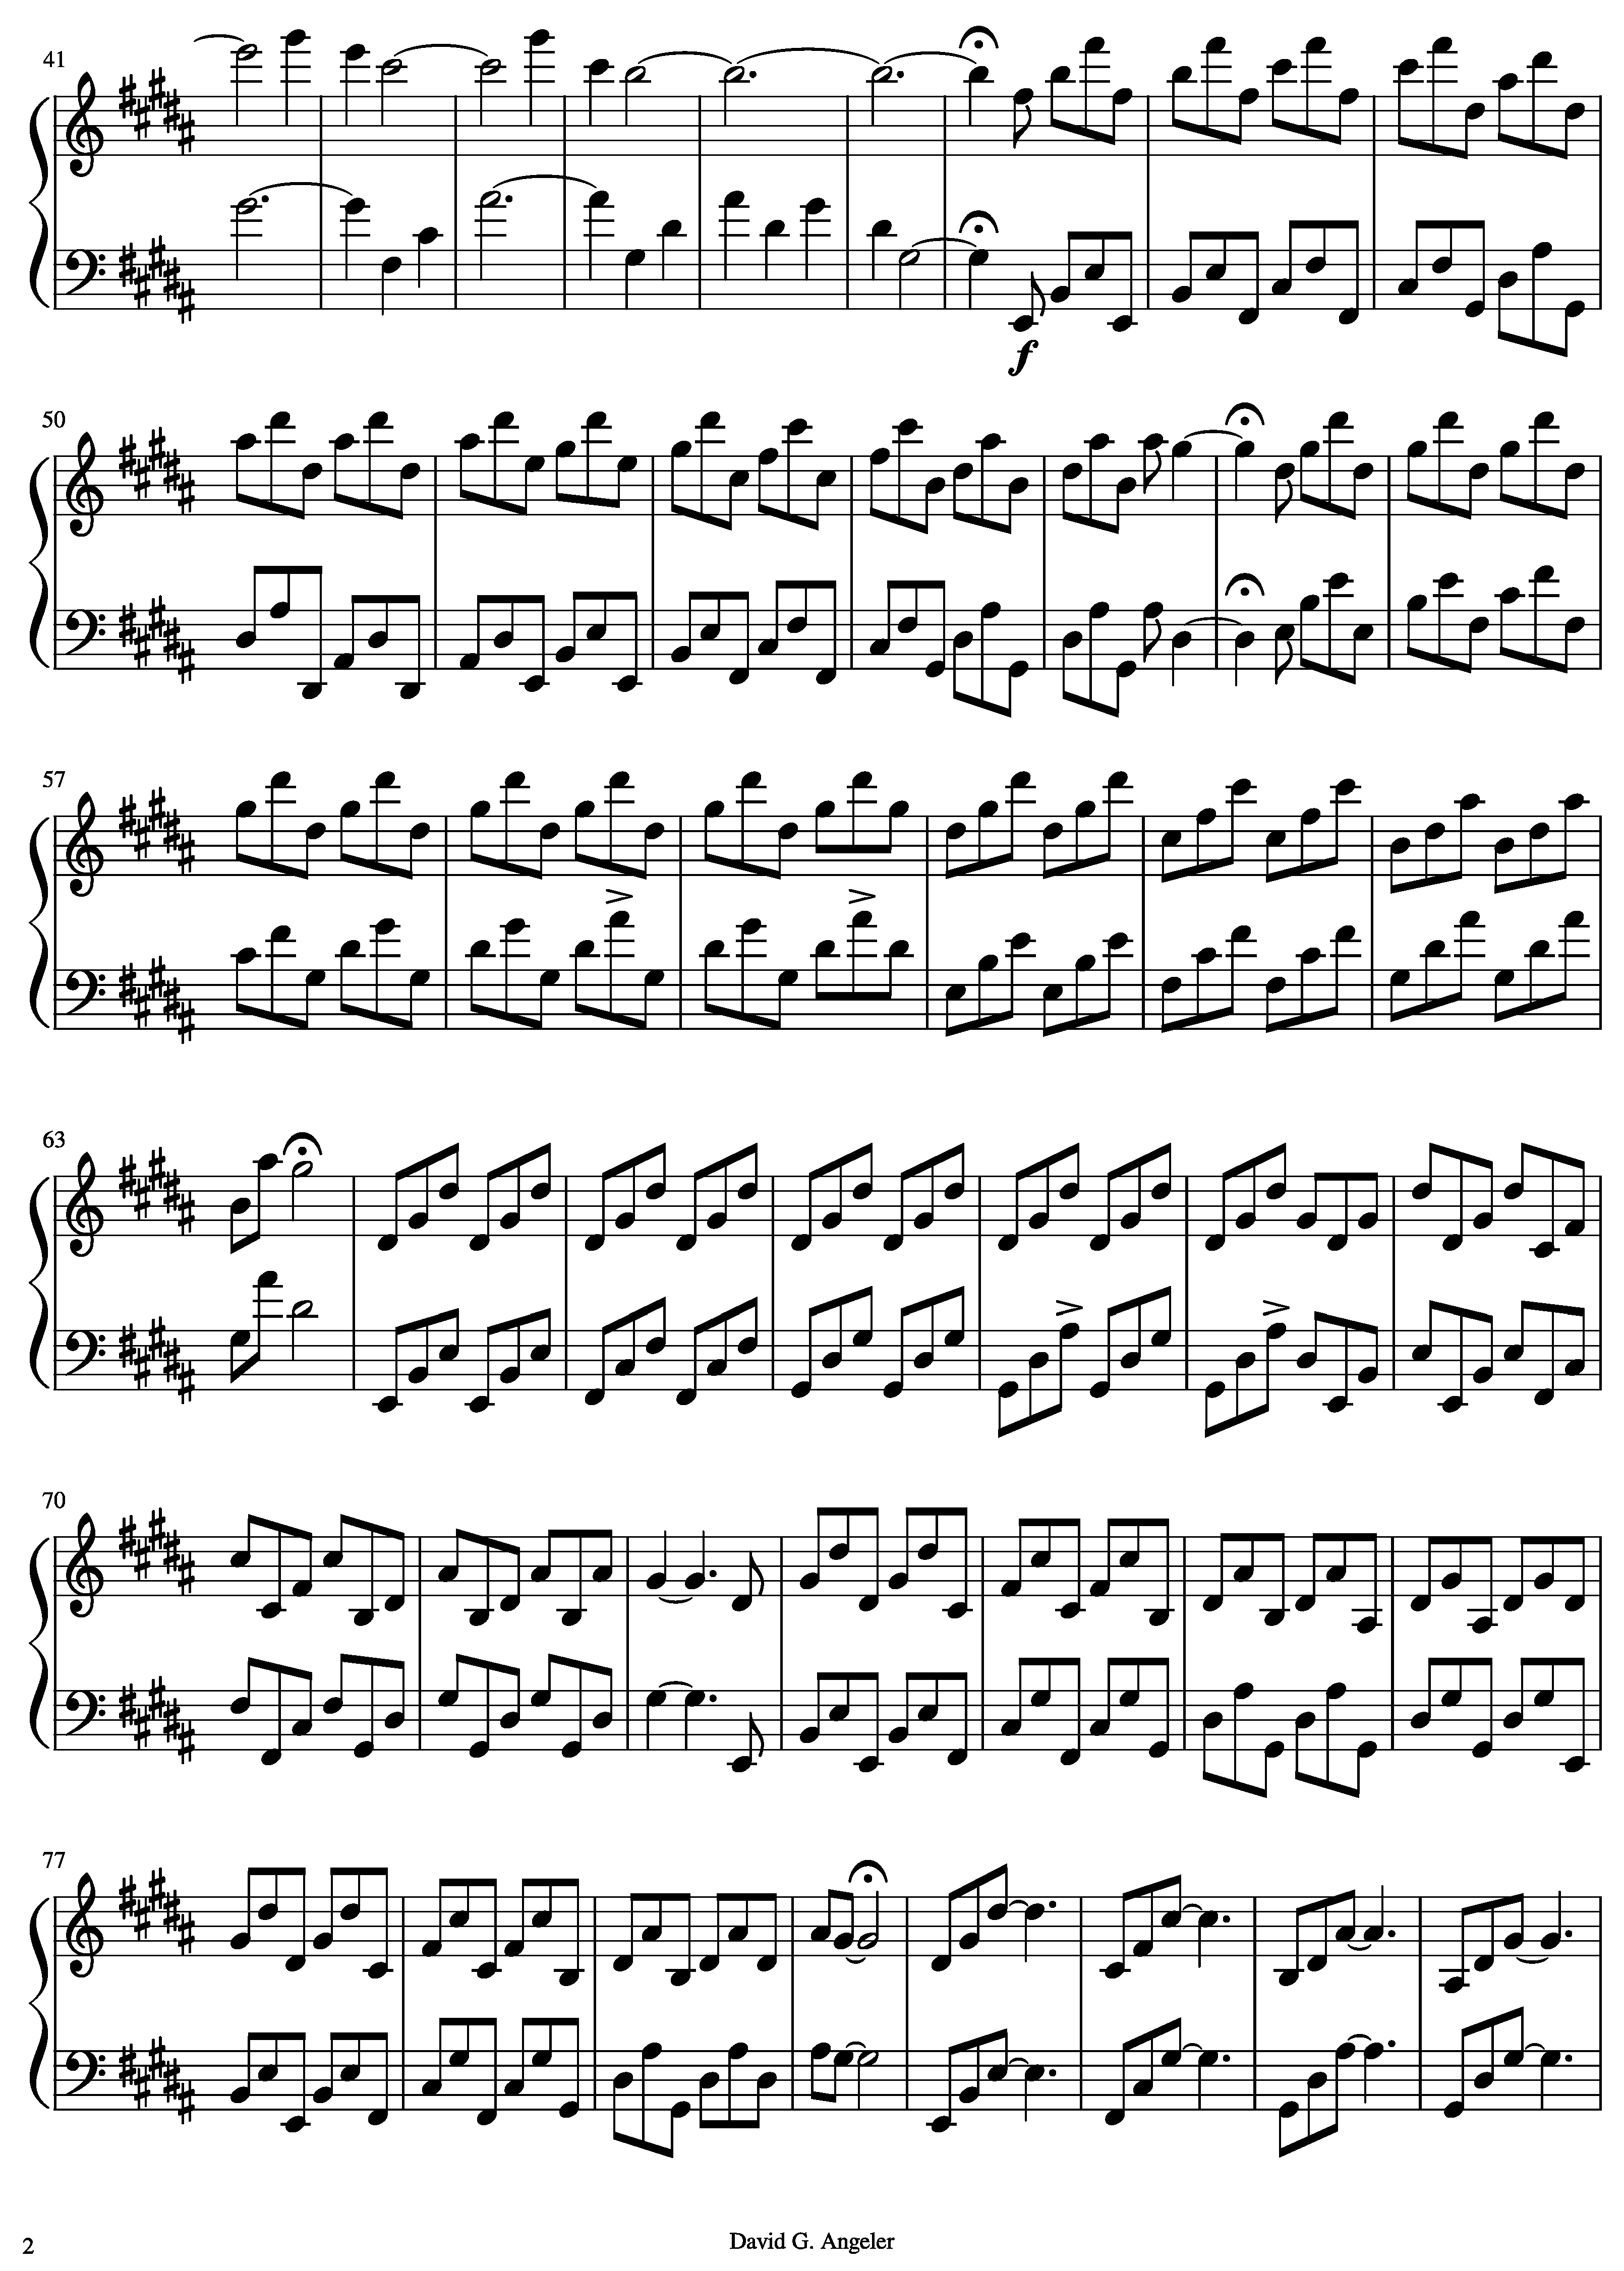
In addition to these demonstration examples two scores with different levels of complexity were used. The first score is a popular English lullaby (Twinkle Twinkle Little Star; sheet in Appendix A), which is very simple in structure. The second score, titled “Buzz Holling” (sheet in Appendix B), is a composition by the author and has higher structural complexity compared to the lullaby. This piece has been composed in honor of C.S. (Buzz) Holling, the pioneer of ecological resilience research, which is the field of the author’s expertise.
The examples used in this study provide a proof of concept and have been specifically chosen to test the hypothesis that increasing complexity in score structure increases alpha, beta, and gamma diversity in the scores. That is, increasing variability in pitch and duration patterns of notes across measures increases alpha and gamma diversity. In turn, with higher variability across measures, they become more differentiated from each other, so that beta diversity increases.
2.3. Matrix Preparation
For analyzing biodiversity components in the scores, matrices were prepared in Microsoft Excel that followed essentially the style used in ecological analyses of biodiversity. That is, every single measure in the score was treated as a musical equivalent of an ecosystem embedded in a landscape. Thus, the notations of each measure were ordered in a single row and served to calculate alpha diversity. The sequence of measures in the scores was organized serially, so that measure 1 comprised the first row, measure 2 the second row, and so forth. At the end of the matrix (after the last measure in each score) an additional row was added, and the sum of values was calculated across rows. This served to calculate gamma diversity in the whole score.
The notes and rests, as the equivalents of animal or plant species within ecosystems, were organized in columns. Every note or rest was considered one diversity unit per measure, as shown in Table 1. Every note was treated distinctly; that is, different durations of the same note (e.g., c1 whole and c1 quarter or half rest, quarter rest and sixteenth rest) were coded as different diversity units. For demonstration of the approach, notations in both the treble and bass clef were quantified together for each measure. Notes and rests of the same type were quantified according to their occurrence in the measures (i.e., a note scored 3 if three F quarter notes occurred in one measure in either the treble or bass clef. Identically, if only a single quarter rest occurred in a measure, it scored 1, etc., as shown in Table 1). In the preparation of the matrix for the Buzz Holling score, articulations, ties and dynamics were ignored for codification.
2.4. Analyses
This study was inspired from the field of ecology to quantify biodiversity in scores at different scales, as shown in Table 1. That is, biodiversity was assessed (1) at the level of individual measures (i.e., notes within a measure; alpha diversity), (2) across measures at the entire score level (notes across measures comprise gamma diversity), and (3) the structural differentiation of notes across measures in an entire score (beta diversity). In this study, following ecological nomenclature, biodiversity is used as an umbrella term for different diversity metrics: (1) richness (which only quantifies the occurrence of notes); (2) diversity (exponentiated Shannon entropy; expH’). This metric accounts both for the occurrences of notes and their abundances in a score; exponentiation of Shannon entropy is carried out in ecology for achieving mathematically correct comparison with richness [20,23]; and (3) evenness, which expresses how even notations occur in a score in term of their abundances (definitions in Table 1). Alpha diversity and gamma diversity for richness and diversity were calculated in the Primer 6 (Primer-E, Plymouth, UK) software for Windows. Beta diversity was calculated following Whittaker’s [28,29] multiplicative partitioning method (beta diversity equals gamma diversity divided by averaged alpha diversity). Evenness was calculated by dividing diversity with richness [22].
3. Results
As expected, biodiversity measures increased with increasing complexity across scores, as shown in Table 2. These increases were observed at the alpha, beta and gamma diversity level, independent of the biodiversity measures used (richness, diversity, evenness). Example 1 with its most simple structure had a mean alpha richness of 2, showing that each measure had consistently 2 notations (one full note, one full rest), as shown in Figure 1. The gamma richness value in this example was 3, showing that at the entire score level 3 notations occurred (full c2, full d2, full rest). Beta richness in this example was 1.50; it shows the differentiation between notations at the gamma and mean alpha level. That is, across measures one notation (whole rest in the bass clef) was shared, while the alternation of notes (c2, d2) between measures in the treble clef resulted to the contribution of each note to half of the score structure, as shown in Figure 1.
Diversity (Shannon entropy; expH’) in this example shows deviations relative to the richness results. Beta (1.41) and gamma (2.83) diversity were slightly lower relative to richness values, while alpha diversity showed the same value (2.00). These differences can be explained by the unequal occurrence of notes in the entire example. That is, there occurred 8 full c2 while only 7 full d2 were present in the 15 measures. The slight dominance of c2 over d2 results in a marginally uneven structure in the composition. This unevenness decreased beta and gamma diversity values because these different abundances are accounted for in Shannon entropy. In turn, these differences manifest also in evenness values. Because Shannon entropy and richness had the same alpha values, evenness was perfect (value = 1). This means that there is no difference in the abundance structure of notes at the level of measures. By contrast, gamma evenness was slightly lower (0.94) than alpha evenness. This reflects the slight difference in the abundance structure of notes at the level of the entire example.
The examination of biodiversity patterns in example 1 is relatively simple but becomes more difficult with the increasing complexity of the other examples. The biodiversity calculations allow for identifying objectively the differences among examples. They also allow contextualizing this complexity with that present in the Buzz Holling and lullaby score. Gamma richness and diversity showed the highest increase from example 1 to 3, with richness increasing 24 times (from 3 to 72) and diversity about 21 times (from 2.83 to 60.16), as shown in Table 2. Less pronounced were these increases for beta diversity (6.7 and 7 times for diversity and richness, respectively), and alpha diversity (3.2 times, diversity; 3.4 times, richness), also shown in Table 2. Despite these changes, evenness values were equal or higher to 0.84, as displayed in Table 2. As evenness values are bound between 0 (highly uneven) and 1 (perfect evenness), this shows a relatively homogenous dominance structure of notations across examples.
Comparing structure across scores showed that richness and diversity values at the beta and gamma level of Twinkle Twinkle Little Star fell between examples 2 and 3, while its alpha richness and diversity fell between examples 1 and 2, as shown in Table 2. Richness and diversity values at the beta and gamma level of the Buzz Holling score exceeded approximately twice the values of example 3. The alpha richness and diversity of this score were slightly lower than those of example 3.
4. Discussion
This paper provides a proof of concept regarding the utility of an interdisciplinary approach, rooted in quantitative ecology, for analyzing diversity in musical scores. It is emphasized that the approach focuses merely on structural complexity in compositions, providing possibilities to objectively quantify this complexity. Complexity has additional dimensions, which in music manifest as, and emerge from, subjective and relative perceptions associated with aesthetics. In this sense, complexity, rather than a structural building block of music, is how it functions, for instance at the level of gesture, and how complex ideas, whether mathematical, philosophical or spiritual, might be worked out and expressed musically. It is clear that the present approach exclusively targets the quantification of structural complexity present in written music, thereby aligning with the goals of objectivity in quantitative musicology [1]. While being agnostic about the functional or aesthetic dimensions of complexity, an objective quantification of structure allows to contrast the structure among different “musical ecosystems” belonging to tonal (harmonic), atonal and panchromatic music that vary substantially at the functional and aesthetic level. To this end, several applications, for which an exhaustive enumeration was beyond the scope of this paper, can be envisioned for future research in musicology. Selected applications can focus, for instance, on the evaluation of how much individual instruments contribute to the diversity in orchestral performances or on the comparison of the complexity in compositions among composers. Also, studying the variability of musical diversity within and across genres is a further possibility for research. Such analysis can target phylogenetic and ontogenetic developments in music. That is, phylogenetic analysis may allow assessing how genres of music, reflected in the diversity of compositions, develop over time and across geographical regions. Numerical analyses can complement currently existing subjective qualitative analysis of genre evolution (e.g., [7]), and target the analysis of disparate genres such as electronic dance music, classical music, tribal music, flamenco and heavy metal. Ontogenetic studies may allow assessing how the diversity of compositions changes during a composer’s or band’s lifetime. Constant experimentation with music is a critical component in the work of many artists (e.g., Bob Dylan [30]), as it is in music at large, and numerical analysis using the approach suggested here could help assess how structural diversity in their work changes as a function of this experimentation. Such information can then be contrasted with other cultural, psychological, and historical variables, among others (e.g., aesthetics).
The author agrees with Beran [4] that there is a certain risk that music could lose its charm, once numbers explain it. However, from a scientific viewpoint, the quantification approach presented here allows for explicit hypothesis testing to obtain knowledge through deductive inference. Hypothetical-deductive inference, a common scientific method, might unravel many of the unknown intricacies of music, not only as a form of complex adaptive system within the (acoustic) arts [31], but also as a broader socio-musicological system in which music and people are strictly interlinked [7].
Musicologists have recognized the difficulty with many complex quantitative models (e.g., predictive, probabilistic, hierarchical modeling; cellular automata), to often capture and reflect genuine musical principles [27]. Such difficulties may arise because modeling frequently requires complex parameterization that may lead to a misrepresentation of phenomena under study [32]. In this regard, the biodiversity analysis approach presented here has little risk. It does not require a priori parameter setting before calculations. The approach rather extracts information present in the subjects based on the rules (a priori definition of analysis levels [alpha, beta, gamma]), which can be applied across music scores. Thus, one benefit that may derive from a biodiversity analysis in music scores is that it can provide a numerical benchmark against which the performance of more complex hierarchical models can be assessed, and potential recalibration informed. Such an application seems especially suitable for making comparisons based on information theoretical analysis because measurements such as Shannon entropy are common in both quantitative musicological modeling [15] and diversity studies in ecology ([25]; this study).
A further benefit that derives from the biodiversity analysis approach presented here is that different “phenomena” present in musical scores can be studied individually and in combination. That is, ecologists consider evenness, richness and diversity to represent different aspects in the characterization of complex assemblages of animals and plants in the environment. These different measures thus help making nature’s structural complexity more tractable, particularly if it can be assessed at different scales (alpha, beta and gamma diversity). Musical compositions can undoubtedly also be structured in complex ways [6]. However, in comparison to biodiversity studies, a focus on diversity in music based on Shannon entropy is agnostic to the evenness or dominance and richness components of notations in compositions. Objectively analyzing and understanding such complexity as part of musical structure has long intrigued music scholars. Studying different structural phenomena across different levels in composition using the ecological approach demonstrated in this paper can assist them as a complement to existing modeling methods in their endeavors to scrutinize structural complexity.
The relationship between structure and complexity in music and human cognition has been long recognized [33]. It is beyond the aim of this study to speculate about the value of biodiversity analysis to study psychological or other functional aspects related to music. However, the present study points to recent research, which used biodiversity analysis for assessing structure in visual art works [34]. Such an analysis might find similar applications in music research. It has been proposed that “numbers” could provide a common measure stick against which people’s subjective perceptions of art can be gauged [34]. Such a process might help to reconceptualize “seeing” (or “hearing” following the present study) as questioning [35]. In turn, inquiring through questioning might facilitate information processing and trigger a learning process [36]. Through this process perceptional uncertainty, which also characterizes music [37], could be reduced. Numerically underpinning structure in music can potentially help listeners comprehend complexity in music, particularly assessing to what degrees structural and functional (aesthetics) dimensions of complexity are aligned, and as such contribute to a broader understanding of music as an art-science system.
In conclusion it is acknowledged that the biodiversity terminology used in this paper is ecological. This choice was deliberate to emphasize that the application of the biodiversity framework to music is borrowed from the field of ecology. Not only does this give credit to its origin, but also reduces the risk of “reinventing the wheel”. Arguably musicologists may feel uncomfortable using this terminology. It is far from the author’s aim to impose it; rather the adaptation of terms in a more specific music context, made by and for musicologists, could improve effective communication and potential application of the biodiversity analysis framework. Such adaptation of terminology, while acknowledging its origin, could potentially contribute to the needed perception of musicology as an integral part of interdisciplinary science [7,38].
Funding
This research received no external funding
Acknowledgments
The author thanks José Benavent-Corai for initial discussions of this topic, literature references and comments on a previous manuscript version. Two anonymous reviewers provided helpful comments that improved the paper. This paper is dedicated to the memory of C.S. Holling.
Conflicts of Interest
The author declares no conflict of interest.
Appendix A
Music sheet of Twinkle, Twinkle Little Star.
Available online at: https://makingmusicfun.net/htm/f_printit_free_printable_sheet_music/twinkle-twinkle-little-star-piano-solo.php.
Figure A1.
Piano sheet of Twinkle, Twinkle Little Star.

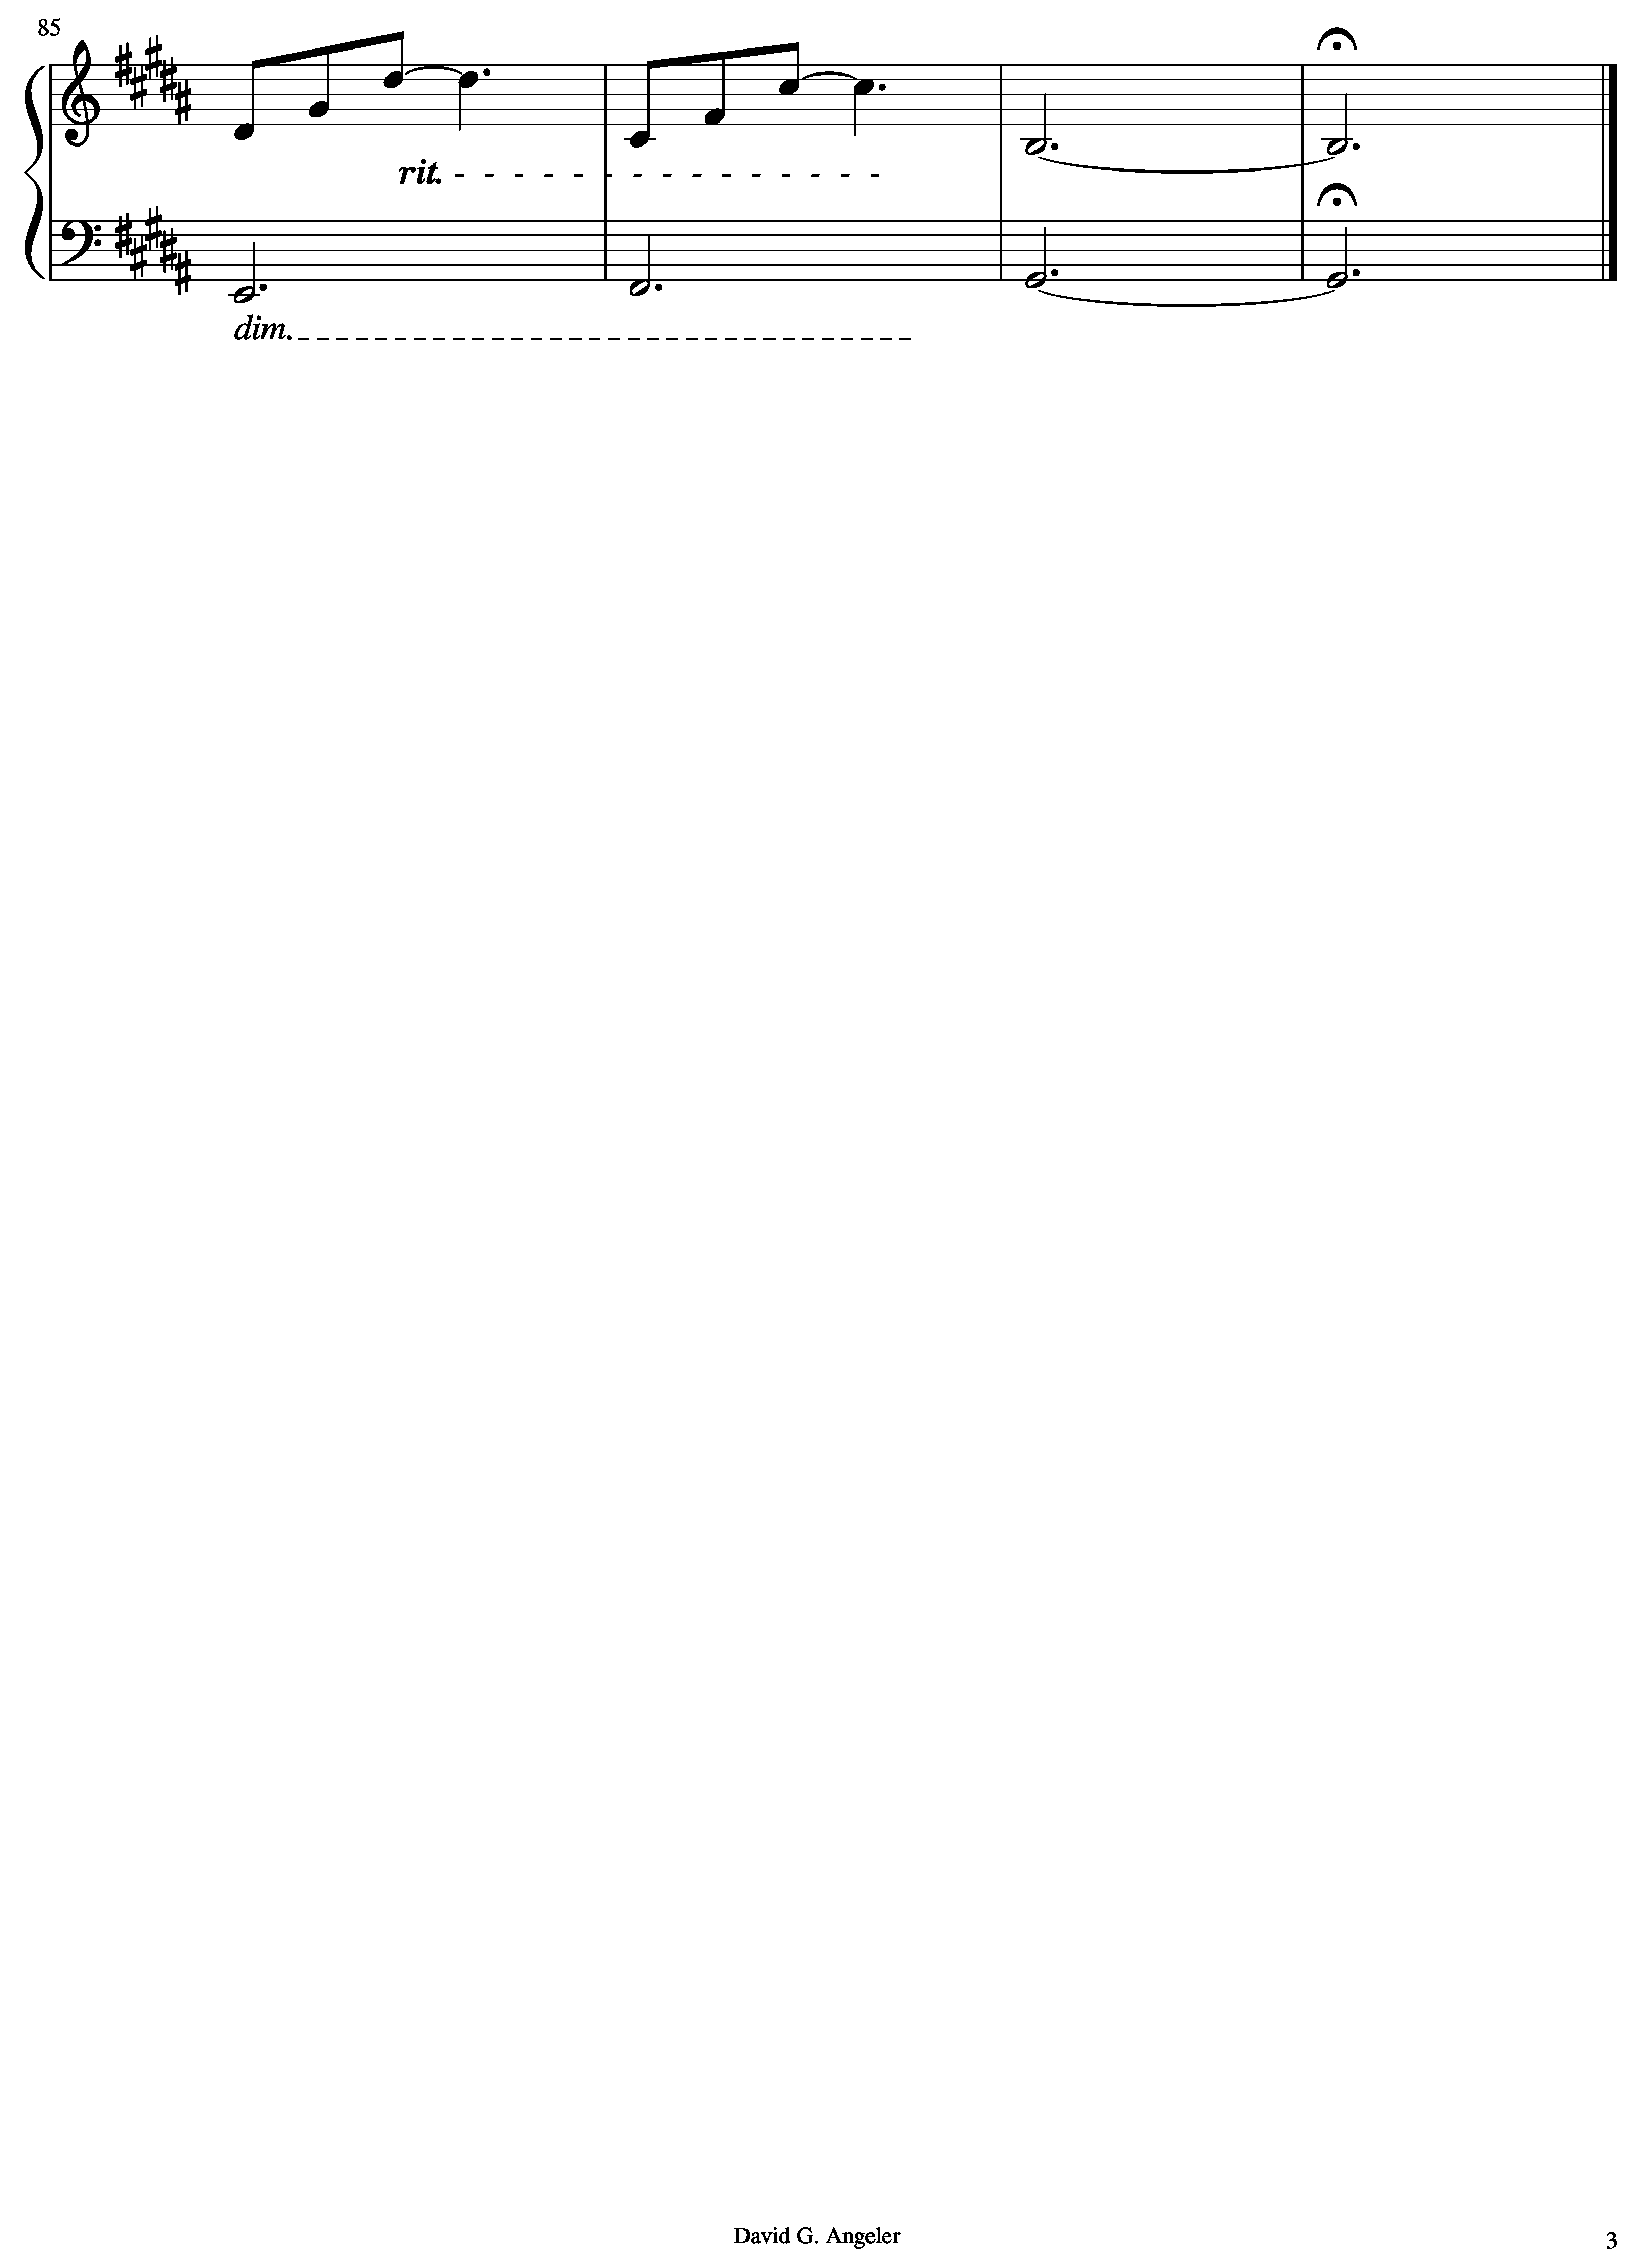
Appendix B
Composition in honor of C.S. (Buzz) Holling.
Figure A2.
Piano sheet of Buzz Holling.


References
- Beran, J. Statistics in Musicology; CRC Press: Boca Raton, FL, USA, 2003. [Google Scholar]
- Pesek, M.; Leonardis, A.; Marolt, M. Robust real-time music transcription with a compositional hierarchical model. PLoS ONE 2017, 12, e0169411. [Google Scholar] [CrossRef]
- Sundstrom, S.M.; Angeler, D.G.; Garmestani, A.S.; García, J.H.; Allen, C.R. Transdisciplinary application of cross-scale resilience. Sustainability 2014, 6, 6925–6948. [Google Scholar] [CrossRef]
- Beran, J. Music−chaos, fractals, and information. Chance 2004, 17, 7–16. [Google Scholar] [CrossRef]
- Allen, C.R.; Angeler, D.G.; Garmestani, A.S.; Gunderson, L.H.; Holling, C.S. Panarchy: Theory and applications. Ecosystems 2004, 17, 578–589. [Google Scholar] [CrossRef]
- Lerdahl, F.; Jackendoff, R. An overview of hierarchical structure in music. Music Percept. Interdiscip. J. 1983, 1, 229–252. [Google Scholar] [CrossRef]
- Angeler, D.G. Heavy metal music meets complexity and sustainability science. SpringerPlus 2016, 5, 1637. [Google Scholar] [CrossRef]
- Lewis, G.E. Too many notes: Computers, complexity and culture in Voyager. Leonardo Music J. 2000, 10, 33–39. [Google Scholar] [CrossRef]
- Bereznak, C. Musica: A whole systems approach. Music Ther. 1985, 5, 3–11. [Google Scholar]
- Baffioni, C.; Guerra, F.; Lalli, L. Music and aleatory processes. In Proceedings of the 5-Tage-Kurs of the USP Mathematisierung at Bielefeld University, Bielefeld, Germany, 12–16 October 1981; pp. 273–303. [Google Scholar]
- Keller, D. Compositional processes from an ecological perspective. Leonardo Music J. 2000, 10, 55–60. [Google Scholar] [CrossRef]
- Georgescu, C.; Georgescu, M. A system approach to music. J. New Music Res. 1990, 19, 15–52. [Google Scholar] [CrossRef]
- Fox, C. New Complexity. In The New Grove Dictionary of Music and Musicians, 2nd ed.; Sadie, S., Tyrrell, J., Eds.; Macmillan: London, UK, 2001. [Google Scholar] [CrossRef]
- Youngblood, J. Style as information. J. Music Theory 1958, 2, 24–31. [Google Scholar] [CrossRef]
- Knopoff, L.; Hutchinson, W. Entropy as a measure of style: The influence of sample length. J. Music Theory 1983, 27, 75–97. [Google Scholar] [CrossRef]
- Pearce, M.T. Early Applications of Information Theory to Music; Centre for Cognition, Computation and Culture, Goldsmiths College: London, UK, 2007. [Google Scholar]
- Hansen, N.C.; Pearce, M.T. Shannon entropy predicts perceptual uncertainty in the generation of melodic pitch expectations. In Proceedings of the 12th International Conference on Music Perception and Cognition and the 8th Triennial Conference of the European Society for the Cognitive Sciences of Music, Thessaloniki, Greece, 23–28 July 2012; pp. 406–407. [Google Scholar]
- Culpepper, S.E. Musical time and information theory entropy. Master’s Thesis, University of Iowa, Iowa City, IA, USA, 2010. [Google Scholar] [CrossRef]
- Hawes, V. Number Fetishism: The History of the Use of Information Theory as a Tool for Musical Analysis. In Music’s Intellectual History; Blazekovic, Z., Dobbs Mackenzie, B., Eds.; RILM: New York, NY, USA, 2009; pp. 836–838. [Google Scholar]
- Baselga, A. Multiplicative partitioning of true diversity yields independent alpha and beta components, additive partitioning does not. Ecology 2010, 91, 1974–1981. [Google Scholar] [CrossRef] [PubMed]
- Tuomisto, H. A diversity of beta diversities: Straightening up a concept gone awry. Part 1. Defining beta diversity as a function of alpha and gamma diversity. Ecography 2010, 33, 2–22. [Google Scholar] [CrossRef]
- Tuomisto, H. An updated consumer’s guide to evenness and related indices. Oikos 2012, 121, 1203–1218. [Google Scholar] [CrossRef]
- Jost, L. Partitioning diversity into independent alpha and beta components. Ecology 2007, 88, 2427–2439. [Google Scholar] [CrossRef]
- Jost, L. The relation between evenness and diversity. Diversity 2010, 2, 207–232. [Google Scholar] [CrossRef]
- Magurran, A.E. Measuring Biological Diversity; Blackwell: Oxford, UK, 2004. [Google Scholar]
- Angeler, D.G.; Drakare, S. Tracing alpha, beta and gamma diversity responses to environmental change in boreal lakes. Oecologia 2013, 172, 1191–1202. [Google Scholar] [CrossRef]
- Witten, I.H.; Conklin, D. Modeling music: Systems, structure, and prediction. J. New Music Res. 1990, 19, 53–66. [Google Scholar] [CrossRef]
- Whittaker, R.H. Vegetation of the Sisjiyou Mountains, Oregon and California. Ecol. Monogr. 1960, 30, 279–338. [Google Scholar] [CrossRef]
- Whittaker, R.H. Evolution and measurement of species diversity. Taxon 1972, 21, 213–251. [Google Scholar] [CrossRef]
- Boucher, D.; Browning, G. The Political Art of Bob Dylan: Revised and Expanded Second Edition; Andrews UK Limited: Luton, UK, 2015. [Google Scholar]
- Leman, M. Music and dynamic systems. J. New Music Res. 1990, 19, 1–2. [Google Scholar] [CrossRef]
- Mouchart, M.; Orsi, R. Building a structural model: Parameterization and structurality. Econometrics 2016, 4, 23. [Google Scholar] [CrossRef]
- Meyer, L.B. Meaning in music and information theory. J. Aesthet. Art Crit. 1957, 15, 412–424. [Google Scholar] [CrossRef]
- Angeler, D.G. Viewing biodiversity through the lens of science…and art! SpringerPlus 2016, 5, 1174. [Google Scholar] [CrossRef] [PubMed]
- Thomsen, D.C. Seeing is questioning: Prompting sustainability discourses through an evocative visual agenda. Ecol. Soc. 2015, 20, 9. [Google Scholar] [CrossRef]
- Wyer, R.S.; Srull, T.K. Human cognition in its social context. Psychol. Rev. 1986, 93, 322–359. [Google Scholar] [CrossRef]
- Clayton, M.; Dueck, B.; Leante, L. Experience and Meaning in Music Performance; Oxford University Press: Oxford, UK, 2013. [Google Scholar]
- Naveda, L. Music and Dance Representations at the Crossroads of Humanities and Sciences. In 2nd Annual International Conference on Humanities & Arts in a Global World; Georgaki, A., Kouroupetroglou, G., Eds.; Athens Institute for Educations and Research—Atiner: Athens, Greece, 2015. [Google Scholar]
Figure 1.
Three examples with ascending complexity composed in MuseScore for analyzing alpha, beta and gamma diversity.
Figure 1.
Three examples with ascending complexity composed in MuseScore for analyzing alpha, beta and gamma diversity.


Table 1.
Description of ecological diversity measures and their contextualization within and application to music (“music-diversity”).
Table 1.
Description of ecological diversity measures and their contextualization within and application to music (“music-diversity”).
| Biodiversity Measure | Ecology | Music |
|---|---|---|
| Alpha diversity | Number of animal and plant species within a single ecosystem (e.g., a lake) | Number of notations differing in duration and pitch within a measure |
| Gamma diversity | Number of animal and plant species across ecosystems in a region (e.g., a lake landscape) | Number of notations with different durations and pitches across measures (i.e., within an entire score) |
| Beta diversity 1 | Differentiation of diversity of species and animals across ecosystems in a region | Differentiation of diversity of notations across measures in a score |
| Diversity unit | Biological species | Musical notation 2 |
| Abundance | Number of the same species in an ecosystem | Number of notations with the same pitch and duration in a measure |
| Richness | Number of species in an ecosystem without accounting for their abundances | Number of notations in a score without accounting for their abundances |
| Diversity 3 | Number of species in an ecosystem accounting for their abundances | Number of notations in a score accounting for their abundances |
| Evenness 4, 5 | Closeness of species abundances in an ecosystem | Closeness of notations abundances in a score |
1 Expressed as gamma diversity divided by mean alpha diversity; 2 In this study, the notations with the same pitch but different durations are considered different diversity units (e.g., 1/4 c2 vs. 1/8 c2); 3 Expressed as Shannon entropy, expH’; 4 Expressed as diversity divided by richness; 5 A community/composition of 5 species/notations A and 5 species/notations B is perfectly even; a community/composition with 5 species/notations A and 1 species/notation B is uneven.
Table 2.
Mean alpha, beta and gamma diversity values calculated for three examples and two real scores.
Table 2.
Mean alpha, beta and gamma diversity values calculated for three examples and two real scores.
| Example 1 | Example 2 | Example 3 | TTLS 1 | Buzz Holling | |
|---|---|---|---|---|---|
| Richness | |||||
| Mean Alpha | 2.00 | 2.80 | 6.80 | 2.42 | 6.14 |
| Beta | 1.50 | 3.21 | 10.59 | 9.10 | 23.30 |
| Gamma | 3.00 | 9.00 | 72.00 | 22.00 | 143.00 |
| Shannon entropy | |||||
| Mean Alpha | 2.00 | 2.75 | 6.40 | 2.34 | 5.97 |
| Beta | 1.41 | 3.07 | 9.40 | 7.21 | 20.15 |
| Gamma | 2.83 | 8.46 | 60.16 | 16.84 | 120.18 |
| Evenness | |||||
| Mean Alpha | 1.00 | 0.98 | 0.94 | 0.97 | 0.97 |
| Gamma | 0.94 | 0.94 | 0.84 | 0.77 | 0.84 |
1 Twinkle Twinkle Little Star.
© 2020 by the author. Licensee MDPI, Basel, Switzerland. This article is an open access article distributed under the terms and conditions of the Creative Commons Attribution (CC BY) license (http://creativecommons.org/licenses/by/4.0/).
Share and Cite
MDPI and ACS Style
Angeler, D.G. Biodiversity in Music Scores. Challenges 2020, 11, 7. https://doi.org/10.3390/challe11010007
AMA Style
Angeler DG. Biodiversity in Music Scores. Challenges. 2020; 11(1):7. https://doi.org/10.3390/challe11010007
Chicago/Turabian StyleAngeler, David G. 2020. "Biodiversity in Music Scores" Challenges 11, no. 1: 7. https://doi.org/10.3390/challe11010007
APA StyleAngeler, D. G. (2020). Biodiversity in Music Scores. Challenges, 11(1), 7. https://doi.org/10.3390/challe11010007
Note that from the first issue of 2016, this journal uses article numbers instead of page numbers. See further details here.