Article

End to End Delay and Energy Consumption in a Two Tier Cluster Hierarchical Wireless Sensor Networks

by
Vicente Casares-Giner
1,*,†,‡,
Tatiana Inés Navas
2,†,
Dolly Smith Flórez
2,† and
Tito Raúl Vargas Hernández
2,†
1
ITACA, Universitat Politècnica de València, 46022 València, Spain
2
Faculty of Telecommunications Engineering, Universidad Santo Tomás, Bucaramanga 680001, Colombia
*
Author to whom correspondence should be addressed.
This paper is an extended version of our paper published in ITNG-2018.
Current address: Universitat Politècnica de València, Camino de vera, s/n, 46022 Valencia, Spain.
Information 2019, 10(4), 135; https://doi.org/10.3390/info10040135
Submission received: 22 January 2019 / Revised: 7 March 2019 / Accepted: 1 April 2019 / Published: 10 April 2019
(This article belongs to the Special Issue Information Technology: New Generations (ITNG 2018))

Abstract

:
In this work it is considered a circular Wireless Sensor Networks (WSN) in a planar structure with uniform distribution of the sensors and with a two-level hierarchical topology. At the lower level, a cluster configuration is adopted in which the sensed information is transferred from sensor nodes to a cluster head (CH) using a random access protocol (RAP). At CH level, CHs transfer information, hop-by-hop, ring-by-ring, towards to the sink located at the center of the sensed area using TDMA as MAC protocol. A Markovian model to evaluate the end-to-end (E2E) transfer delay is formulated. In addition to other results such as the well know energy hole problem, the model reveals that for a given radial distance between the CH and the sink, the transfer delay depends on the angular orientation between them. For instance, when two rings of CHs are deployed in the WSN area, the E2E delay of data packets generated at ring 2 and at the “west” side of the sink, is 20% higher than the corresponding E2E delay of data packets generated at ring 2 and at the “east” side of the sink. This asymmetry can be alleviated by rotating from time to time the allocation of temporary slots to CHs in the TDMA communication. Also, the energy consumption is evaluated and the numerical results show that for a WSN with a small coverage area, say a radio of 100 m, the energy saving is more significant when a small number of rings are deployed, perhaps none (a single cluster in which the sink acts as a CH). Conversely, topologies with a large number of rings, say 4 or 5, offer a better energy performance when the service WSN covers a large area, say radial distances greater than 400 m.

1. Introduction

A Wireless Sensor Network (WSN) consists of hundreds of small and low cost nodes or motes, that are spatially dispersed in a wide area to monitor and capture physical parameters of a target area. Nodes or sensors are powered with small and low cost batteries, and offers several capabilities such as sensing information (temperature, humidity, speed of the wind, etc.), data processing (compression, aggregation, ciphering, etc.) and transferring the data packets towards a gateway or central node, named as sink. For those purposes sensors are organized in a hierarchical way, using the clustering technique the most common practical solution. By clustering, a given number of nodes form a closed set, where the group leader (CH) [1] has been chosen and automatically the remaining nodes become members of the group.
One type of random access protocol (RAP) [2] is usually chosen as basic communication scheme between CH members and their CH. On the other hand, CHs communicate between themselves with the idea of transferring the sensed information to the sink, typically using a deterministic protocol such as Time Division Multiple Access (TDMA) [3]. This topology has been recognized in the open literature as a two tier cluster hierarchical WSN [4]. Two main approaches have been considered for communication between CHs. The first one is a multi-hop routing scheme, in which the information travels hop-by-hop, from one CH to another CH located in a position closer to the sink, i.e., CHs also acts as relay nodes. In this first approach, the CHs near the sink process a large traffic load, a situation that leads to a rapid depletion of the energy of those CHs, which results in the so-called problem of the energy hole. These phenomena have been widely discussed quite frequently in the literature, [4,5]. In the second approach, each CH forwards the information directly to the sink (sensor-to-sink) i.e., CH do not act as relay (intermediate) nodes. In this direct routing, we have the opposite effect: CHs away from the sink consume more energy per bit than CHs near to the sink, therefore their batteries run out faster than the batteries of the CHs near the sink [6,7].
In this work, sensors communicate with their CH by means of a simple RAP like Frame Slotted ALOHA (FSA) [8], and the communication between CHs is implemented by means of a deterministic protocol such as the TDMA adopting the hop-by-hop routing scheme. Our contribution is twofold; on one hand we provide a Markovian model to evaluate the end-to-end (E2E) transfer delay of an arbitrary data packet from the time it is originated at a given sensor until it reaches the sink. On the other hand we have addressed the evaluation of the energy consumption of the WSN as a whole. E2E delay and energy cost are key parameters that we have used as indicators of the performance of several WSN topologies.
The paper offers the following structure. In Section 2 we give a basic description of related work. In Section 3 we describe the WSN scenario. In Section 4 we deal with the communication model where the Combi-Frame is defined, keeping in mind the concept of slot-reuse and routing strategy for load balancing. Section 5 and Section 6 is concerned with intra-cluster or intra-cell and inter-cluster or inter-cell communications, respectively. In Section 7 and Section 8 we formulate the end-to-end delay model and the energy consumption model, respectively. Section 9 provides some illustrative results. Finally, the conclusions and future work are reported in Section 10.

2. Related Work

Some previous works are partially in line with our contribution. In [9] a TDMA scheme based on an innovative TreeMAC design is proposed. Using a tree topology, TreeMAC alleviates the energy hole problem (nodes near the sink are more loaded than nodes away from the sink) but the evaluation of the end-to-end delay is not provided. In [1] a cross layer non-linear optimization model is formulated for a two tier WSN. The TDMA scheduling algorithm is based on the slot reuse concept (from cellular networks) keeping in mind three interference criteria to be satisfied. While communication from cluster members to the CH is restricted to one hop, communication between CHs and Gateways can be multiple hop. After the inter-cluster slot assignment (no intra-cluster slot assignment is considered) the nodal delay is approximated derived. The E2E delay is evaluated as the sum of the nodal delays along the path to the sink. In [10] a cluster tree topology for WSN is considered and the E2E delay—local transmission + inter-cluster transmission—is evaluated in a similar way to our proposal. However no RAP for communication between sensors and CH is assumed. Instead, only a TDMA scheduling is operative for inter CH communication in which three different sub-intervals conform a super-frame (SF), i.e., the local receiving (LR) phase, the inter cluster transmitting (IT) phase and the inter cluster receiving (IR) phase. As we do in our work, CHs forward collected data from their cluster members to the sink through other CHs hop-by-hop. However, unlike [10], in our work we combine the contention phase (FSA protocol) with the contention-free phase (TDMA scheduling) and derive an exact expression for the E2E delay. In [11] the E2E analysis of a chain of K non-preemptive nodes from sensor to the sink is investigated. Poisson arrival rate and exponential service time are assumed for high (control) and low (data) priority traffic. In order to save energy a vacation period with arbitrary distribution is introduced just to capture the concept of sleep and wake-up modes. The authors use the M/G/1 queue as an approach for the analysis of each individual node, and assume independence between the nodes, so they ignore the coupling between consecutive nodes in the chain and the concept of time slot reuse has not been taken into account. In contrast, in our approach, the data packets are of fixed size, the periods of inactivity are also deterministic, and our model captures the coupling or dependency between the neighboring nodes. In [12] a data gathering tree topology for WSN is studied. As MAC protocol they use a TDMA slot assignment where each node is only permitted to send or receive data during its assigned time slot. The difference with previous works with [12] and with our work, is that the functions of time synchronization and sleep mode are added to the time intervals with the main purpose of minimizing energy consumption and data delivery time. Also indicate that [12] considers a single-level architecture, i.e., the concept of CH with its members and associated MAC is not taken into account. On the other hand, a common feature of our work with [12] is the scheduling of consecutive data packets to be forwarded from CH to CH in consecutive data mini-slots allocated in the same time slot. In [13] a hybrid TDMA/CSMA MAC (TCH-MAC) layer protocol is proposed for a two-tier architecture. CSMA with RTS/CTS control packets is considered for communication between CH members and their CH. TDMA is the adopted MAC for inter CHs communication. Throughput and energy consumptions are the parameters evaluated by simulation. The proposal is similar to our protocol, but the contention period entails some more complexity due to the CSMA implementation. In addition, the concept of reusing time slots is not implemented nor is the end-to-end delay analyzed.
In none of the proposals offered in [1,10,12,13] the energy hole problem [14] is treated. In our work this has been considered. Additionally our contribution combine both, the local or intra-communication between CH members and their CH and the inter-communication between CHs. For intra-communication the FSA as RAP is implemented (although other candidates might have been assumed). For inter-communication we design a deterministic time slot assignment, TDMA as MAC protocol. The literature available in TDMA scheduling is quite extensive. For instance, a nice survey on TDMA scheduling applied to wireless multihop networks can be found in [15]. In both, intra-communication and inter-communication, we claim to the slot reuse concept in a similar way to cellular networks. The E2E delay is analytically obtained by analyzing the corresponding open feed-forward queuing network. To the best of our knowledge this has not been derived before in open literature.

3. WSN Scenario

As can be observed in Figure 1, sensor are randomly distributed in a two-dimensional (2D) area. They are represented by small white circles. All sensors are homogeneous, equipped with identical hardware and software configuration. Also we assume omni-directional antennas with their transmission ranges as circles. Although it is not realistic, in the first instance we do not suppose any limitation in the range of coverage. Except the attenuation due to distance, we assume a perfect radio channel, that is, there are no fast or slow fading effects, nor bit errors. There is only a single transceiver unit per node. Hence, the WSN operates on a single frequency and nodes can be in one of the following three state: transmitting, receiving or sleeping. For cluster configuration purposes, we assume that all nodes know their actual physical location in the 2D-WSN area by applying some known location technique (for instance, see [16,17,18]). To cluste WSNs we could apply some well know algorithm such as in [19]; however the development of clustering algorithms is outside the scope of this works.

Cells, Sensors and Cell Head Selection

Several strategies of coverage for a WSN could be considered, such as the force-based, the grid-based and the computational geometry-based approach [20]. However, since this is not the goal of our contribution, here we have adopted the hexagonal grid-based-approach as a start-up solution or initial analysis. As Figure 1 shows, the monitored area is divided into cells with hexagonal perimeter. All hexagons have the same size, defined by radius R h (in meters). The set of hexagons are placed in rings, forming a mosaic T [21], and each hexagon represent the coverage area of a cluster. Then, the number of clusters in the WSN area is determined by r max , the number of rings that conforms the mosaic T. Clearly, for a given r max the number of clusters is given by N c ( r max ) = 1 + 3 · r max ( r max + 1 ) . Figure 1 is an example with r max = 3 then N c ( 3 ) = 37 .
All the sensors that are located within a given hexagon form a cluster. The number of motes (sensors) within a cluster is a 2D random variable that can be Poisson, uniform, etc. For the sake of brevity and conciseness, here we only assume that M s , a constant value, is the number of sensors spread throughout the service area. Also, for simplicity, here we assume that the number of sensors for each hexagon or group is given by M c ( r max ) = M s / N c ( r max ) .
For each cluster, a single node among all members, called cell head node (CH), acts as the receiver of the information sensed by the other CH members. We indicate that the number of techniques to elect one node as CH of the group is rather large [22]; but due to space limitations they are not discussed in this paper. Hence, as a first approach used in our study we have assumed that the CH is approximately located at the center of the hexagon.
To identify each hexagon or its own CH, we use hexagonal coordinates, x h , y h = x , y h . Also, for convenience, we introduce coordinates in polar-like (or ring) form x p , y p = x , y p ; which we call polar coordinates. Both are illustrated in Figure 2 where the sink is located at the center of the sensed area, i.e., x , y h = x , y p = 0 , 0 * = h , p . Finally, we divide the hexagonal grid into twelve disjoint zones: six sectors and six axes. Each sector is located between two axes. Sectors and axes are defined according to Table 1 where polar coordinates are used.

4. Communication

For the communication process we distinguish between intra-cell or intra-cluster communication and inter-cell or inter-cluster communication. The first one refers to the single-hop communication between sensors or CH members and its CH. It deals with the information captured by sensors and transmitted to their CH by means of a RAP; in our work we have chosen the FSA for its simplicity [8]. On the other hand, inter-cluster communications refers to the communication from CHs located at ring r p to neighboring CHs located at ring r p - 1 , i.e., hop-to-hop. As a consequence, the closer a CH of the sink is, the more traffic it will carry and, therefore, a deterministic protocol like TDMA seems more appropriate for this case, [3].

4.1. Frame Structure

Since a single carrier is available for communication, here we recall the reuse concept that is implemented in cellular networks (see, e.g., [23]). Two or more motes (sensors or CHs) can transmit in the same time slot and with the same frequency if at a given receiver one of the transmissions is received with enough power level over the others, that is, the potential co-channel interference is below a given threshold. Then, from [23] we remember the reuse concept by which, for any two positive integers or shift parameters i and j i the number of clusters operating at different frequency is given by N = i 2 + i j + j 2 , see Table 2. Given that the work frequency in the WSN is unique, the assignment of this operating frequency to the sensors and/or to the CHs must be in shifts and with non-overlapping time intervals. Then, for our two tier architecture were the intra-cluster and inter-cluster communication ranges are different (we provides details later), two different reuse factors are considered, ( i x , j x ) so N x = i x 2 + i x j x + j x 2 ( x = I n t r a , x = I n t e r ) . N I n t r a and N I n t e r are the number of time intervals or time slots per frame that are assigned for, respectively, intra-cluster and inter-cluster communications. Clearly we expect that N I n t r a < N I n t e r . The quantification of both parameters depends mainly on the maximum radio co-channel interference allowed and is out of the scope of this paper.
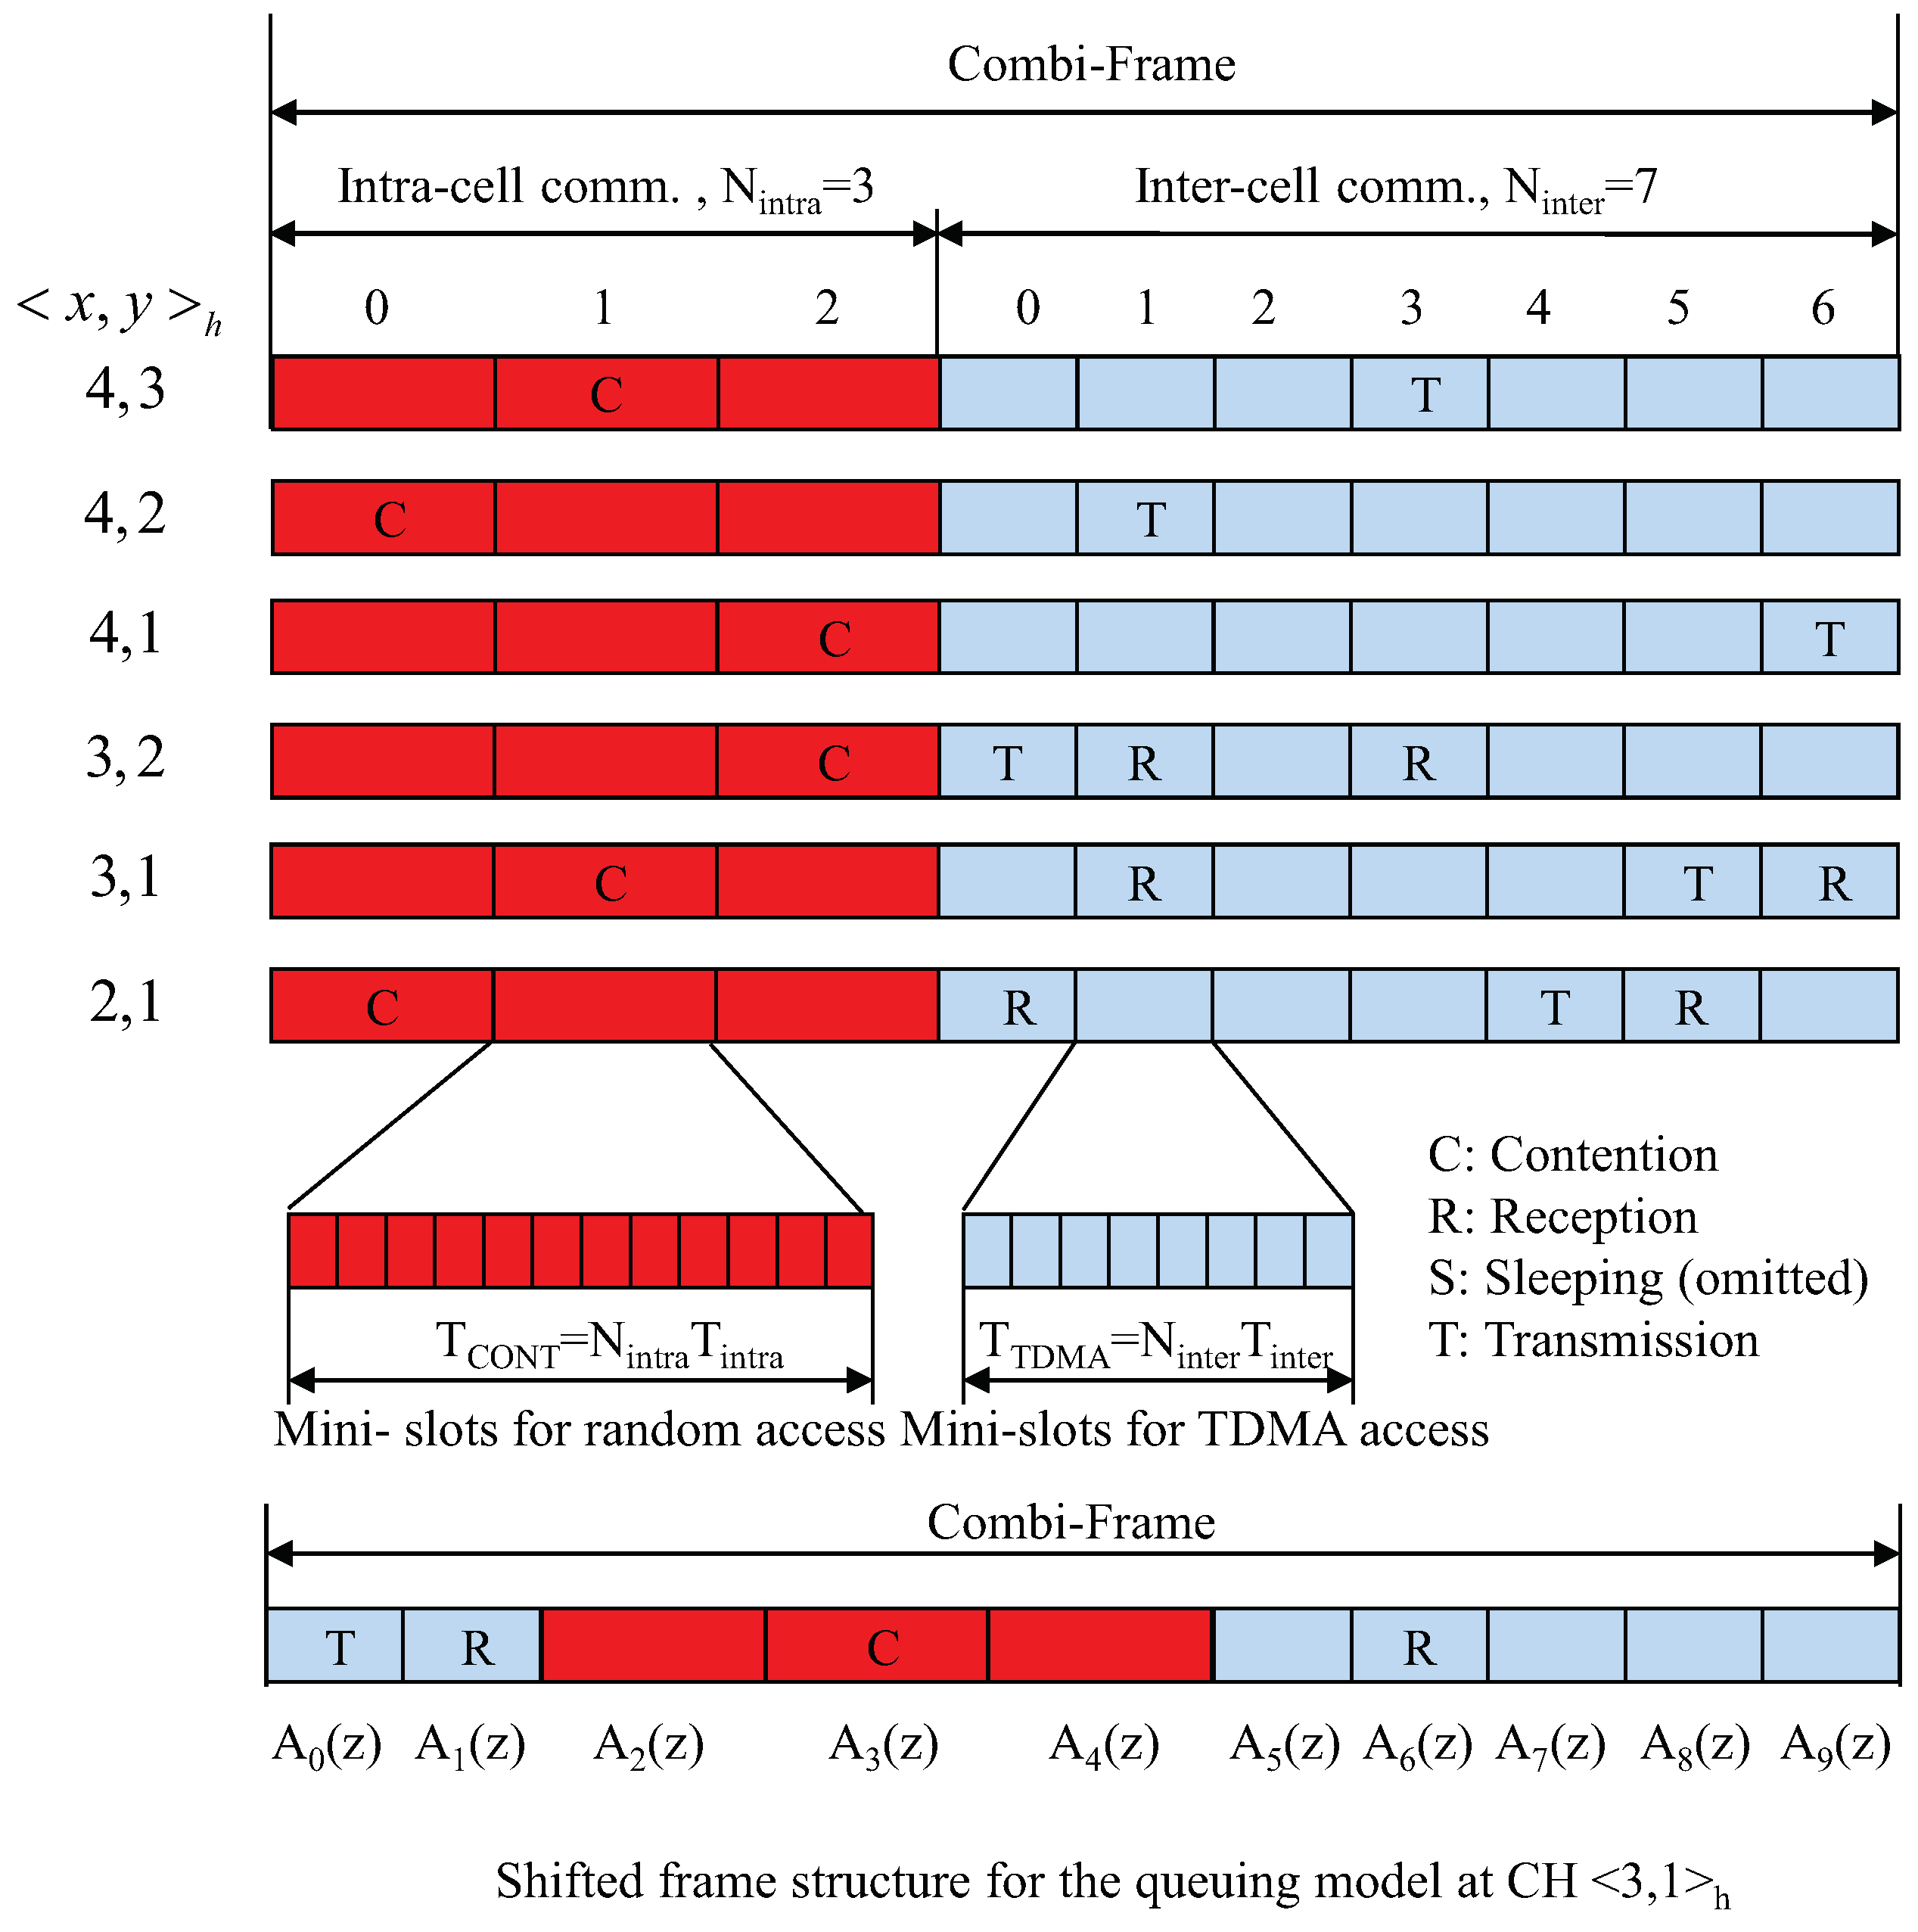
Figure 3 shows the proposed Combi-Frame. It is basically composed of the contention sub-frame, hereinafter the CONT sub-frame, and the TDMA sub-frame. We must highlight the fact that each cluster uses exactly one contention slot per CONT sub-frame for intra-cluster communication and one TDMA slot per TDMA sub-frame for inter-cluster communication. While the first communication is between the sensors and its CH, the latter refers to the communication between CHs. Then, by choosing the two pairs ( i x , j x ) ( x = I n t r a , I n t e r ) , we can select cluster sizes N x and consequently the length of the Combi-Frame. This allows us to balance the trade-off between interference and network throughput. For example, a high N i n t r a increases the geographical distance between CHs that use the same transmission slot, which implies a longer CONT sub-frame, and consequently longer delay. The same argument applies for N i n t e r .
The duration of one contention slots is equal to T I n t r a and the duration of one TDMA slot is equal to T I n t e r . Additionally, each contention slot and TDMA slot is divided, respectively into N m s C and N m s T mini-slots. Therefore, the duration of the Combi-Frame is,
T C F = T C O N T + T T D M A = = N I n t r a · T I n t r a + N I n t e r · T I n t e r = N I n t r a ( N m s C · T m s C ) + N I n t e r ( N m s T · T m s T ) = N m s C F · T m s .
In Equation (1) the duration of both sub-frames are identified as, T C O N T = N i n t r a · T I n t r a and T T D M A = N i n t e r · T I n t e r respectively. Also, T I n t r a = N m s C · T m s C , T I n t e r = N m s T · T m s T and N m s C F = N I n t r a · N m s C + N I n t e r · N m s T . The last equality in (1) comes with the assumption that T m s = T m s C = T m s T , to be used in the rest of the paper unless otherwise stated.
The value of T I n t r a depends of the RAP that is implemented. Adopting the FSA protocol to our scenario, the length of the FSA frame is equal to one slot, i.e., to N m s C mini-slot. On the other hand, in general, the assumption of low traffic is not valid for inter-cluster communication, in particular for CHs quite close to the sink. Hence, the remainder of the Combi-Frame comprises a TDMA sub-frame, used by the CHs to forward traffic to the sink. We specify that each CH gets exactly one transmission slot, therefore N m s T mini-slots per TDMA sub-frame, hence N m s T is the maximum number of data packet per TDMA sub-frame that a CH can transmit.

4.2. Slot Assignment for Intra-Cell and Inter-Cell Communications

Perfect synchronization between all nodes of the WSN is assumed, although we discuss this assumption in Section 4.5. It means that each CH and its members are aware which sub-frame, CONT or TDMA, is really in progress. We identify the first (second) case as mode CONT (mode TDMA ). Furthermore, all nodes must been able to identify the time slot that is currently running for contention -when a CH member is transmitting to its CH-, reception, sleeping or transmission, respectively denoted as mode C , and modes R , S and T . For example, all nodes must be in mode R during synchronization phase to receive external synchronization signals, not shown in Figure 3.
Based on its cell coordinates x , y * = h , p and the cluster size N z ( z = I n t r a , I n t e r ), each node is able to unambiguously derive the time slot T ( x h , y h ) it may use in the mode CONT or in the mode TDMA , see Table 3. It is worth mentioning that for a given value pair x , y * several solutions can be envisaged. For example, for the pair x , y h = 2 , 1 h , in addition to the expression [ 2 x h + 1 y h ] mod 7 shown in the table, we can also use [ 5 x h + 3 y h ] mod 7 , one assignment that turns out to be a rotation of the previous one. Then, during the TDMA sub-frame, all nodes are in mode TDMA and for a given time slot all CHs will be in one of the three modes, R , S or T while all non-head nodes switch to mode S . In mode T , a CH located at ring r p can transmit data packets to some other neighbor CHs located in the inner ring r p - 1 while in mode R , the same CH can receive data packets from some other neighbor CHs located in the outer ring r p + 1 (this is part of the routing algorithm that is described in the next section). In addition, vice versa, in the TDMA sub-frame, a CH cannot receive packets from other nodes while it is in mode T neither transmit packets to other nodes while it is in mode R . See Figure 4 the details of which are explained later.
During the CONT sub-frame, all nodes are in mode CONT . When a cluster receives the assignment of one time slot, all nodes except the CH will be in mode T if they have sensed data to deliver or in mode S otherwise, while the CH will be in mode R to receive data from its CH members. CH members will send sensed information to its own CH according to the implemented RAP, FSA in our case. During the other time slots of the CONT sub-frame, all nodes of that cluster, including the CH, will remain in mode S . As for CH, when we consider the mode R in the CONT sub-frame, i.e., receiving information from the members of its group, we will use the mode notation instead; just to avoid possible confusion with the mode R in the TDMA sub-frame. In addition, we mention that any sensor could collect data from its own sensor panel at any time, regardless of which sub-frame is actually in progress and regardless of the mode, C , R , S or T functioning.

4.3. The Communication Range

The communication range required for both type of communication will dependent of the number of rings, r max , that conforms the WSN. For a large value of r max , the WSN shape looks like a hexagon, see Figure 1, with an area equal to 3 3 R H E X 2 / 2 . If R W S N is the radius of the circle with equal area to the hexagon, we have 3 3 / 4 R H E X = ( 2 π ) 1 / 2 R W S N . In our topology, the number of CH including the sink is given by N c ( r max ) = 1 + 3 · r max ( r max + 1 ) . Then, the area of a given cluster, a small hexagon, is A c ( r max ) = π R W S N 2 / N c ( r max ) , all with the same size. Approximating the coverage area of a cluster by a circle, its radio R c ( r max ) is given by the equation π R c 2 ( r max ) = A c ( r max ) , so R c ( r max ) = R W S N / N c ( r max ) . Hence, for intra-cluster communication, R C = R c ( r max ) is the minimum communication range. For inter-cluster communication, assuming that the CHs are located in the center of the hexagon, the distance between two closest CHs is given by 3 R h ( r max ) where R h ( r max ) = K R W S N / N c ( r max ) is the radius of a small hexagon (a cluster) and K = 2 π / 3 3 / 2 1 . 0996 . Then, for inter-cluster communication, R T = 3 R h ( r max ) is the minimum communication range required. These parameters are used in Section 8.

4.4. Inter-Cell Routing and Load Balancing

Here we adopt the inter-cell routing protocol between CHs presented in [24]. CHs at ring r p deliver the information to the nearest CH(s) at ring r p - 1 . More specifically, a CH located on one of the axes A 0 to A 5 and ring r p transfer the information to the CH located in the same axes but at ring r p - 1 , for example 3 , 3 h 2 , 2 h , see Figure 4. In addition, non-axes CHs transfer the information to two inner-ring neighbors, for example 2 , 3 h 2 , 2 h with probability p 2 , 3 h - 2 , 2 h and 2 , 3 h 1 , 2 h with probability p 2 , 3 h - 1 , 2 h , ( p 2 , 3 h - 2 , 2 h + p 2 , 3 h - 1 , 2 h = 1 ). The routing probabilities are chosen according to the load balancing principle between CHs of the same ring. For instance, let us consider the routing probabilities from ring 3 to ring 2, where the traffic load in each CH is ρ k , with k = 3 , 2 respectively (intuitively ρ 3 < ρ 2 , this is formally discussed in Section 6). Apart from the local traffic, the exogenous load received at CH 2 , 2 h , e 2 , is equal to e 2 = p 2 , 3 h - 2 , 2 h ρ 3 + ρ 3 + p 3 , 2 h - 2 , 2 h ρ 3 = ( 2 p 2 , 3 h - 2 , 2 h + 1 ) ρ 3 ) where the last equality follows from the symmetry of the load balancing, i.e., p 2 , 3 h - 2 , 2 h = p 3 , 2 h - 2 , 2 h . In addition, the exogenous load received at CH 1 , 2 h , also e 2 , is equal to e 2 = p 1 , 3 h - 1 , 2 h ρ 3 + p 2 , 3 h - 1 , 2 h ρ 3 = 2 p 1 , 3 h - 1 , 2 h ρ 3 , since p 1 , 3 h - 1 , 2 h = p 2 , 3 h - 1 , 2 h . Then, from the above equations we identify 2 p 2 , 3 h - 2 , 2 h + 1 = 2 p 2 , 3 h - 1 , 2 h , that is, p 2 , 3 h - 1 , 2 h = 3 / 4 . Figure 4 shows the case of CHs located in the set A 1 S 1 A 2 for rings 2 r p 5 . The generalization to arbitrary rings and sectors can be found in Table II of [24].

4.5. Synchronization of the WSN

Synchronization is a basic requirement of all TDMA schemes, so it is of capital importance in our WSN. Traditional protocols such as the Network Time Protocol (NTP) are designed for wired networks but for WSN scenarios other suitable algorithm has been deployed such as, the Reference Broadcast Synchronization (RBS) algorithm [25], the Timing-sync Protocol for Sensor Networks (TPSN) [26] and the Flooding Time Synchronization Protocol (FTSP) [27]. The RBS eliminates the uncertainty of the sender by removing the sender from the critical path and at the same time the receivers exchange information to achieve the synchronization. The TPSN is appropriated to a tree network topology. Each node is assigned to a level, and only one node, the root -in our case the sink-, resides on level zero. FTSP is another protocol similar to TPSN, but offers some improvements to the disadvantages to TPSN. Specifically FTSP is suitable in tree topologies and provides multi-hop synchronization. It is a master-slave architecture in which the root node, the sink, provides the global time and all other nodes synchronize their clocks to that of the sink. [28] offers a summary where several synchronization methods for WSN are compared.
As in [10] the synchronization to account in our WSN scenario corresponds to a cluster-tree topology. This topology make time synchronization between nodes much simpler that in other topologies such as the mesh topology. Compared with most other TDMA- based multihop networks, such as in [29] the implementation of a cluster-tree topology is of much lower complexity. In this topology, the sink, which is not power constrained, can broadcast a beacon signal to all the CHs at the begin of each Combi-Frame and, in a second step, each CH can send a beacon signal each time a CONT sub-frame starts. Technologies such as IEEE 802.15.4 offers the beacons signals for synchronization. This mode of operation is similar to that used in cellular systems.
As a point of reference for our discussion, we refresh some aspects of the timing advance (TA) and the master-slave synchronization scheme implemented in the GSM-(900, 1800, 1900) system [30]. In GSM, a TDMA hierarchy (frame, multiframe, superframe and hiperframe) with 8 time-slots per frame is built. A total of 148 bits—a normal burst—plus the equivalent to 8.25 bits as guard period (GP) (including overheads, mainly GP and synchronization sequence), fill the time-slot of 120 / 208 0 . 5769 ms , which means a total bit rate of 270.833 kbps. over a carrier of 200 KHz bandwidth. Also, taking into account the maximum radio of a GSM cell, 37.8 Km, the propagation delay from the base station (BS) to the edge of the cell becomes 37 . 8 × 10 3 / 3 × 10 8 = 126 μ s which means 34.125 bits “in the air” or “on the fly”, i.e., the 21.84% of the time slot duration. This is why time advance (TA) is considered in GSM and in cellular system in general. The TA values adopted in GSM are in the range [ 0 , 63 ], with each step representing an advance of one bit period, 3692 μ s, equivalent to the distance of, approximately 1180 m. For synchronization purposes, a multiframe is composed by 51 frames ( F R ), i.e., 408 time slots with a total duration of 51 × 8 × 15 / 26 = 235.3846 ms. approximately. We focus on the combination IV, a down-link signaling scheme which usually is mapped into time slot 0 ( T S = 0 ) of a specific carrier [31]. Then, in ( T S , F R ) = ( 0 , 0 ) the BS (in our case it would be the sink) transmit the frequency correction burst ( F B ), used for frequency synchronization of the mobiles (CHs and sensors in our case). In the same time slot of the next frame, ( T S , F R ) = ( 0 , 1 ) , the BS transmit the synchronization burst ( S B ) used for time synchronization of the mobiles (CHs and sensors in our case). For tracking purposes, both, the F B and the S B are repeated regularly 5 times per each multiframe, in particular in T S = 0 and frames ( F B , S B ) = ( 0 , 1 ) ; ( F B , S B ) = ( 10 , 11 ) ; ( F B , S B ) = ( 20 , 21 ) ; ( F B , S B ) = ( 30 , 31 ) and ( F B , S B ) = ( 40 , 41 ) . It means that on average, the F B and the S B are transmitted once each 47.0769 ms approximately. The repetition of F B and S B are also named frequency correction channel (FCCH) and synchronization channel (SCH), respectively.
Some similar figures can be found in WSN that operate in the 868–868.8 MHz (EU), the 902–928 MHz (USA, Canada, etc.) or 2.4 GHz Industrial Scientific and Medical (ISM) bands. They are built upon IEEE 802.15.4 protocol using 5 MHz channels and able to transmit up to 250 Kbps (due to protocol overload, the net bit rate is reduced by half, approximately). In fact, the PHY/MAC layer determines the frame size, for instance in the referred IEEE 802.15.4 standard says the frame size is 127 bytes, so we can assume data packets of size around 1000 bits, including overheads (preamble, identifiers, CRC, etc.). Then, the transmission time of a WSN data packet turns to be equal to 1000 bits/( 250 × 10 3 bits/s)= 4 ms, i.e., 4 μ s per bit. In addition, for coverage areas of our WSN with radio less than 600 m, the propagation delay from the sink to the edge of the WSN is around 600 / 3 × 10 8 = 2 μ s which means half a bit “in the air”, a very significant difference compared with the 34.125 bits in GSM. So we surmise that, in our WSN scenario, a TA algorithm is not of imperative necessity and can be avoided by using guard periods as suggested in [12]. On the other hand, we need to take into account the quality of the clocks. For example, as is reported in [32], according to the data sheet of a typical crystal-quartz oscillator commonly used in sensor networks, the frequency of a clock varies up to 40 ppm, which means clocks of different nodes can loose as much as 40 μ s in a second (or 0.16 μ s per data packet or data slot, i.e., 1/25 part of a bit). Then, some guard bands can be inserted into the time slot structure to cover practical aspects of synchronization errors. At first glance, in a parallel way to the GSM time-slot structure, if a GP of 8.25 bits is added to the 148 real bits of the normal burst i.e., 5.55%, keeping the same proportion to our WSN we could have a GP of 53 bits added to the 947 real bits, in total the 1000 bits that fill our data slot of 4 ms.
Regarding the frequency synchronization and the time synchronization both can be periodically updated, for instance at the beginning of each Combi-Frame, see Figure 3, i.e., one F B W S N at the beginning of the CONT sub-frame and one S B W S N at the beginning of the TDMA sub-frame. The repetition rate of both burst will depend on the final length of the Combi-Frame. We recall that the F B W S N is the beacon signaling used to synchronize receiver radio to the carrier frequency and the S B W S N for time synchronization, including some WSN parameters such as the Combi-Frame numbering.

5. The Intra-Cluster Communication

5.1. Traffic Model

For each non CHs (mote or sensor) we assume a Poisson process with rate λ . Then, the probability p a c t that a sensor becomes active during one mini slot of duration T m s = T m s C = T m s T is given by,
p a c t = 1 - e - λ T m s
Please note that Equation (2) is the probability that at least one data packet is generated during a Combi-Frame. Following [8] we assume that each sensor is equipped with a unit-size buffer. Then, taking into account the structure of the Combi-Frame, the traffic model is a Bernoulli process and following the FSA protocol, each sensor can successfully transmit to its CH no more than one data packet by Combi-Frame.

5.2. The Contention Process

For the contention process in the CONT sub-frame, many random access protocols can be considered [2]. For our study, we borrow the proposal presented in [33] where the FSA is adopted. Here we have derived the corresponding output of the contention process at each CH. Let M c ( r max ) = M s / N c ( r max ) , in short M c , be the number of sensors in a given cluster. Then, we have identified a Markov chain where the observation points are located at the beginning of a slot, see Table 4, third column. Let us assume that at the beginning of a given Combi-Frame, we have i data packets ready for transmission, that is, i sensors each one with one data packet. Then, with probability r each packet will choose the actual Combi-Frame to try the access and with probability 1 - r the packet will defer the access to the next Combi-Frame. This permission probability could be estimated by means of some centralized control and broadcast by the CH to all terminals in the cluster. Then, the probability that j data packets ( 0 j i M c ) get permission to access is given by a binomial distribution, B ( i , j , r ) . Then, each of the j terminals with positive permission probability will choose one of the V = N m s C mini-slots with probability 1 / V .
Let S ( j , k , V ) denote the probability that k among j data packets get a successful access, 0 k j M c and k min ( j , V ) . S ( j , k , V ) can easily be obtained in a recursive way, see reference [34]. Combining both actions in a single expression we have,
D k i ( r , V ) = j = k i B ( i , j , r ) S ( j , k , V ) .
In Equation (3) D k i ( r , V ) is the probability to have k successful transmissions from a total of i data packets ready to transmit at the beginning of a given Combi-Frame. Using the short notations, B j i ( r ) = B ( i , j , r ) , S k j ( V ) = S ( j , k , V ) we write equation Equation (3) in matrix notation,
D ( M c , r , V ) = B ( M c , r ) S ( M c , V ) D 0 0 ( r , V ) 0 0 D 0 1 ( r , V ) D 1 1 ( r , V ) 0 D 0 M c ( r , V ) D 1 M c ( r , V ) D M c M c ( r , V )
with B ( M c , r ) ,
B ( M c , r ) = B 0 0 ( r ) 0 0 0 B 0 1 ( r ) B 1 1 ( r ) 0 0 B 0 2 ( r ) B 1 2 ( r ) B 2 2 ( r ) 0 B 0 M c ( r ) B 1 M c ( r ) B 2 M c ( r ) B M c M c ( r )
and S ( M c , V ) ,
S ( M c , V ) = S 0 0 ( V ) 0 0 0 S 0 1 ( V ) S 1 1 ( V ) 0 0 S 0 2 ( V ) S 1 2 ( V ) S 2 2 ( V ) 0 S 0 M c ( V ) S 1 M c ( V ) S 2 M c ( V ) S M c M c ( V )
Next we need to take into account the arrival process during a Combi-Frame. We recall that for a given sensor, the probability to generate at least one data packet per Combi-Frame is given by, from Equation (2), a = 1 - ( 1 - p a c t ) N m s C F . Notice that for a fixed Poisson rate λ , a increases with N m s C F . Also, we remember that if a given sensor senses more than one data packet per Combi-Frame, only one of them is considered as candidate to be transmitted; the other packets are lost since each sensor is equipped with a unit size buffer.
Using matrix notation for the arrival process, with A j i ( a ) = B ( i , j , a ) (binomial distribution), we have,
A ( M c , a ) = A 0 M c ( a ) A 1 M c ( a ) A 2 M c ( a ) A 3 M c ( a ) A M c M c ( a ) 0 A 0 M c - 1 ( a ) A 1 M c - 1 ( a ) A 2 M c - 1 ( a ) A M c - 1 M c - 1 ( a ) 0 0 A 0 M c - 2 ( a ) A 1 M c - 2 ( a ) A M c - 2 M c - 2 ( a ) 0 0 0 A 0 M c - 3 ( a ) A M c - 3 M c - 3 ( a ) 0 0 0 0 A 0 0 ( a )
Combining the departure and the arrival processes, respectively Equations (4) and (7) we get,
P C = D m ( M c , r , V ) · A ( M c , a ) = = D 0 0 ( r , V ) 0 0 0 D 1 1 ( r , V ) D 0 1 ( r , V ) 0 0 D 2 2 ( r , V ) D 1 2 ( r , V ) D 0 2 ( r , V ) 0 D M c M c ( r , V ) D M c - 1 M c ( r , V ) D M c - 2 M c ( r , V ) D 0 M c ( r , V ) · A ( M c , a )
Observe that, in Equation (8), the elements of matrix D m ( M c , r , V ) are the elements of the matrix D ( M c , r , V ) defined in Equation (4) but are sorted in a different way. Let P C ; i , j denote the general term of P C ; it is given by P C ; i , j = k = max ( 0 , i - j ) i D k i ( r , V ) A j - i + k M c - i + k ( a ) , and it is explained as follows. At the beginning a Combi-Frame we have M c - i inactive terminals and i terminals with a data packet in its unit size buffer ready to compete for access. Let us assume that k out of i terminals gain access, this will happen with probability D k i ( r , V ) , so M c - ( i - k ) terminals becomes idle and i - k remains active. Let us assume that j - ( i - k ) out of M c - ( i - k ) terminals generate one data packet during the present Combi-Frame, this will happen with probability A j - i + k M c - i + k ( a ) . Given the independence of the departure and arrival processes P C ; i , j follows.
Clearly, the steady state probabilities π C = [ π C , 0 , π C , 1 , , π C , M c ] are obtained by solving the system π C = π C P C with the normalization condition of π C e = 1 , where e is a column vector with all its elements equal to 1. The subscript C in the probability denotes the contention process. Then, for our Combi-Frame scenario, the output of the contention process, expressed in terms of its probability generating function (PGF) is,
L ( z ) = k = 0 V = N m s C π C , k z k
In Equation (9) L ( z ) denotes the local traffic in each cluster. Obviously the following condition L ( z = 1 ) = L ( 1 ) N m s C is satisfied. Some additional details can be found in [33].

6. The Inter-Cluster Communication

6.1. The Traffic Load and the Stability Conditions

Here we assume that buffer capacity or queue size in each CH is infinite. As has been pointed out in a previous section, data packets will flow downstream from external rings towards to the sink. Let us consider a total number of r m a x rings. For any given CH located at ring k and based on the principle of load balancing pointed out in the previous section, the normalized average number of data packets transmitted per TDMA slot in the TDMA sub-frame, ρ k , is,
ρ k = c k L ( 1 ) N m s T , for 1 k r m a x .
with
c r m a x = 1 ; c k = 1 + # CH k + 1 # CH k c k + 1 , for k < r m a x .
being # CH k the number of CHs at ring k. Table 5 shows the values of c k for several sizes of the WSN ( r m a x = 0 , 1 , 2 , , 7 . and # CH k = 1 , 6 , 12 , , 42 ). Clearly we must have 1 > ρ 1 > ρ 2 > > ρ r m a x = L ( 1 ) / N m s T where the first inequality gives the stability condition of the WSN. Please note that the sink also acts as a CH; although we do not pay attention to the traffic load supported by the sink, ρ 0 , since we assume that it is connected to the data center through a high bandwidth link and with no power limitation. Also, observe that the term “1” in c k , Equation (11), reflects the local traffic while the other term takes into account the exogenous traffic offered to a CH from external rings.

6.2. The Embedded Markov Chain

Let F ( z ) = i = 0 f i z i be the PGF of the number of packets that arrive to a tagged CH during a Combi-Frame. F ( z ) is composed of two factors; the local traffic, L ( z ) = k = 0 V π C , k z k , see Equation (9), and the exogenous traffic that comes from some CHs located in the neighboring outer ring. We observe the Combi-Frame of our tagged CH at the beginning of a T -slot, see Table 6, the right column. The instants at which the T -slots begins define an embedded Markov chain where the steady state probabilities π T = [ π T , 0 , π T , 1 , ] are given by the following PGF,
π T ( z ) = k = 0 π T , k z k = i = 0 N m s T - 1 ( z N m s T - z i ) π T , i z N m s T - F ( z ) F ( z ) ,
Due to the lack of space, we omit the derivation of Equation (12), which can be found in [24]. Here we just mention a few details. First, we remark that π T , k is the probability, in steady-state, that at the beginning of a T slot, our tagged CH has k data packets in its queue. Second, although the dimension of π T is infinity (compare with π C ) π T ( z ) is determined with a finite number of values, that is, π T , 0 , π T , 1 , π T , 2 , . . . π T , N m s T - 1 . Third, from Rouché’s theorem (see [35]) the denominator of Equation (12), z N m s T - F ( z ) , has exactly N m s T zeros in | z | 1 . Since π T ( z ) must be analytical in | z | 1 , the zeros in the denominator must also be zeros in the numerator. Let us denote by r ^ 0 = 1 , r ^ 1 , r ^ 2 , . . . r ^ N m s T - 1 the set of N m s T roots of z N m s T - F ( z ) in | z | 1 , e.g. r ^ i N m s T - F ( r ^ i ) = 0 , for i = 0 , 1 , 2 , , N m s T - 1 . Then, the set of probabilities π T , 0 , π T , 1 , π T , 2 , . . . π T , N m s T - 1 can be obtained by solving the following system of N m s T linear equations,
i = 0 N m s T - 1 ( N m s T - i ) π T , i = N m s T - F ( 1 ) > 0 i = 0 N m s T - 1 ( r ^ k N m s T - r ^ k i ) π T , i = 0 ; k = 1 , 2 , 3 , N m s T - 1
Observe that the first equation in Equation (13) comes from the fact that lim z 1 π T ( z ) = 1 (l’Hopital rule) and the inequality is mandatory due to ergodicity conditions.

6.3. On the Input Process in the Inter-Cluster Communication

In order to quantify F ( z ) , first, notice that CONT slots and the TDMA slots in a Combi-Frame are sorted differently, depending of the CH under study. For r m a x = 4 , N I n t r a = 3 and N I n t e r = 7 , column - CONT - TDMA - in Table 6 shows the frame structure of each CH located in the 60 degree area A 0 S 0 A 1 . However, as has been said in previous sub-section, for analysis purposes, we assume that all frames start with a transmission slot T ; see the right column of Table 6. The corresponding shift in time between frames is taken into account later on, when considering the transfer delay from the original CH until the sink. Then, assuming independence of the arrival process between disjoint time slots, and denoting by A i ( z ) as the PGF of the number of arrivals during the time slot i, i = 0 , 1 , , N s C F - 1 ; ( N s C F = N I n t e r + N I n t r a ) we can write:
F ( z ) = i = 0 N s C F - 1 A i ( z ) , with A i ( z ) = L ( z ) if   i ( Contention ) R x , y ( z ) if   i R s l o t 1 otherwise
From Equation (14) time slot 0 is only for transmission, mode T , so A 0 ( z ) = 1 . While the CH is in mode S no transmission neither reception happen. During the mode T data packets are served into consecutive mini-slots of a TDMA slot and are delivered to one or two CHs inner-ring neighbor. The reception of data packets occurs in two ways. The first one, represented by L ( z ) , refers to the local traffic (mode C ). The second way is labeled as R x , y (mode R ), deals with traffic coming from a CH x , y located in the neighboring outer ring.
According to the routing scheme between CHs, the PGFs of the arrival processes F ( z ) at any CH located at ring r p , is related to the local traffic and to the output processes of the neighboring CHs located in ring r p + 1 . We denote by D x , y ( z ) (departure) the PDF of the output process at CH x , y . In the next lines we derive the analytical expression of that process and provide the relationship between A i ( z ) , D x , y ( z ) and the local traffic L ( z ) .

6.4. On the Output Process in the Inter-Cluster Communication

It is straightforward to see that, from Equation (12), the departure process in a given CH, in short D ( z ) , i.e., the number of customers served during one transmission slot (TDMA sub-frame), can be expressed as, in terms of its PDF,
D ( z ) = i = 0 N m s T d i z i = z N m s T - i = 0 N m s T - 1 π T , i z N m s T - z i
Clearly,
D ( 1 ) = N m s T - i = 0 N m s T - 1 π T , i N m s T - i = F ( 1 )
The last equality in Equation (16) comes from the fact that under the stead-state condition, the service rate and the arrival rate per Combi-Frame are coincident.
Then, back to Equation (14) and to Table 6 we have, for instance, CH 3 , 1 h with pattern T R - SC S - S R S S S - receives information from CH 4 , 1 h at time slot 1 and from CH 4 , 2 h at time slot 6; the local information (mode C ) is captured at time-slot 3, see also the bottom of Figure 5. That is, in hexagonal coordinates, the A i ( z ) associated with CH 3 , 1 h are,
A 1 ( z ) = R 4 , 1 h ( z ) = p 4 , 1 h - 3 , 1 h D 4 , 1 h ( z ) + p ¯ 4 , 1 h - 3 , 1 h A 3 ( z ) = L ( z ) , local traffic . A 6 ( z ) = R 4 , 2 h ( z ) = p 4 , 2 h - 3 , 1 h D 4 , 2 h ( z ) + p ¯ 4 , 2 h - 3 , 1 h A i ( z ) = 1 , elsewhere .
with p ¯ x , y h - u , v h = 1 - p x , y h - u , v h .
The previous expressions imply that the routing decision is taken slot by slot. Alternatively, we could decide packet by packet, which means that, in A 1 ( z ) and A 6 ( z ) , p D x , y ( z ) + p ¯ must be replaced by D x , y ( p z + p ¯ ) . The first option seems more appropriated from the point of view of energy efficiency, since after detecting an empty mini-slot the CH can enter into the mode S , remaining in this state at least until the end of the current time slot.

7. End-To-End Delay Analysis

Using the previous queue model, in the following lines we derive the end-to-end (E2E) delay of an arbitrary data packet, from the instant it is sensed by a sensor until the pack reaches the sink. Previously we formulate the sojourn time of that data packet in a given CH. For that purpose, we realize that the average number of packets found at the beginning of a transmission slot T can be derived from Equation (12). After some simple algebra we can write,
π T ( 1 ) = F ( 1 ) + F ( 1 ) - D ( 1 ) 2 [ N m s T - F ( 1 ) ]

7.1. Sojourn Times in a CH

For each CH under study, let us denote by b ¯ i the mean number of data packets at the beginning of the time slot i ( i = 0 , 1 , . . . , N s C F - 1 ) of a Combi-Frame. Then, b ¯ i can be expressed as,
b ¯ i = π T ( 1 ) , for   i = 0 See Equation ( 17 ) π T ( 1 ) - D ( 1 ) , for   i = 1 b ¯ 1 + j = 1 i - 1 A j ( 1 ) , for   i = 2 , , N s C F
where the A j ( z ) are given in Equation (14). See Figure 5 where several nodes located at A 0 S 0 A 1 are involved. Now we identify Z i = N m s C , respectively Z i = N m s T , if i   i n t r a time slot, respectively i   i n t e r time slot. Obviously Z 0 = N m s T since time slot 0 is the transmission slot, mode T . In addition, we approximate the mean number of data packets in the system as,
N p ¯ = i = 0 N s C F - 1 Z i b ¯ i N m s C F
Therefore, the mean dwell time (waiting + service) of an arbitrary data packet in a given CH, expressed in Combi-Frames, can be estimated as (Little formula),
W ¯ ( s t , C F ) = N p ¯ D ( 1 ) = N p ¯ F ( 1 )
where the last equality in Equation (20) is obtained using Equation (16). Alternatively, expressing Equation (20) in mini-slots we have:
W ¯ ( st , ms ) = W ¯ ( st , CF ) N m s C F

7.2. Local and Exogenous Traffic

For each CH, the arrival local (exogenous) traffic is given by the A i ( z ) factors located at the CONT (TDMA) sub-frame. Let us denote by r L ( r E ) be the fraction of local (exogenous) traffic managed by a given CH. r L ( r E ) is given by,
r L = L ( 1 ) L ( 1 ) + i T D M A A i ( 1 ) = L ( 1 ) F ( 1 ) = 1 - r E .
Then, taking into account Equation (22), Equation (21) can be split into the following three terms,
W ¯ ( st , ms ) = r L C T + i T D M A A i ( 1 ) F ( 1 ) R i T + W ¯ r .
In Equation (23), the first terms refers to the local traffic; C T is the distance in number of mini-slots between the end of the successful slot C for our tagged data packet and the end of the first available transmission slot T of our CH in the TDMA sub-frame, see the values in the fourth column of Table 4. The second term of Equation (23) deals with the exogenous traffic; R i T is the distance in number of mini-slots between the end of the reception slot R i and the end of the transmission slot T of our CH (notice that the reception slot R i is coincident with the transmission slot T i of some CH in the neighboring outer ring), see Table 4 and Table 6. Finally W ¯ r is the residual mean sojourn time in a given CH which is common to the local and to the exogenous traffic streams (we have not taken into account the option of priorities).
Therefore, to evaluate each term in Equation (23) we proceed as follows. First, following the model in Section 7.1 we obtain W ¯ ( st , ms ) , Equation (21); second we follow the analysis of Section 7.2 and we get the fractions r L and r E , Equation (22), i.e., the first two terms in Equation (23), and third, we derive W ¯ r by subtracting the aforementioned two first terms from the total, W ¯ ( st , ms ) . Observe that for a very low traffic load, only the first two terms of Equation (23) will contribute to W ¯ ( st , ms ) since W ¯ r will be practically null. This fact has been validated through the use of a parallel queue model outlined in Section 7.5.

7.3. Delay of a Tagged Data Packet

We defined the mean sojourn time of a given tagged data packet as the time interval elapsed from the instant it is generated until it is delivered to the sink. For example, let W ¯ 3 , 5 p L denote the sojourn time of a data packet from the moment it is generated by a mote in cluster 3 , 5 p until it reaches the sink (L stand from local). For example, let us consider the CHs that belong to the set R 3 ( A 1 S 1 A 2 ) (here ring 3 = R 3 , axes 1, 2 and sector 1), i.e., 3 , 3 p , 3 , 4 p , 3 , 5 p , 3 , 6 p , see Figure 4. In vector—matrix notation, we have,
W ¯ 3 , 6 L W ¯ 3 , 5 L W ¯ 3 , 4 L W ¯ 3 , 3 L p = A C ¯ 3 , 6 A C ¯ 3 , 5 A C ¯ 3 , 4 A C ¯ 3 , 3 p + C T 3 , 6 C T 3 , 5 C T 3 , 4 C T 3 , 3 p + R W ¯ 3 , 6 R W ¯ 3 , 5 R W ¯ 3 , 4 R W ¯ 3 , 3 p
In a compact way we write previous equation as,
W 1 , 1 , 2 L ( 3 ) = AC 1 , 1 , 2 ( 3 ) + CT 1 , 1 , 2 ( 3 ) + RW 1 , 1 , 2 ( 3 )
with the short notation, A 1 , S 1 , A 2 = 1 , 1 , 2 , and R 3 = 3 . In Equation (24), A C ¯ i , j p , refers to the delay of our packet in the contention process at CH i , j p . C T i , j p , accounts for the number of mini-slots between the end of the successful slot (mode ) and the end of the first available slot T (mode T ) in the TDMA sub-frame; see Table 4, fourth column where C T i , j p is expressed in number of slots. In addition, R W ¯ i , j p is the remaining sojourn time to reaches the sink; in other words, R W ¯ i , j p is the elapsed time between the end of the first available transmission slot T in CH i , j p until our packet reaches the sink. In vector-matrix notation, R W ¯ i , j p is expressed as,
R W ¯ 3 , 6 R W ¯ 3 , 5 R W ¯ 3 , 4 R W ¯ 3 , 3 p = W ¯ 3 , 6 r W ¯ 3 , 5 r W ¯ 3 , 4 r W ¯ 3 , 3 r p + PE 1 , 1 , 2 ( 3 ) T T 3 , 6 , 2 , 4 T T 3 , 5 , 2 , 4 T T 3 , 5 , 2 , 3 T T 3 , 4 , 2 , 3 T T 3 , 4 , 2 , 2 T T 3 , 3 , 2 , 2 p + P 1 , 1 , 2 ( 3 ) R W ¯ 2 , 4 R W ¯ 2 , 3 R W ¯ 2 , 2 p
and writing previous expression in a compact way,
RW 1 , 1 , 2 ( 3 ) = W 1 , 1 , 2 r ( 3 ) + PE 1 , 1 , 2 ( 3 ) TT 1 , 1 , 2 ( 3 ) + P 1 , 1 , 2 ( 3 ) RW 1 , 1 , 2 ( 2 )
In Equation (27), PE 1 , 1 , 2 ( 3 ) (stands from matrix P Extended) takes into account the routing probabilities between two neighboring sets of CH, in our example R 3 ( A 1 S 1 A 2 ) R 2 ( A 1 S 1 A 2 ) . From the principle of load balancing, see Figure 4, we get,
PE A 1 , S 1 , A 2 ( R 3 ) = PE 1 , 1 , 2 ( 3 ) = 1 0 0 0 0 0 0 p 3 , 5 , 2 , 4 p 3 , 5 , 2 , 3 0 0 0 0 0 0 p 3 , 4 , 2 , 3 p 3 , 4 , 2 , 2 0 0 0 0 0 0 1 p
T T i , j p , k , l p is the number of mini-slots between the transmission slot T of CH i , j p and the transmission slot T of CH k , l p . Finally,
P 1 , 1 , 2 ( 3 ) = PE 1 , 1 , 2 ( 3 ) 1 0 0 1 0 0 0 1 0 0 1 0 0 0 1 0 0 1
Then, the E2E transfer delay for each data packet generated at R k ( A 1 S 1 A 2 ) with k = 1 , 2 , , r m a x , W 1 , 1 , 2 L ( k ) , can be evaluate as,
W 1 , 1 , 2 L ( k ) = AC 1 , 1 , 2 ( k ) + CT 1 , 1 , 2 ( k ) + RW 1 , 1 , 2 ( k )
with,
RW 1 , 1 , 2 ( k ) = W 1 , 1 , 2 r ( k ) + PE 1 , 1 , 2 ( k ) TT 1 , 1 , 2 ( k ) + P 1 , 1 , 2 ( k ) RW 1 , 1 , 2 ( k - 1 ) ; 1 < k r m a x
and bounding value,
RW 1 , 1 , 2 ( 1 ) = W 1 , 1 , 2 r ( 1 ) + PE 1 , 1 , 2 ( 1 ) TT 1 , 1 , 2 ( 1 )

7.4. Algorithmic Procedure

Here we summarize the procedure. First, we obtain the output and the delay of the contention process, L ( z ) and as A C ( z ), with mean values L ( 1 ) = L ¯ and A C ( 1 ) = A C ¯ , respectively. Observe that this is executed for each CH. Second, the ergodicity conditions ρ 1 < 1 must be satisfied at all CHs located at ring 1. Otherwise, the offered traffic at local level must be reduced until the ergodicity condition is met. Third, for each CH of every ring we obtain the sojourn time, Equations (20) and (21); first for all CHs located in the outermost ring, second for all CHs located in the inner ring next to the previous one, and so on, until reaching the first neighbor ring of the sink. Fourth, from Equation (23) we obtain W ¯ x , y r for all CHs of every ring. Finally we evaluate the end-to-end delay using Equations (30) and (31).

7.5. Model Validation

Some aspects of the Markovian model have been validated in previous work. In particular, in [36] the FSA as RAP was validated for a wide range of traffic load by extensive computer simulations, showing excellent accuracy. With regard to the TDMA model, the validation has been conducted to the particular case of very low data traffic. For that purpose we have derived a parallel model, rather simpler than the previous one, that allows the calculation of the E2E delay of an isolated data packet generated at an arbitrary sensor located at a given CH. Then, the result has been compared with the previous general model with very low traffic load. The results of this verification procedure offer a perfect fit. Due to the lack of space, we have omitted the details of that particular queuing model. Here we only outline the main aspects in the following way.
Let us consider a data packet generated at a sensor in the coverage area of CH 4 , 3 h , see Figure 5. Then, since our tagged data packet is alone, it will gain the access with no collisions. Then, A C ¯ 4 , 3 h = N m s C mini-slots (the first term of Equation (24)) since our tagged packet is transferred to its CH at time slot C # = 1 of the CONT sub-frame. Next we account for the C T 4 , 3 h term (the second term of Equation (24)) and it is given by C T 4 , 3 h = ( N i n t r a - C # ) · N m n C + ( T # + 1 ) · N m n T = ( 3 - 1 ) × N m n C + ( 3 + 1 ) · N m n T minislots. Next we take into account the third term of Equation (24), R W ¯ 4 , 3 h , whose expression is given in Equation (26). Since our tagged data packet travels alone the WSN, according to Equation (22) and to Equation (23), r E 4 , 3 p = W ¯ 4 , 3 h r = 0 . Finally, with regard to the term T T 4 , 3 h , 3 , 2 h in Equation (26) we have to account for the TDMA subframe of CH 4 , 3 h as ( N i n t e r - T # - 1 ) · N m n T = 3 · N m n T minislots, next for the whole duration of a CONT sub-frame N i n t r a · N m n C = 3 · N m n C = minislots and for the TDMA sub-frame of CH 3 , 2 h as ( T # + 1 ) · N m n T = 1 · N m n T minislots; in total T T 4 , 3 h , 3 , 2 h = 3 · N m n T + 3 · N m n C + N m n T minislots. As another illustrative example, it is quite straightforward to see that T T 4 , 2 h , 3 , 1 h = 4 · N m n T .

8. The Energy Consumption Model

In this section we provide a model to evaluate the energy consumption of the nodes of the WSN. Quite often the following energy model has been adopted in the literature The amount of energy expended to transmit, or receive, a message of unit length at a distance d between sender and receiver, is proportional to, respectively,
E t ( d ) = α 11 + α 2 d η ; E r ( d ) = α 12 ;
We could also consider the energy of sensing a message, E s = α 3 , but typically it is much smaller compared to E t and E r , so we ignore E s in this paper. Following [37], typical values are α 1 = α 11 + α 12 = 180 nJ/bit and α 2 = 10 pJ / bit / m 2 (if η = 2 ) or α 2 = 0 . 001 pJ / bit / m 4 (if η = 4 ).
The energy model is applied to the CONT sub-frame and to the TDMA sub-frame. In the CONT sub-frame the energy consumption is due to the sensors when transmitting a sensed message to its CH and to this CH when receiving this message. Since all sensors within the CH area are uniformly distributed, for simplicity, the distance d in Equation (33) is assumed equal to the distance average value between sensors and their CH, that is, d C O N T ( r max ) = ( 2 / 3 ) R c ( r max ) , see Section 4.3. Observe that when N c = 1 the sink is the only CHs in the WSN, and only the CONT sub-frame without spatial reuse is implemented. Due to the randomness of the protocol in the CONT sub-frame, the number of attempts to successfully transmit a sensed message is a random variable. We define a contention factor, c f ( N c ( r max ) ) as the mean number of attempts to transmit a message. c f ( N c ( r max ) ) will be greater than one and depend basically on the type of RAP implemented, in our case FSA, and the number of sensors, N c ( r max ) , that belongs to cluster.
In the TDMA sub-frame the communication is between CHs. Assuming that the CHs are located in the center of their hexagons, the shortest distance between two CHs belonging to two neighboring rings is 3 R h ( r max ) , see Section 4.3. In practice, due to the irregular location of the CHs, when applying Equation (33) we have identified d T D M A ( r max ) = 2 3 R h ( r max ) .

9. Numerical Results

We consider a two tier WSN covering a circular area with radius R W S N with several nodes or motes equal to N m = 364 . Six topologies have been studied, respectively labeled according to the maximum number of rings, r max = 0 , 1 , 2 , 3 , 4 , 5 . Hence, the number of CHs in each ring are, respectively, 1 , 6 , 12 , 18 , 24 and 30 and the total number of CHs in the WSN is N c ( r max ) = 1 + 3 r max ( r max + 1 ) , respectively 1 , 7 , 19 , 37 , 61 and 91. Although some random distribution of the nodes could be considered, such as a 2-D Poisson, for the sake of illustration we assume spatial uniform distribution where the total number of nodes are equally distributed among the entire WSN area. Nodes within a given hexagon are clustered. In a given cluster one of the nodes is elected as CH and at the same time exempted from data sensing tasks. Keeping in mind this fact, and accounting for an integer number of nodes, the number of sensors per clustering, M c ( r max ) is 363, 51, 18, 9, 5 and 3, see the second column of Table 7. Then, recounting the number of nodes that are finally considered, it comes to result as N m ( r max ) = N c ( r max ) × ( 1 + # M c ( r max ) ) , i.e., 1 × ( 1 + 363 ) = 364 , 7 × ( 1 + 51 ) = 364 , 19 × ( 1 + 18 ) = 361 , 37 × ( 1 + 9 ) = 370 , 61 × ( 1 + 5 ) = 366 and 91 × ( 1 + 3 ) = 364 which show a small difference of, respectively 0 , 0 , - 3 , 6 , 2 and 0 nodes, differences that we believe are not significant for our numerical evaluation.
For the traffic model, the probability of activity per each sensor has been set to p a c t = 0 . 001 and, adopting the FSA protocol during the CONT sub-frame, the permission probability equal to r = 1 [33]. For each one of the six scenarios we did an exhaustive search to find the most suitable parameters N m s C , N i n t r a , N m s T and N i n t e r ; they are given in Table 7. Since each mote or member of the group can hold at most one packet at a time not all the offered traffic is carried. According to the set of parameters given in the first three columns of Table 7, the ratio between the carried and the offered traffic equals to 0 . 91900 , 0 . 95164 , 0 . 98941 , 0 . 99200 , 0 . 99283 and 0 . 99319 for r max equals to 0 , 1 , 2 , 3 , 4 and 5, respectively. From an engineering point of view we can assume that the carried traffic is roughly the same in the six scenarios. Then, from the traffic load balance principle, see Figure 4 and Equation (10), the traffic carried by each CH (normalized to 1) is shown in Table 7. As expected, the traffic load supported by the CHs near the sink is much greater than that supported by the CHs that are far from the sink.

9.1. Delay Analysis

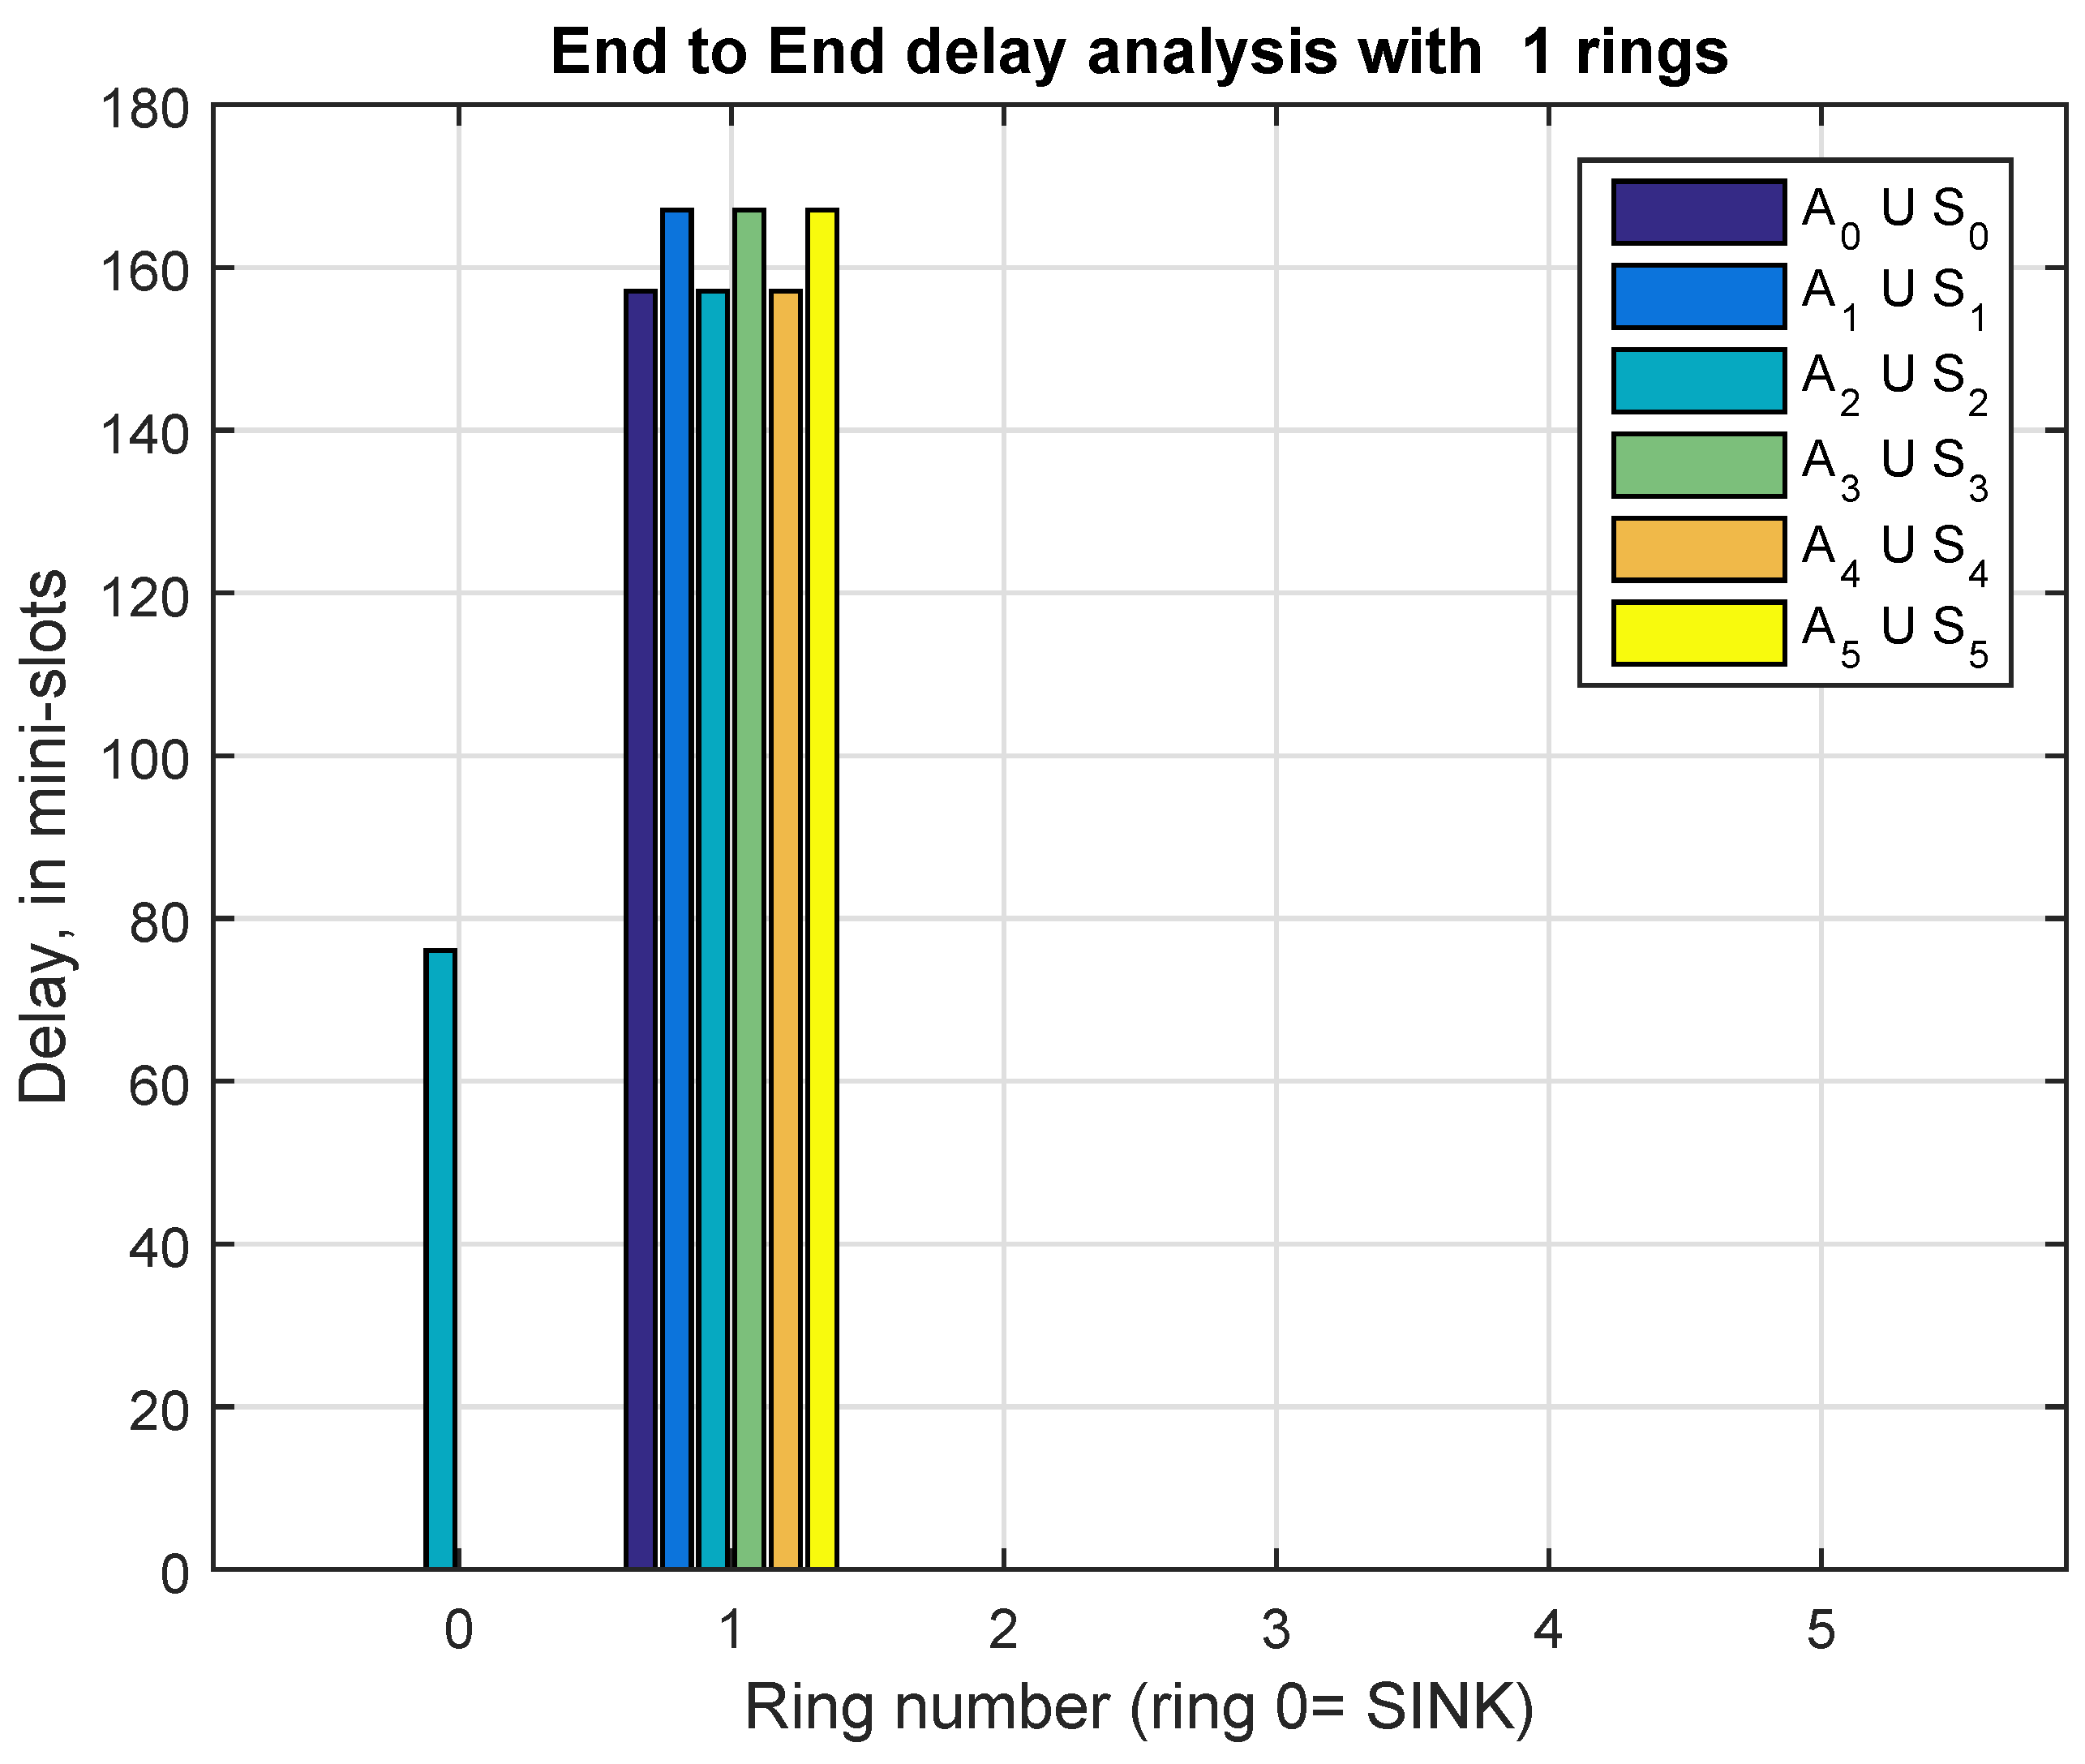
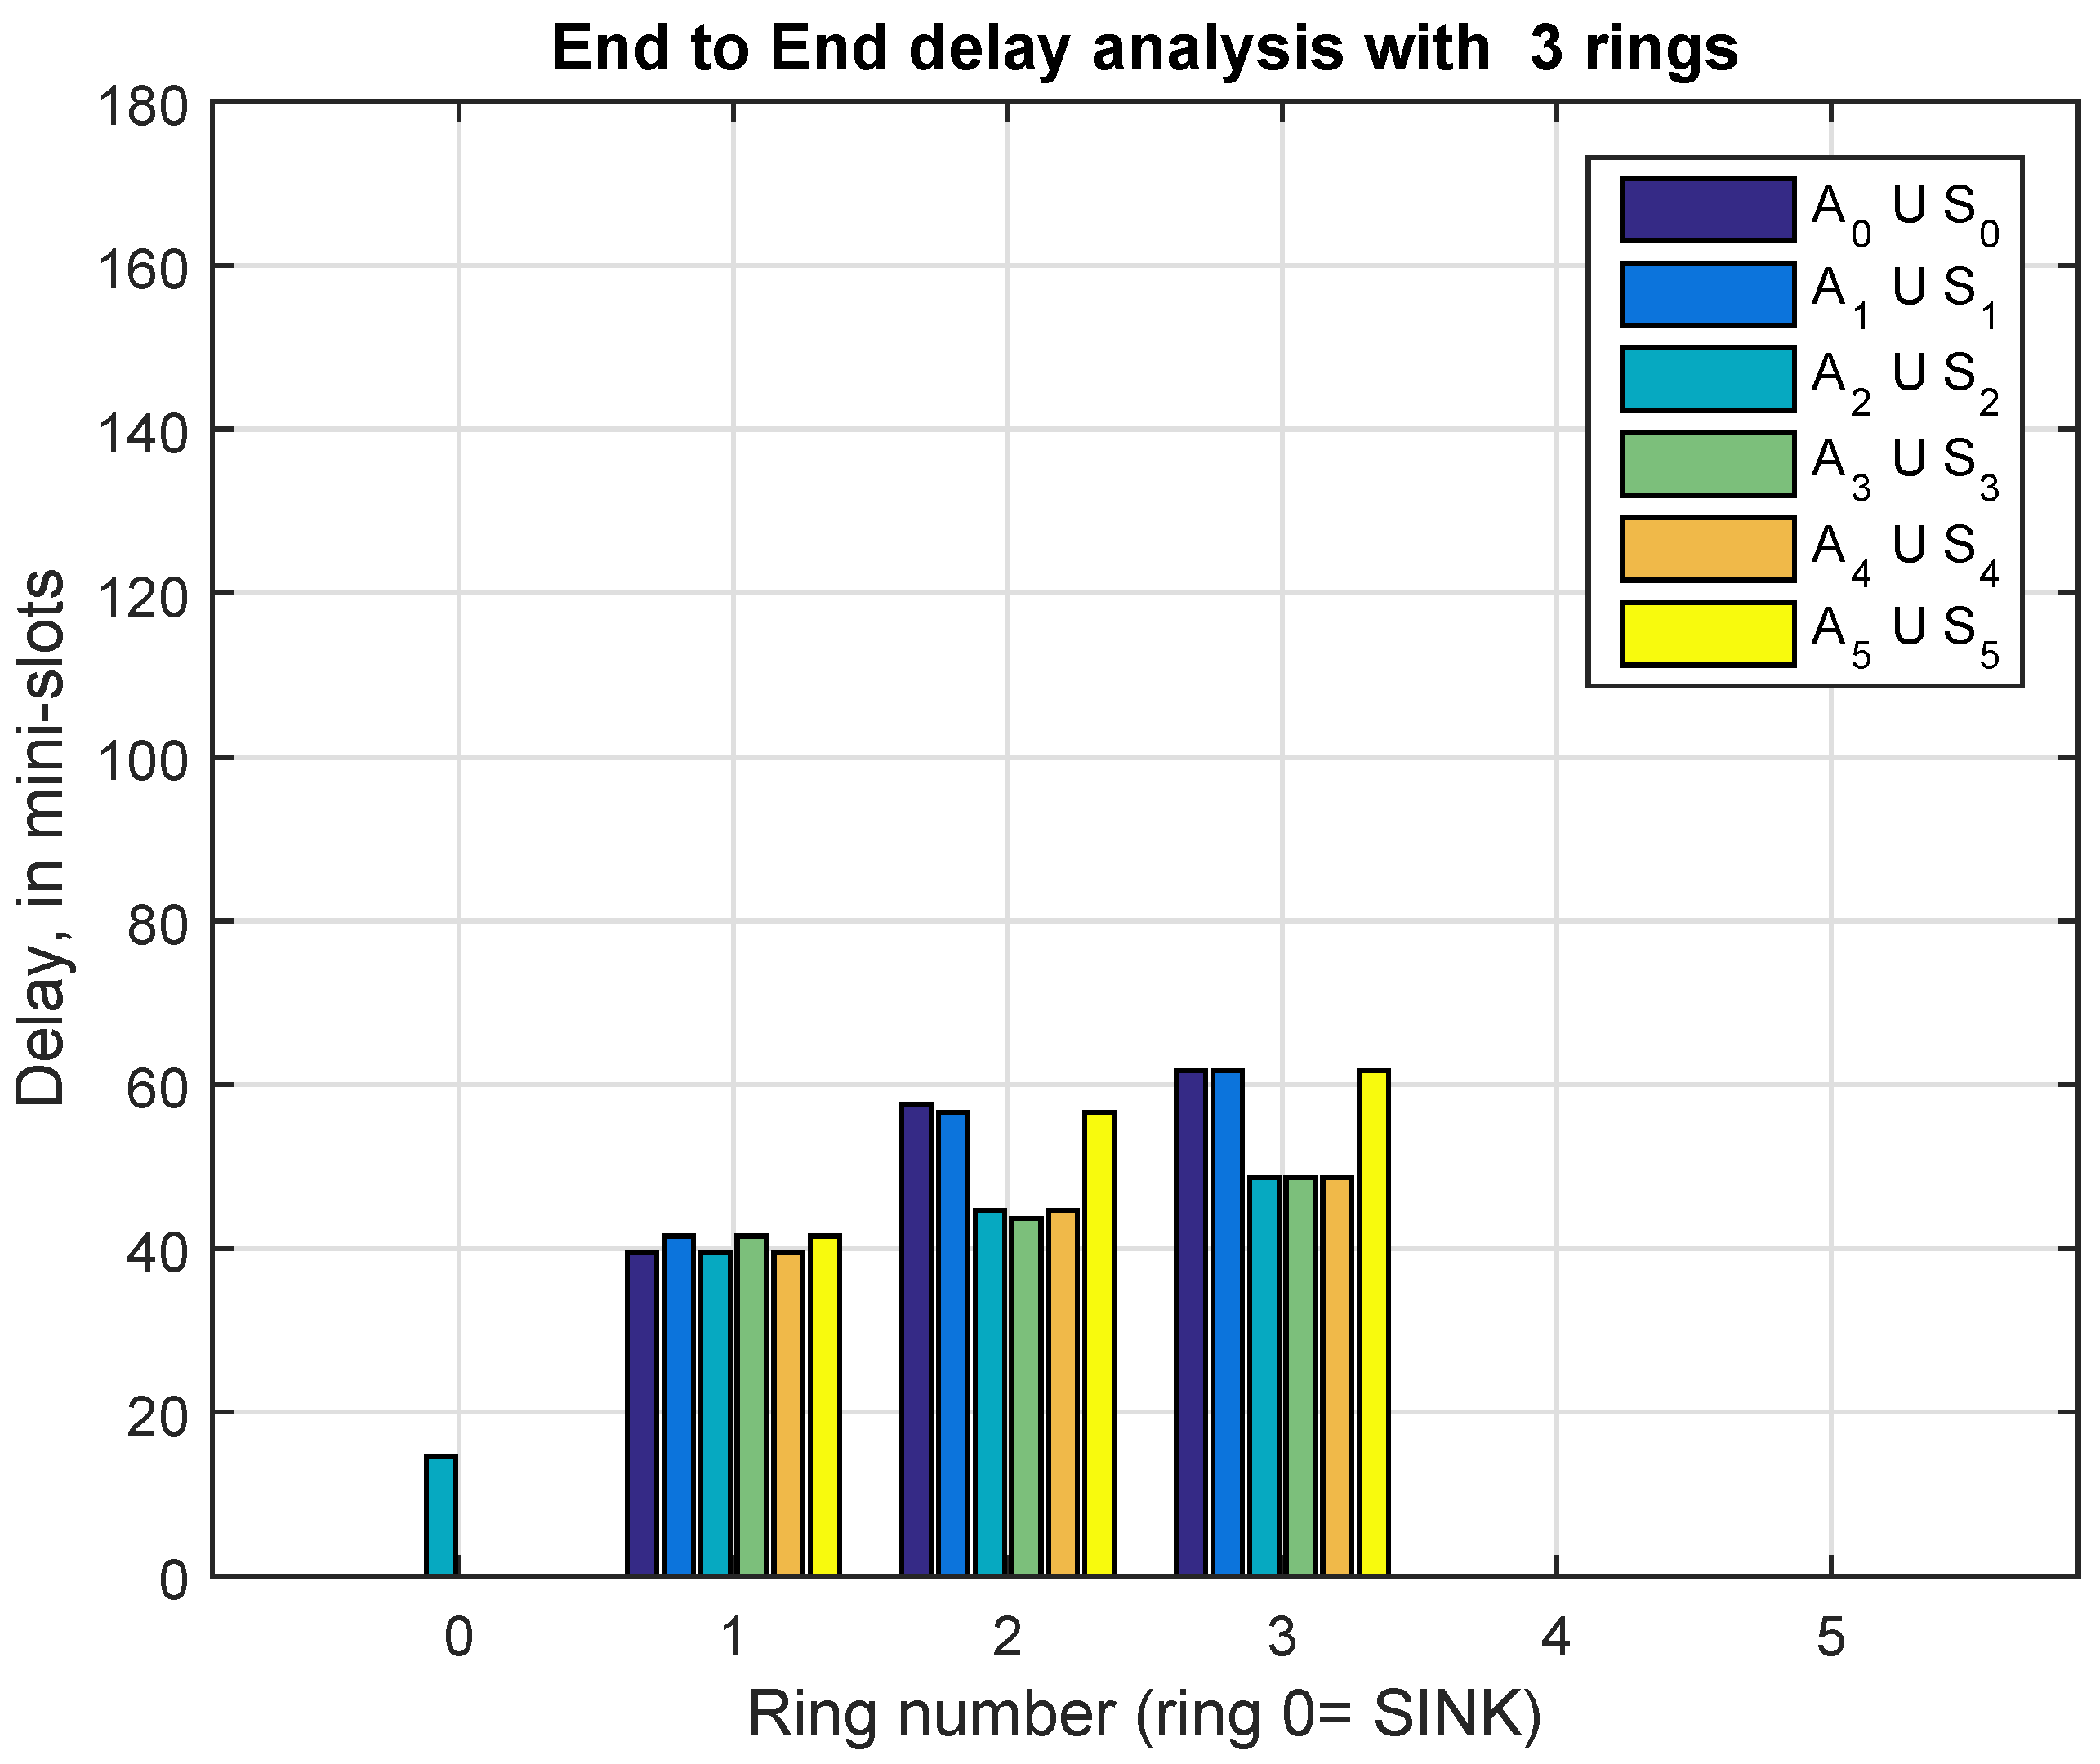
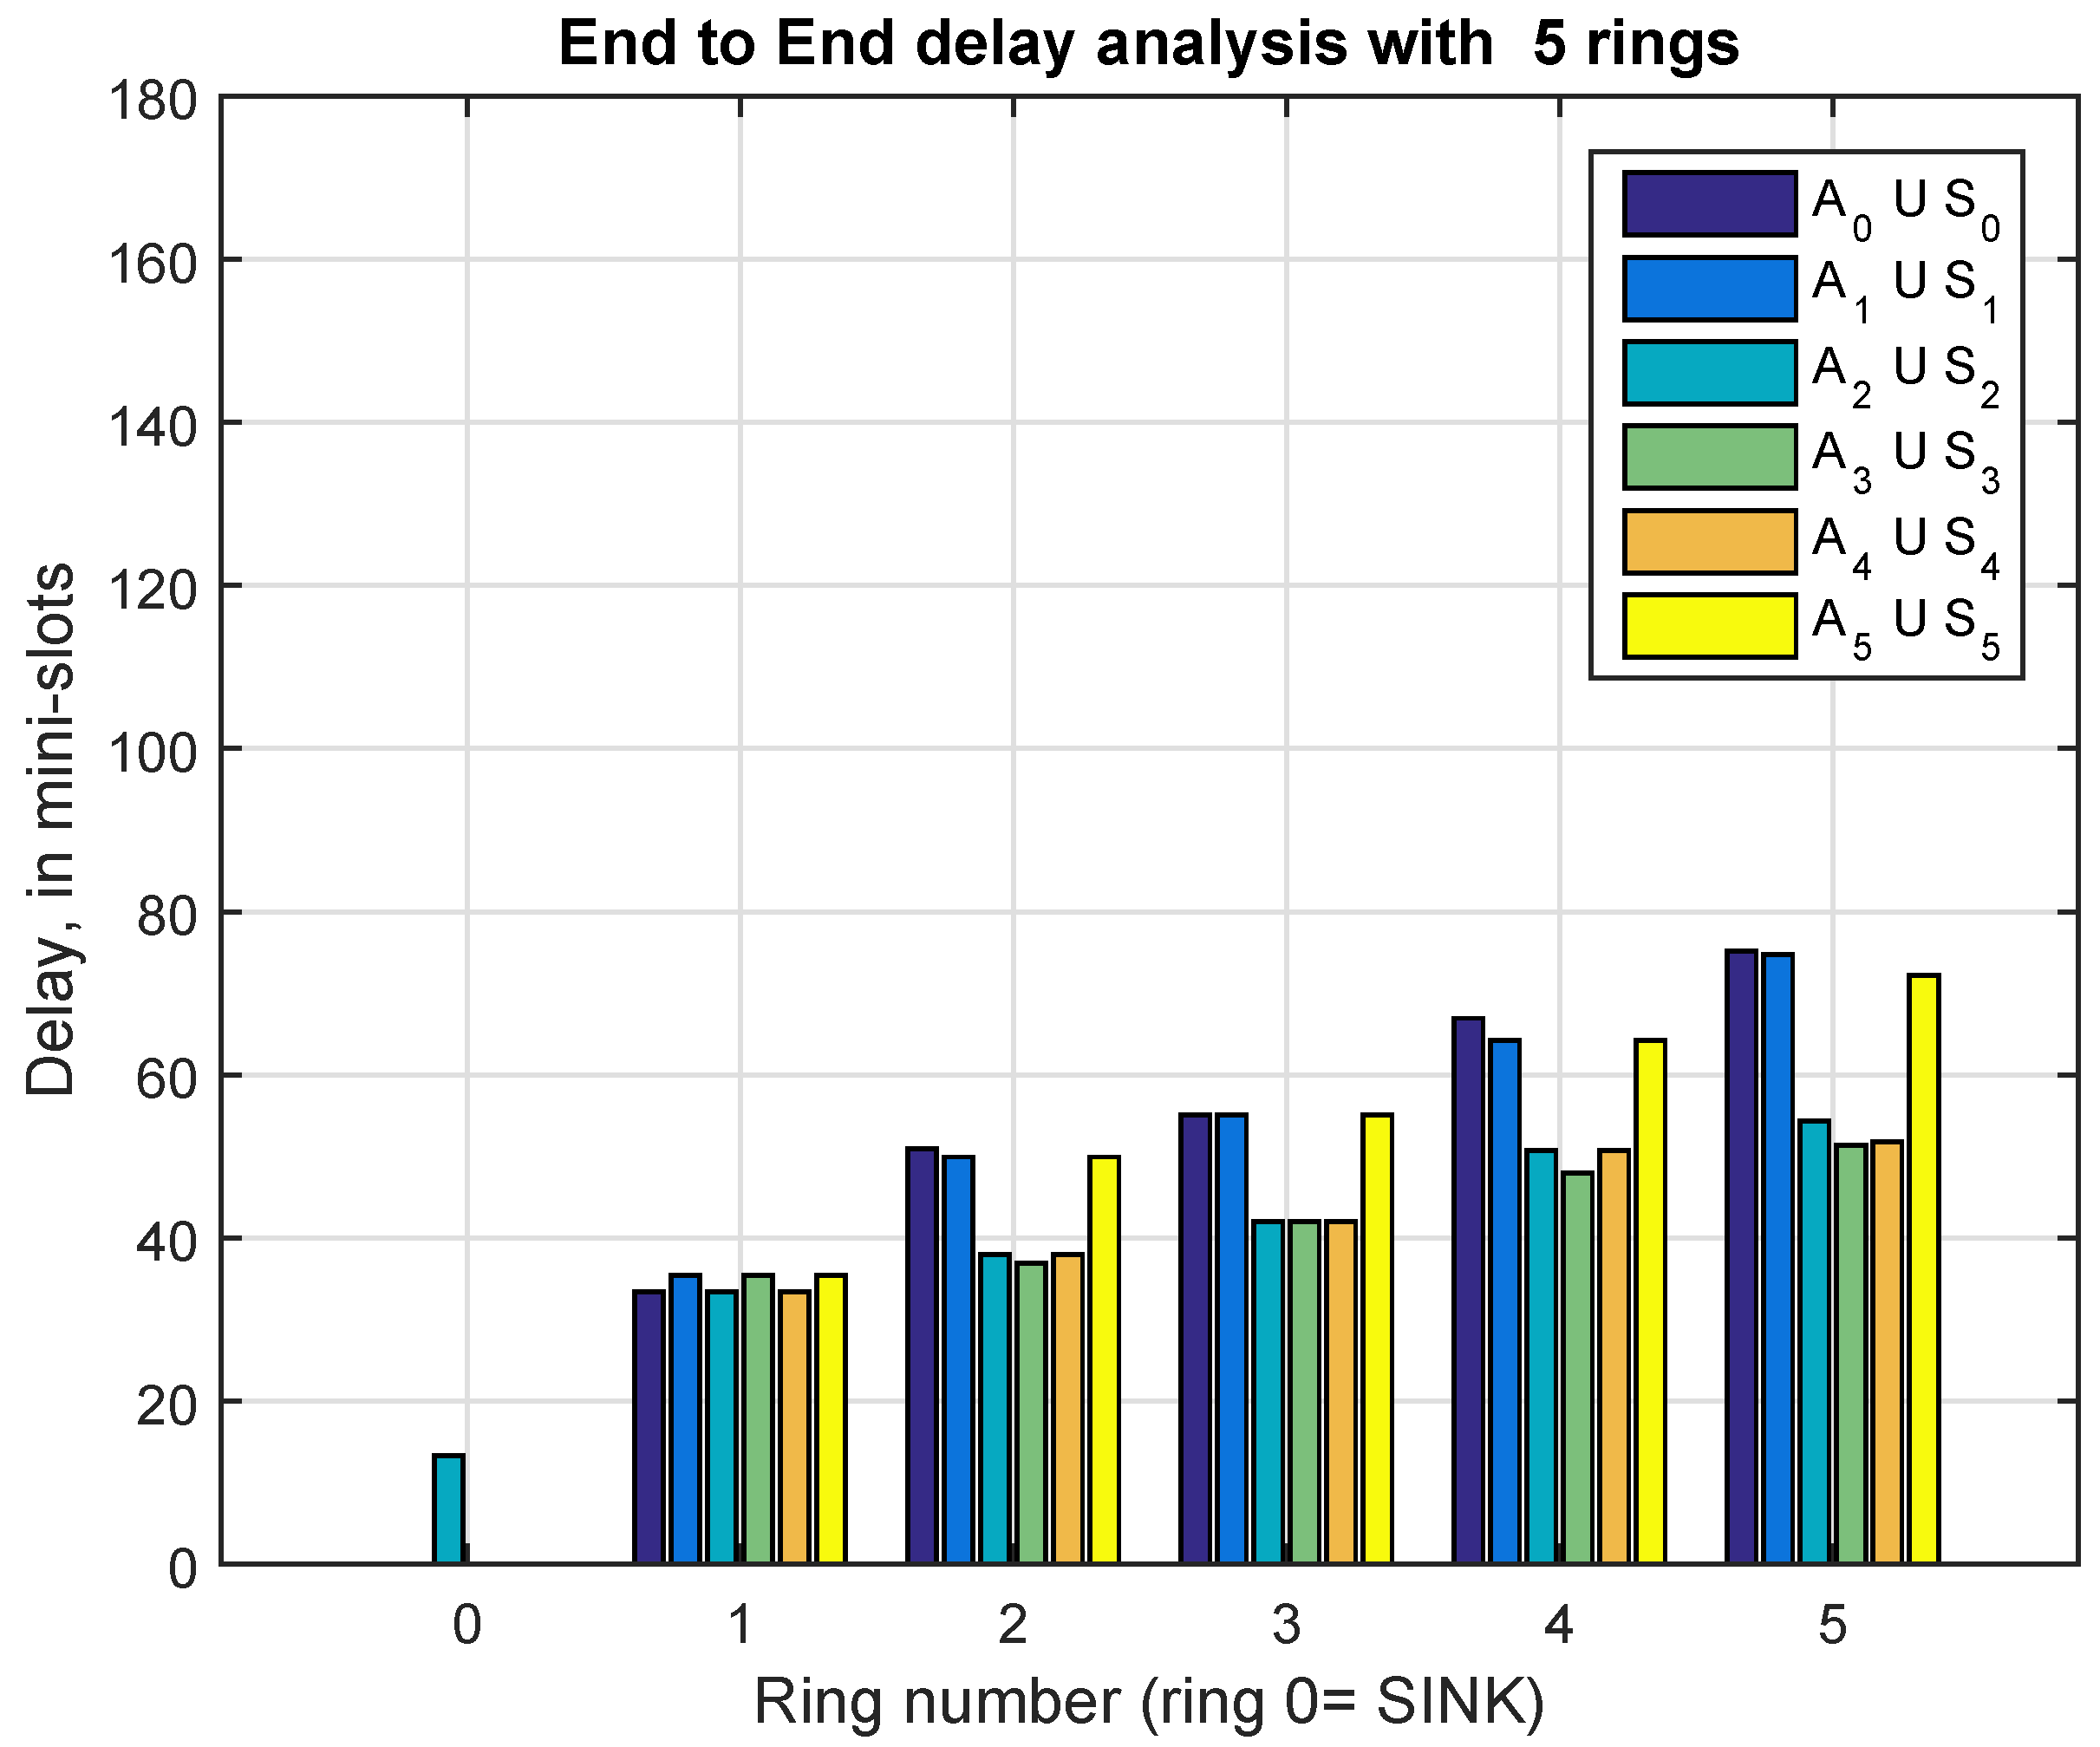
Figure 6, Figure 7, Figure 8, Figure 9, Figure 10 and Figure 11 show the mean value of the end-to-end (E2E) delay for the six scenarios included in Table 7. In all of them, the sink acts as CH of the ring 0. Figure 6 is the case of a single cluster, where only the CONT sub-frame is implemented, i.e., there is no TDMA sub-frame. The E2E delay is 118.99, mini-slots and takes into account only the contention process based on FSA. In the other scenarios the Combi-Frame is implemented with both sub-frames, the CONT and the TDMA. We recall that the E2E delay for data packets generated in ring 0 is only related to the contention process since the sink acts as CH. Those values are 76.07, 18.67, 14.55, 13.71 and 13.34 mini-slots for scenario 1, 2, 3, 4 and 5, respectively. Observe that this E2E delay decreases as the number of rings increases, as expected.
When r max > 0 and for the ring number 1, we observe a couple of values, first the E2E delay for A 0 S 0 , A 2 S 2 and A 4 S 4 ; and second the E2E delay for A 1 S 1 , A 3 S 3 and A 5 S 5 . For example, in Figure 7, those E2E delays are 157.06 and 167.06 mini-slots, respectively. This relative asymmetry can be balanced by rotating, from time to time, the slot allocation in the TDMA sub-frame, independently of the CONT sub-frame. A more pronounced asymmetry is observed at ring numbers 2 , , r max . More precisely, in Figure 8, Figure 9, Figure 10 and Figure 11, we realize that A 0 S 0 , A 1 S 1 and A 5 S 5 conform the “east” side set while A 2 S 2 , A 3 S 3 and A 4 S 4 conform the “west” side set. For example, referring to Figure 8 with r max = 2 and ring=2, the average value of the E2E delay “east” is, in mini-slots, 97.77 for A 0 S 0 , 96.27 for A 1 S 1 and 96.27 for A 5 S 5 , while the delay E2E for the group “ west ” turns out to be 81.77, 80.27 and 81.77 mini-slots respectively for A 2 S 2 , A 3 S 3 and A 4 S 4 . Again, as before, the asymmetry can be compensated by rotating from time to time the slot allocation in the TDMA sub-frame.
When r max increases the number of members per CH decreases and the contribution of the contending phase to the delay E2E is substantially reduced. As we can see in Figure 10 for r max = 4 and Figure 11 for r max = 5 , the average E2E delay for ring r p = 2 are, respectively 46.75 and 43.91 mini-slot, and for ring r p = 3 the respective values are, 51.48 and 48.54 mini-slots, which are rather similar. In fact, the main contribution in those values are mainly due to the T T x , y p , x , y p - 1 factors, see Equations (25) and (27), i.e., the time interval between the transmission slot of a CH located on the ring r p , which turns out to be of reception for some neighboring CHs located in the ring r p - 1 , and the first available transmission slot of one mentioned neighbor CH.

9.2. Energy Consumption

For several sizes of the WSN and for several r max , Figure 12 shows the total energy consumption, ring by ring. The six topologies, with r max is 0, 1, 2, 3, 4 and 5, have been analyzed for an equivalent circular radius R W S N , equals to 100, 200, 300, 400, 500 and 600 meters. Following the energy consumption model, we observe that for R W S N = 100 m., a low coverage area, it is more convenient to group all the sensors in a single cluster, i.e., r max = 0 . On the other hand, when the coverage area increases, the energy consumption also increases, mainly due to the distance between the members and the only CH, a role played in this case by the sink. Then, for large coverage areas it is more appropriate to use the two tier cluster hierarchical with a high number of r max . It is worth mentioning that for a given ring, r p , the energy consumption increases when the coverage area increases, as expected. Obviously, this is because the coverage area of a cluster increases with R W S N . Nevertheless, the difference is less significant for high values of r p .

10. Conclusions and Further Work

In this paper, the end-to-end (E2E) delay and the energy consumption of a two tier Wireless Sensor Network (WSN) has been studied. In the WSN, sensors transmit the sensed information to their cluster head (CH) by using some simple random access protocol (RAP) such as the Frame-Slotted ALOHA (FSA). In a second action, the information received by the CHs is transferred in hop by hop, ring by ring mode to the sink, by using a TDMA protocol. A Markovian model and a simple propagation-attenuation model have been formulated to evaluate, respectively the E2E delay and the energy consumption. The numerical results show that from the point of view of energy consumption and for small coverage areas, a very low number of clusters is convenient, perhaps a single one in which the sink acts as the single CH. On the other hand, when the coverage area is big, it becomes convenient to use several clusters grouped in concentric rings around the sink. From the point of view of the E2E delay, it is important to note that the more CHs the WSN has the less contention delay the data packets will experience, but the information coming from the limits far from the sink will suffer more delay. This is due to the increase in the number of jumps to reach the sink, although the increase in the delay is not as high as might be expected.
Several objectives are planned for the near future, some of them are already in progress. First is to consider that clusters near to the sink are smaller in size than clusters far from the sink [38]. This fact would increase the density of CHs per ring near the sink in such a way that, on the one hand, it would collect less local traffic for CH and on the other hand the retransmission of exogenous traffic would be reduced. This strategy would reduce the frequency of CH rotation, which tends to add an excessive communication overhead to the WSN, resulting in high energy consumption. Second, in order to avoid that CHs close to the sink carry all the traffic coming from outer rings, to address analytical models with mixed-routing schemes, i.e., to combine direct transmission mode with hop-by-hop transmission mode as has been pointed out in [5]. Third, the study of a comparative analysis of the previous architectures, taking into account key performance indicators such as flow, delay and lifetime of the resulting wireless sensor networks.

Author Contributions

V.C.-G., along with co-authors of [24,33] conceived the scenario; V.C.-G. suggested the FSA protocol, the queue model and wrote the document; T.I.N., D.S.F. and T.R.V.H., conceived the model of energy consumption, analyzed the data and helped to write the paper.

Funding

This research received no external funding.

Acknowledgments

The work of V. Casares-Giner (ITACA research institute) is partly supported by the Spanish national projects TIN2013-47272-C2-1-R and TEC2015-71932-REDT. The work of Tatiana Navas, Dolly Flórez, and Tito R. Vargas H., and the collaboration between the two institutions, is supported by the Universidad Santo Tomás under Master Degree’s research and academic projects.

Conflicts of Interest

The authors declare no conflict of interest.

Abbreviations

The following abbreviations are used in this manuscript:
x , y h Hexagonal coordinates for a cluster
x , y p Polar coordinates for a cluster
r max Maximum number of rings in the WSN area
R C Minimum range of intra-cell communication
R T Minimum range of inter-cell communication
N m Total number of sensors or motes in the WSN area
M c ( r max ) Total number of members per cluster
N i n t r a Number of slots per CONT sub-frame
N m s C Number of mini-slots per CONT slot
N i n t e r Number of slots per TDMA sub-frame
N m s T Number of mini-slots per TDMA slot
N s C F Number of slots per Combi-Frame
N m s C F Number of mini-slots per Combi-Frame
T m s C Time duration of the CONT mini-slot
T m s T Time duration of the TDMA mini-slot
T C O N T Time duration of the CONT sub-frame
T T D M A Time duration of the TDMA sub-frame
T C F Time duration of the Combi-Frame
λ Poisson arrival rate of data packets per sensor
p a c t Probability a sensor becomes active during one mini-slot
F ( z ) PGF of the input process at a CH
L ( z ) PGF of the output process after a CONT slot
A i ( z ) PGF of the arrival data packets at CH during slot i
D ( z ) PGF of the departure process at a CH after a TDMA slot
ρ k Normalized traffic load at any CH of ring k

References

  1. Shi, L.; Fapojuwo, A.O. TDMA Scheduling with Optimized Energy Efficiency and Minimum Delay in Clustered Wireless Sensor Networks. IEEE Trans. Mob. Comput. 2010, 9, 927–940. [Google Scholar] [CrossRef]
  2. Rom, R.; Sidi, M. Multiple Access Protocols—Performance and Analysis; Springer: New York, NY, USA, 1990. [Google Scholar]
  3. Hammond, J.L.; O’Reilly, P.J.P. Performance Analysis of Local Computer Networks; Addison-Wesley Publishing Company: Boston, MA, USA, 1986. [Google Scholar]
  4. Sari, A. Two-Tier Hierarchical Cluster Based Topology in Wireless Sensor Networks for Contention Based Protocol Suite. Int. J. Commun. Netw. Syst. Sci. 2015, 8, 29–42. [Google Scholar] [CrossRef]
  5. Zhang, H.; Shen, H. Balancing Energy Consumption to Maximize Net-work Lifetime in Data-Gathering Sensor Networks. IEEE Trans. Parallel Distrib. Syst. 2009, 20, 1526–1539. [Google Scholar] [CrossRef]
  6. Bjornemo, E.; Johansson, M.; Ahlen, A. Two Hops is One too Many in an Energy-Limited Wireless Sensor Network. In Proceedings of the 2007 IEEE International Conference on Acoustics, Speech and Signal Processing (ICASSP ’07), Honolulu, HI, USA, 15–20 April 2007; Volume 3, pp. III-181–III-184. [Google Scholar]
  7. Kheireddine, M.; Abdellatif, R. Analysis of Hops Length in Wireless Sensor Networks. Wirel. Sens. Netw. 2014, 6, 109–117. [Google Scholar] [CrossRef]
  8. Wieselthier, J.E.; Ephremides, A.; Michaels, L.A. An Exact Analysis and Performance Evaluation of Framed ALOHA with Capture. IEEE Trans. Commun. 1989, 37, 125–137. [Google Scholar] [CrossRef]
  9. Song, W.; Huang, R.; Shirazi, B.; LaHusen, R. TreeMAC: Localized TDMA MAC protocol for real-time high-data-rate sensor networks. In Proceedings of the PERCOM 2009, IEEE International Conference on Pervasive Computing and Communications, Galveston, TX, USA, 9–13 March 2009; pp. 1–10. [Google Scholar] [CrossRef]
  10. Liu, W.; Zhao, D.; Zhu, G. End-to-end delay and packet drop rate performance for a wireless sensor network with a cluster-tree topology. Wirel. Commun. Mob. Comput. 2014, 14, 729–744. [Google Scholar] [CrossRef]
  11. Alabdulmohsin, I.; Hyadi, A.; Afify, L.; Shihada, B. End-to-end delay analysis in wireless sensor networks with service vacation. In Proceedings of the WCNC 2014, IEEE Wireless Communications and Networking Conference, Istanbul, Turkey, 6–9 April 2014; pp. 2798–2804. [Google Scholar] [CrossRef]
  12. Park, J.; Lee, S.; Yoo, S. Time slot assignment for convergecast in wireless sensor networks. J. Parallel Distrib. Comput. 2015, 83, 70–82. [Google Scholar] [CrossRef]
  13. Yang, X.; Wang, L.; Xie, J.; Zhang, Z. Energy Efficiency TDMA/CSMA Hybrid Protocol with Power Control for WSN. Wirel. Commun. Mob. Comput. 2018, 2018, 1–7. [Google Scholar] [CrossRef]
  14. Olariu, S.; Stojmenovic, I. Design guidelines for maximizing lifetime and avoiding energy holes in sensor networks with uniform distribution and uniform reporting. In Proceedings of the IEEE INFOCOM 2006, 25th IEEE International Conference on Computer Communications, Barcelona, Spain, 23–29 April 2006; pp. 1–10. [Google Scholar] [CrossRef]
  15. Sgora, A.; Vergados, D.J.; Vergados, D.D. A Survey of TDMA Scheduling Schemes in Wireless Multihop Networks. ACM Comput. Surv. 2015, 47, 53:1–53:38. [Google Scholar] [CrossRef]
  16. Martin, E.; Liu, L.; Covington, M.; Pesti, P.; Weber, M. Location-Based Services Handbook—Applications, Technologies, and Security; Chapter Positioning Technologies in Location-Based Services; Ahson, S.A., Ilyas, M., Eds.; CRC Press: Boca Raton, FL, USA, 2010; pp. 1–45. [Google Scholar] [CrossRef]
  17. Pal, A. Localization Algorithms in Wireless Sensor Networks: Current Approaches and Future Challenges. Netw. Protoc. Algorithms 2010, 2, 45–74. [Google Scholar] [CrossRef]
  18. Pestana Leao de Brito, L.M.; Rodriguez Peralta, L.M. An Analysis of Localization Problems and Solutions in Wireless Sensor Networks. Revista de Estudos Politécnicos 2008, 6, 1–27. [Google Scholar]
  19. Gerla, M.; Kwon, T.J.; Pei, G. On demand routing in large ad hoc wireless networks with passive clustering. In Proceedings of the 2000 IEEE Wireless Communications and Networking Conference, Chicago, IL, USA, 23–28 September 2003; pp. 100–105. [Google Scholar]
  20. Aziz, N.A.A.; Aziz, K.A.; Ismail, W.Z.W. Coverage Strategies for Wireless Sensor Networks. World Acad. Sci. Eng. Technol. Int. J. Electron. Commun. Eng. 2009, 3, 171–176. [Google Scholar]
  21. Alonso, E.; Meier-Hellstern, K.S.; Pollini, G. Influence of cell geometry on handover and registration rates in cellular and universal personal telecommunication networks. In Proceedings of the 8th International Teletraffic Congress (ITC), Specialists Seminar on Universal Personal Telecommunications, Genova, Italy, 12–14 October 1992; pp. 261–270. [Google Scholar]
  22. Kusdaryono, A.; Oh Lee, K. A Clustering Protocol with Mode Selection for Wireless Sensor Network. J. Inf. Process. Syst. 2011, 7, 29–42. [Google Scholar] [CrossRef]
  23. MacDonald, V.H. Advanced Mobile Phone Service: The Cellular Concept. Bell Syst. Tech. J. 1979, 58, 15–41. [Google Scholar]
  24. Casares-Giner, V.; Wuchner, P.; Pacheco-Paramo, D.; de Meer, H. Combined Contention and TDMA-Based Communication in Wireless Sensor Networks. In Proceedings of the NGI’12 Conference, Karlskrona, Sweden, 25–27 June 2012. [Google Scholar] [CrossRef]
  25. Elson, J.; Girod, L.; Estrin, D. Fine-Grained Network Time Synchronization using Reference Broadcasts. In Proceedings of the Fifth Symposium on Operating Systems Design and Implementation (OSDI), Boston, MA, USA, 9–11 December 2002. [Google Scholar]
  26. Ganeriwal, S.; Kumar, R.; Srivastava, M.B. Timing-Sync Protocol for Sensor Networks. In Proceedings of the ACM SenSys’03, Los Angeles, CA, USA, 5–7 November 2003. [Google Scholar]
  27. Maróti, M.; Kusy, B.; Simon, G.; Lédeczi, A. The Flooding Time Synchronization Protocol. In Proceedings of the ACM SenSys’04, Proceedings Second International Conference on Embedded Networked Sensor Systems, Baltimore, MD, USA, 3–5 November 2004; pp. 39–49. [Google Scholar]
  28. Ranganathan, P.; Nygard, K. Time Synchronization in Wireless Sensor Networks: A Survey. Int. J. UbiCOmp 2010, 1, 92–102. [Google Scholar] [CrossRef]
  29. Shanti, C.; Sahoo, A. DGRAM: A Delay Guaranteed Routing and MAC Protocol for Wireless Sensor Networks. IEEE Trans. Mob. Comput. 2010, 9, 1407–1423. [Google Scholar] [CrossRef]
  30. European Telecommunications Standards Institute; ETSI Secretariat. Digital Cellular Telecommunications System (Phase 2+); Physical Layer on the Radio Path; General Description (GSM 05.01 Version 5.4.0); GSM Technical Specification; ETSI: Sophia Antipolis, France, 1998. [Google Scholar]
  31. Redl, S.M.; Weber, M.K.; Oliphant, M.W. An Introduction to GSM; Artech House: Norwood, MA, USA, 1995. [Google Scholar]
  32. Wu, Y.-C.; Chaudhari, Q.; Erchin Serpedin, E. Clock Synchronization of Wireless Sensor Networks. IEEE Signal Process. Mag. 2011, 1, 124–138. [Google Scholar] [CrossRef]
  33. Casares-Giner, V.; Sempere-Paya, V.; Todoli-Ferrandis, D. Framed ALOHA Protocol with FIFO-Blocking and LIFO-Push out Discipline. Netw. Protoc. Algorithms 2014, 6, 82–102. [Google Scholar] [CrossRef]
  34. Tello, L.; Pla, V.; Leyva-Mayorga, I.; Martinez-Bauset, L.; Casares-Giner, V.; Guijarro, L. Efficient Random Access Channel Evaluation and Load Estimation in LTE-A With Massive MTC. IEEE Trans. Veh. Technol. 2019, 68, 1998–2002. [Google Scholar] [CrossRef]
  35. Adan, I.; van Leeuwaarden, J.; Winands, E. On the application of Rouché’s theorem in queueing theory. Oper. Res. Lett. 2006, 34, 355–360. [Google Scholar] [CrossRef]
  36. Casares-Giner, V.; Martínez-Bauset, J.; Portillo, C. Performance Evaluation of Framed Slotted ALOHA with Reservation Packets and Succesive Interference Cancelation for M2M Networks. Comput. Networks. 2019, 155, 15–30. [Google Scholar] [CrossRef]
  37. Bhardwaj, M.; Garnett, T.; Chandrakasan, A.P. Upper bounds on the lifetime of sensor networks. In Proceedings of the ICC 2001, IEEE International Conference on Communications. Conference Record, Helsinki, Finland, 11–14 June 2001; Volume 3, pp. 785–790. [Google Scholar] [CrossRef]
  38. Wu, D.; He, J.; Wang, H.; Wang, C.; Wang, R. A Hierarchical Packet Forwarding Mechanism for Energy Harvesting Wireless Sensor Networks. IEEE Commun. Mag. 2015, 8, 92–98. [Google Scholar] [CrossRef]
Figure 1. Wireless Sensor Network Scenario with r max = 3 .
Information 10 00135 g001
Figure 2. Hexagonal Coordinates x , y h , Polar Coordinates x , y p , Sectors S k and Axes A k for 0 k 5 .
Information 10 00135 g002
Figure 3. Combi-Frame Structure.
Information 10 00135 g003
Figure 4. Routing Probabilities for Load Balancing from Ring 4 to Ring 1 in Sector S 1 .
Information 10 00135 g004
Figure 5. The role of A i ( z ) in several nodes located at S 0 when r max = 4 .
Information 10 00135 g005
Figure 6. End to end delay (in mini-slots), from sensor to the sink, for r max = 0 , p a c t = 0 . 001 and ( N m s C , N i n t r a ; N m s T , N i n t e r ) = ( 63 , 1 ; 0 , 0 ) .
Information 10 00135 g006
Figure 7. End to end delay (in mini-slots), from sensor to the sink, for r max = 1 , p a c t = 0 . 001 and ( N m s C , N i n t r a ; N m s T , N i n t e r ) = ( 10 , 3 ; 3 , 7 ) .
Information 10 00135 g007
Figure 8. End to end delay (in mini-slots), from sensor to the sink, for r max = 2 , p a c t = 0 . 001 and ( N m s C , N i n t r a ; N m s T , N i n t e r ) = ( 3 , 3 ; 1 , 7 ) .
Information 10 00135 g008
Figure 9. End to end delay (in mini-slots), from sensor to the sink, for r max = 3 , p a c t = 0 . 001 and ( N m s C , N i n t r a ; N m s T , N i n t e r ) = ( 2 , 3 ; 1 , 7 ) .
Information 10 00135 g009
Figure 10. End to end delay (in mini-slots), from sensor to the sink, for r max = 4 , p a c t = 0 . 001 and ( N m s C , N i n t r a ; N m s T , N i n t e r ) = ( 2 , 3 ; 1 , 7 ) .
Information 10 00135 g010
Figure 11. End to end delay (in mini-slots), from sensor to the sink, for r max = 5 , p a c t = 0 . 001 and ( N m s C , N i n t r a ; N m s T , N i n t e r ) = ( 2 , 3 ; 1 , 7 ) .
Information 10 00135 g011
Figure 12. Energy consumption for several radius of the WSN, with N s = 364 sensors, p a c t = 0 . 001 and r max = 5 .
Information 10 00135 g012
Table 1. Definition of Sectors S k and Axes A k .
SectorConditionAxesCondition
S 0 0 < x p , 0 < y p < x p A 0 0 < x p , y p = 0
S 1 0 < x p , x p < y p < 2 x p A 1 0 < x p , y p = x p
S 2 0 < x p , 2 x p < y p < 3 x p A 2 0 < x p , y p = 2 x p
S 3 0 < x p , 3 x p < y p < 4 x p A 3 0 < x p , y p = 3 x p
S 4 0 < x p , 4 x p < y p < 5 x p A 4 0 < x p , y p = 4 x p
S 5 0 < x p , 5 x p < y p < 6 x p A 5 0 < x p , y p = 5 x p
Table 2. Cluster Size N x = i x 2 + i x j x + j x 2 .
i x , j x 0123456789...
00
113
24712
39131927
41621283748
5253139496175
6364352637691108
74957677993109127147
864738497112129148169192
98191103117133151171193217243
Table 3. Cluster Size N x = i x 2 + i x j x + j x 2 , ( x = N i n t r a , N i n t e r ) and Slot Assignment for Transmission for any CH x , y h .
i x j x N x T ( x h , y h )
113 [ x h + y h ] mod 3
204 2 x h mod 4 + y h mod 2
217 [ 2 x h + y h ] mod 7
2212 [ 2 x h + 2 y h + x h mod 2 ] mod 12
309 3 x h mod 9 + y h mod 3
3113 [ 3 x h + y h ] mod 13
3219 [ 3 x h + 2 y h ] mod 19
3327 [ 3 x h + 3 y h + x h mod 3 ] mod 27
4016 4 x h mod 16 + y h mod 4
4121 [ 4 x h + y h ] mod 21
4228 [ 4 x h + 2 y h + x h mod 2 ] mod 28
4337 [ 4 x h + 3 y h ] mod 37
4448 [ 4 x h + 4 y h + x h mod 4 ] mod 48
5025 5 x h mod 25 + y h mod 5
5131 [ 5 x h + y h ] mod 31
5239 [ 5 x h + 2 y h ] mod 39
5349 [ 5 x h + 3 y h ] mod 49
5461 [ 5 x h + 4 y h ] mod 61
5575 [ 5 x h + 5 y h + x h mod 5 ] mod 75
6036 6 x h mod 36 + y h mod 6
6143 [ 6 x h + y h ] mod 43
6252 [ 6 x h + 2 y h + x h mod 2 ] mod 52
6363 [ 6 x h + 3 y h + x h mod 3 ] mod 63
6476 [ 6 x h + 4 y h + x h mod 2 ] mod 76
6591 [ 6 x h + 5 y h ] mod 91
66108 [ 6 x h + 6 y h + x h mod 6 ] mod 108
         ⋮
Table 4. Frame structure for nodes in A 0 S 0 A 1 and Ring 4 . ( N I n t r a , N I n t e r ) = ( 4 , 7 ) .
CH h Frame Structure : - CONT - TDMA - Frame Structure : With as Starting Point CT
4 , 4 CS S S - S S S S S T S - CS S S - S S S S S T S -9
4 , 3 SC S S - S S S T S S S - CS S - S S S T S S S - S 6
4 , 2 CS S S - S T S S S S S - CS S S - S T S S S S S -5
4 , 1 SC S S - S S S S S S T - CS S - S S S S S S T - S 9
4 , 0 CS S S - S S S S T S S - CS S S - S S S S T S S -8
3 , 3 S S SC - S S T R R R S - C - S S T R R R S - S S S 3
3 , 2 S SC S - T R S R S S S - CS - T R S R S S S - S S 2
3 , 1 S S SC - S R S S S T R - C - S R S S S T R - S S S 6
3 , 0 S SC S - S R S T R S R - CS - S R S T R S R - S S 5
2 , 2 CS S S - R R R S S S T - CS S S - R R R S S S T -10
2 , 1 SC S S - R S S S T R S - CS S - R S S S T R S - S 7
2 , 0 CS S S - R S T R S R S - CS S S - R S T R S R S -6
1 , 1 S S SC - S S S T R R R - C - S S S T R R R - S S S 4
1 , 0 S SC S - S T R S R S R - CS - S T R S R S R - S S 3
Table 5. Coefficients c k according to Equation (11).
r max Ring k ( # CH k )
0 (1)1 (6)2 (12)3 (18)4 (24)5 (30)6 (36)7 (42)...
01 (sink)
11 + 61
21 + 1831
31 + 366 5 / 2 1
41 + 6010 9 / 2 7 / 3 1
51 + 9015 14 / 2 12 / 3 9 / 4 1
61 + 12621 20 / 2 18 / 3 15 / 4 11 / 5 1
71 + 16828 27 / 2 25 / 3 22 / 4 18 / 5 13 / 6 1
Table 6. Frame structure for nodes in A 0 S 0 A 1 . ( N I n t r a , N I n t e r ) = ( 3 , 7 ) and Ring 4 .
RINGCH Frame Structure : CONT - TDMA - Frame Structure : With T as Starting Point
4 4 , 4 S SC - S S S S S T S - T S - S SC - S S S S S
4 , 3 SC S - S S S T S S S - T S S S - SC S - S S S
4 , 2 CS S - S T S S S S S - T S S S S S - CS S - S
4 , 1 S SC - S S S S S S T - T - S SC - S S S S S S
4 , 0 SC S - S S S S T S S - T S S - SC S - S S S S
3 3 , 3 CS S - S S T R R R S - T R R R S - CS S - S S
3 , 2 S SC - T R S R S S S - T R S R S S S - S SC -
3 , 1 SC S - S R S S S T R - T R - SC S - S R S S S
3 , 0 CS S - S R S T R S R - T R S R CS S - S R S -
2 2 , 2 SC S - R R R S S S T - T - SC S - R R R S S S
2 , 1 CS S - R S S S T R S - T R S - CS S - R S S S
2 , 0 S SC - R S T R S R S - T R S R S - S SC - R S
1 1 , 1 S SC - S S S T R R R - T R R R - S SC - S S S
1 , 0 SC S - S T R S R S R - T R S R S R - SC S - S
Table 7. Parameters, N m = 364 ; p a c t = 0 . 001 ; ( N i n t r a , N i n t e r ) * = ( 3 , 7 ) ; N m s C F = N m s C . N i n t r a + N m s T . N i n t e r . *If r max = 0 , N i n t r a = 1 , N i n t e r = 0 .
r max M c ( r max ) N m ( r max ) ( N msC , N msT ) N msCF ρ 1 ρ 2 ρ 3 ρ 4 ρ 5
0363364(63, 0)63-----
151364(10, 3)510.8254----
218361(3, 1)160.85520.2850---
39370(2, 1)130.69670.29030.1161--
45366(2, 1)130.64560.29050.15060.0645-
53364(2, 1)130.58130.27120.15500.08710.0387