1. Introduction
Healthcare is facing many challenges such as costs reduction for providing more efficient services, integration of new generation cutting-edge electronic medical devices and efficient analysis of a big amount of health data. Although the healthcare sector has been quite reluctant so far about the adoption of new emerging cutting-edge ICT technologies, both private and public healthcare operators have begun to encourage the adoption of such technologies envisioning the possibility to improve services, but at the same time reducing costs and improving revenues.
Among these, a particular attention is given to the adoption of Big Data analytics solutions. In fact, health data in many healthcare sectors are characterized by the well-known “three-v” typical of Big Data, i.e., volume, velocity and variety. Moreover, an in-depth analysis of Big Data performed by means of high-processing decision making systems help healthcare operators to predict diagnosis.
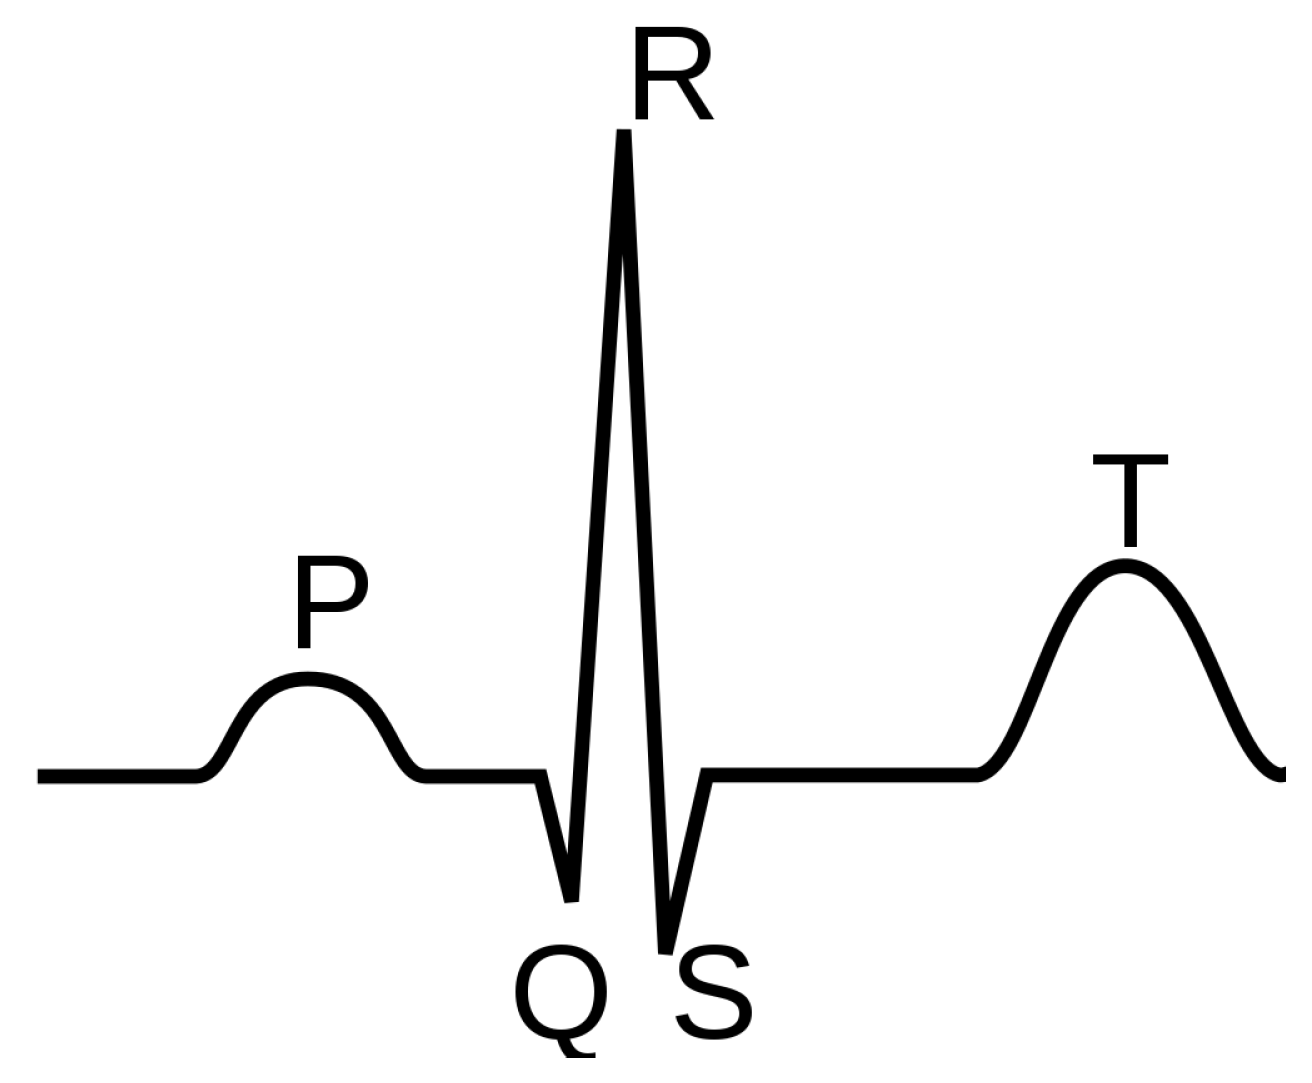
In this scientific work, we focus on Big Data analytics in cardiology. Data generated by electrocardiogram (ECG) signals observed in critical patients who are continuously monitored are an example of Big Data. In particular, by analysing ECG signals reporting the patient’s heart health status, our objective is to detect arrhythmias, i.e., problems with the rate or rhythm of the heartbeat. To this end, we choose to use the Menard algorithm and simplified relations for arrhythmias identification such as Tachycardia, Brachycardia, Asystole, etc. Specifically, the heart rhythm was calculated considering R-R intervals, i.e., the time elapsed between two successive R waves of the Q, R and S sequence of waves (that are referred with the term QRS complex) in the ECG.
We implemented such an algorithm considering Apache Spark, i.e., an open-source distributed general-purpose cluster-computing framework. Spark provides an interface for programming entire clusters with implicit data parallelism and fault tolerance. Spark facilitates the implementation of both iterative algorithms in parallel and interactive/exploratory data analysis. The choice to adopt Spark is motivated by the fact that applications can be reduced by several orders of magnitude compared to other alternative solutions such as Apache Hadoop MapReduce. We stress that the aim of this paper is to study a solution able to process ECG big data for arrthymia detection that can be deployed over either a private clinical or public Cloud. Consequent concerns regarding security and privacy during data transfer to/from the Cloud are out of the scope of this paper.
Experiments, were conducted considering a real case of study based on a dataset provided by the Physionet.org European ST-T Database that includes data used for the evaluation of algorithms analysing ST and T wave changes in ECG.
Experimental results show good response times and represent the bases for the development of future complex cardiology applications deployed over the Cloud.
This paper extends our previous scientific work [
1] providing additional methodological details and experimental results that allow to analyse the scalability of the system in the perspective of using big data sources.
The rest of the paper is organized as follows.
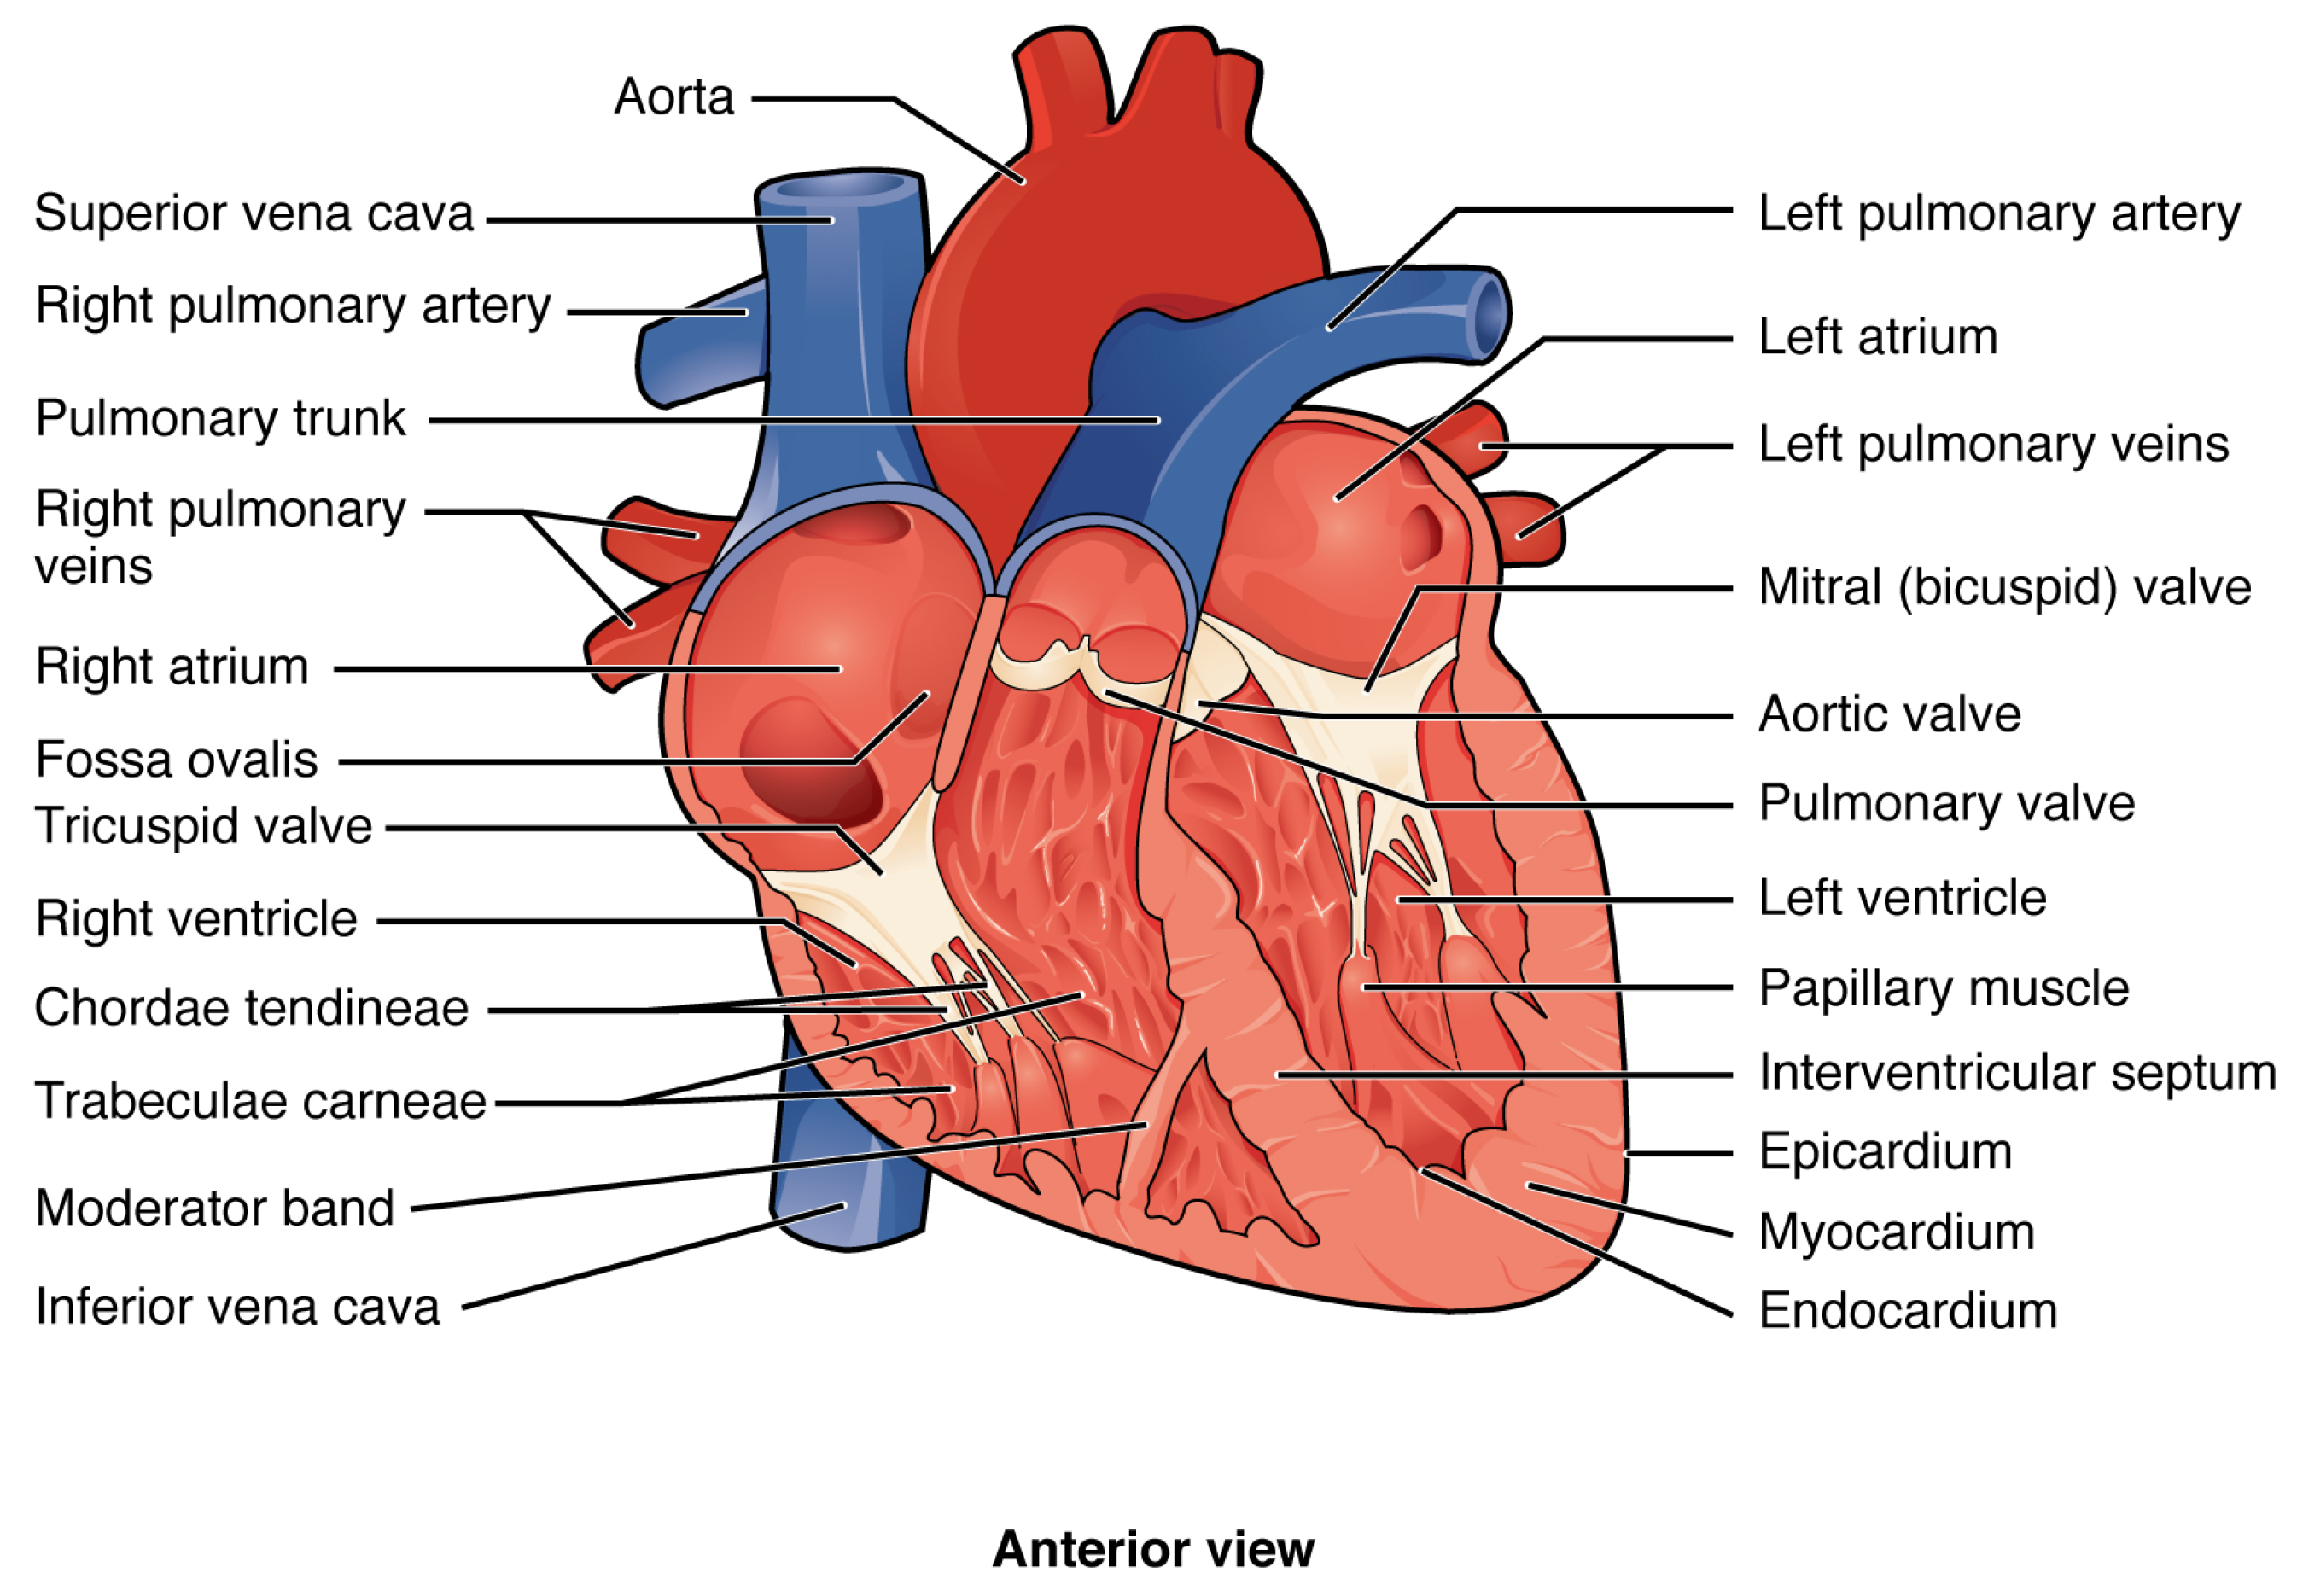
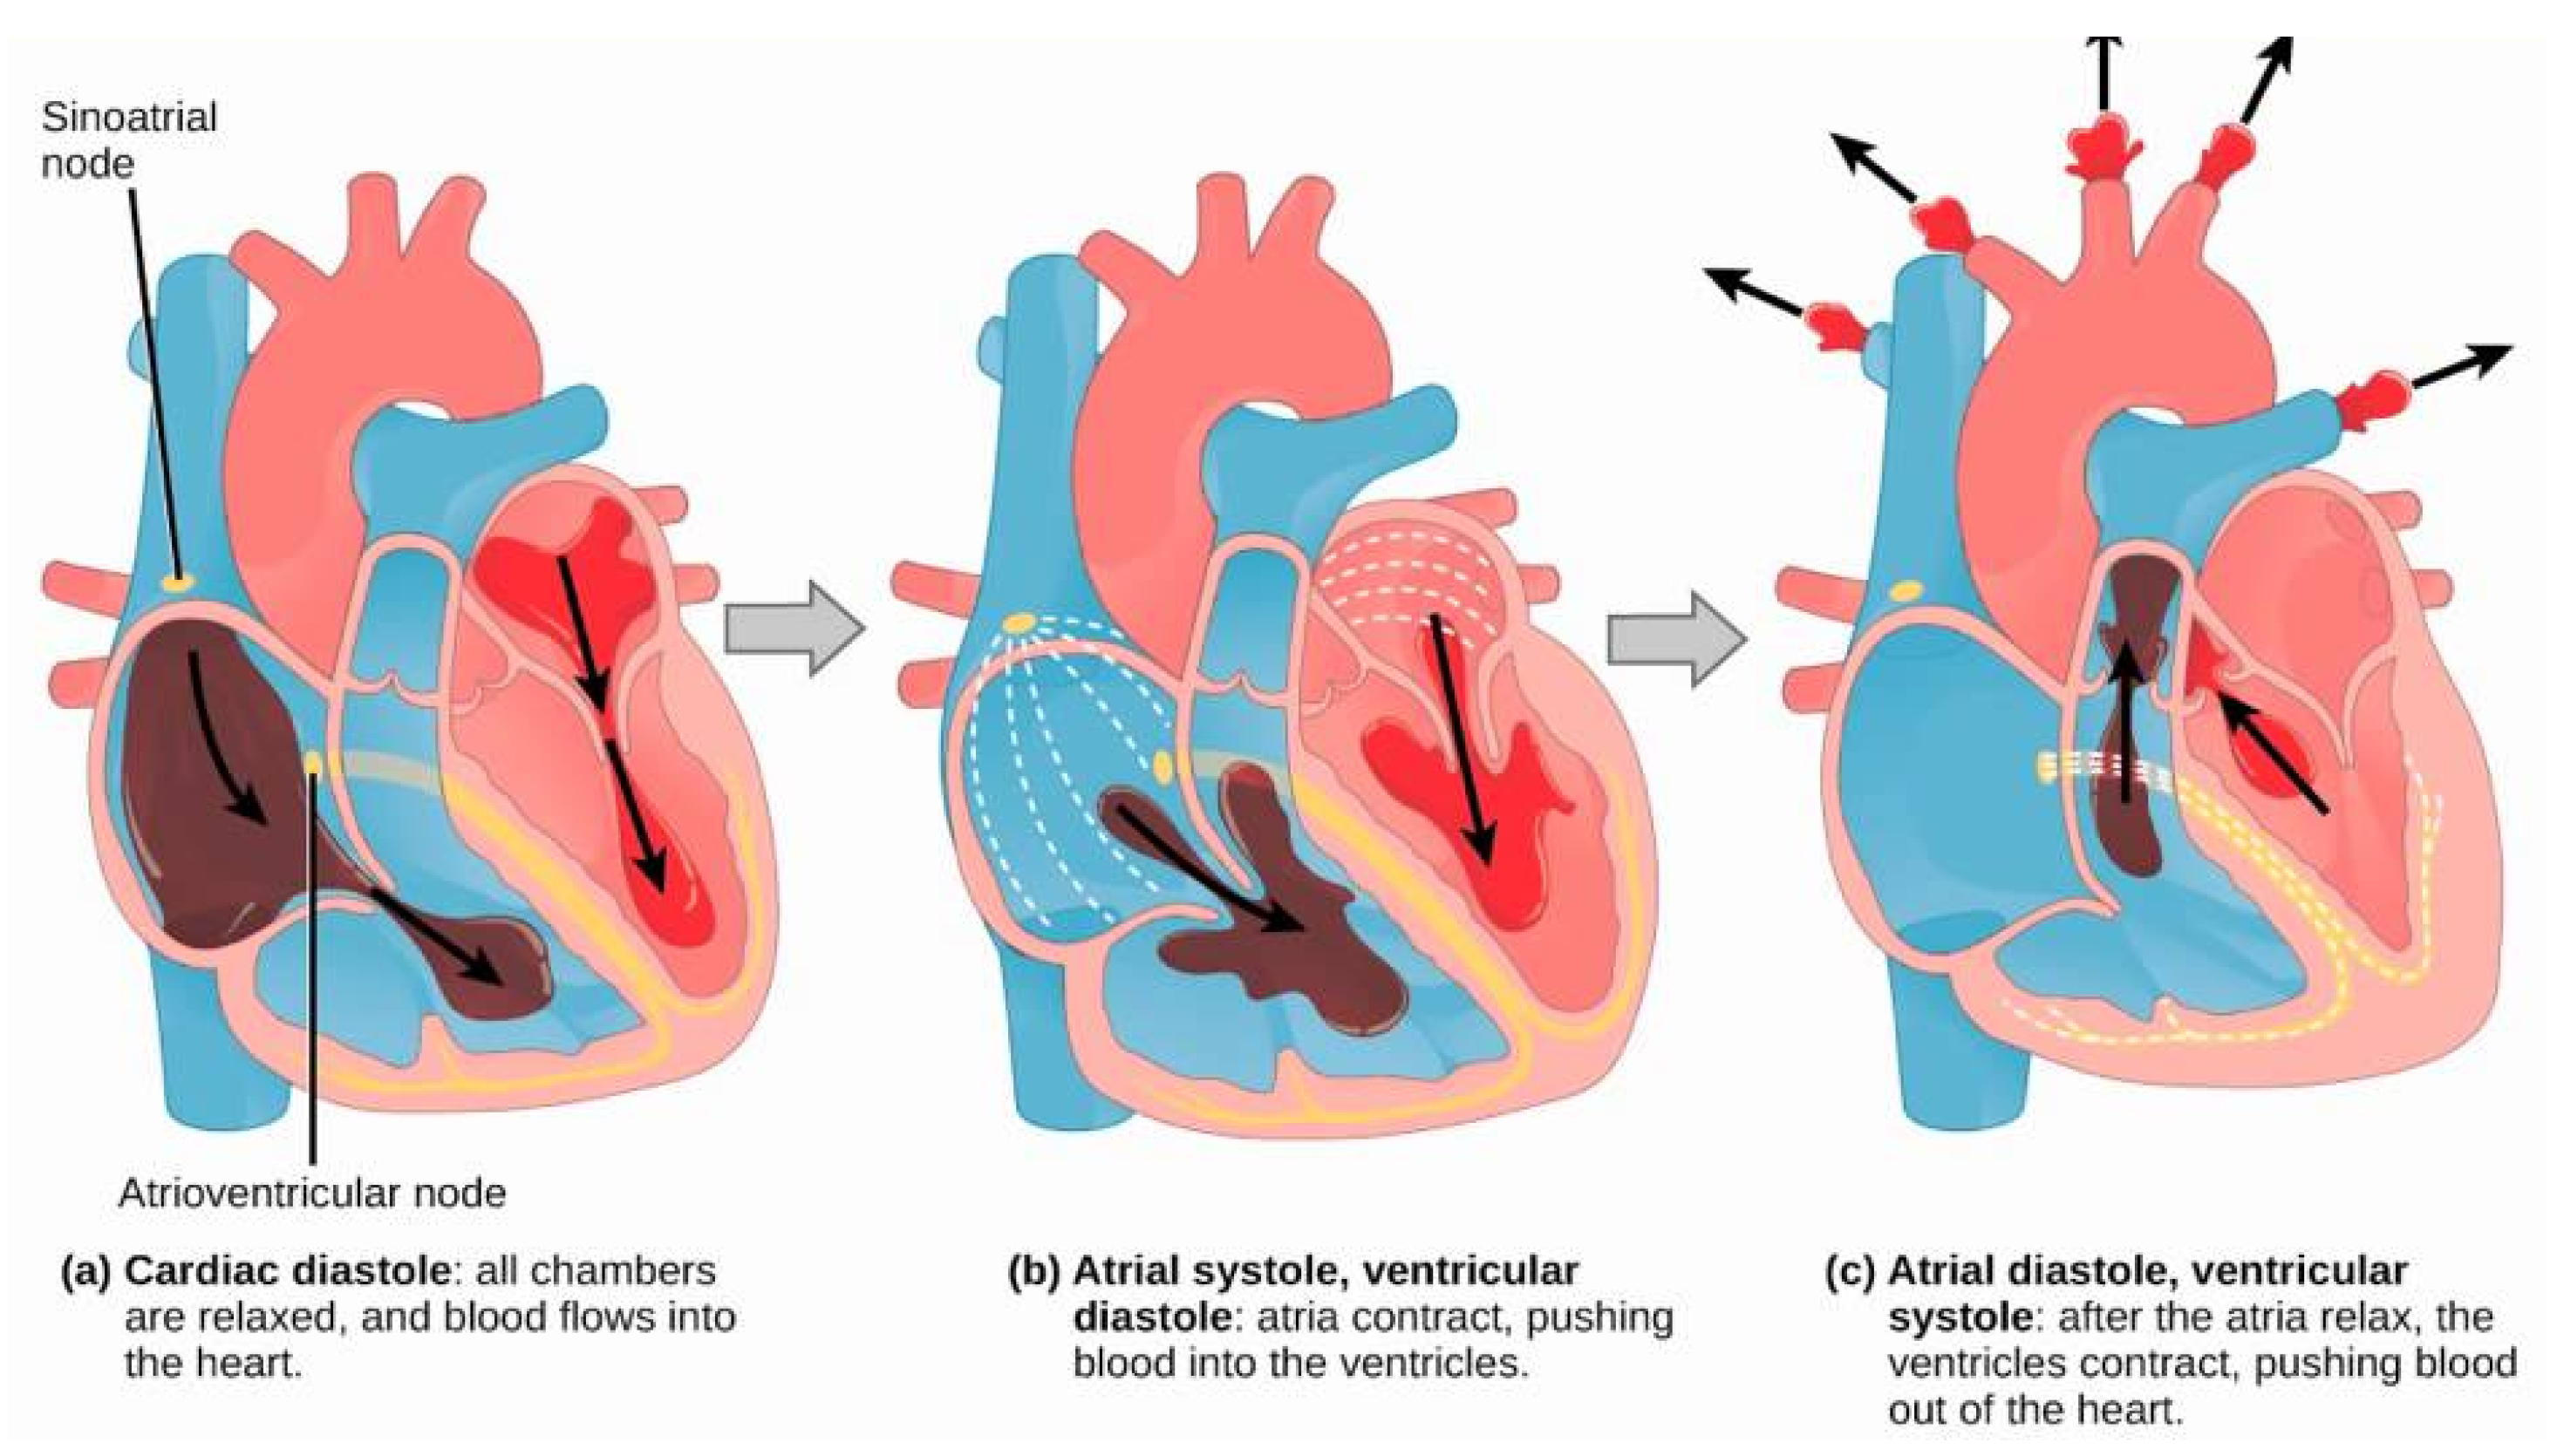
Section 2 provides a brief summary about the state of the art. Basic concepts regarding hearth physiognomy and ECG are discussed in
Section 3. The Menard algorithm and its parallel and distributed implementation by means of Spark is discussed in
Section 4. Extensions of the Menard algorithm allowing to detect arrhythmia are discussed in
Section 5. Experiments are discussed in
Section 6.
Section 7 concludes the paper with final considerations and light to the future.
2. Related Work
Many software solutions have been proposed up to now for the analysis of heart diseases. In this Section, in order to demonstrate the novelty of our research work, we provide a brief analysis of the state of the art.
Several initiatives available in literature use different algorithms for the analysis of ECG signals. The arrhythmia analysis requires the study of a ECG signals that can present noise. In order to address such an issue, an approach for detecting and eliminating five kinds of noises is discussed in [
2]. In particular, if a piece of signal does not present any important information and can not be repaired, it can be deleted and remaining pieces of signals are recombined. An automatic detection of P-wave in an ECG for the identification of arrhythmia is discussed in [
3]. Specifically, an improved method based on local distance transform, such as horizontal segments and rising or declining segment is proposed. Results prove the simplicity and efficiency of algorithms for transplanting to wearable medical devices whose processing ability is weak. A cardiovascular disease (CVD) detection algorithm is discussed in [
4]. Its input is represented by patients’ demographic data and several ECG signal features that are automatically extracted by means of signal processing methods. Signals are sent from ECG sensors attached to Android smartphones of patients. Such an algorithm runs within a web based system that can be used by patients to check their heart health status when required. A report generator software package that analyses routine cardiology laboratory exams is discussed in [
5]. Its main features are fast processing and easy access especially for non-computer experts. Case studies regarding nuclear cardiology, M-mode echocardiography and 24-h ambulatory electrocardiogram tapes reporting are analysed. A web-based Cardiology Web Picture Archiving and Communication System (PACS) is discussed in [
6]. Specifically, a Digital Imaging and Communications in Medicine (DICOM) case study is presented guaranteeing medical images availability and accessibility. An alternative web-based solution, i.e., Hydra that helps the cardiovascular diagnosis and treatment also allowing to carry out more accurate clinical results and reducing costs is discussed in [
7].
An approach using a cluster computing approach is the tele-ecg system [
8]. Big Data coming from ECG signals are processed in order to identify and monitor heart diseases. Specifically, a cluster adopting the Apache Spark framework is discussed. Data are classified using decision tree and random forest approaches.
Two simulators, i.e., HeartLab and EkgLab, that helps the electrocardiogram interpretation are discussed in [
9]. Specifically, requirements analysis, architectural design, patient modeling, programming language, implementation, and testing are discussed.
Recently, Cloud computing solutions have been used to develop arrhytmia detection services. An approach for transmitting data from several medical devices to Cloud storage is discussed in [
10]. In particular, the blueprint of a system able to collect health Big Data and manage them by means of a workflow is discussed. A Cloud-based system able to detect arrhythmia in real-rime was presented in [
11]. For reducing energy consumption in the mobile devices of a patients, lightweight tasks are processed locally, whereas the massive arrhythmia classification processing is moved over the Cloud. Experiments performed using data coming from the MIT-BIH arrhythmia database validated the efficiency and efficacy of the system. An alternative initiative for the processing and analysis of ECG Big Data is Cloudwave [
12].
In recent years, also machine learning techniques have been adopted for arrhytmia detection. A review of arrhythmia detection approaches of using MIT-BIH arrhythmia database is discussed in [
13]. Specifically, various techniques including neural networks and Support Vector Machine (SVM), etc are analysed also discussing next future challenges. An approach for the automatic classification of intracardiac electrograms (EGMs) is proposed in [
14]. Specifically, a compression-based similarity measure (CSM) approach is adopted that reduce processing times compared with other CSM approaches available in literature. Using Machine Learning, a set of EGMs extracted from the Scientific COOperation Platform (SCOOP) database was classified in seven cardiac arrhythmia classes and one noise class. The improved accuracy of results allows improving patient diagnosis. A method based on Logistic Regression Multinomial (LRM) able to provide a powerful and accurate insight into arrhythmia detection is discussed in [
15]. Specifically, LRM learns the posterior probability distributions of each class, in order to create knowledge-based system that helps to detect arrhythmia from Big Data sources. A high-precise arrhythmia detection method based on biorthogonal wavelets and fully connected neural networks is discussed in [
16]. Biorthogonal spline wavelet is applied for QRS complex detection. Specifically, in the first stage, signals are decomposed with the equivalent filters of a biorthogonal wavelet by Mallat algorithm. After that, threshold and slope methods are used for auxiliary monitoring of QRS complex. In the end, a fully connected neural network is proposed for arrhythmia detection.
From the analysis of literature of cardiology applications, we highlight that most researchers are looking at Cloud-based applications whose back-end makes use of parallel processing systems. The objective of this paper is to contribute to improve such a state of the art, by proposing a solution for arrhythma detection by means of the implementation of the Menard algorithm by means of the Apache Spark framework. Even though, this is a preliminary study, we stress that our solution is highly scalable, able to manage Big Data and easy to be deployed in Cloud systems for the development of advanced cardiology services.
4. Application Design
Several algorithms have been proposed so far to pick out and analyse the QRS complex. They can be classified according to their complexity and performance. In particular, most complex and efficient ones are based on particular mechanisms able to filter and elaborate ECG signals, whereas less complex ones are based on statistical thresholds. In this paper, we adopt the Menard algorithm based on the derivation of ECG signals according to the following equation:
After that, a
threshold of 70% of the maximum
value is chosen:
In the end, the algorithm adopts the following decision rule to detect the QRS complex:
In this paper, we implemented the Menard algorithm by means of Apache Spark. The dataset used in our experiments comes from the Physionet.org European. Specifically, our implementation stores signals acquired by a digitizer with sampling rate equal to
Hz. In order to process it, the file that includes the dataset was properly formatted. Accordingly, two preliminary phases were needed. Since we had to process multiple samples simultaneously, we needed to organize them on different lines because Apache Spark processes each of them as Resilient Distributed Datasets (RDD) strings. Moreover, Spark distributes the workload in tasks, each one processing multiple lines of the RDD. In fact, the Menard algorithm implementation performs the derivation through the Formula
1, which requires a continuous set of data. Actually, so as to determine the n-th element of the derivative, we needed to know the two previous and subsequent elements of the nth ECG signal. Therefore, we overlapped the content introducing row by row redundancy (i.e., the four values in the next row), except the last one. This allowed us to avoid information losing during the cluster distribution task. Moreover, during the source file formatting process, each line was indexed for tracking related samples.
In order to understand how many samples should form a RDD element and how many values should be placed in a row of the file, we considered that an electrocardiogram typically oscillates between −20 mv and 20 mv. Since the calculation of the Menard algorithm threshold could not take in consideration these variations using a large portion of signal, it could not be correct to detect heartbeat peaks. Therefore, we implemented a version of the algorithm with an adaptive threshold, which is calculated according to each specific sample block. Therefore, our implementation used a set of samples with a duration equal to 10 s. To this end, if we indicate with the sampling frequency of the ECG signal, all the file lines (except the last one) have , where 4 is due to the above mentioned overlap.
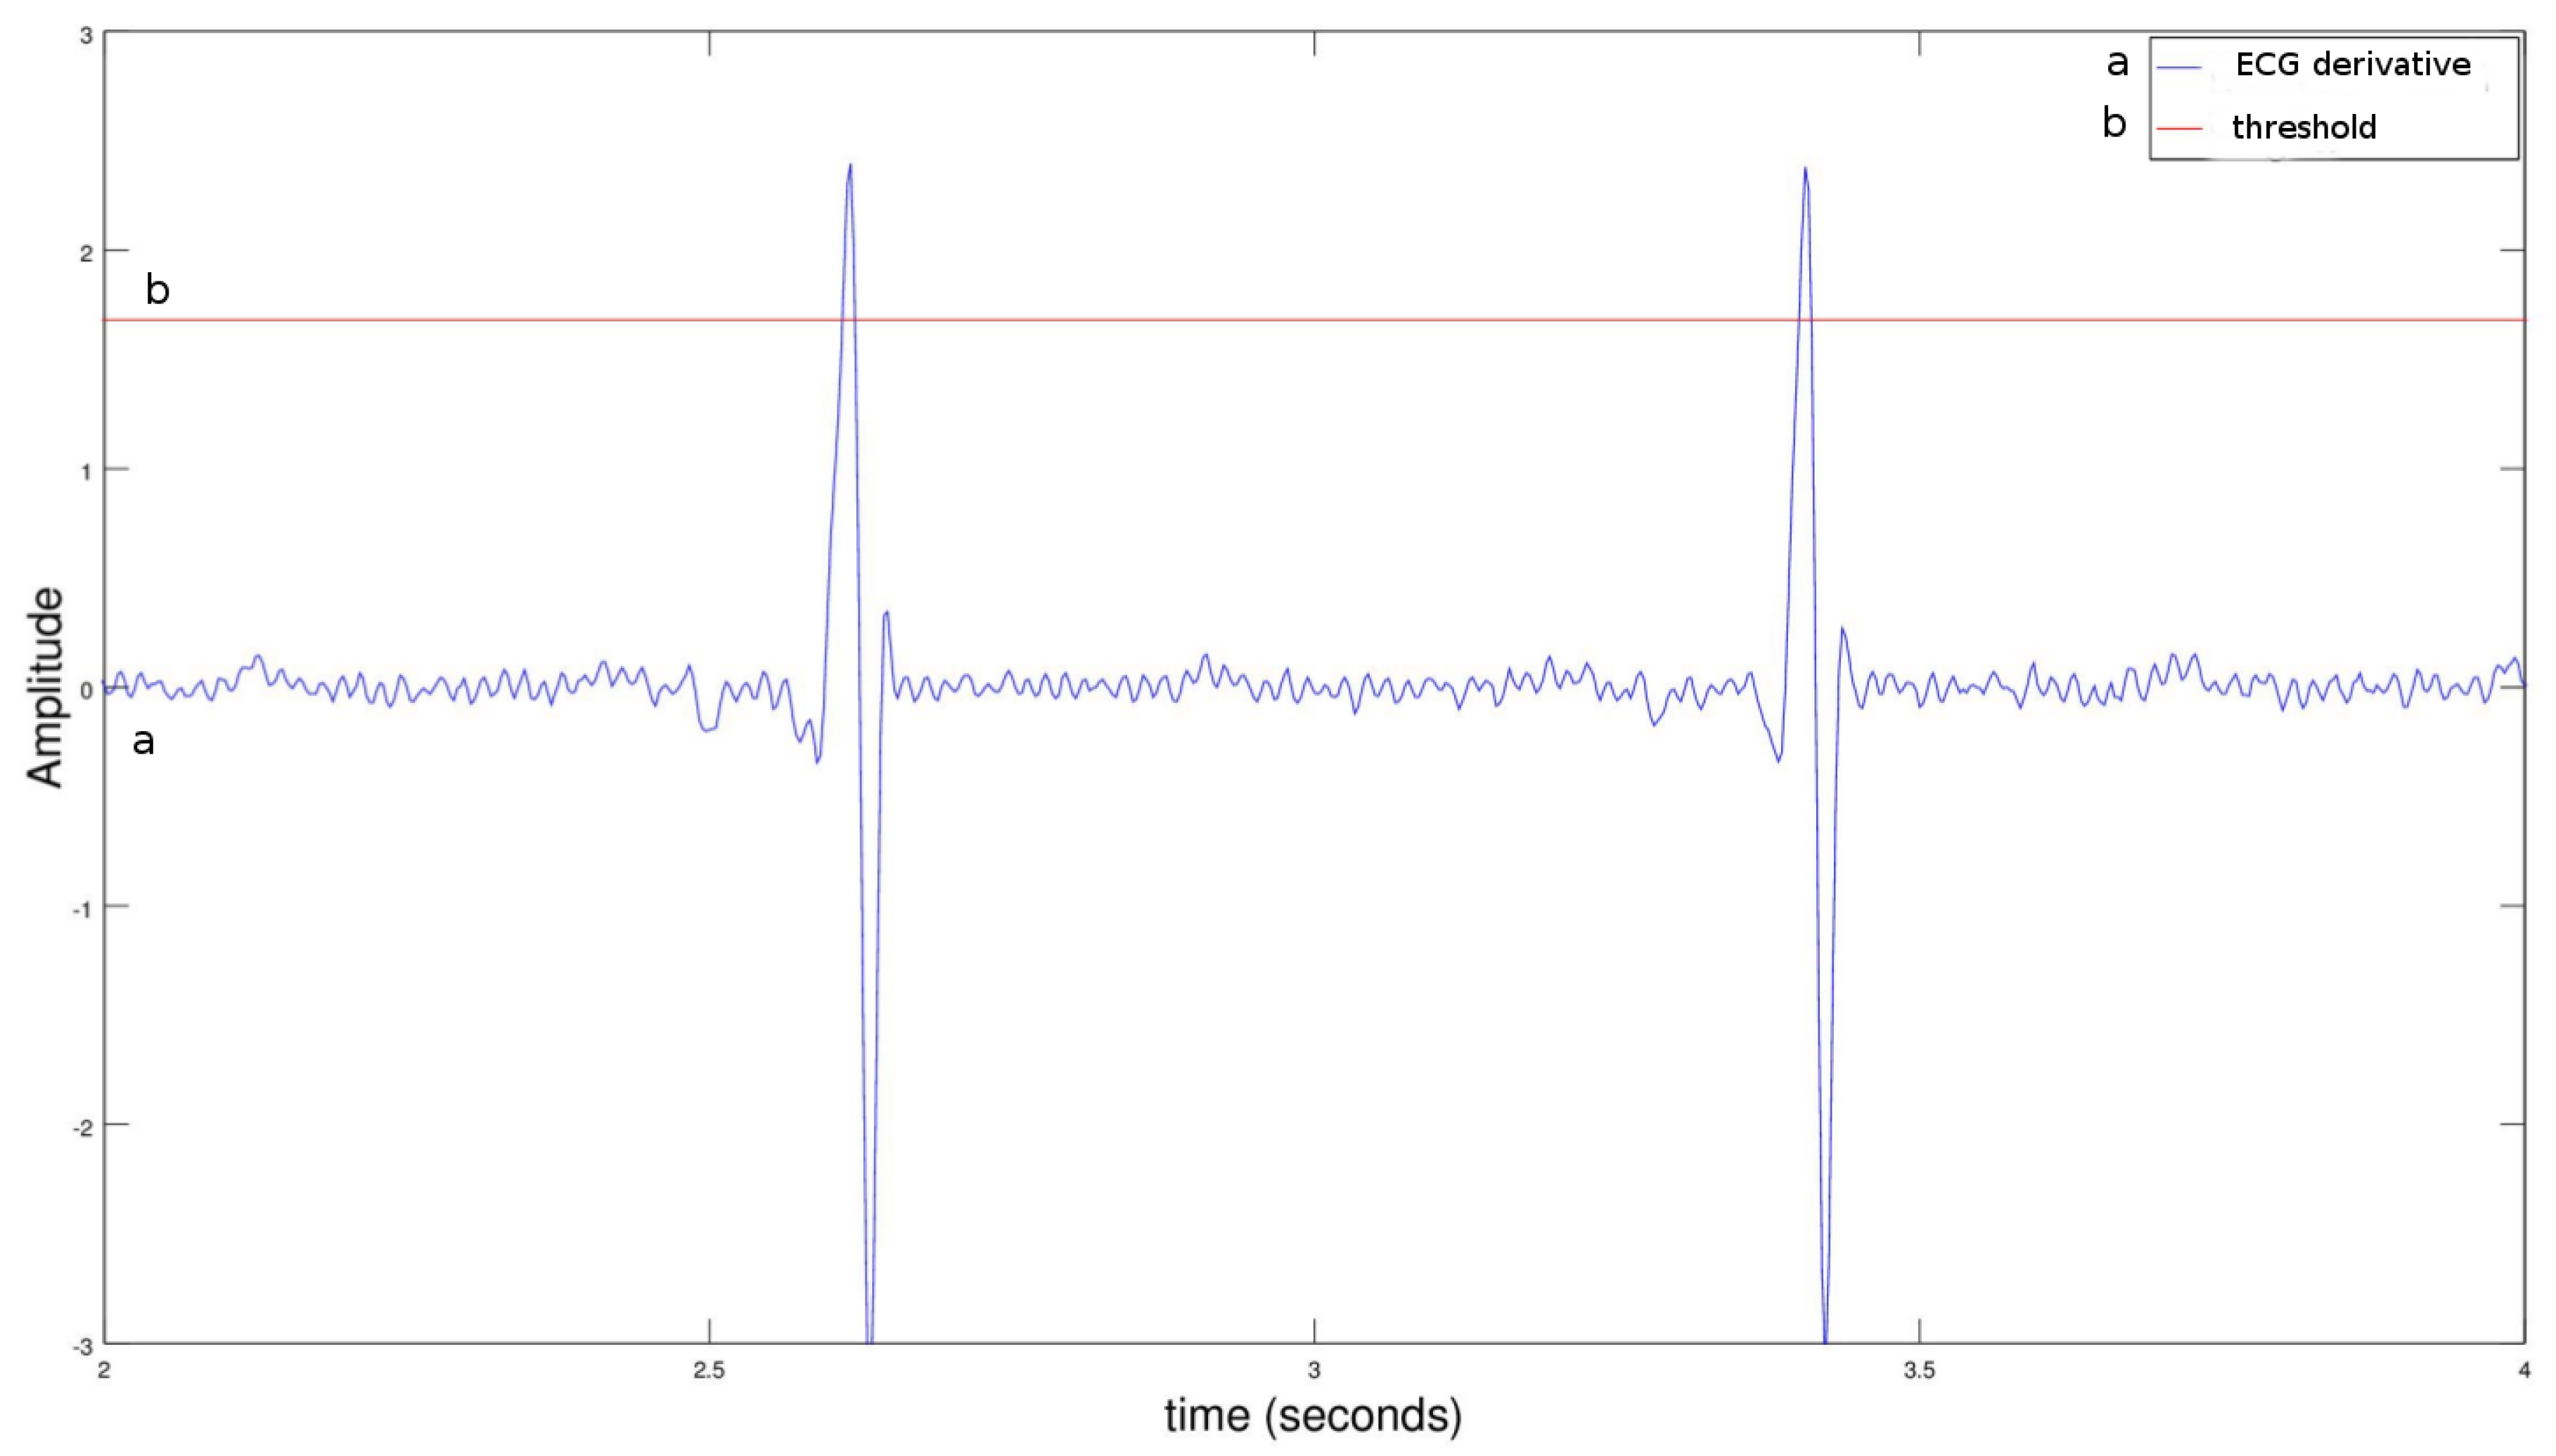
The only information required for calculating the QRS complex is represented by the detected peak index because, multiplying it by the sampling frequency reciprocal, it is useful to trace the beat time. Moreover, we had to determine which peak signals above the threshold may be considered a heartbeat. Actually, these values are more than one around a QRS complex. In order to simplify it, we chose the first value above the threshold.
Figure 4 shows the peak signals of an ECG derivative.
In order to distribute the RDD to the cluster’s nodes and create a list of elements on the driver, it was necessary to use the collect() method. This is the first action performed by the application. Indeed, up to this moment, we only talked about transformations. Therefore, the saveAsTextFile() method examines all the peaks’ RDD transformations in order to save it on a file.
What if the threshold values of a ECG signal section were between two blocks (or between two nodes)? Both the first index above the threshold of the first block and the first index above the threshold of the second block could be selected as peaks. The proposed solution requires that application knows the found values, and recognizes the extremely close peaks.


