Article

Information Needs and Visual Attention during Urban, Highly Automated Driving—An Investigation of Potential Influencing Factors

Chair of Ergonomics, Technical University of Munich, 85748 Garching, Germany
*
Author to whom correspondence should be addressed.
Information 2020, 11(2), 62; https://doi.org/10.3390/info11020062
Submission received: 15 December 2019 / Revised: 18 January 2020 / Accepted: 21 January 2020 / Published: 25 January 2020
(This article belongs to the Special Issue Automotive User Interfaces and Interactions in Automated Driving)

Abstract

:
During highly automated driving, the passenger is allowed to conduct non-driving related activities (NDRA) and no longer has to act as a fallback at the functional limits of the driving automation system. Previous research has shown that at lower levels of automation, passengers still wish to be informed about automated vehicle behavior to a certain extent. Due to the aim of the introduction of urban automated driving, which is characterized by high complexity, we investigated the information needs and visual attention of the passenger during urban, highly automated driving. Additionally, there was an investigation into the influence of the experience of automated driving and of NDRAs on these results. Forty participants took part in a driving simulator study. As well as the information presented on the human–machine interface (system status, navigation information, speed and speed limit), participants requested information about maneuvers, reasons for maneuvers, environmental settings and additional navigation data. Visual attention was significantly affected by the NDRA, while the experience of automated driving had no effect. Experience and NDRA showed no significant effect on the need for information. Differences in information needs seem to be due to the requirements of the individual passenger, rather than the investigated factors.

1. Introduction

Highly automated driving is advantageous compared to lower automation levels, since the driver becomes a passenger and no longer has to act as a fallback level at function limits [1]. As a result, safety-critical take-over scenarios [2], which occur in conditionally automated driving, may be avoidable. In highly automated driving mode, the passenger no longer has to perform any driving, monitoring or hedging tasks, which leads to a large number of possible non-driving related activities (NDRAs), ranging from passengers using smartphones to sleeping. NDRAs are thus regarded as one of the greatest benefits of automated driving [3]. However, previous publications have shown that the driver does not want to be completely excluded from the driving process in automated driving [4,5]. Therefore, the identification of desired driving-related information is indispensable to allow adequate human–machine interface (HMI) design. So far, studies investigating information needs have focused on highways as the operational design domain (ODD), and automation levels 1–3. However, urban areas are more complex than highways, due to a high number of static and dynamic objects [6], vulnerable road users [7], the diversity of road users and a high information density [8], which could lead to an increased need for information. Furthermore, participants in urban areas seem to have less trust in automated vehicles (AV) than on highways or rural roads [9]. Trust is known to be affected by the information given via the automated system [10]. Since previous research has mostly neglected this type of information need and the factors influencing such needs with regard to urban, highly automated driving, this work aims to close this research gap. In the context of this study, it will be investigated as to which information is needed in urban, highly automated driving, and how this is influenced by possible factors which could be taken into account in future HMI design.

1.1. Information Needs in Automated Driving

In manual driving, the focus is on driving-task-related information, whereas in automated driving, the focus is on information for system monitoring [11]. Moreover, not all drivers are immediately willing to hand over their safety to an AV [3]. The functional scope of an AV might not be obvious to a driver, and therefore vehicle maneuvers can lead to discomfort or a feeling of being at risk if those maneuvers are not communicated in advance by the system. This results in an increased need of the driver for information; e.g., upcoming maneuver or confidence level of the driving automation system [12]. So far, research has focused on partially automated and conditionally automated driving. During partially automated driving, the driver must continuously monitor the vehicle, while in conditionally automated driving mode the driver temporarily becomes a passenger and is allowed to conduct NDRAs. Only in the case of a request to intervene must the passenger reassume control of the driving task, in which case the passenger is given a sufficient time budget. Functionally, highly automated driving is very similar to conditionally automated driving, with the difference being that the driver does not necessarily have to take over the driving task, because the AV itself can conduct a minimal risk maneuver. As safety-critical takeover scenarios can thus be avoided, it is questionable whether information could be transferred completely from conditionally to highly automated driving [1].
For continuous monitoring during partially automated driving, information on system status, and on current and planned maneuvers should be communicated [13,14,15]. A study by [13], for example, showed that participants performing this monitoring task require information on driving maneuvers, system weaknesses, environmental information, driving maneuver announcements, the current driving maneuver, general vehicle information, direction information, current speed, navigation data and system status within the HMI concept. Reference [11] investigated the need for information for manual, partially automated and conditionally automated driving using the focus group method and a driving simulation study. The results for conditionally automated driving show that information on system status, current and planned maneuvers and objects detected in the environment were considered most important. According to [11], the current system status, system reliability, navigation data, current and planned maneuvers, current speed, speed limits and upcoming critical scenarios should be presented regardless of the automation level. Another study examined the information needs of truck drivers in conditionally automated driving [16]. Information on system status, system reliability, current and future maneuvers and environmental information were considered relevant. Reference [17] investigated what information passengers expected from highly and fully automated driving. Vehicle intentions related to hazardous scenarios, upcoming vehicle maneuvers, speed limits in speed restricted areas, whether it is safe to proceed, hazard detection and the ability to override or confirm vehicle actions in hazardous/uncertain scenarios were considered relevant. However, these information needs were not quantified and differentiated according to the level of automation. References [4,11,13,16,18] report a degree of certainty (uncertainty information) with which the automation can cope with the current scenario as relevant. Additionally, it has been reported that the remaining automated travel distance/time is important [11,19,20,21]. These information requirements have already been incorporated into the HMI design for partially and conditionally automated driving in numerous studies (e.g., [12,14,22,23,24]).

1.2. Potential Influencing Factors

1.2.1. Experience

Online surveys showed a high variance in the population in terms of interest in and knowledge of automated driving [25]. Therefore, passengers of an AV must be at the center of development to create confidence for the passenger and adaption to the human mental model [25]. Mental models are considered the cognitive-emotional representation of a system. They describe the idea people have of the system and of its functionalities, and can thus serve as a basis for human interaction with the technical system. The mental model is based on experiences of the system [4,26]. While investigating a collision warning system, reference [27] found that an experience had an influence on handling and trust-building. A driving simulation study by [11] showed that, due to the mental model, the need for information could depend on experience and individual trust. Users may need less information the longer they use the AV [11]. Reference [28] reported that early users without experience needed to be persuaded of the error-free system functionalities by having information displayed. This helps the driver to understand that the system is operating safely and responsibly. In [5], participants reported needing less information after a period of familiarization than they did when first using the AV.

1.2.2. NDRAs

The possibility of engaging in a NDRA was found to be one of the most valued benefits of AVs [3]. Studies by [29,30] have shown that passengers driving in automated mode watch videos, observe the traffic environment, use smartphones, read, write, talk to passengers or sleep. Because resources for visual input are limited, there is a significant interference between two activities that use the same resource, which could lead to lower performance in tasks using the same resource in a parallel manner. Therefore, particular NDRAs, such as watching videos, in which visual cognitive binding occurs, result in a reduced perceptibility of vehicle behavior, since information can no longer be perceived directly from continuous monitoring, which in turn could influence the need for information. Reference [11] stated that the decreasing need for information shows a contrary trend to the demand for NDRA. For example, reference [11] found differences in information needs between partially and conditionally automated driving. This could be due to the occupants’ different responsibilities according to the level of automation or to the use of an NDRA during conditionally automated driving compared to no NDRA during partially automated driving. A further result showed that when performing an NDRA during conditionally automated driving, the control glances on the instrument cluster decreased and thus less information is received from this interface [11].

2. Objectives

Previous studies have already investigated information needs during automated driving. However, these studies mainly used automation levels 1–3 in a highway ODD. In contrast, this study examines how highly automated driving (SAE level 4) [1] affects information needs when the driver is no longer required to control functional limits of the vehicle. Furthermore, we defined urban areas to be the ODD. These are characterized by a high degree of complexity, which we expected to influence the needs for information. The identified potential factors influencing the need for information led to the following research questions (RQ1 and RQ2). Since, according to [16], the driving scenario can have an influence on the need for information, various scenarios were selected in order not to distort the results by a single scenario. The different driving scenarios led to an additional explorative research question (RQ3).
  • RQ1: How do experience and NDRAs influence visual attention?
  • RQ2: How do experience and NDRAs influence information needs?
  • RQ3 (Explorative): What information do passengers need in different driving scenarios in highly automated urban driving, if there are no functional limits?

3. Methods

3.1. Sample

Forty participants took part in this experiment, 16 of whom were classified as having experience in the field of automated driving (experience). Mean (M) age of the experienced group was 26.5 years (SD = 2.2 years), and that of the inexperienced group was 27.6 years (SD = 11.2 years). The experienced group consisted of 12 (75%) men and four (25%) women, while the inexperienced group consisted of 17 (71%) men and seven (29%) women. Table 1 gives an overview of characteristic differences for the experienced and inexperienced drivers with regard to automated driving.

3.2. Experimental Design and Measures

We used a 2 × 2 × 7 factorial design for this experiment. Experience in the field of automated driving (experience) and NDRAs (with or without) were the between-subject factors, whilst driving scenario (scenario) was a within-subject factor (see Table 2). Participants working in the field of research and development of automated driving were classified as having experience. The professional background was used for classification, as this influences the level of knowledge and experience with studies on automated driving, and thus the mental model [26]. Half of the participants who were classified as experienced or non-experienced received an NDRA. Each participant experienced all seven urban driving scenarios during the highly automated drive. Several scenarios were investigated in order not to distort the results by a single scenario because of the potential influence of the scenario on the need for information [16].
Subjective data were collected using questionnaires. Questionnaires used a mix of closed and open questions. The completion of each driving scenario was followed by a intermediate survey. Participants rated the information presented in the HMI on a 7-point Likert scale (ranging from “not important at all” to “very important”) for the actual scenario. In the second part of the intermediate survey, participants had the option of adding any information they would have liked for this specific scenario.
We used eye-tracking to obtain objective data based on the gaze behavior to investigate whether the information needs were also manifested in the gaze and associated scanning behavior. Gaze behavior was operationalized by calculating the area of interest (AOI) attention ratio, which was defined as the percentage of time participants spent looking at an AOI while driving in highly automated mode [31]. The instrument cluster and the windshield were considered AOIs (see Figure 1).

3.3. Apparatus

3.3.1. Driving Simulator

The experiment was carried out in the static driving simulator of the Chair of Ergonomics at the Technical University of Munich [32]. The simulator consisted of a BMW E64 vehicle mock-up. Three connected screens provided a 180° front view and three additional screens provided a view of the rear and side mirrors. SILAB 5.1 of the Würzburg Institute for Traffic Sciences GmbH, having a refresh rate of 60 Hz, served as driving simulation software [33]. The highly automated driving function must be activated via a button on the steering wheel. The automated driving system could be overridden anytime by pressing the same button or by activating the brake or accelerator. An additional sound system provided vehicle and environmental sounds. Three stationary cameras with an infrared light source of the remote eye-tracking system SmartEye were installed in the vehicle interior and recorded data at a frequency of 60 Hz [34].

3.3.2. Human–Machine Interface Design

In this study, a basic HMI was used to avoid confronting the participants with a flood of information. This should not have influenced the participants in terms of them listing additional information they might have desired. Information content displayed on the HMI was selected on basis of the literature cited in Section 1.1. It comprised the system status for the automation (on/off), navigation information, the current speed of the vehicle and the current speed limit. Several publications (see Section 1.1) also mention that a degree of certainty with which the automation can cope with the current scenario should be displayed. However, since this study addresses highly automated driving and the driver does not have to serve as a fallback [1], the authors consider this information to be unnecessary for the use-cases investigated in this study. The remaining automated travel time was also omitted from the HMI. Since there were no requests to intervene, the remaining time would have informed the participants about the length of the driving scenario—something we wanted to avoid. The four selected pieces of information were presented to the passenger on a freely programmable instrument cluster. A blue icon on the instrument cluster (taken from [6]) displayed the active automation system status, as did a blue LED strip at the bottom of the windshield (see Figure 2). References [14,35,36,37,38] suggest displaying the system status additionally using a LED strip. The color blue can be perceived very well peripherally [39] and has been used in previous studies for indicating conditionally or highly automated driving [37,40,41].

3.3.3. Experimental Track

After one minute of manual driving, the highly automated driving system became available for a 14 min automated drive. In these 14 min of automated driving, the participants passed through seven different urban driving scenarios characteristic of city traffic. According to the pilot scenarios in the project @CITY [42], these scenarios consisted of intersections, bottlenecks on urban roads, other vehicles and vulnerable road users being encountered and upper speed limits of 30 or 50 km/h. The passenger was not required to take control of the vehicle during the automated drive. The participants experienced the scenarios in permutated order to avoid sequential effects in the results of the survey on information needs. In all scenarios, system status, current speed and current speed limit were displayed in the HMI. Navigation information was displayed in all scenarios except Scenarios 3 and 5 (green arrow in Figure 2b), since there were no road junctions within the scenario or following the scenario. A detailed overview of the seven scenarios is shown in Table 3.

3.3.4. Non-Driving Related Activity

By way of an NDRA, half of the participants were offered the option of watching a movie on a 9.6 inch tablet mounted in front of the central information display, as this is a frequently requested and performed NDRA during automated driving [29,30]. This cognitive, visual NDRA has already been used in previous studies [43,44,45]. This NDRA has the advantages of being easy to interrupt and being able to be carried out successfully with little practice. Therefore, it can be assumed that differences in the cognitive visual binding due to learning effects can be reduced by choosing this NDRA.

3.4. Procedure

The total duration of the experiment was 60 min. After welcoming the participants, they had to read and sign a declaration of consent and safety instructions. Subsequently, the participants received information about the experimental procedure and filled out a demographic questionnaire. Participants then entered the driving simulator and adjusted the seat, side mirrors, rear mirror and steering wheel. Participants then received instructions on the driving automation system and its capabilities; the HMI concept; and if used, the NDRA. After clarifying any queries, a seven-minute familiarization drive was started, consisting of a manual and an automated driving phase. After the familiarization drive, the SmartEye eye-tracking system was calibrated. During the experimental drive, the driving simulation was interrupted after each driving scenario. The simulation environment was frozen in order to carry out the survey on information needs. This methodology has been shown not to affect normal behavior of the participants during the study, but at the same time the results are not limited by human memory [46].

4. Results

4.1. Statistical Analysis

Eye-tracking data were analyzed using the Mann–Whitney test for the main effects—experience and NDRA—due to the violation of the normality distribution and equality of variances. These assumptions were checked by applying the Shapiro–Wilk test and Levene’s test. The ordinal data concerning the rating of the presented information were also analyzed for differences between the factors experience and NDRA using the Mann–Whitney test. A significance level of α = 0.05 was initially applied. When differences of one factor were analyzed by multiple comparison (AOIs: instrument cluster and windshield; presented information: system status, navigation information, speed and speed limit) a Bonferroni–Holm correction [47] was applied. The adjusted significance levels αHolm are reported as part of the test statistic. We classified the effect sizes by interpreting the Pearson r correlation using Cohen’s benchmark [48]. The explorative results of additional requested information in the intermediate survey were clustered according to information categories based on Section 1.1 and compared descriptively. Data preparation was done using MATLAB and MS Excel. JASP was used for the statistical analysis.

4.2. Eye-Tracking Data

In the analysis of the eye-tracking data, only the AOIs instrument cluster and windshield were considered. The predefined AOI tablet (NDRA group) was not considered due to a data availability of less than 70% for this AOI, which would have led to the exclusion of participants [31].
The statistical analysis of the attention ratio on the instrument cluster (U = 181.0, p = 0.774, αHolm = 0.025) and windshield (U = 193.0, p = 0.989, αHolm = 0.05) revealed no significant difference between the experienced and inexperienced group. Participants who were offered an NDRA spent significantly less time looking at the windshield compared to participants with no NDRA (U = 384.0, p < 0.001, r = 0.92, αHolm = 0.025). Nevertheless, NDRA had no significant effect on the attention ratio on the instrument cluster (U = 258.0, p = 0.121, αHolm = 0.05). Table 4 shows the mean value and standard deviation of the attention ratio on the AOIs instrument cluster and windshield for the between-subject factors experience and NDRA.
Results of the attention ratio for the within-subject factor scenario are given in Table 5. On a descriptive level, the attention ratio on the instrument cluster and the attention ratio on the windshield show differences for the different scenarios. For example, the participants spent only 5.5% in Scenario S7 compared to 7.1% in Scenario S2 of the visual attention rate on the instrument cluster. In Scenarios S3 and S4, participants spent 57.5% and 57.3% of the visual attention rate on the windshield, while in Scenario S1 it was only 50.7%.

4.3. Subjective Data

Scenario S7 was excluded from the analysis of the rating of the presented information categories system status, navigation information, speed and speed limit. Most participants did not perceive this as the current scenario and related their rating to a maneuver before this scenario. This could be assumed on the basis of the additional information requested and the follow-up talk. In the experimental drive, navigation information was presented for the Scenarios S1, S2, S4 and S6. Therefore, no rating of the navigation information exists for Scenarios S3 and S5.
Table 6 presents the median (Mdn) of the rated information for the between-subject factors experience and NDRA. The rating of the information system status (U = 124.5, p = 0.062, αHolm = 0.0125), navigation information (U = 211.0, p = 0.609, αHolm = 0.0125), current speed (U = 260.0, p = 0.062, αHolm = 0.0125) and speed limit (U = 260.0, p = 0.062, αHolm = 0.0125) showed no significant difference between experienced and inexperienced participants. Nevertheless, there is a descriptive tendency for inexperienced participants to rate navigation information, speed and speed limit as more important than experienced participants, while experienced participants rate the system status as more important. The factor NDRA revealed no significant difference for the pieces of information system status (U = 179.5, p = 0.585, αHolm = 0.0125), navigation information (U = 244.0, p = 0.238, αHolm = 0.0125), current speed (U = 244.0, p = 0.239, αHolm = 0.0125) and speed limit (U = 243.0, p = 0.250, αHolm = 0.0125).
The results of the rated information categories system status, navigation information, current speed and speed limit for the within-subject factor scenario are shown in Table 7. The information rating shows differences for the scenarios comparing the median values of the information categories system status (Δmax Mdn = 1), navigation information (Δmax Mdn = 2), current speed (Δmax Mdn = 1) and speed limit (Δmax Mdn = 1). Considering the subjective ratings on a descriptive level, it seems that system status is most important and that speed limit is the least important over all scenarios, if one considers the value of the median.
Furthermore, the rating of the information categories system status (interquartile differences: 3–4), navigation information (interquartile differences: 3–3.25), current speed (interquartile differences: 3–5) and speed limit (interquartile differences: 2.25–4) show high interquartile differences for each scenario.
The additional requested information was thematically clustered. The results were the information categories maneuver, maneuver reason, environmental information and navigation data. Six requests were for no information, and could not be assigned to an information category (e.g., warnings should be communicated auditorily). The difference between the information categories “maneuver reason” and “environmental information” is as follows: As soon as environmental information, such as another vehicle, has a direct influence on the maneuver, it is classified in the maneuver reason category. In Scenario S4, for example, it was mentioned as maneuver information that information should be provided about the planned lane change to the left. The detected roadworks in the vehicle’s lane were requested as maneuver reason information. The information about current traffic signs was included as environmental information. No navigation data was requested in this scenario. Independent of the scenario, a digital map of the intersections was named as the main navigation data. Three participants also indicated in the navigation data that they would like to be informed about the distance or time until arrival. Figure 3 shows the results of the additional requested information for the defined information categories, depending on the driving scenario. In total, participants requested 103 pieces of information on maneuvers, 43 on maneuver reasons, 20 pieces of environmental information and eleven pieces of navigation data information. The number of pieces of requested information showed differences depending on the scenario.

5. Discussion

5.1. Visual Attention

Participants with and without experience showed no significant difference in visual attention. Therefore, they used the information provided on the instrument cluster and observed the environment via the windshield to the same extent. Participants who were distracted by NDRA also showed the same visual attention to the instrument cluster as those without this distraction, and hence, requested the same amount of information. It could be argued that, if participants considered information important, they retrieved it from the instrument cluster, regardless of the NDRA. This is contradictory to [11], which revealed less control glances when performing a NDRA. In [11], however, the NDRA was a cloze test, which has a lower interruptibility compared to the videos used in our study, because the audio of the video is perceptible even if your eyes are not on the tablet. Furthermore, in [11] control glances were glances on the instrument cluster and on the mirrors which could lead to different results. The visual distraction of the NDRA resulted in a reduced visual attention on the windshield. It can therefore be assumed that the group of participants without an NDRA watched the traffic and the surroundings more closely and were less distracted without an NDRA. However, in this case it cannot be ruled out that mind-wandering occurred for the participants without the NDRA, and they created a new NDRA by thinking about things without situational reference. On a descriptive level, visual attention seems also to be influenced by the individual scenarios. This could be due to the information density and complexity of the scenarios. Differences regarding attention ratio on the AOI instrument cluster could result from the presented information which could help to better understand the behavior of the AV; e.g., navigation information in Scenarios S1 and S2 (see Section 5.2).

5.2. Need for Information

There was no significant difference concerning the rating of information available on the HMI between participants who conducted NDRA and those who did not. Participants who were visually distracted by the NDRA wanted to have the same amount of information provided on the instrument cluster. The NDRA selected in this experiment could be interrupted very easily. Therefore, it cannot be excluded that the information needs of other NDRAs may change, and this phenomenon requires a separate investigation on the need for information. Moreover, experience showed no significant influence on the need for information. Contrary to what [11] assumed, the need for information did not decrease with more experience. However, there was a descriptive tendency that experienced participants rated the system status higher than the other driving related information on the HMI, while inexperienced participants rated navigation and speed information higher than the system status. This may be due to the mental models of the participants. Thus, inexperienced participants know about this information from their own vehicle, while information on system availability and its relevance is hardly known. Experienced participants were classified according to their professional context and expert status. Despite the high number of driving simulation studies on automated driving in this group compared to the inexperienced group, this cannot necessarily be equated with regular use of automated driving. For example, the number of simulated automated drives made directly in the last month was not recorded. It is therefore possible that the influence of experience on the need for information only occurs in the sense of long-term effects, by getting used to the functionalities over the course of four weeks or longer [49]. Another explanation could be that experts are not the same as laypersons with experience. Reference [11] assumed that participants needed more information in the beginning of using AVs due to a lack of trust in these systems. After experiencing a system and its reliability for a while, trust could increase, and consequently, information needs regarding transparency might decrease. As experts in this study were mostly researchers, they might have known what kind of information is considered important in scientific literature. Therefore, they do not desire less information as they have their experience from studies and not from frequent, ordinary usage. Future research should investigate whether information needs decrease after laypersons experience the same system multiple times.
The scenarios seem to influence the rating of the information and the additional information added by the participants. Thus, the interpretation of the presented information should in future be scenario-specific (see also [16]). Since the Scenario S7 was not perceived by most of the participants and was therefore not evaluated, it can be concluded that the need for information in this scenario was very low. When evaluating the information displayed, the system status was classified as important information across all scenarios. This confirms the results from the literature (Section 1.1). The navigation information and current speed were also rated as important. The navigation information became most important in S1, where at a complex intersection the turning maneuver could be predicted better by the navigation information. The evaluation of speed information showed this measure lost most relevance in case of scenarios resulting in low speed leading up to a short standstill (S1 and S5). Speed restrictions were considered to be the least important information on the HMI in low speed scenarios (S1, S3, S5). In addition, the rating of all information showed high interquartile differences across all scenarios. While no influence for the subject factors experience and NDRA was found, it can be argued that the individual passengers exhibit great differences in information requirements. Consequently, that cannot be attributed to the manipulated factors and adaptive approaches to HMI design that meet these interindividual requirements might be indicated.
With regard to the additional information added by the participants, the information category maneuver reason was mentioned most frequently across all scenarios. This corresponds to the findings outlined in Section 1.1. According to [10], it is important for the driver to understand how decisions of an automated system are made, which may lead to increased trust, which in turn may improve adoption of AVs [50]. Although passengers did not have to monitor the driving automation system and to take over control of the vehicle, participants often asked for information about the maneuver. It should be emphasized that, especially in scenarios when there were several options available, regarding how the vehicle would act in the future, e.g., S1, S3 and S5 (turning left with oncoming traffic, following a cyclist and passing a bottleneck), an increased need for the maneuver information was expressed. With regard to the additional environmental information requested, it is noticeable that a high number of mentions in this information category came up in Scenario S4. This could be explained by the presence of two lanes, and therefore an overview of the environment was important for the automated lane change to the left (e.g., lane free/occupied). In Scenario S6, a higher number of pieces of navigation data was required. This could be due to the fact that there was a large intersection after the action of following the front vehicle. Therefore, participants wanted to have an overview of this intersection. In the context of the navigation data, a display of the remaining automated travel time/distance was mentioned only three times, and, in contrast to the literature [11,19,20,21], had only a subordinate role. On the one hand, this may be due to the fact that there were no interruptions due to requests to intervene, and, on the other hand, no free NDRAs were offered which might have required better planning via the remaining time. As assumed by the authors, the degree of certainty with which the automation can cope with the current scenario seems not to be relevant when no request to intervene occurs, since this type of information was not reported by the participants. With regard to the design of the questionnaire, participants without experience stated that they lacked creativity in the open question. In contrast to the experienced group, the inexperienced group also exhibited this, as shown by the lower number of additional pieces of information desired.

5.3. Further Limitations

The generalization of the results could be limited due to the following aspects. Although we used a high-fidality driving simulator that ensured a high level of immersion, it cannot be excluded that the participants showed different gaze behavior and need for information than they would have in a naturalistic automated driving experiment. The sample in this study was not representative due to a low average age and a low proportion of women. This limits the transferability of the results to the overall population. We expected the sample to be more open-minded to technical applications regarding automated driving due to high proportion of participants studying or working at the Technical University of Munich. In the future, influences on the attention ratio and the need for information in the context of automated driving should be assessed with a more diverse sample. The small sample size of 40 participants with two between-subject factors could have resulted in significant effects not being identified. For a more accurate assessment, a larger sample would be necessary in the future.

6. Conclusions

The results of this study showed no influence of the factor experience on visual attention. In contrast, the visual attention regarding the AOI windshield was influenced by the factor NDRA, while no influence from the factor experience on the attention ratio regarding the AOI instrument cluster was found. Since experience or engagement in NDRA had no influence on the need for information regarding the rated information in the HMI, information about the system status, navigation information, speed and speed limit should be displayed in the HMI regardless of the experience or engagement in NDRA of the passenger. In contrast, there is potential to present this information adapted to the automated driving scenario. Depending on the scenario, further information on the planned and current maneuvers and the reasons for them, and environmental information and additional navigation data should be provided in the HMI of a vehicle that has the capability to drive highly automated in urban areas. Based on these results, individually adaptable HMIs should be tested to allow adaptation to inter-individual differences of the passengers. In particular, the high density of information in urban areas could result in a flood of information in the individual scenarios. In future studies, it should therefore be investigated how this amount of information can be communicated to the passengers without notifying them too often or in a distracting way, since this may be perceived as annoying due to the NDRA being interrupted [12].

Author Contributions

Conceptualization, A.F. and K.B.; methodology, A.F.; software, A.F. and S.S.; validation, A.F.; formal analysis, A.F. and S.S.; investigation, A.F. and S.S.; resources, A.F.; data curation, A.F.; writing—original draft preparation, A.F. and S.D.; writing—review and editing, A.F. and S.D.; visualization, A.F.; supervision, K.B. All authors have read and agreed to the published version of the manuscript.

Funding

This research was funded by German Federal Ministry of Economics and Energy within the project @CITY-AF: Automated Cars and Intelligent Traffic in the City, grant number 19A18003N. The author is solely responsible for the content.

Conflicts of Interest

The authors declare no conflict of interest. The funders had no role in the design of the study; in the collection, analyses, or interpretation of data; in the writing of the manuscript, or in the decision to publish the results.

References

  1. SAE International. Taxonomy and Definitions for Terms Related to Driving Automation Systems for On-Road Motor Vehicles; SAE International: Troy, MI, USA, 2018. [Google Scholar]
  2. Gold, C. Modeling of Take-Over Performance in Highly Automated Vehicle Guidance. Ph.D. Thesis, Technical University of Munich, Munich, Germany, 2016. [Google Scholar]
  3. König, M.; Neumayr, L. Users’ resistance towards radical innovations: The case of the self-driving car. Transp. Res. Part F Traffic Psychol. Behav. 2017, 44, 42–52. [Google Scholar] [CrossRef]
  4. Ekman, F.; Johansson, M.; Sochor, J. Creating appropriate trust in automated vehicle systems: A framework for HMI design. IEEE Trans. Hum.-Mach. Syst. 2018, 48, 95–101. [Google Scholar] [CrossRef]
  5. Reilhac, P.; Moizard, J.; Kaiser, F.; Hottelart, K. Cockpitkonzept für das teilautomatisierte Fahren. Automob. Tech. Z. 2016, 3, 44–49. [Google Scholar] [CrossRef]
  6. Götze, M. Entwicklung und Evaluation eines integrativen MMI Gesamtkonzeptes zur Handlungsunterstützung für den urbanen Verkehr. Ph.D. Thesis, Technical University of Munich, Munich, Germany, 2018. [Google Scholar]
  7. Lüke, S.; Fochler, O.; Schaller, T.; Regensburger, U. Stauassistenz und -automation. In Handbuch Fahrerassistenzsysteme: Grundlagen, Komponenten und Systeme für Aktive Sicherheit und Komfort; Winner, H., Hakuli, S., Lotz, F., Singer, C., Eds.; Springer Fachmedien Wiesbaden: Wiesbaden, Germany, 2015; pp. 995–1007. [Google Scholar]
  8. Rittger, L.; Götze, M. HMI strategy—Recommended action. In UR:BAN Human Factors in Traffic; Bengler, K., Drüke, J., Hoffmann, S., Manstetten, D., Neukum, A., Eds.; Springer Fachmedien Wiesbaden: Wiesbaden, Germany, 2018; pp. 119–150. [Google Scholar]
  9. Frison, A.-K.; Wintersberger, P.; Liu, T.; Riener, A. Why Do You Like to Drive Automated? A Context-Dependent Analysis of Highly Automated Driving to Elaborate Requirements for Intelligent User Interfaces; Fu, W.-T., Pan, S., Eds.; ACM: New York, NY, USA, 2019; pp. 528–537. ISBN 978-1-4503-6272-6. [Google Scholar]
  10. Lee, J.D.; See, K.A. Trust in automation: Designing for appropriate reliance. Hum. Factors 2004, 46, 50–80. [Google Scholar] [CrossRef] [PubMed]
  11. Beggiato, M.; Hartwich, F.; Schleinitz, K.; Krems, J.F.; Othersen, I.; Petermann-Stock, I. What would drivers like to know during automated driving? Information needs at different levels of automation. In Proceedings of the 7th Conference on Driver Assistance, Munich, Germany, 25–26 November 2015. [Google Scholar]
  12. Naujoks, F.; Forster, Y.; Wiedemann, K.; Neukum, A. Improving usefulness of automated driving by lowering primary task interference through HMI design. J. Adv. Transp. 2017, 2017, 1–12. [Google Scholar] [CrossRef] [Green Version]
  13. Othersen, I. Vom Fahrer zum Denker und Teilzeitlenker: Einflussfaktoren und Gestaltungsmerkmale nutzerorientierter Interaktionskonzepte für die Überwachungsaufgabe des Fahrers im teilautomatisierten Modus. In AutoUni—Schriftenreihe; Springer Fachmedien Wiesbaden: Wiesbaden, Germany, 2016. [Google Scholar] [CrossRef]
  14. Drüke, J.; Semmler, C.; Bendewald, L. The “HMI tool kit” as a strategy for the systematic derivation of user-oriented HMI concepts of driver assistance systems in urban areas. In UR:BAN Human Factors in Traffic; Bengler, K., Drüke, J., Hoffmann, S., Manstetten, D., Neukum, A., Eds.; Springer Fachmedien Wiesbaden: Wiesbaden, Germany, 2018; pp. 53–74. [Google Scholar]
  15. Van den Beukel, A.P.; van der Voort, M.C. Design Considerations on User-Interaction for Semi-Automated Driving. In Proceedings of the FISITA 2014 World Automotive Congress, Maastricht, The Netherlands, 2–6 June 2014. [Google Scholar]
  16. Richardson, N.; Michel, B.; Zimmermann, A.; Diermeyer, F. Erfassung und Bewertung des Informationsbedarfs von Lkw-Fahrern während hochautomatisierter Fahrt. In Proceedings of the 9. VDI-Tagung—Der Fahrer im 21. Jahrhundert, Braunschweig, Germany, 21–22 November 2017. [Google Scholar]
  17. Diels, C.; Thompson, S. Information expectations in highly and fully automated vehicles. In Advances in Human Aspects of Transportation; Stanton, N.A., Ed.; Springer International Publishing: Cham, Switzerland, 2018; pp. 742–748. [Google Scholar]
  18. Beller, J.; Heesen, M.; Vollrath, M. Improving the driver-automation interaction: An approach using automation uncertainty. Hum. Factors 2013, 55, 1130–1141. [Google Scholar] [CrossRef] [PubMed]
  19. Holländer, K.; Pfleging, B. Preparing drivers for planned control transitions in automated cars. In MUM 2018, Proceedings of the 17th International Conference on Mobile and Ubiquitous Multimedia, Cairo, Egypt, 25–28 November 2018; Abdennadher, S., Alt, F., Eds.; The Association for Computing Machinery, Inc.: New York, NY, USA, 2018; pp. 83–92. ISBN 978-1-4503-6594-9. [Google Scholar]
  20. Wandtner, B.; Schömig, N.; Schmidt, G. Secondary task engagement and disengagement in the context of highly automated driving. Transp. Res. Part F Traffic Psychol. Behav. 2018, 58, 253–263. [Google Scholar] [CrossRef]
  21. Richardson, N.T.; Flohr, L.; Michel, B. Takeover requests in highly automated truck driving: How do the amount and type of additional information influence the driver-automation interaction? Multimodal Technol. Interact. 2018, 2, 68. [Google Scholar] [CrossRef] [Green Version]
  22. Albert, M.; Lange, A.; Schmidt, A.; Wimmer, M.; Bengler, K. Automated driving—Assessment of interaction concepts under real driving conditions. In Procedia Manufacturing, Proceedings of the 6th International Conference on Applied Human Factors and Ergonomics (AHFE 2015) and the Affiliated Conferences, Las Vegas, NV, USA, 26–30 July 2015; Ahram, T., Karwowski, W., Schmorrow, D., Eds.; Elsevier: Amsterdam, The Netherlands, 2015; pp. 2832–2839. [Google Scholar]
  23. Schömig, N.; Wiedemann, K.; Naujoks, F.; Neukum, A.; Leuchtenberg, B.; Vöhringer-Kuhnt, T. An Augmented Reality Display for Conditionally Automated Driving. In Adjunct, Proceedings of the 10th International ACM Conference on Automotive User Interfaces and Interactive Vehicular Applications, Toronto, ON, Canada, 23–25 September 2018; Association for Computing Machinery: New York, NY, USA, 2018; pp. 137–141. ISBN 978-1-4503-5947-4. [Google Scholar]
  24. Feierle, A.; Beller, D.; Bengler, K. Head-Up Displays in Urban Partially Automated Driving: Effects of Using Augmented Reality *. In Proceedings of the IEEE Intelligent Transportation Systems Conference (ITSC), Auckland, New Zealand, 27–30 October 2019; pp. 1877–1882. [Google Scholar] [CrossRef]
  25. Wolf, I. Wechselwirkung Mensch und autonomer Agent. In Autonomes Fahren; Maurer, M., Gerdes, J.C., Lenz, B., Winner, H., Eds.; Springer: Berlin/Heidelberg, Germany, 2015; pp. 103–125. [Google Scholar]
  26. Schlag, B.; Weller, G. Verhaltenswissenschafltiche Aspekte von Fahrerassistenzsystemen. In Handbuch Fahrerassistenzsysteme: Grundlagen, Komponenten und Systeme für aktive Sicherheit und Komfort; Winner, H., Hakuli, S., Lotz, F., Singer, C., Eds.; Springer Fachmedien Wiesbaden: Wiesbaden, Germany, 2015; pp. 71–83. [Google Scholar]
  27. Koustanaï, A.; Cavallo, V.; Delhomme, P.; Mas, A. Simulator training with a forward collision warning system: Effects on driver-system interactions and driver trust. Hum. Factors 2012, 54, 709–721. [Google Scholar] [CrossRef] [PubMed]
  28. Butakov, V.; Ioannou, P. Driving autopilot with personalization feature for improved safety and comfort. In Proceedings of the IEEE 18th International Conference on Intelligent Transportation Systems, Las Palmas de Gran Canaria, Spain, 15–18 September 2015; pp. 387–393. [Google Scholar]
  29. Hecht, T.; Feldhütter, A.; Draeger, K.; Bengler, K. What do you do? An analysis of non-driving related activities during a 60 minutes conditionally automated highway drive. In Human Interaction and Emerging Technologies; Ahram, T., Taiar, R., Colson, S., Choplin, A., Eds.; Springer International Publishing: Cham, Switzerland, 2020; pp. 28–34. [Google Scholar]
  30. Pfleging, B.; Rang, M.; Broy, N. Investigating user needs for non-driving-related activities during automated driving. In MUM 2016, Proceedings of the 15th International Conference on Mobile and Ubiquitous Multimedia, Rovaniemi, Finland, 13–15 December 2016; Alt, F., Ed.; The Association for Computing Machinery, Inc.: New York, NY, USA, 2016; pp. 91–99. ISBN 978-1-4503-4860-7. [Google Scholar]
  31. ISO/TS 15007-2. Road Vehicles—Measurement of Driver Visual Behaviour with Respect to Transport Information and Control Systems—Part 2: Equipment and Procedures; ISO: Geneva, Switzerland, 2013.
  32. Technical University of Munich. Static Driving Simulator. Available online: http://www.lfe.mw.tum.de/en/research/labs/static-driving-simulator/ (accessed on 17 January 2020).
  33. Würzburg Institute for Traffic Sciences GmbH. Driving Simulation and SILAB. Available online: https://wivw.de/en/silab (accessed on 14 December 2019).
  34. Smart Eye AB. Available online: https://smarteye.se/ (accessed on 14 December 2019).
  35. Yang, Y.; Karakaya, B.; Dominioni, G.C.; Kawabe, K.; Bengler, K. An HMI concept to improve driver’s visual behavior and situation awareness in automated vehicle. In Proceedings of the 21st International Conference on Intelligent Transportation Systems (ITSC), Maui, HI, USA, 4–7 November 2018. [Google Scholar]
  36. Yang, Y.; Götze, M.; Laqua, A.; Dominioni, G.C.; Kawabe, K.; Bengler, K. A method to improve driver’s situation awareness in automated driving. In Proceedings of the Human Factors and Ergonomics Society Europe Chapter 2017 Annual Conference, Rome, Italy, 28–30 September 2017. [Google Scholar]
  37. Feldhütter, A.; Härtwig, N.; Kurpiers, C.; Hernandez, J.M.; Bengler, K. Effect on Mode Awareness when Changing from Conditionally to Partially Automated Driving, Proceedings of the 20th Congress of the International Ergonomics Association (IEA 2018), Florence, Italy, 26–30 August 2018; Bagnara, S., Tartaglia, R., Albolino, S., Alexander, T., Fujita, Y., Eds.; Springer International Publishing: Cham, Switzerland, 2019; pp. 314–324. [Google Scholar]
  38. Forster, Y.; Naujoks, F.; Neukum, A. Your Turn or My Turn? In Adjunct, Proceedings of the 8th International Conference on Automotive User Interfaces and Interactive Vehicular Applications, Ann Arbor, MI, USA, 24–26 October 2016; Green, P., Pfleging, B., Burnett, G., Gabbard, J., Oswald, S., Eds.; ACM: New York, NY, USA, 2016; pp. 253–260. ISBN 978-1-4503-4533-0. [Google Scholar]
  39. Utesch, F. Unscharfe Warnungen im Kraftfahrzeug Eignet sich eine LED-Leiste als Anzeige für Fahrerassistenzsysteme? Ph.D. Thesis, Technischen Universität Carolo-Wilhelmina zu Braunschweig, Braunschweig, Germany, 2014. [Google Scholar]
  40. Feierle, A.; Bücherl, F.; Hecht, T.; Bengler, K. Evaluation of Display Concepts for the Instrument Cluster in Urban Automated Driving. In Human Systems Engineering and Design II; Ahram, T., Karwowski, W., Pickl, S., Taiar, R., Eds.; Springer International Publishing: Cham, Switzerland, 2020; pp. 209–215. [Google Scholar]
  41. Feldhütter, A.; Segler, C.; Bengler, K. Does shifting between conditionally and partially automated driving lead to a loss of mode awareness? In Advances in Human Aspects of Transportation; Stanton, N.A., Ed.; Springer International Publishing: Cham, Switzerland, 2018; pp. 730–741. [Google Scholar]
  42. @CITY Consortium. Automatisiertes Fahren in der Stadt. Available online: https://www.atcity-online.de/ (accessed on 14 December 2019).
  43. Blommer, M.; Curry, R.; Kochhar, D.; Swaminathan, R.; Talamonti, W.; Tijerina, L. The effects of a scheduled driver engagement strategy in automated driving. SAGE J. 2015, 59, 1681–1685. [Google Scholar] [CrossRef]
  44. Mok, B.; Johns, M.; Lee, K.J.; Miller, D.; Sirkin, D.; Ive, P.; Ju, W. Emergency, automation off: Unstructured transition timing for distracted drivers of automated vehicles. In Proceedings of the IEEE 18th International Conference on Intelligent Transportation Systems, Las Palmas de Gran Canaria, Spain, 15–18 September 2015; pp. 2458–2464. [Google Scholar]
  45. Walch, M.; Lange, K.; Baumann, M.; Weber, M. Autonomous Driving: Investigating the Feasibility of Car-Driver Handover Assistance, Proceedings of the 7th International Conference on Automotive User Interfaces and Interactive Vehicular Applications, Nottingham, UK, 1–3 September 2015; Burnett, G., Gabbard, J., Green, P., Osswald, S., Eren, A., Antrobus, V., Eds.; ACM: New York, NY, USA, 2015; pp. 11–18. ISBN 978-1-4503-3736-6. [Google Scholar]
  46. Endsley, M.R. Measurement of situation awareness in dynamic systems. Hum. Factors 1995, 37, 65–84. [Google Scholar] [CrossRef]
  47. Holm, S. A simple sequentially rejective multiple test procedure. Scand. J. Stat. 1979, 6, 65–70. [Google Scholar]
  48. Cohen, J. Statistical Power Analysis for the Behavioral Sciences, 2nd ed.; Lawrence Erlbaum Associates: Mahwah, NJ, USA, 1988. [Google Scholar]
  49. Weinberger, M.; Winner, H.; Bubb, H. Adaptive cruise control field operational test-the learning phase. JSAE Rev. 2001, 22, 487–494. [Google Scholar] [CrossRef]
  50. Tussyadiah, I.P.; Zach, F.J.; Wang, J. Attitudes toward autonomous on demand mobility system: The case of self-driving taxi. In Information and Communication Technologies in Tourism 2017; Schegg, R., Stangl, B., Eds.; Springer International Publishing: Cham, Switzerland, 2017; pp. 755–766. [Google Scholar]
Figure 1. (a) Static driving simulator of the Chair of Ergonomics [32]; (b) driver’s cockpit with the defined areas of interest (AOIs) instrument cluster (1) and windshield (2) marked orange.
Information 11 00062 g001
Figure 2. Human–machine interface (HMI) display in active highly automated mode. (a) Passenger’s view, with blue LED strip at the bottom of the windshield and the instrument cluster behind the steering wheel; (b) visualization of the instrument cluster (automation icon is from [6]).
Information 11 00062 g002
Figure 3. Number of additionally requested information categories depending on the scenario. (a) Maneuver information; (b) maneuver reason information; (c) environmental information; (d) navigation data.
Information 11 00062 g003
Table 1. Number of participations in driving simulator studies concerning automated driving, knowledge about automated driving and opinion on automated driving, by experience group.
Experienced DriversInexperienced Drivers
Number of participationsTotal12217
Knowledge
[5-Likert scale: From non at all (1) to very good (5)]
M4.693.04
SD0.461.20
Opinion
[5-Likert scale: From negative (1) to positive (5)]
M4.383.75
SD0.781.01
Table 2. Experimental design, with the between- and within-subject factors used.
Type of Subject FactorsSubject Factors
BetweenExperiencedInexperienced
BetweenNDRANo NDRANDRANo NDRA
WithinS1–S7 1S1–S7S1–S7S1–S7
1 S1–S7: Scenarios 1 to 7.
Table 3. Overview of the presented automated driving scenarios.
DescriptionSketch of Planned ManeuverSILAB Birds-Eye-View
S1: Navigating intersection with traffic light and turning left Information 11 00062 i001 Information 11 00062 i002
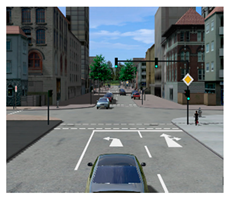
S2: Navigating intersection with traffic light and driving straight on Information 11 00062 i003 Information 11 00062 i004
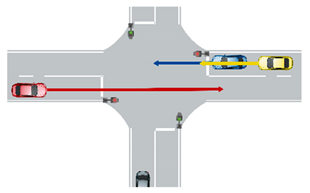
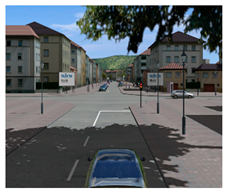
S3: Cyclist ahead, turning left Information 11 00062 i005 Information 11 00062 i006
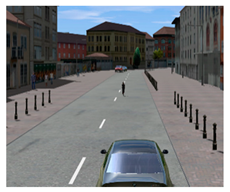
S4: Passing static bottleneck due to roadworks Information 11 00062 i007 Information 11 00062 i008
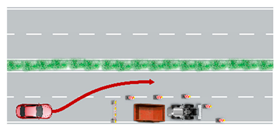
S5: Passing a dynamic bottleneck due to a broken-down vehicle Information 11 00062 i009 Information 11 00062 i010
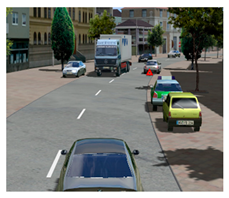
S6: Following a vehicle in front Information 11 00062 i011 Information 11 00062 i012
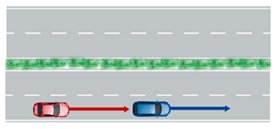
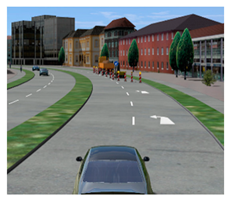
S7: Speed reduction due to entering a 30 km/h zone Information 11 00062 i013 Information 11 00062 i014
Table 4. Attention ratio on the AOIs instrument cluster and windshield with respect to experience and NDRA.
Between-Subject FactornInstrument ClusterWindshield
M (SD)M (SD)
Experienced166.6% (4.0%)54.8% (29.0%)
Inexperienced246.2% (3.8%)53.6% (26.2%)
NRDA205.6% (4.0%)31.8% (18.2%)
No NDRA207.1% (3.6%)76.3% (11.0%)
Table 5. Attention ratio on the AOIs instrument cluster and windshield with respect to scenario.
Within-Subject FactorNInstrument ClusterWindshield
M (SD)M (SD)
Scenario 1406.9% (4.4%)50.7% (28.7%)
Scenario 2407.1% (4.8%)53.4% (28.8%)
Scenario 3405.7% (4.8%)57.5% (27.0%)
Scenario 4406.0% (4.4%)57.3% (28.9%)
Scenario 5407.0% (5.6%)53.1% (26.9%)
Scenario 6406.3% (5.0%)51.1% (27.3%)
Scenario 7405.5% (4.4%)55.4% (30.0%)
Table 6. Subjective rating of the presented information system status, navigation information, current speed and speed limit for the between-subject factors experience and NDRA.
Between-Subject FactornSystem StatusNavigation InformationCurrent SpeedSpeed Limit
MdnMdnMdnMdn
Experienced166.004.753.502.00
Inexperienced244.005.006.003.75
NRDA205.254.254.253.00
No NDRA204.005.505.754.25
Table 7. Subjective rating of the presented information categories system status, navigation information, current speed and speed limit for the within-subject factor scenario.
Within-Subject FactorNSystem StatusNavigation InformationCurrent SpeedSpeed Limit
MdnMdnMdnMdn
Scenario 1406643
Scenario 2405554
Scenario 3405.5-53
Scenario 4405454
Scenario 5405-4.53
Scenario 6405554

