Abstract
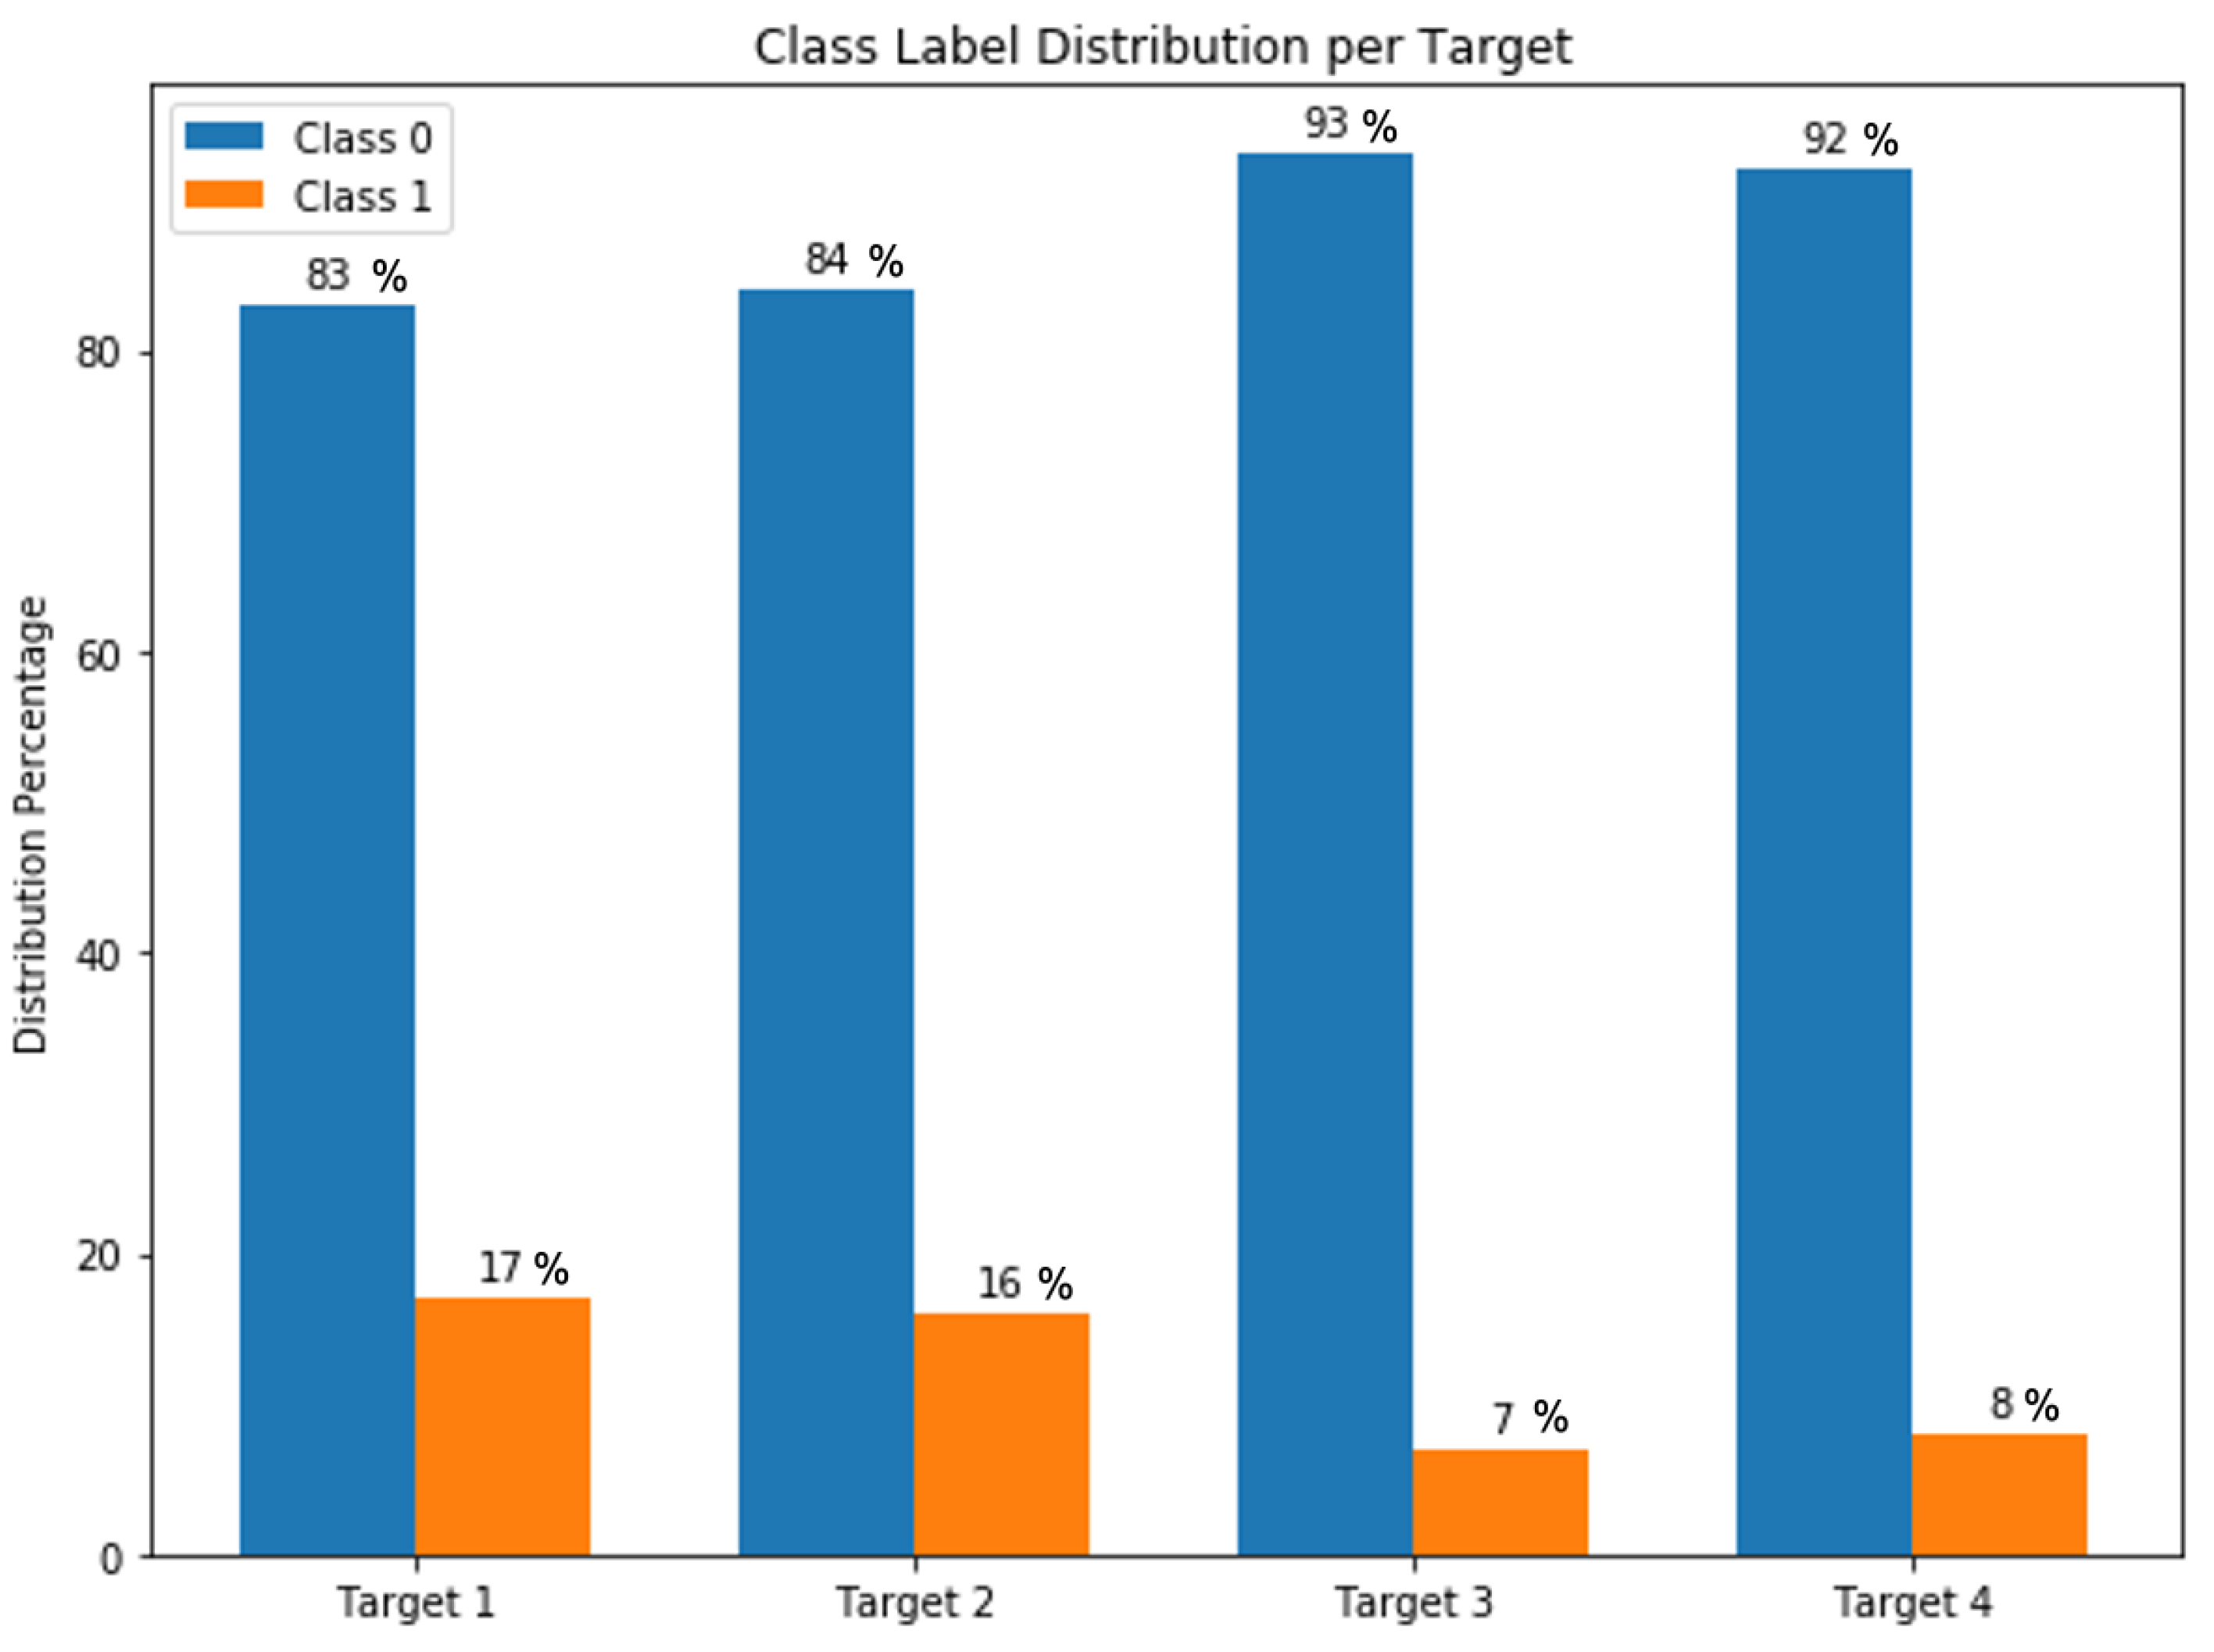
Heart diseases are highly ranked among the leading causes of mortality in the world. They have various types including vascular, ischemic, and hypertensive heart disease. A large number of medical features are reported for patients in the Electronic Health Records (EHR) that allow physicians to diagnose and monitor heart disease. We collected a dataset from Medica Norte Hospital in Mexico that includes 800 records and 141 indicators such as age, weight, glucose, blood pressure rate, and clinical symptoms. Distribution of the collected records is very unbalanced on the different types of heart disease, where 17% of records have hypertensive heart disease, 16% of records have ischemic heart disease, 7% of records have mixed heart disease, and 8% of records have valvular heart disease. Herein, we propose an ensemble-learning framework of different neural network models, and a method of aggregating random under-sampling. To improve the performance of the classification algorithms, we implement a data preprocessing step with features selection. Experiments were conducted with unidirectional and bidirectional neural network models and results showed that an ensemble classifier with a BiLSTM or BiGRU model with a CNN model had the best classification performance with accuracy and F1-score between 91% and 96% for the different types of heart disease. These results are competitive and promising for heart disease dataset. We showed that ensemble-learning framework based on deep models could overcome the problem of classifying an unbalanced heart disease dataset. Our proposed framework can lead to highly accurate models that are adapted for clinical real data and diagnosis use.
1. Introduction
Heart disease is among the primary causes of death in the United States. Based on the American Heart Association’s most recent statistics, 121.5 million US deaths were caused by heart disease [1]. Identifying heart disease is a challenging task that requires several biological indicators and risk factors including age, gender, high blood pressure, diabetes, cholesterol level, and many other clinical indicators. Many hospitals and physician practices rely on the Electronic Health Records (EHR) system for either monitoring patients [2] or for detecting anomalies and potential issues such as extracting important drug events in pharmacovigilance [3], establishing the EHR-based public health surveillance [4], and exploiting dynamic features of the handwriting process to support the Parkinson’s disease at earlier stages [5].
Data mining has provided an effective solution for several healthcare applications [6] such as medical image segmentation [7], patient deep representations [8], and computer-aided detection (CAD) tools for Liver Cancer diagnosis [9] and Interstitial Lung Disease (ILD) detection [10]. The complex nature of the real medical dataset requires careful management because a prediction error may have a serious effect. Therefore, clinical informatics has been carefully used for analyzing the EHR data and accurately classifying the disease based on machine learning algorithms and statistical techniques. For this purpose, recent works have applied classification algorithms such as Decision Trees (DT) and Naive Bayes for Heart disease prediction [11], and K-Nearest Neighbor (KNN) for an automatic classification of the blood pressure [12]. Another work conducted three types of SVM classifiers for predicting the Coronary artery disease [13]. An automated diagnosis system was suggested for the identification of heart valve diseases based on the Support Vector Machines (SVM) classification of heart sounds [14].
In recent years, neural network models have presented their outstanding performance for data prediction and tackling various classification problems. Deep learning techniques have played a significant role in the healthcare domain for knowledge discovery and diseases classification, like heart disease, diabetes, and brain disease, using the collected biomedical data as surveyed in [15,16], that showed several types of clinical applications using the deep learning framework, and also noted some limitations and needs of improvements. In particular, several predictive models based on neural networks have been designed for accurately classifying heart disease [17]. In recent works, convolutional neural networks (CNN) have been implemented for identifying different categories of heartbeats in ECG signals [18], and a modified deep convolutional neural network has been utilized for classifying the ECG data into normal and abnormal [19]. Recurrent neural network (RNN) has also been employed for predicting future disease using robust patient representations of EHR [20] and modeling temporal relations among events in EHR data [21]. Another study has used long short-term memory networks (LSTM) for predicting the risk of cardiovascular disease [22], and gated recurrent units (GRU) for vascular disease prediction [23]. Theoretical studies by Yang et al. [24] showed that bidirectional neural network models, such as bidirectional LSTM (BiLSTM) and bidirectional GRU (BiGRU), have had promising results because they could overcome the limitation on the input data flexibility. This has been proved in many applications like Natural Language Processing (NLP), such as accurate context-sensitivity prediction [25] and unified tagging solution suggested by [26] using the BLSTM-RNN algorithm. Other applications that have been studied for heart disease detection such as sequence labeling for extraction of medical events from EHR notes was suggested using Bidirectional RNN [27], and an automatic classification of arrhythmia’s based on Bidirectional LSTM [28]. Another work presented a new recurrent convolutional neural network (RCNN)-based disease risk assessment from hospital big data [29].
One of the biggest challenges in the healthcare analysis is the lack of collected EHR data for conducting accurate predictive models. The huge imbalance of dataset distribution is another problem for healthcare analysis and particularly for heart disease classification. In order to increase the adaptability and the precision of the machine learning solutions, ensemble-learning models have been proposed to contribute better diagnosis results, for example using the AdaBoost ensemble classifier for heartbeat classification [30], and cardiovascular disease detection using hybrid models [31,32]. Ensemble of neural networks has been also suggested for phonocardiogram recordings detection using a feed-forward neural network without segmentation [33]. Another effective solution that has been presented to tackle the combined challenge of class imbalance learning and real data insufficiency is to balance the data using a new under-sampling scheme with a noise filter [34], or using a resampling strategy and time-decayed metric to overcome a class imbalance online [35].
In this paper, we introduce an ensemble-learning framework based on neural network models for classifying different types of heart disease. The main objective of this research is to enhance the performance accuracy prediction for an unbalanced heart disease dataset. Our methodology also presents a combined resampling technique of random and averaging under-sampling that adapts to the output class distribution. The conducted experiments present comparative results between unidirectional and bidirectional neural network models and show that an ensemble-learning classifier combining BiLSTM or BiGRU and CNN has a stronger capability to predict correctly different types of heart disease.
The rest of the paper is organized as follows. Section 2 discusses existing works for heart disease detection and classification techniques for medical applications. We provide a preliminary overview of the research methods in Section 3. Section 4 presents our proposed approach and the detailed implementation of our methodology. Section 5 describes the experimental dataset, followed by the evaluation metrics, hyperparameters setting, and presents comparative results. Section 6 concludes with a discussion about the proposed methodology results and presents suggestions for future enhancement.
2. Related Work
Heart disease is a general term that describes any condition affecting the heart and is indicated by chest pain and fatigue, abnormal pulse rate, and many other symptoms. There are many risk factors for diagnosing heart disease. Some risk factors are related to age, sex, and weight. Other risk factors are associated with lifestyle, such as smoking, high blood pressure, and having other diseases like diabetes and obesity. This variety of factors makes it hard for physicians to assess and diagnose the type of heart disease.
Artificial intelligence solutions have been suggested to analyze and classify the EHR data for heart disease prediction [36], by designing standard classification models such as support vector machine (SVM), a priori algorithm, decision trees, and hybrid random forest model [37,38]. Heart failure prediction has been modeled by relying on machine learning techniques applied to EHR data and reached a high AUC score of 77% using Logistic regression with model selection based on Bayesian information criterion [39]. Moreover, machine learning techniques have been proven to efficiently classify different types of medical data such as magneto-cardiograph recordings using k-nearest neighbor and XGBoost techniques [40], or clustering multi-label documents in order to help finding co-occurrence of heart disease with other diseases [41,42].
Advanced research in artificial intelligence has induced accurate systems for medical applications and designed computational tools to increase the reliability of the predictive models while dealing with sensitive clinical data [43]. A new clinical prediction modeling algorithm has been developed to build heart failure survival prediction models and mostly applied to identify the complex patterns on EHR data with diverse predictor–response relationships [44]. In this context, a deep learning approach was efficiently implemented for cardiology applications [45], and risk analysis of cardiovascular disease using an auto-encoder algorithm [46]. Another work has suggested a Multiple Kernel Learning with Adaptive Neuro-Fuzzy Inference System (MKL with ANFIS) for heart disease diagnosis and has produced high sensitivity (98%) and high specificity (99%) for the KEGG Metabolic Reaction Network dataset [47]. Recent applications implemented a convolutional neural network (CNN) and multilayer perceptron (MLP) for fetal heart rate records assessment and reached 85% accuracy [48]; a recurrent neural network (RNN) was also suggested for automatic detection of irregular beating rhythm in records with 83% accuracy [49]. A long-short term memory (LSTM) network was used for atrial fibrillation classification from diverse electrocardiographic signals and reached 78% accuracy in [50], and 79% F1 score in [51]. A pediatric heart disease screening application was also solved using a CNN model for the task of automatic structural heart abnormality risk detection from digital phonocardiogram (PCG) signals [52]. Moreover, bidirectional neural network architecture has been introduced for effectively improving the accuracy of heart disease applications using the BiLSTM-Attention algorithm that reached better results (accuracy of 99.49%) than the literature’s review [53]. Other applications of deep learning presented in medical imaging and achieved the state-of-the-art results [54], and many challenging tasks were solved in biomedicine considering the utility of the neural networks [55]. A generative adversarial network (GAN), which is composed of BiLSTM and CNN models, was suggested to address the problem of generating synthetic ECG data in order to enhance the automated medical-aided diagnosis and showed high morphological similarity to real ECG recordings [56]. Some other applications employed the Natural Language Processing (NLP) that helped to assist doctors in heart disease diagnosis, such as suggesting comprehensive learning models from the electronic medical data using LTSM [57], and outpatient categories classification according to textual content using the attention based BiLTSM model [58].
Data mining models have been optimized by introducing new concepts like ensemble-learning models that improved the classification performance. This has been suggested by developing a predictive ensemble-learning model on different datasets in order to diagnose and classify the presence and absence of coronary heart disease and achieved promising accuracy that exceeded the state-of-the-art results [59]. The idea of ensemble-learning was also applied by aggregating the predictions of different classifiers instead of training an individual classifier. An example of application was conducted for predicting coronary heart disease using bagged tree and AdaBoost algorithms [60]. From this basis, an ensemble method based on neural network has been suggested for creating a more effective classification model and showed promising classification accuracy in [61,62]. An example of ensemble-learning model was also proposed for heart failure detection using an LSTM-CNN-based network [63,64].
There are several factors that might affect the performance of existing classification models applied to real data, and one of these reasons is explained by the class imbalance of the training dataset. The designed models were often biased toward the majority class and were not able to generalize the learning. Therefore, balancing the data was suggested to produce a better definition of the class while training the models, using proposed methods including Smote [65], Edited Nearest Neighbors (ENN), and Tomek [66]. A selective ensemble-learning framework solution was proposed for ECG-based heartbeat classification, and it showed a high classification performance for imbalanced multi-category classification task [67].
3. Preliminaries
3.1. Unidirectional Neural Network
Neural network architecture has been proposed as a multilayer learning process that helps to extract complex features from the input data. Dense neural network architectures were suggested for different types of grid-structured data, such as images and tabulated data. The first common architecture was credited to the Convolutional Neural Network (CNN) [68], which applies convolution operation along the hidden layers and a maximum pooling layer to capture the position of the important features. This model showed high accuracy for computer vision and information retrieval applications. CNN architecture assumes the independence of the input and output, which causes limitations for many tasks that deal sequentially with the data, such as text translation and speech recognition. Therefore, another architecture introduced recurrent units to preserve the semantic and syntactic dependency of the data, called the Recurrent Neural Network (RNN) [69]. This architecture added the memorization part to the learning and the recursive propagation between the units. It also added another backpropagation step to update the weights and train parameters along the neural network.
Since the RNN units are sequentially interconnected, the backpropagation requires going backward along the sequence to update the weight. Therefore, the computation between the units may become either bigger or smaller, and the gradients may vanish and be reduced to either zero or infinity. Consequently, the network cannot memorize the information along the network, and the prediction may be limited to the recent input of the sequence. In this case, it is difficult for the model to know the direction it should take to improve the loss function. To preserve the long-term information and overcome the short-term input, another neural network architecture was introduced to solve the vanishing gradients problem of the RNN. The first model was the long-short term memory (LSTM) network [70], which modified the single unit into a complex unit that is composed of Input gate i, an Output gate o, a memory cell c, and a forget gate f.
In fact, the LSTM passes the information between the gates, so the input gate decides how much new input to take after considering the memory cell, and the forget gate decides how much old memory to retain, as detailed in the following Equations (1)–(6):
Another neural network architecture was suggested to overcome the vanishing or divergent gradients problem of the RNN model. This new architecture uses the same technique of gating the hidden state, called the Gated Recurrent Units (GRU) network [71], that is an improved version of the unidirectional RNN, and it uses an update u and a reset gate r. In fact, the update gate connects the current input and helps the unit to determine how much old information to retain future information. The reset gate is the equivalent forget gate of the LSTM. It decides how much of the past information to forget and computed with the same formula as the update gate.
3.2. Bidirectional Recurrent Neural Network
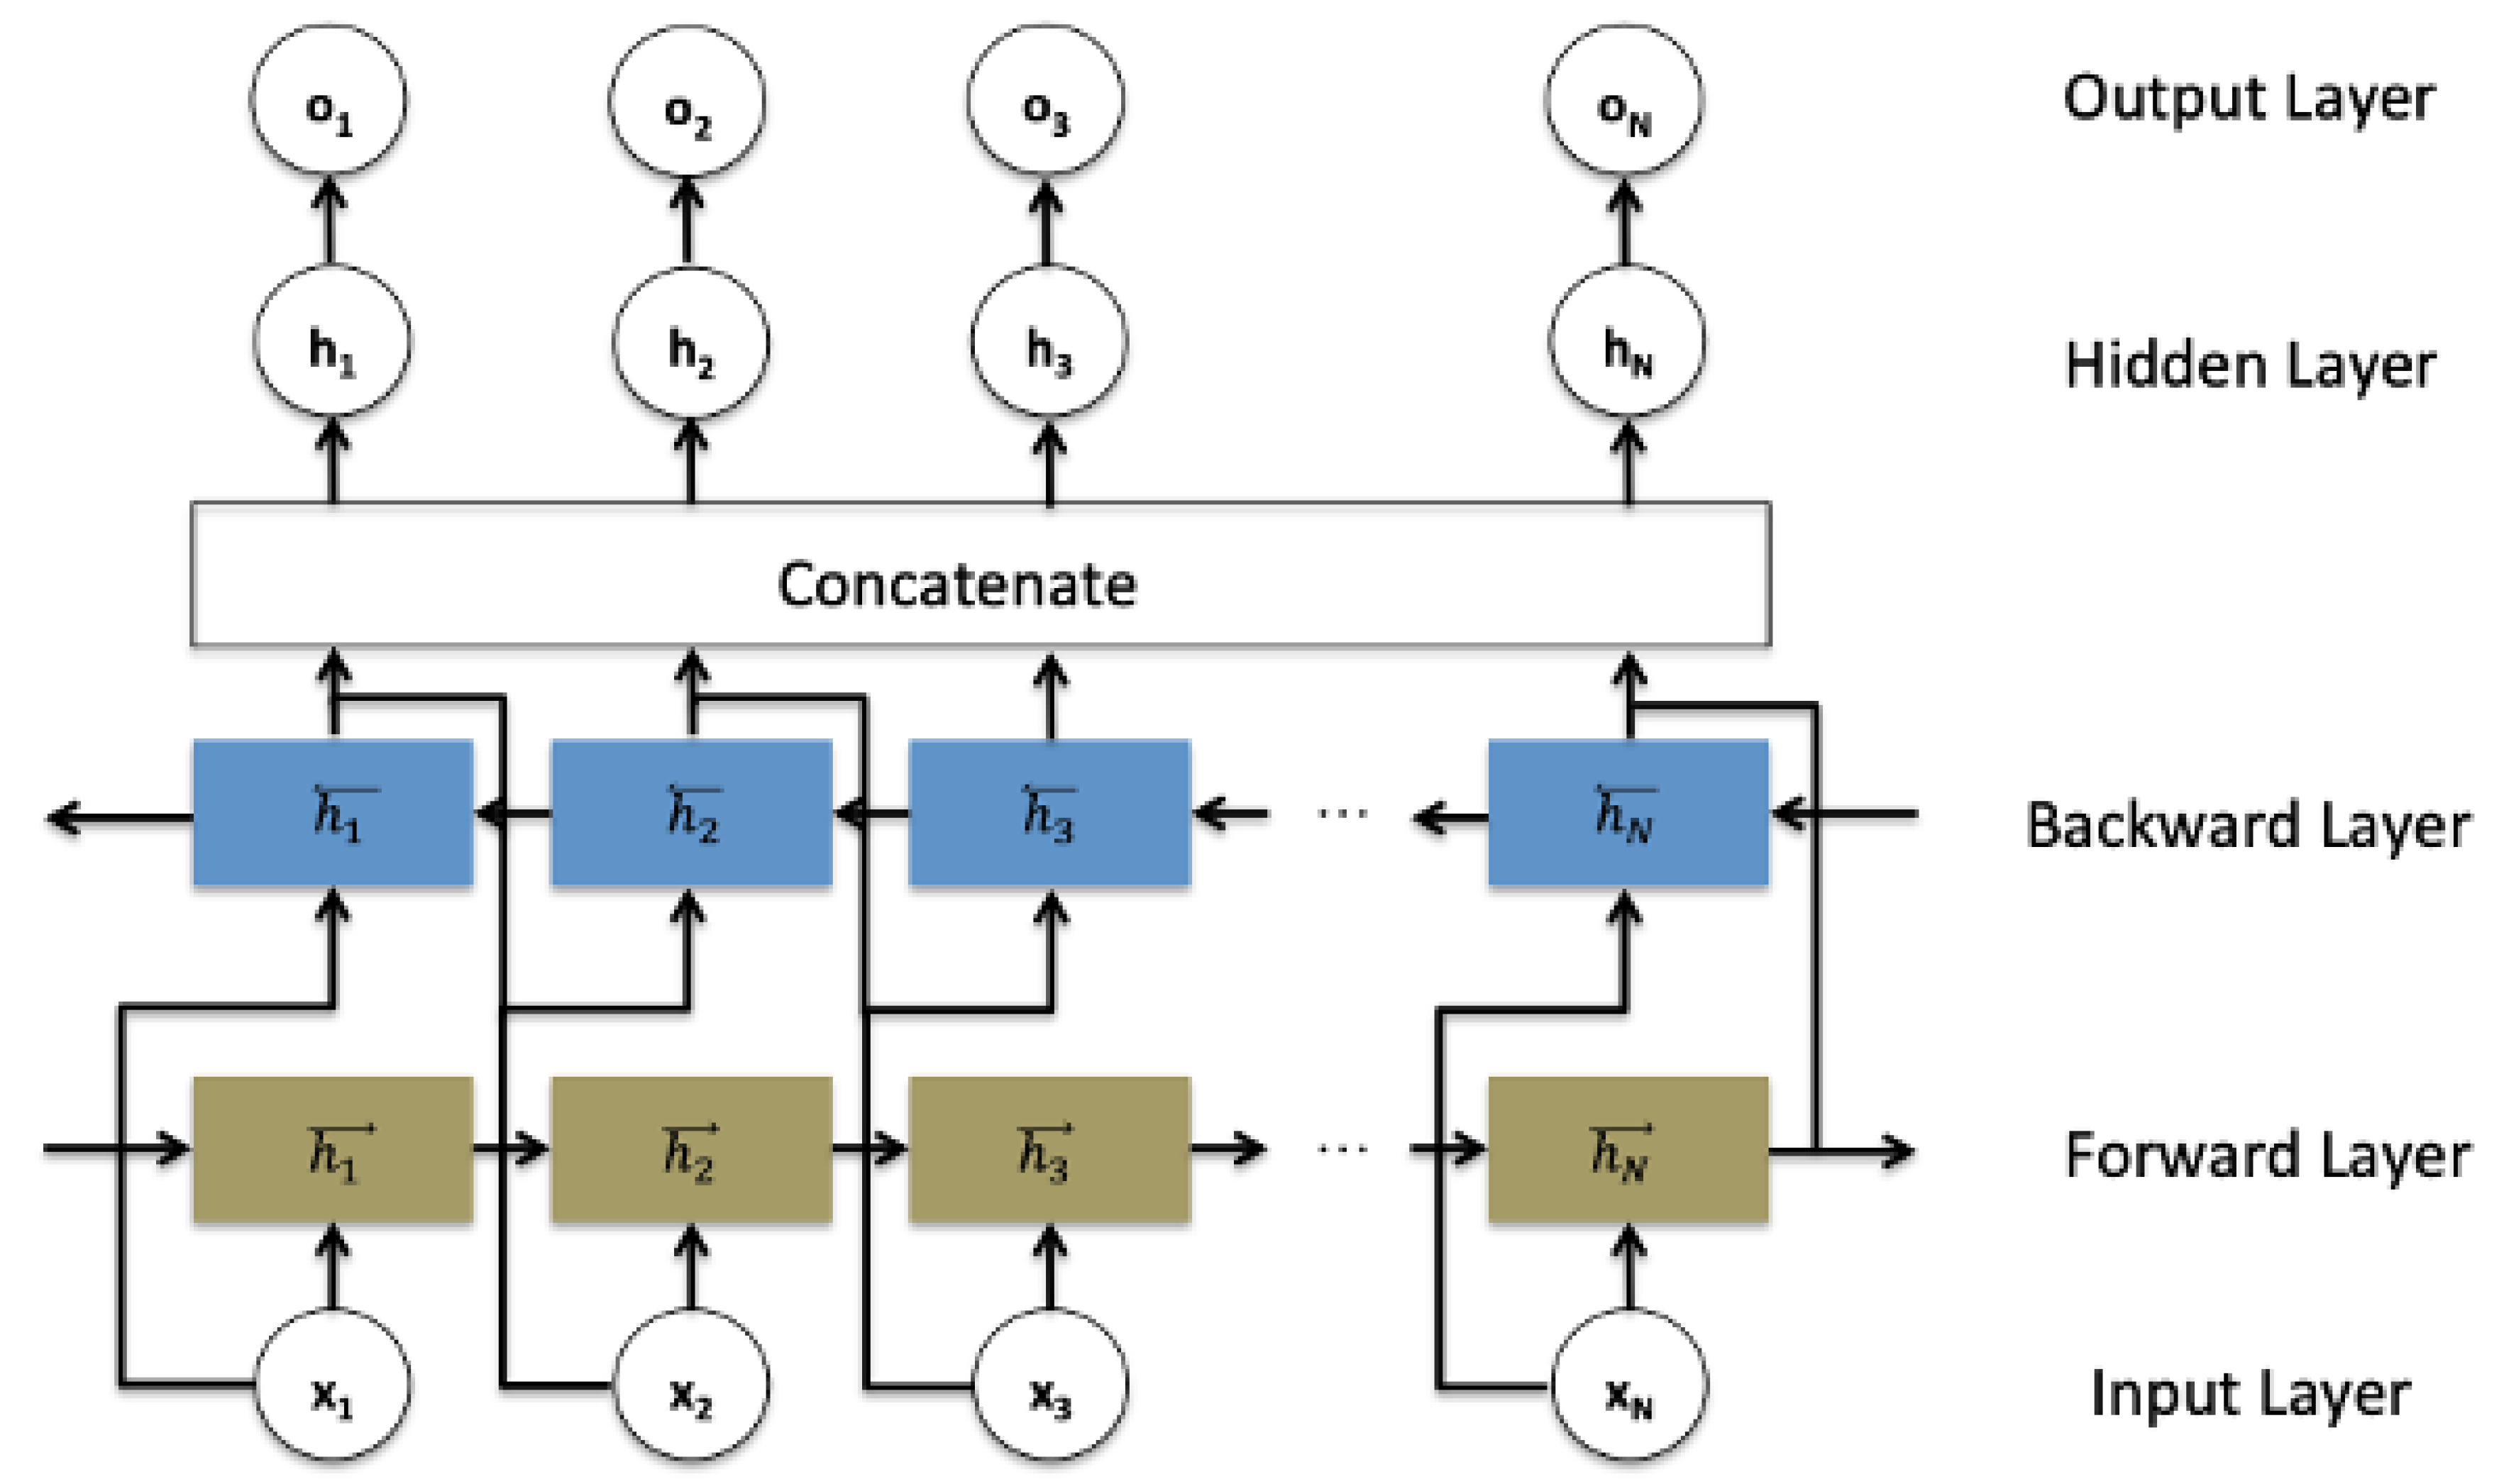
In the traditional RNN architecture (and its modifications architectures including LSTM and GRU), the information can only be passed in forward, and therefore each current unit depends only on the previous unit. In some applications such as speech recognition, text auto-complete, and machine translation, every moment carries the context information, so making predictions about the current state requires using the information coming from both previous steps and later time steps. Therefore, a bidirectional recurrent neural network architecture was introduced to treat all the inputs equally. It is composed of forward and backward hidden states and as shown in the schematic Figure 1.
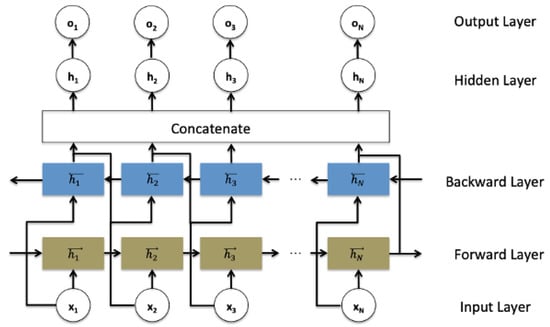
Figure 1.
Bidirectional recurrent neural networks structure.
Such a network may integrate two independent RNN, LSTM, or GRU models, where every input in the sequence data is fed at the time order for one network that is composed of sequential units, and then at the reverse time order for another network. The outputs of the two opposite directional networks forward (f) and backward (b) are concatenated at each time step to generate the final hidden layer ht−1 which is used to generate the output layer ot, as detailed in the following Equations (11)–(13):
3.3. Data Balancing Methods
In real-life cases of binary problems, the training dataset can contain a higher representative proportion of samples from one class than another class. Building a binary classification model and training it on such an unbalanced dataset can be biased towards the largest class. It causes a lower misclassification error for the highest representative class so that most of the testset samples are incorrectly classified to the majority class. Such a model requires more attention in the case of a real medical dataset as the cost of predicting disease to a healthy patient is a significant issue.
Balancing a small real dataset is the most common idea to solve the high imbalance of the output class distribution. Random sampling is one of the techniques that was suggested to balance the dataset. It is a non-heuristic method that comes in two ways: random over-sampling and random under-sampling. Random over-sampling aims to balance the dataset through the random replication of the minority class samples; random under-sampling works through the random elimination of the majority class samples. Other heuristic methods were also suggested to overcome the imbalance problem. Tomek links is a method that aims to eliminate the majority class samples according to the distance between a pair of samples [72]. Synthetic Minority Over-sampling (SMOTE) is also a common technique that applies an interpolation between several minority class samples in order to create new artificial minority class samples [73]. Condensed Nearest Neighbor Rule (CNNR) is an algorithm that aims to reclassify samples from the majority class to the minority class using a 1-nearest neighbor classification technique, and it eliminates the distant samples because they are irrelevant for the learning process [74].
3.4. Features Selection Methods
A real dataset usually comes with a large number of features, which provides numerical and categorical indicators of each record. The features determine the quality of the training data, but some of them can be irrelevant and noisy. The following paragraph details methods that can be applied to determine the importance of the features toward the target variable.
3.4.1. Model-Based Selection Method
This data-transformer applies an estimator model, which presents a coefficient indicating the feature importance after fitting the model on the dataset. The selection of the features is determined if their corresponding coefficient is higher than a certain threshold. The threshold value is either specified numerically or with the built-in heuristics such as mean, median, or a composed value like (n x mean) value. Concerning the choice of the estimator model, there are different types of models including linear models known as L1-based model, or nonlinear models like the tree-based model including a decision tree or random forest classifiers.
3.4.2. Recursive Feature Elimination Method
This method is an extension of the model-based selection technique. It consists of running a recursive feature (RF) to determine initial importance weights of the features, and then removing a percentage of them with the lowest importance weights from the dataset. The recursive feature elimination (RFE) approach recursively assigns ranks to remove features and trains a model on the remaining features until achieving a certain accuracy of the model that predicts the target variable. The remaining features with the highest performance are finally selected.
4. Methodology
4.1. Classification Models
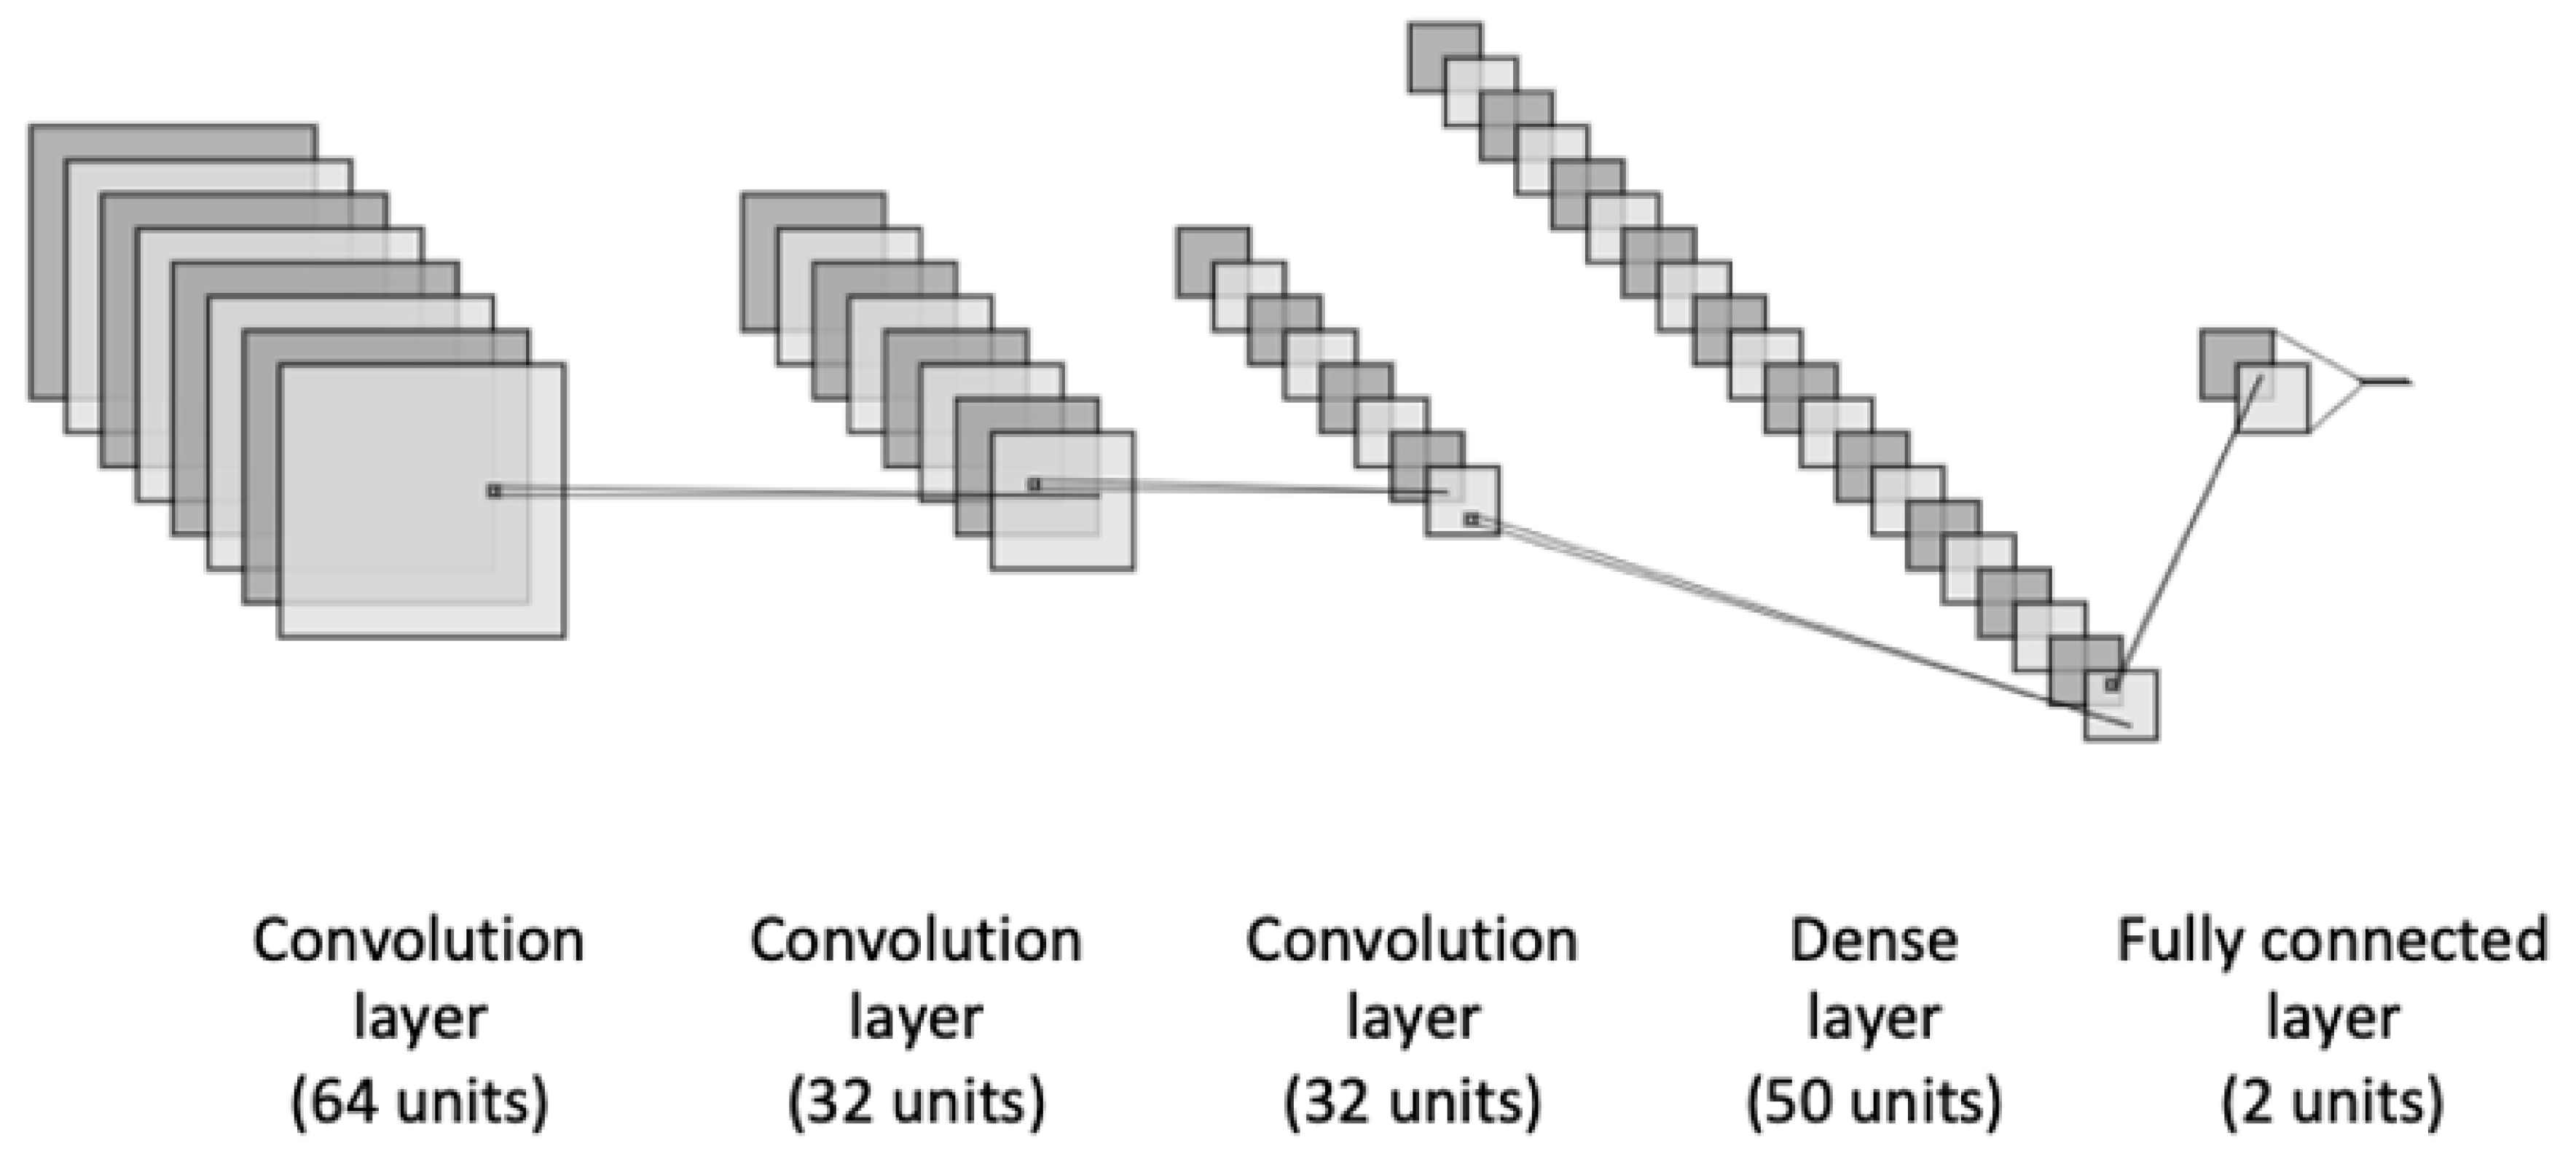
We proposed an ensemble-learning framework of two different neural network models, including the basic deep neural networks which are the most widely explored for the binary classification task. Thus, we used CNN, LSTM, GRU, BiLSTM, and BiGRU for our heart disease binary classification task. The first proposed architecture is a CNN model as represented in Figure 2. It consists of three different blocks of convolutional layers that are followed up with a dense layer such as ReLu activation function. In order to avoid the overfitting problem, a dropout method was applied to add penalty to the loss function by randomly removing inputs during the training. A dropout layer was added after each convolutional layer with a certain rate. Moreover, to improve the model’s generalization and reduce the overfitting, we applied an L2-regularization to the dense layers of the model. This allows for adding penalties on the layers activity during the training.
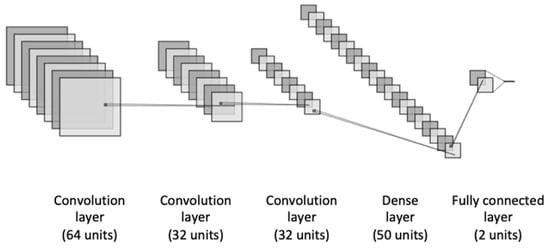
Figure 2.
The architecture of the CNN model.
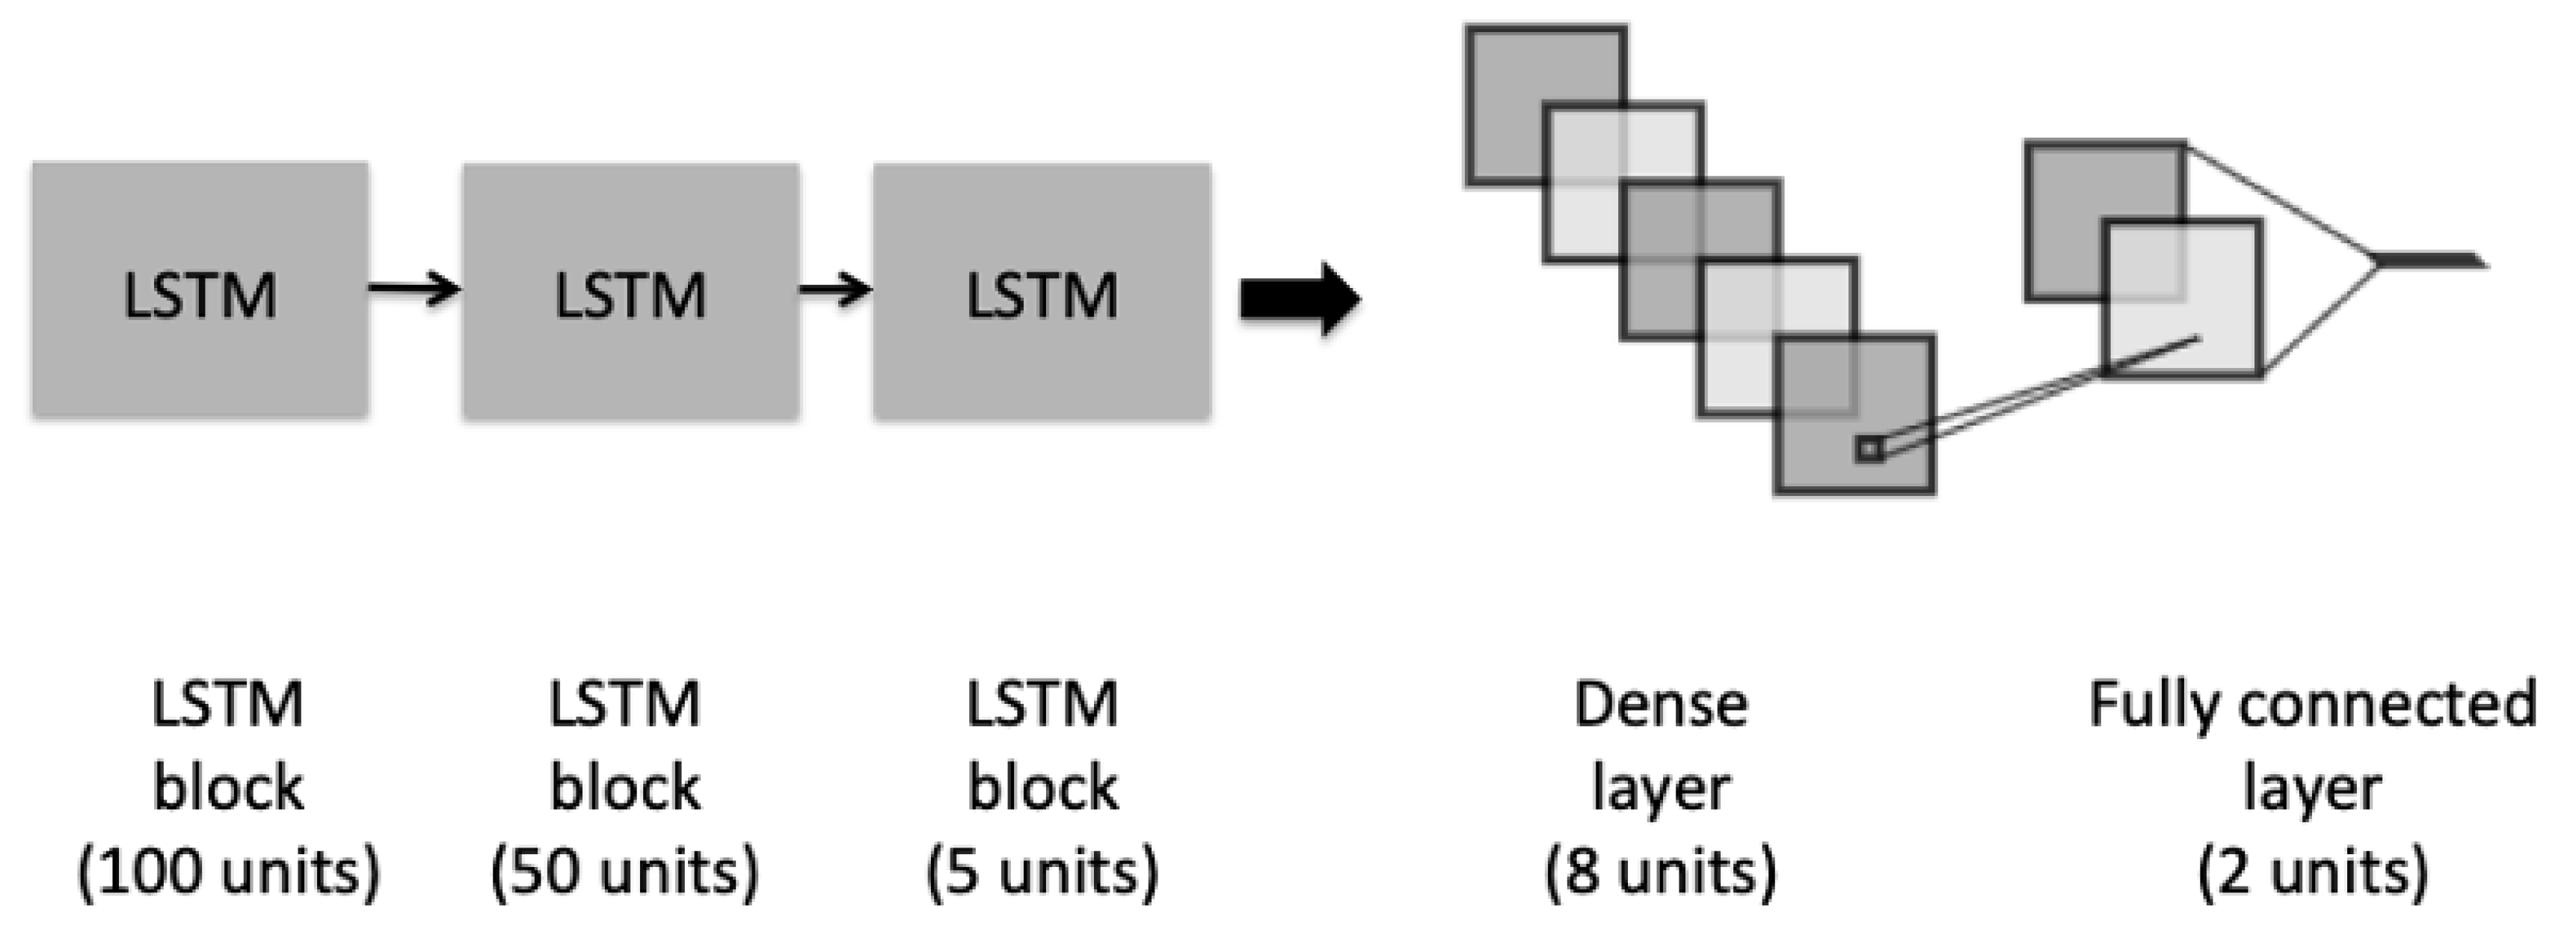
The second architecture is depicted in Figure 3, which illustrates an LSTM model, composed of three different blocks of LSTM. The initial block contains a recurrent dropout rate that helps to drop a fraction of units for the linear transformation of the recurrent state. Before adding the last fully connected layer, we added a dense layer with an L2-regularization to penalize the learning during the optimization.
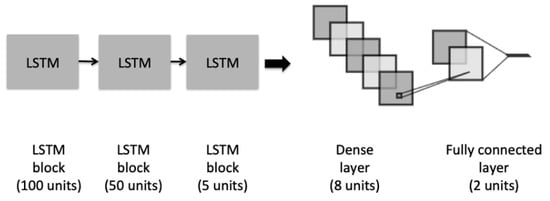
Figure 3.
The architecture of the LSTM model.
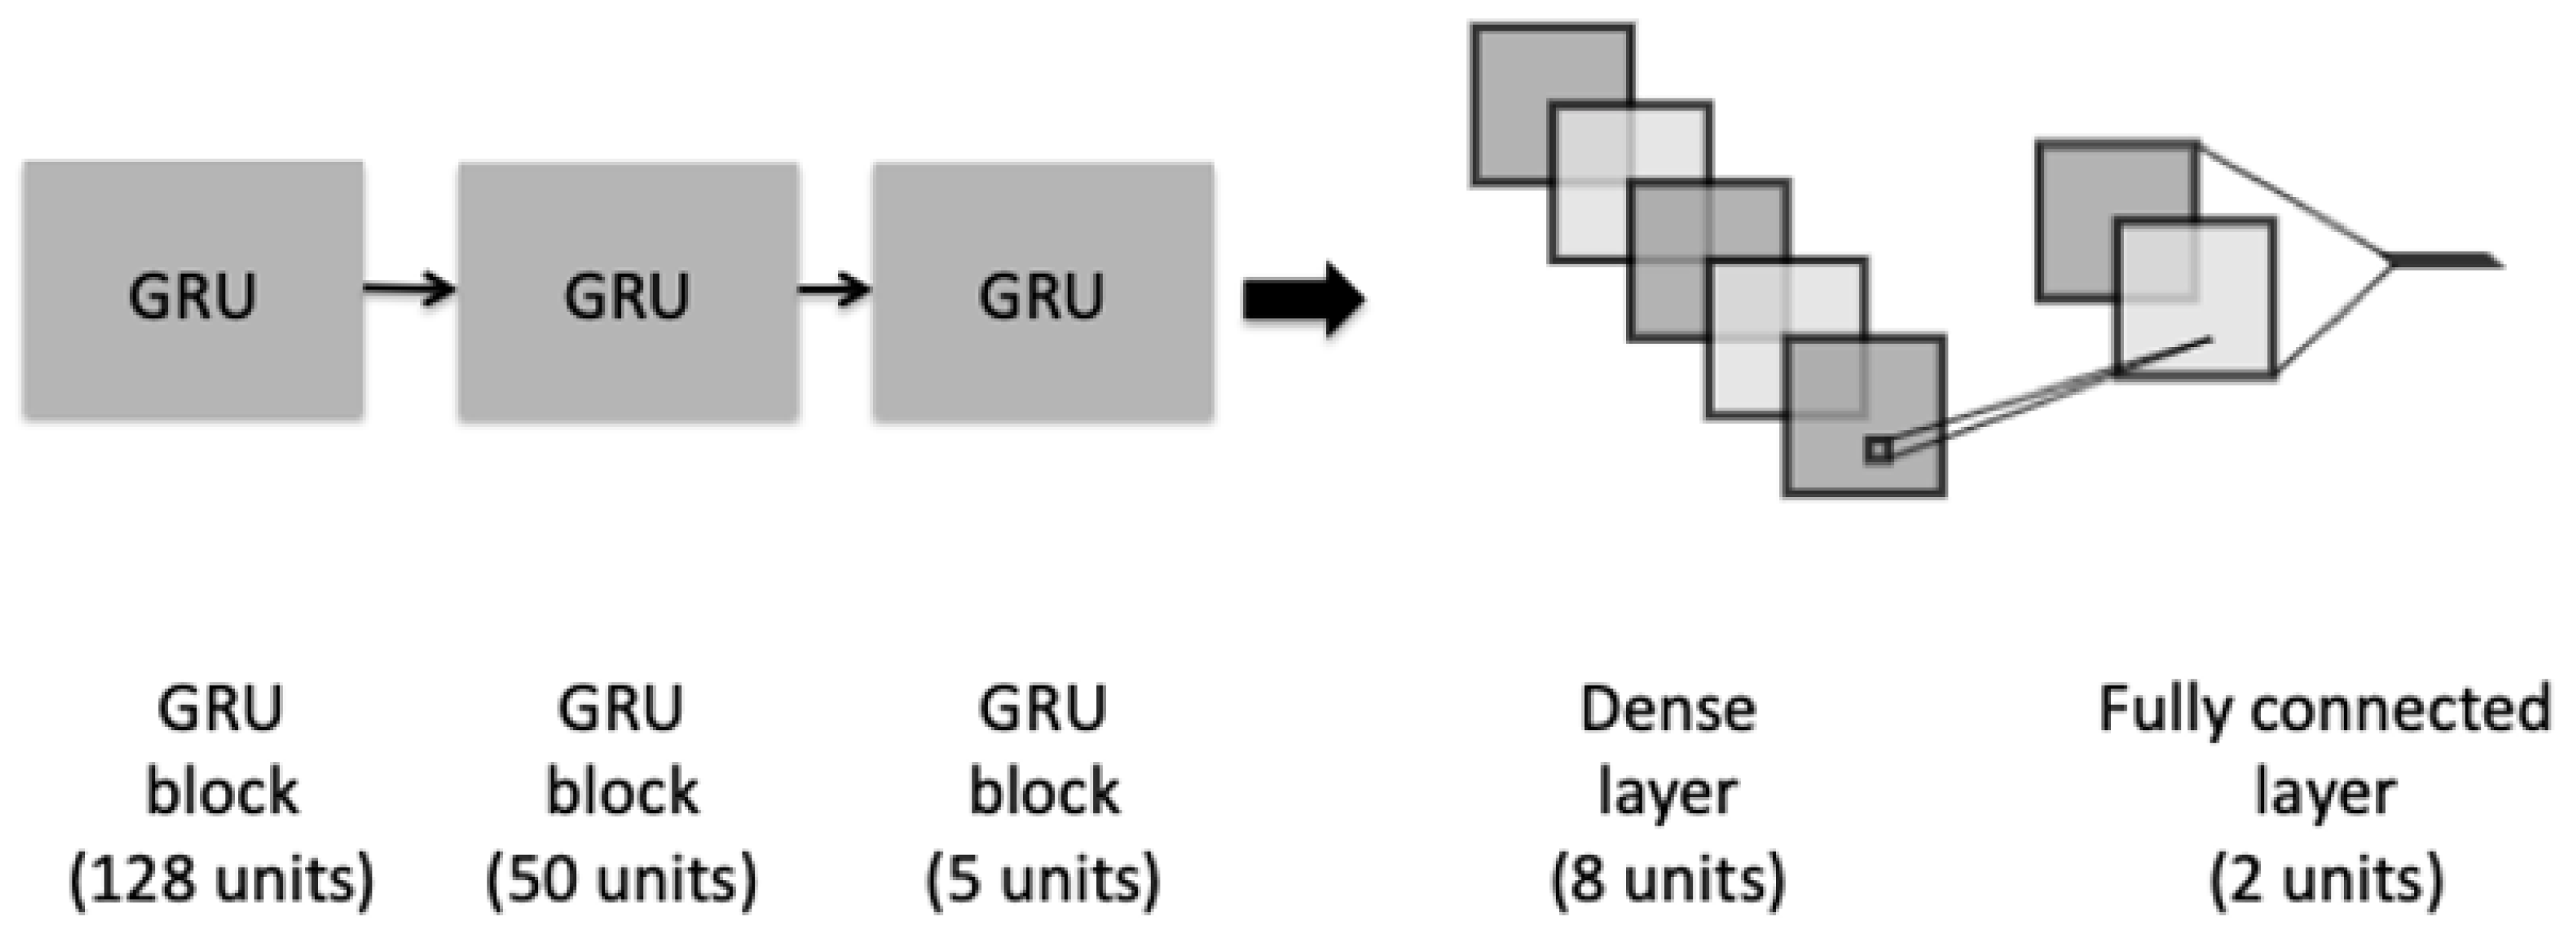
A third architecture is a GRU model, as shown in Figure 4. The model has a similar architecture to the proposed LSTM. It consists of three different blocks of GRU and a recurrent dropout rate in order to help to drop a fraction of units for the linear transformation of the recurrent state. The last fully connected dense layer was added preceded with an L2-regularization dropout layer.
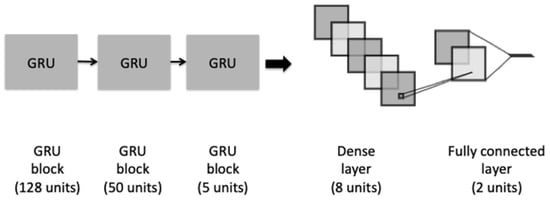
Figure 4.
The architecture of the GRU model.
Two additional bidirectional neural network models were suggested in our framework. BiLSTM and BiGRU models that are based on the previous unidirectional LSTM and GRU models. The two architectures stack three blocks of bidirectional LSTM and bidirectional GRU, and they use a concatenation method by which the outputs of the forward and backward LSTM and GRU are combined. Equivalently to the unidirectional models, BiLSTM and BiGRU contain an L2-regularization dropout layer and a final fully connected dense layer.
The choice of units’ number per hidden layer was based on empirical studies and preliminary experiments to select the optimal hidden layer size.
4.2. Ensemble-Learning Framework
Looking at the work presented by Esfahani et al., it designed an ensemble classifier using different machine learning techniques and helped to effectively predict the heart disease for a dataset of 303 patients [31]. The study showed the effectiveness of the ensemble-learning models on a small medical dataset, but it is limited to the traditional classifiers. Das et al. applied a similar framework by constructing a new neural network of three independent simple neural networks [61,62]. Another study assembled multiple neural network models for combining textual, visual, and mixed predictions and achieved better performance for the medical captioning task [75]. However, the technique was based on averaging multiple predictions without taking into account the suitability of the neural network architecture to each class label.
We proposed an ensemble-learning framework that trains two independent deep learning models on the same dataset and the final prediction is the concatenation of the two different predictions, as shown in Figure 5. This emphasizes the aggregation of two different classifiers where each classification model is designated to a particular output of the binary class. The two classification models were selected so that each model had a higher classification performance for one of the output classes than the other one. This was achieved after conducting preliminary experiments showing that our designed LSTM, GRU, BiLSTM, and BiGRU models performed better for the majority output class 0 (i.e., not having a heart disease type). The proposed CNN model performed better for the minority output class 1 (i.e., having a heart disease type) than for the output class 0).

Figure 5.
The Ensemble-learning model Framework, Model 1: LSTM, GRU, BiLSTM, and BiGRU, Model 2: CNN.
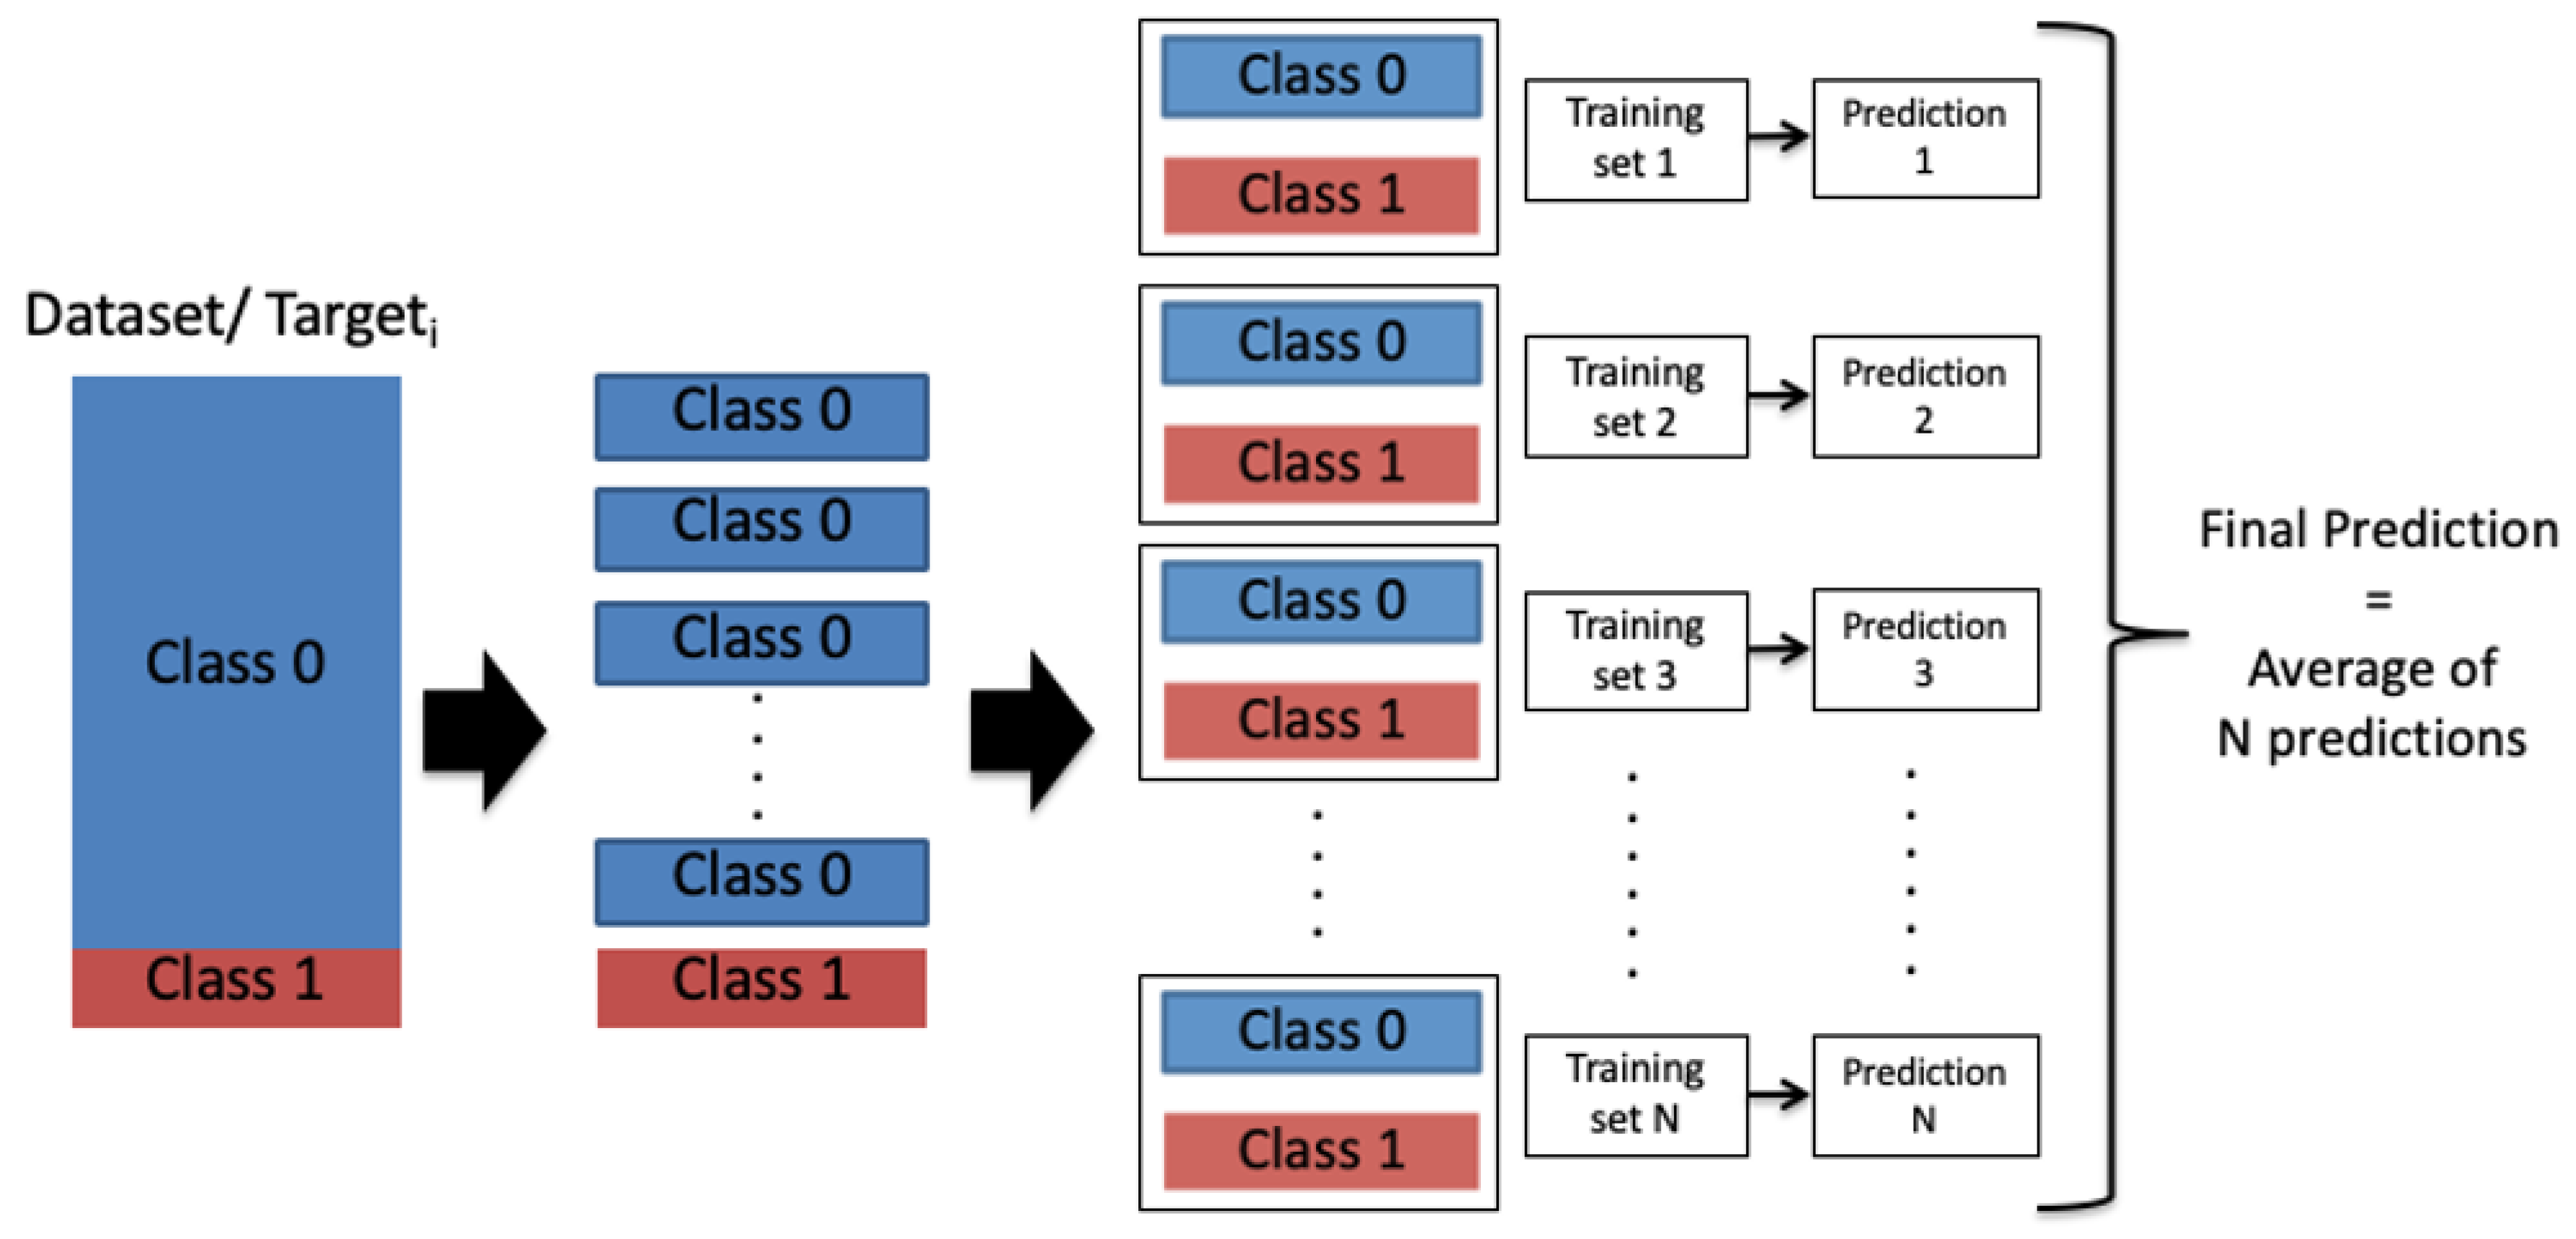
However, due to the imbalance of the output class labels, the performance of the individual CNN model toward the output class 1 was not high enough. Therefore, we proposed a model-averaging, method using a random under-sampling technique to balance the data evenly for every targeti. The training was conducted over a number of balanced subsets, where the entire dataset was divided randomly into N balanced subsets according to the minority class distribution as presented in Figure 6. N was chosen so that the division generated equally-distributed representation of the two output classes through all the targets (heart disease types), as presented in Equation (14):
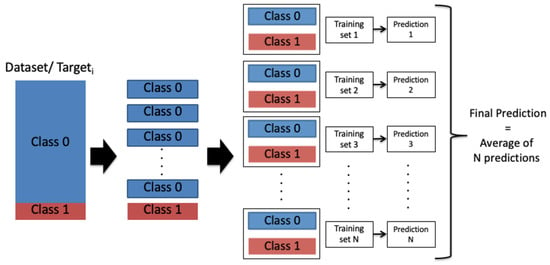
Figure 6.
Model averaging and random under-sampling framework: Class 0: A patient is not diagnosed with a heart disease type; Class 1: A patient is diagnosed with a heart disease type.
After that, the model-averaging method, which is inspired by the bagging aggregation technique, is used to train the Model 2 (i.e., CNN model) on the N subsets. Inspired by studies [76,77] that showed improvement when combining the predictions, the N single predictions were then averaged into a final prediction that represents the Prediction 2 in our ensemble-learning model framework.
5. Experimental Results
The described models were trained over the heart disease dataset, where each model predicts the class label probabilities of a given patient record. The training models present an objective function to reduce binary cross-entropy loss between the predicted and actual class labels. Experiments were conducted to select the optimal hyperparameters of the models and compare the models across the subsets of the dataset and their targets. All outlined materials and models were implemented in open source Python software.
5.1. Dataset
A collection of heart disease dataset was extracted from Medica Norte Hospital. It includes 800 records of patients that indicate several biological indicators including age, gender, systolic and diastolic blood pressure, heart rate…etc, as described in Appendix A. The dataset presents four different types of heart disease, as described in Table 1: CARDIOPATIA_HIPERTENSIVA, CARDIOPATIA_ISQUEMICA, CARDIOPATIA_MIXTA, and CARDIOPATIA_VALVULAR.

Table 1.
Description of heart disease types.
Every type is represented with a binary target variable indicating whether a patient is diagnosed with the given type of heart disease or not. Because the types are different, the distribution of each target over the records is proportionally different and significantly unbalanced as shown in Figure 7, where the class 0 (i.e., a patient is not diagnosed with a heart disease type) presents the majority class label comparing to the class 1 (i.e., a patient is diagnosed with a heart disease type).
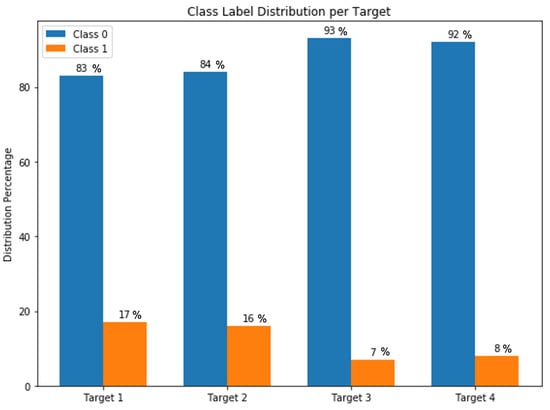
Figure 7.
Targets class label distribution.
Such a real dataset requires cleaning and preprocessing before training the binary classification models. Therefore, we removed two records that had missing values. In order to normalize the dataset, we transformed each type of categorical variables into numerical variables using different methods. For example, the “Gender” feature represents a categorical variable with no intrinsic ordering to the categories; thus, a regular integer encoding is not suitable for it because it lets the model assume a natural ordering between the categories and this may result in poor performance. In this case, a one-hot encoding was applied to the integer representation, as shown in Table 2, where the encoding removed the nominal variable “Gender” and created a new binary variable for each unique category as “Gender Female” and “Gender Male”.

Table 2.
One-hot encoding for the Gender Variable.
Moreover, for the interval variable “Age”, we categorized it into subcategories based on a proportionate interval of 20 years. Therefore, the age variable was transformed from 81 values into a five-category feature that was transformed later into a numerical variable, as described in Table 3.

Table 3.
Categorization and encoding of the Age Variable.
The entire dataset was normalized in a range of minimum and maximum scale of each feature by applying the Min-Max normalization technique. Therefore, the binary/categorical features did not change, but the nominal and ordinal features were transformed into values between 0 and 1.
Our data collection presents a large number of noisy features that a neural network classification model may learn poor correlations and affect the final performance. Data analysis showed that some features are under-represented in the data to the point that it is highly unlikely for a neural network model to learn meaningful information from it. Including these irrelevant features may lead to an overfitting problem or may increase the computation inside the network while it decides the importance of the features. Hence, the original dataset collection was preprocessed following the different features selection methods, described in Section 3, before data were fed into the neural network models. This generated several subsets with different numbers of features, where Table 4 summarizes the three different subsets resulted from every method, and their indexes according to Appendix A.

Table 4.
Features selection results.
5.2. Evaluation Metrics
The experiments were conducted for binary classification, so results are reported using the evaluation metrics accuracy (ACC), precision (P), recall (R), and F1 score. The relevant parameters are computed using the elements of the confusion matrix, true positive (tp), false positive (fp), false negative (fn), and true negative (tn), as explained in Table 5.

Table 5.
Confusion matrix parameters.
The formula for calculating accuracy (ACC), precision (P), recall (R), and F1 score (F1) is detailed is the following Equations (15)–(18):
To evaluate the accuracy of the proposed models with, we also used the AUC (Area Under the receiver operating characteristic Curve) score as the index that presents the probability that the value of a randomly example of class 0 is higher than a random example of class 1. In general, the value of AUC is between 0.5 and 1, and the higher the value of AUC is, the higher the classification accuracy and the maximum is.
5.3. Hyperparameters Setting
The proposed classification models present a list of hyperparameters that includes number of epochs, dropout rate, optimizer, learning rate, and so on. Considering their effect on the model performance, only four hyperparameters were selected for the tuning. The dataset was randomly split into a training set and a test set according to the division 20–80%. In each experiment, the neural network parameters were fixed and each hyperparameter was varied. The experiments were reported using the accuracy score and the F1 score.
5.3.1. Number of Epochs
The epoch measures the number of times the training set is selected once to update the weights. As the number of epochs increases, the model is more capable of generalizing the learning. Using a large number of epochs may cause an overfitting problem on the training set and the model would perform poorly for validation or test set. Therefore, finding the optimum number of epochs is important.
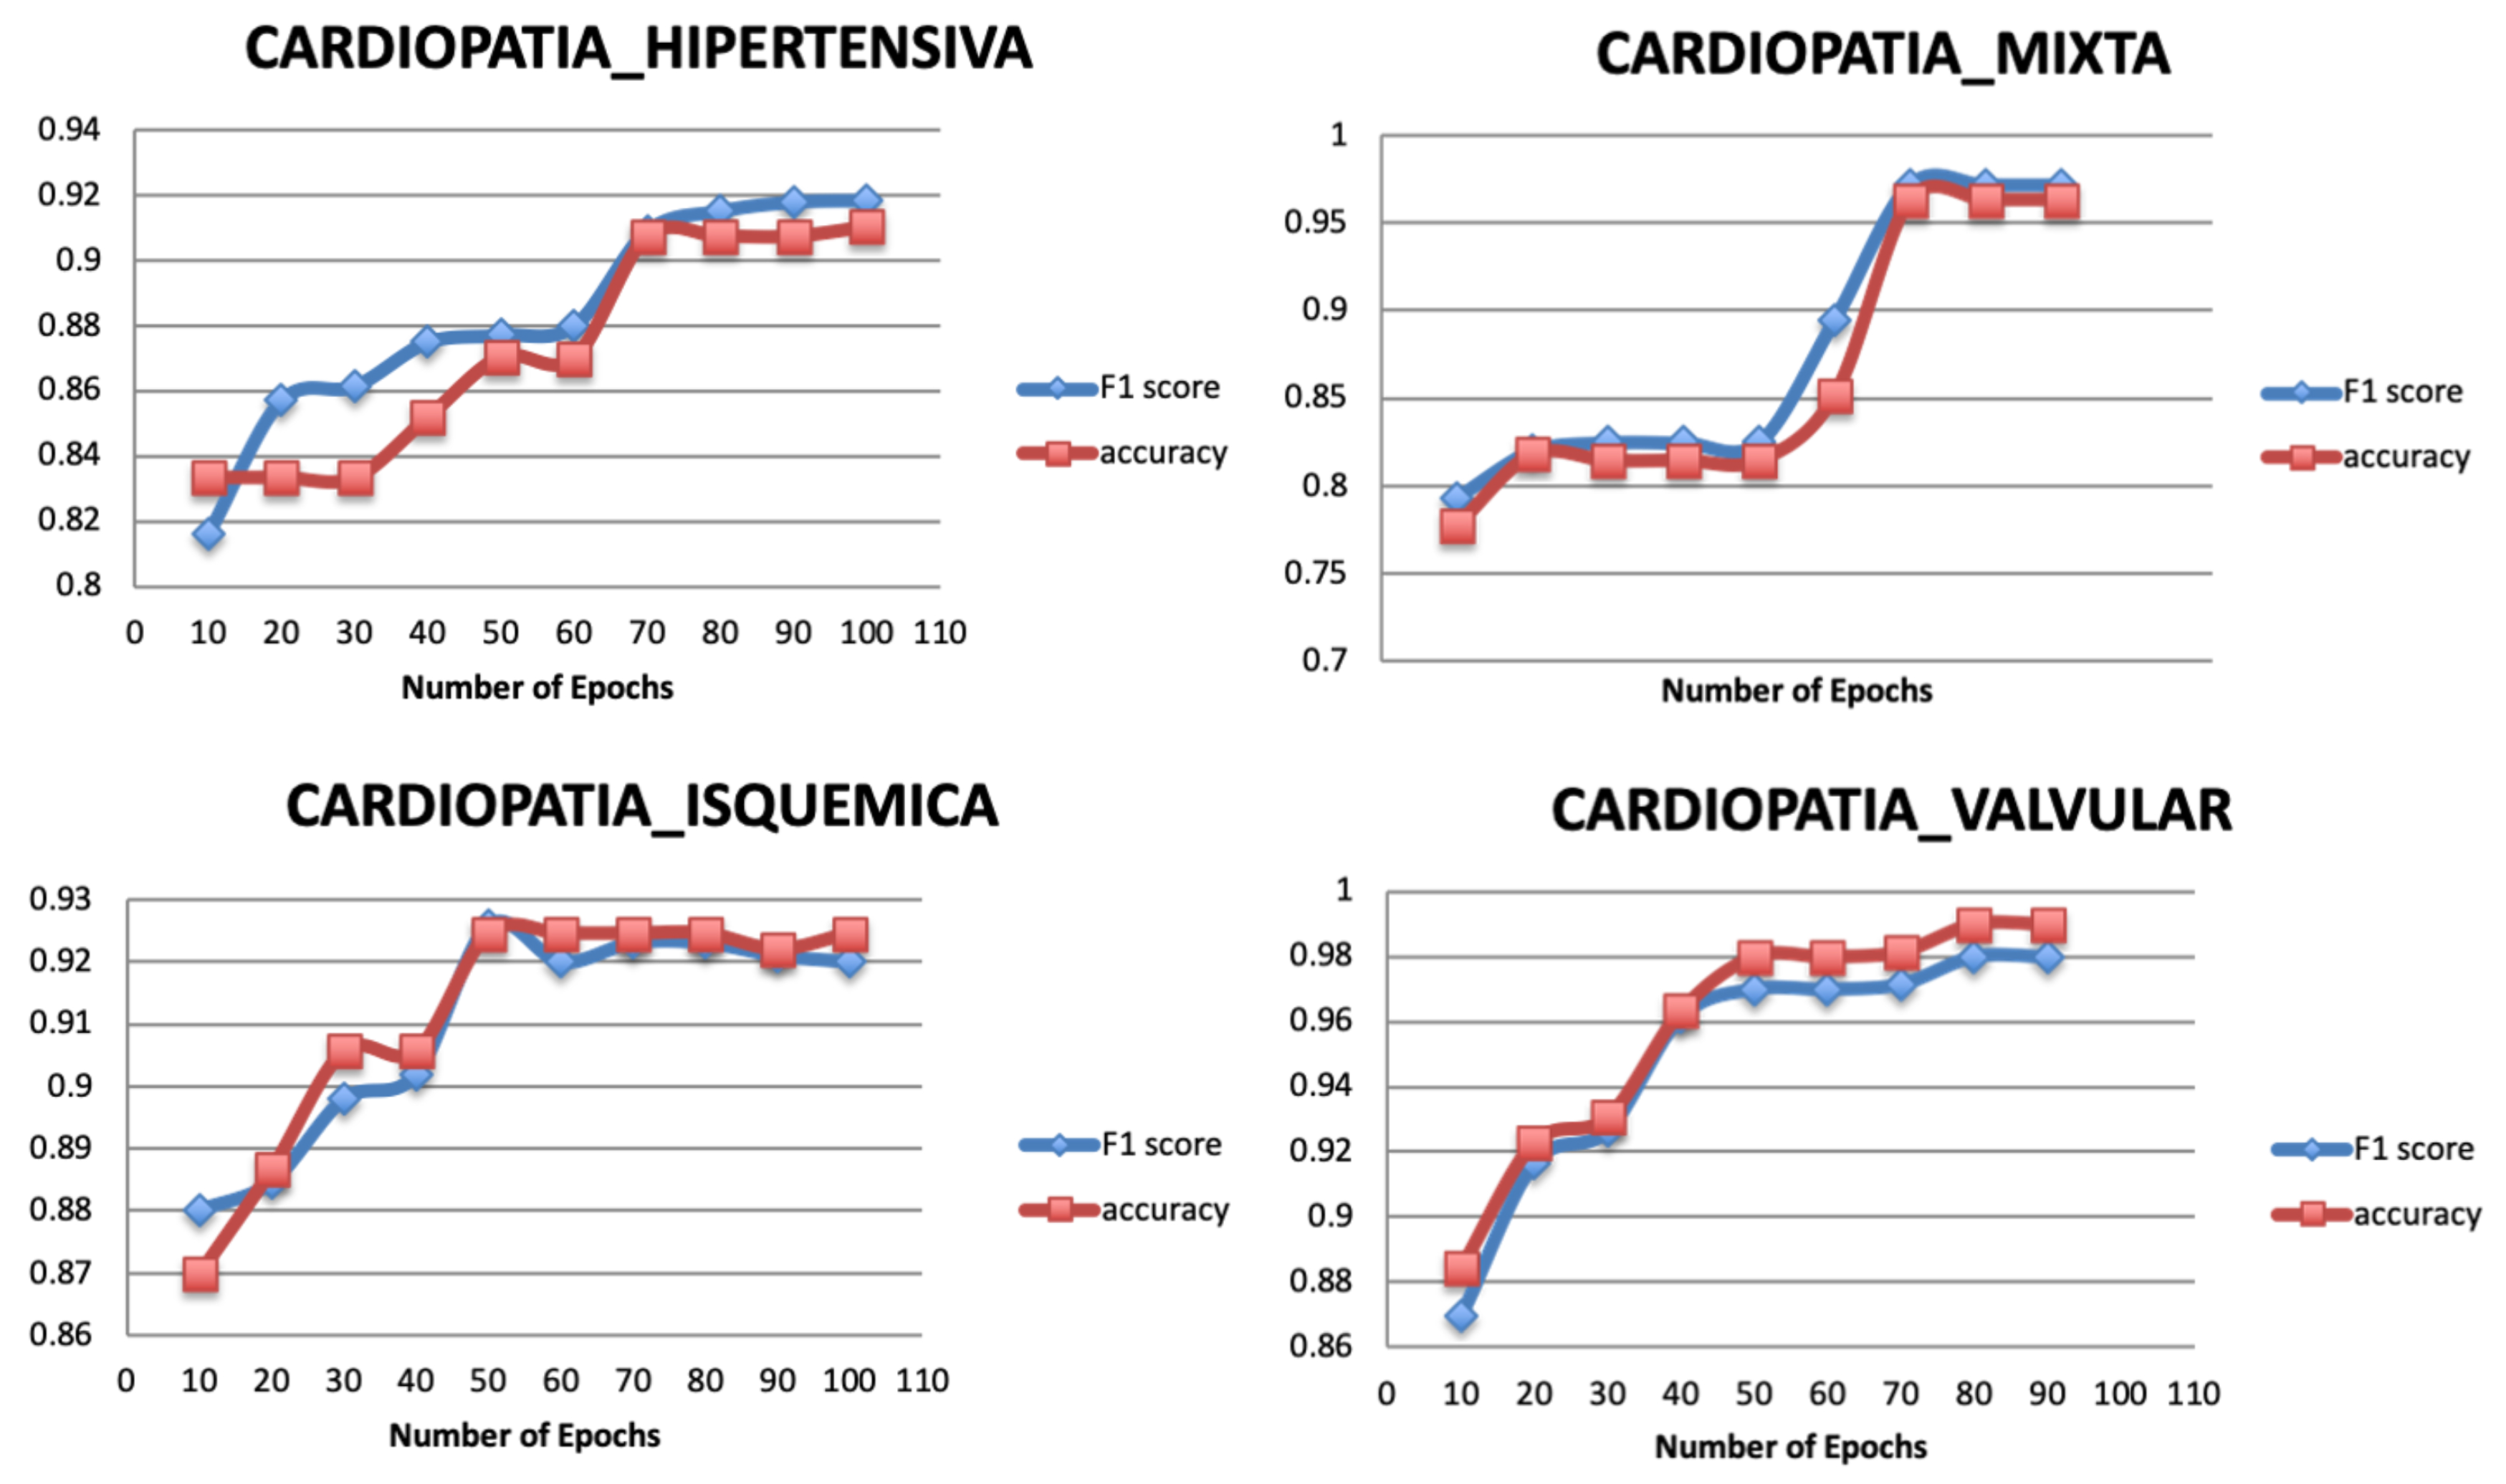
Figure 8 shows the result of varying the number of epochs for the targets of the original dataset, where the classification performance increases significantly as the number of epochs increases. The model tends to be stable after the epoch number 70 for the Target 1, 60 for the Target 3, and 50 for Target 2 and Target 4.
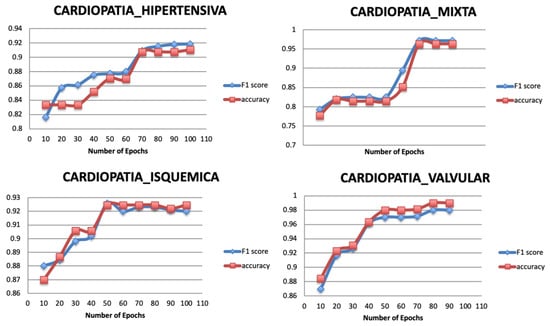
Figure 8.
Relationship between number of epochs and performance metrics.
5.3.2. Dropout Rate
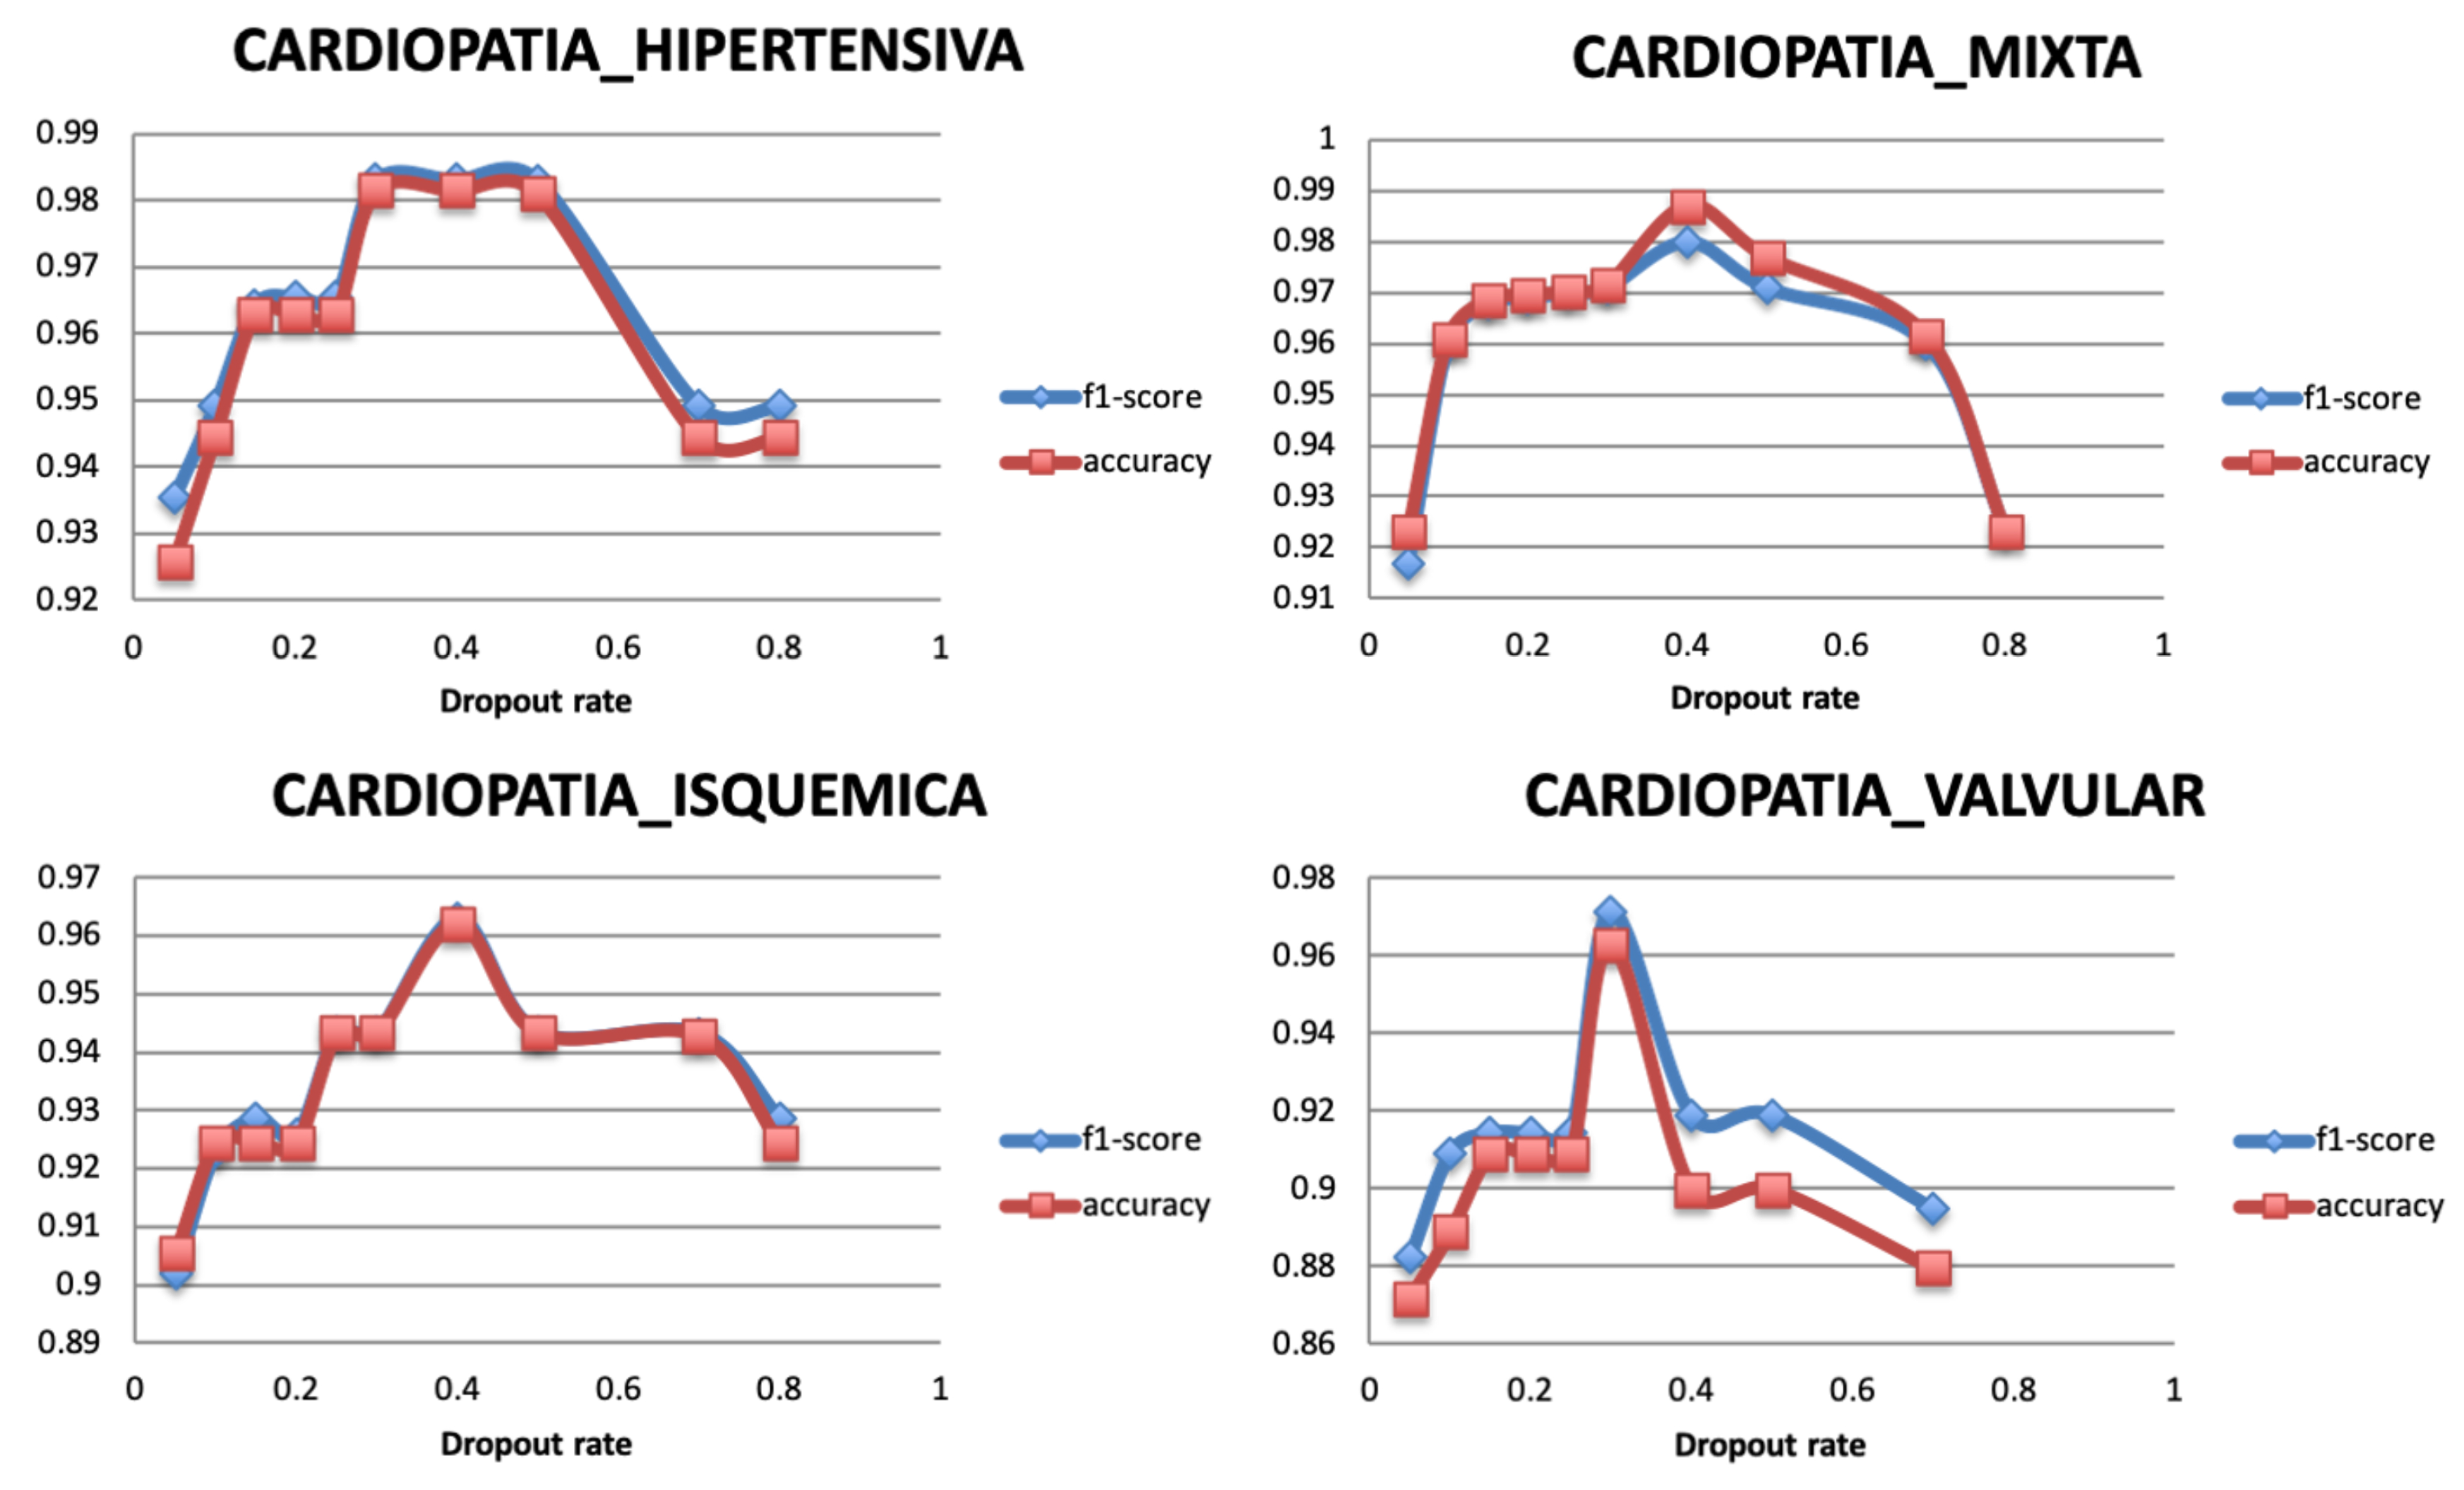
Dropout is a regularization technique used to avoid the overfitting problem and ensure the model generalization. It randomly ignores a number of layer outputs so that the training is performed with different values of output layer, and network capacity is minimized during the training phase. The dropout layer is added with a fraction of the input units to drop during the training, within a range from 0 to 1. Figure 9 shows that the model reaches the highest performance value with a value of 0.4 for all the targets.
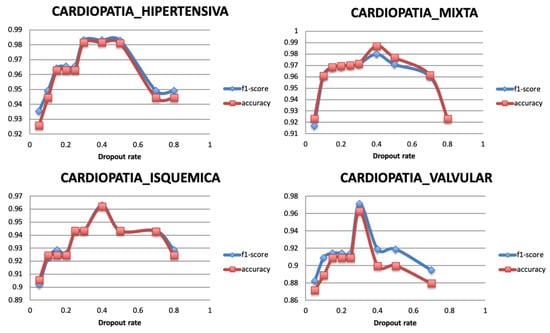
Figure 9.
Relationship between Dropout rate and Performance metrics.
5.3.3. Optimizer
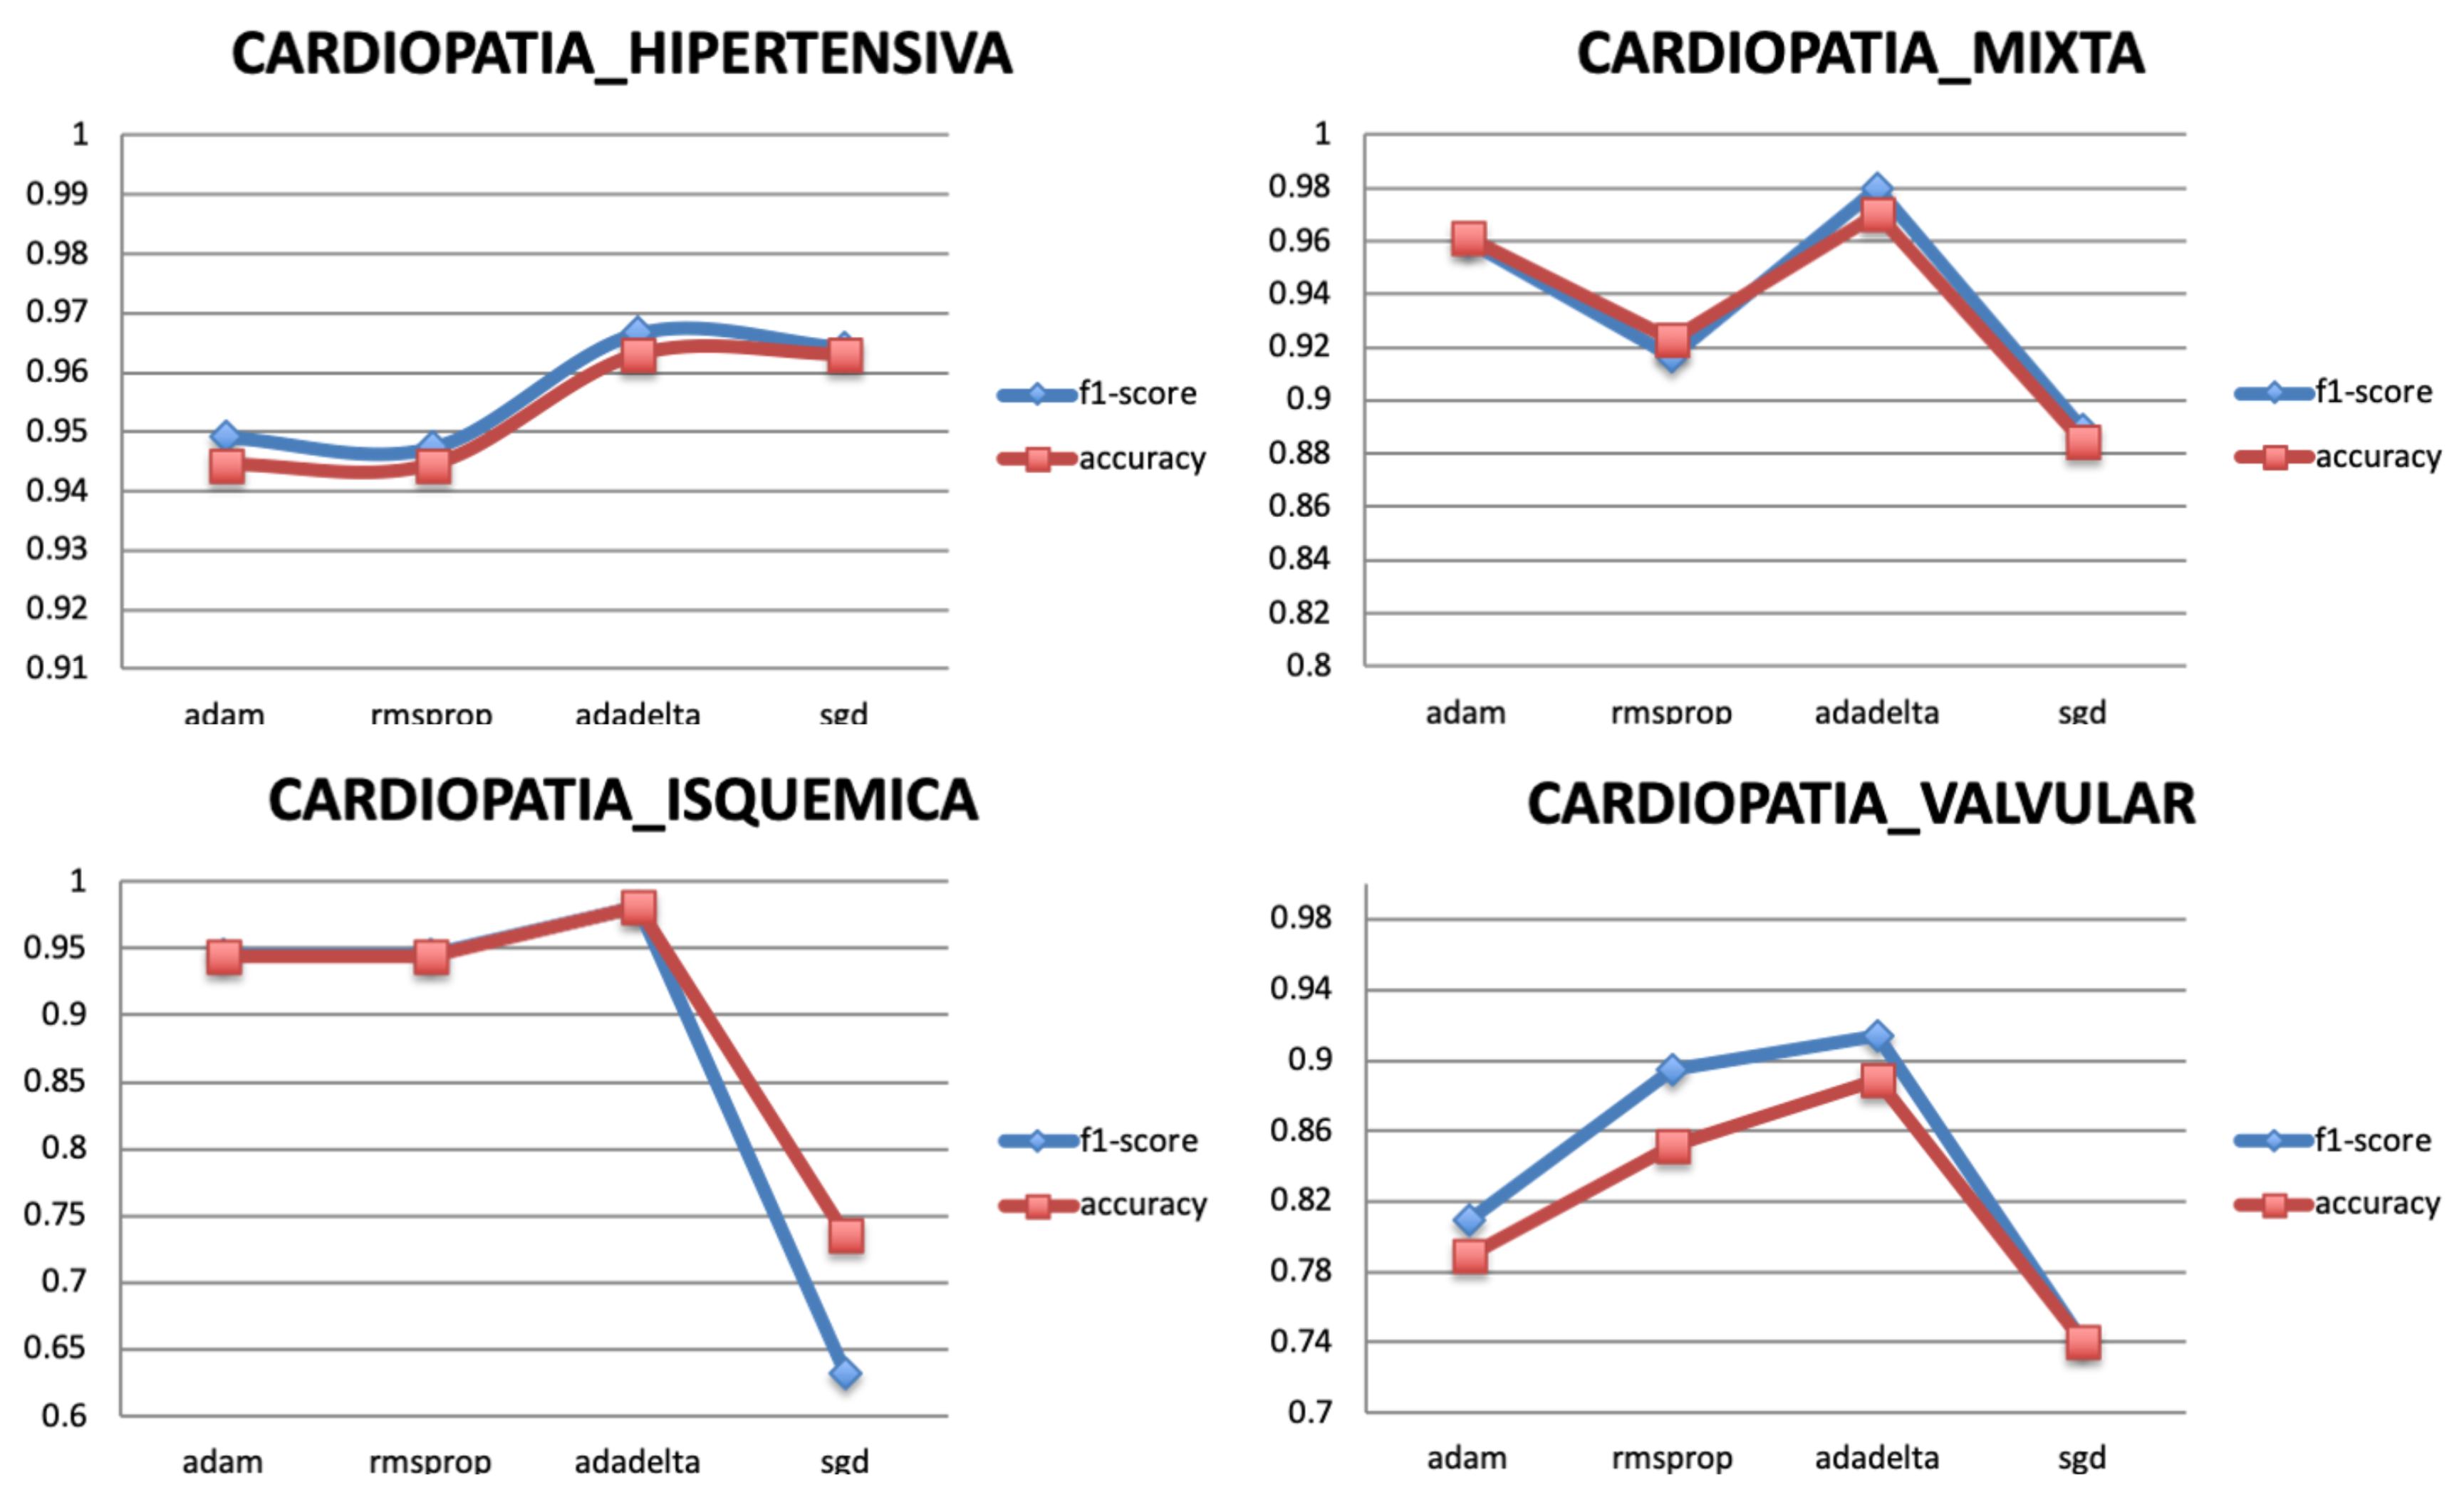
The optimization algorithms minimize the loss function of the model. They update the parameters of the gradient descent until it converges and reaches its most accurate outcome with the weights. Four popular optimizers are selected to train the model for the different targets, Adam, Adadelta, RMSprop, and SGD. Figure 10 shows that the best optimizer is Adadelta as it gives the highest classification performance for all the targets.
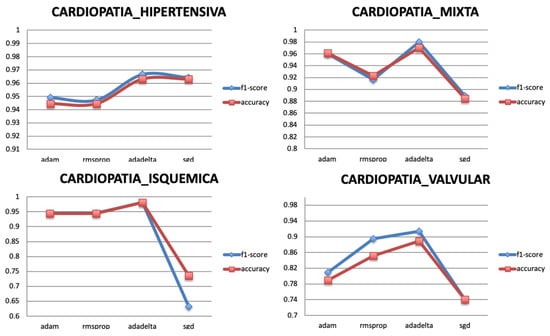
Figure 10.
Relationship between Optimizer and Performance metrics.
5.3.4. Learning Rate
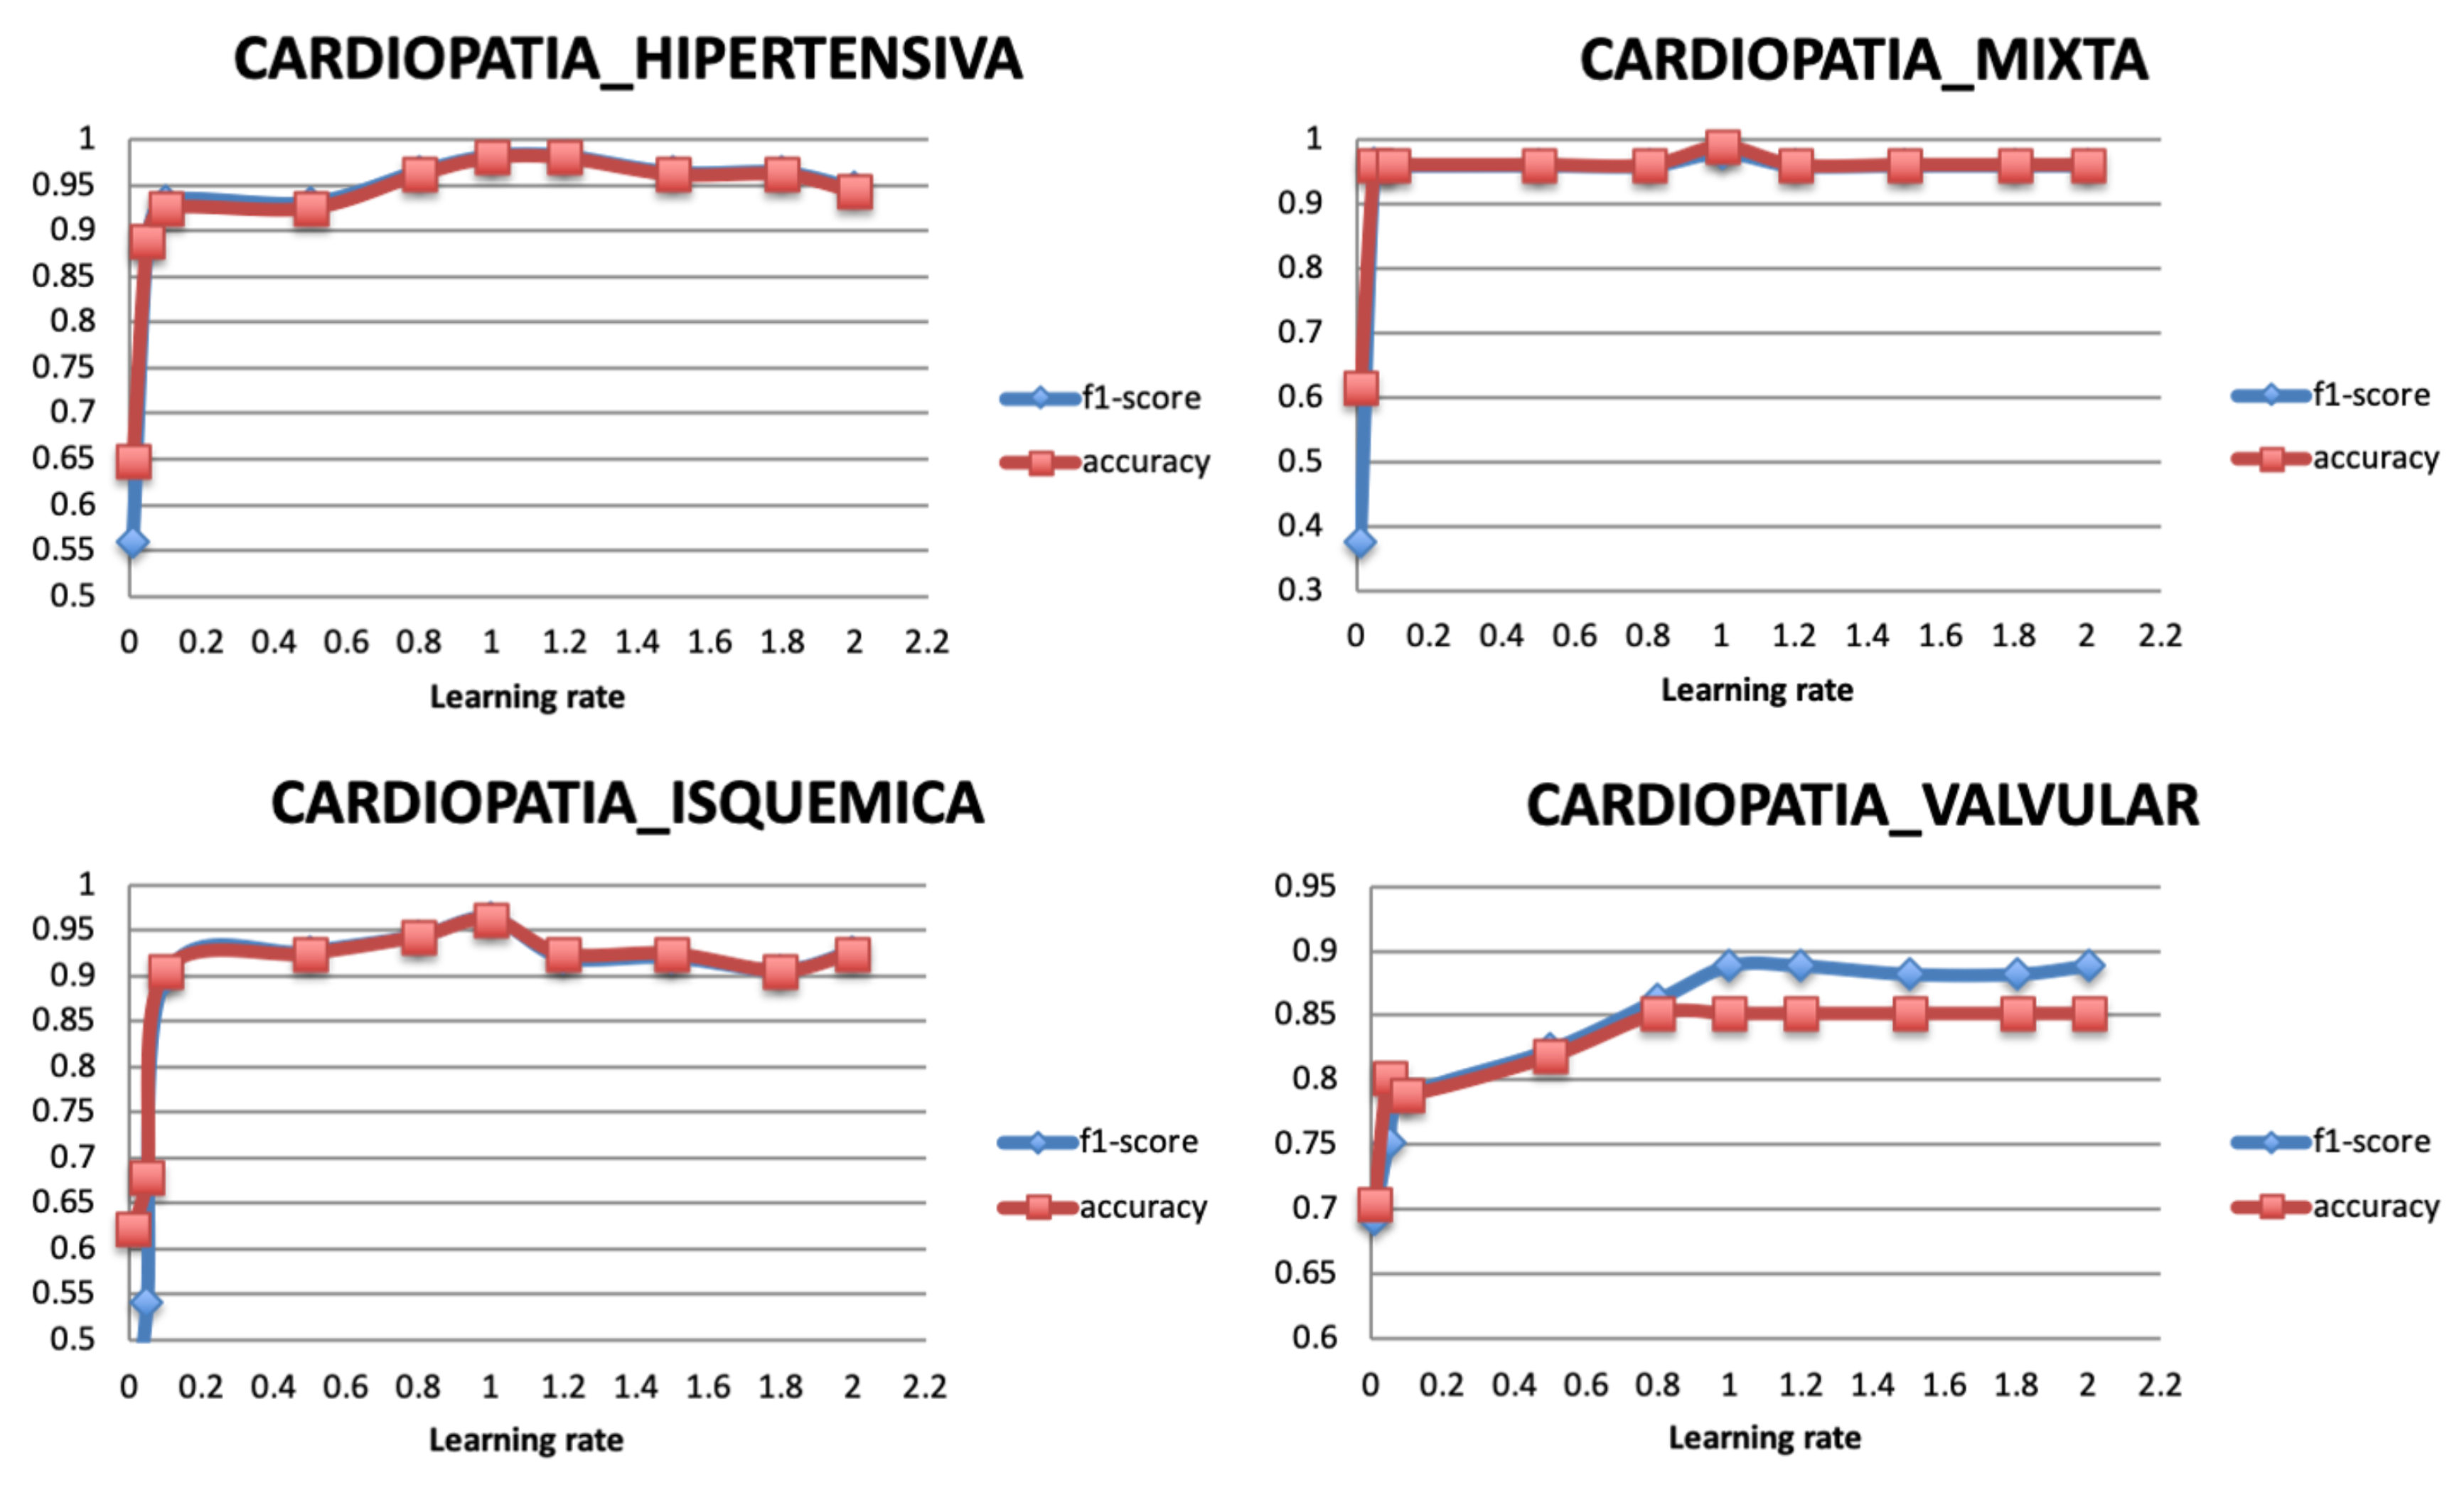
The optimization of the weights is monitored with a learning rate. Therefore, after selecting the optimal optimizer Adadelta, its learning rate is varied with values between 0 and 2. A very large value of learning rate may cause the model to exceed the optimal point, and a very small value may generate a slow training model. Figure 11 shows that the classification performance of the model becomes stable when the learning rate has the value 1. Literature reviews showed that the learning rate should be set to its default value 1 as the optimizer uses an adaptive learning rate.
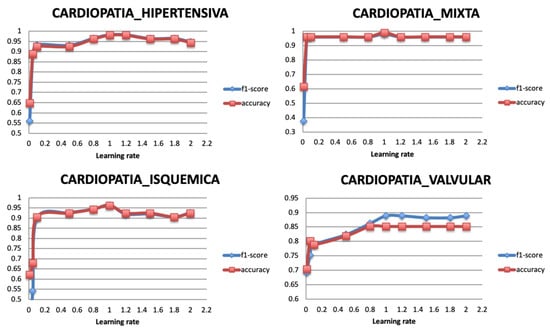
Figure 11.
Relationship between learning rate and Performance metrics.
5.4. Comparative Experiments Results
5.4.1. Classification Performance of the Single Model
Before conducting experiments for the proposed ensemble-learning framework, we first reported the performance results of the single models using the original dataset and the best selected hyperparameters.
Table 6 summarizes the empirical results of the different output targets classification, and it demonstrates the low performance of the individual models where the F1 and ACC scores achieved around maximum of 87% and 81% for Target 1, 81% for Target 2, 87% and 80% for Target 3, and 87% and 82% for Target 4. The AUC scores also reached a maximum value of 79% for Target 1 and 82% for Target 2 using the BiGRU model, 88% for Target 3 using the BiLSTM model, and 85% for Target 4 using the BiGRU model. The results also validate that MLP model had a lower classification performance than the CNN model. Furthermore, the bidirectional recurrent neural network models outperformed the unidirectional models.

Table 6.
Experimental results of the single models.
5.4.2. Comparison of the Classification Performance for Different Subsets
To select the optimal features selection among the proposed methods, the original dataset and different generated subsets are compared using one ensemble-learning model that includes CNN and LSTM models. The results of the output targets classification are reported in Table 7.

Table 7.
Experimental results of the proposed subsets.
Table 7 shows that Subset 1 reaches the highest classification performance. It contained the best 60 selected features and performed overall well for the four output targets. This was yielded by the model-based selection technique using a tree-based classifier (Random classifier) which determined the importance of the features toward the output targets. Compared to the recursive feature elimination (RFE) method, our best selected method filtered the important features by training the model one time. This did not enforce the selection of the best features similarly to the RFE method that iteratively trains the model and predicts best features one by one until it achieves a certain accuracy. Subset 1 includes some features that were not filtered by the other methods, such as Glycemic load, Increase in triglyceride concentration, Diabetes mellitus type 2, Chronic renal insufficiency, etc. (See Appendix A). This indicates that these missing features from the other subsets are high indicators for predicting the different heart disease types.
5.4.3. Comparison of the Classification Performance for Different Models
In order to validate the effectiveness of the proposed ensemble-learning model framework, different neural network models are varied and tested for different targets. The neural networks models are also compared with a baseline model SVM. Because two models should be selected for the final ensemble-learning model, Table 8 summarizes the experimental results of varying the neural network models in the ensemble-learning framework, using the selected Subset 1.

Table 8.
Experimental results of the proposed models for the ensemble-learning framework.
Table 7 indicates that F1 and ACC scores of Targets 1, 2, and 4 have the highest value using the CNN and BiLSTM models. However, experiments for Target 3 show that the combination of CNN and BiGRU models has the best F1 and ACC scores. The classification performance of LSTM and GRU is the lowest, where the maximum F1 score is around 89% for Target 1 and Target 2, and around 94% for Target 3 and Target 4. When using BiLSTM and BiGRU, which can capture the information more effectively, the F1 and ACC scores could reach around 92% and 94%. By using bidirectional recurrent neural network models instead of unidirectional models, the F1 and ACC scores are significantly improved achieving around 93% and 92% for Target 1, 92% for Target 2, 95% and 96% for Target 3, and 94% and 91% for Target 4.
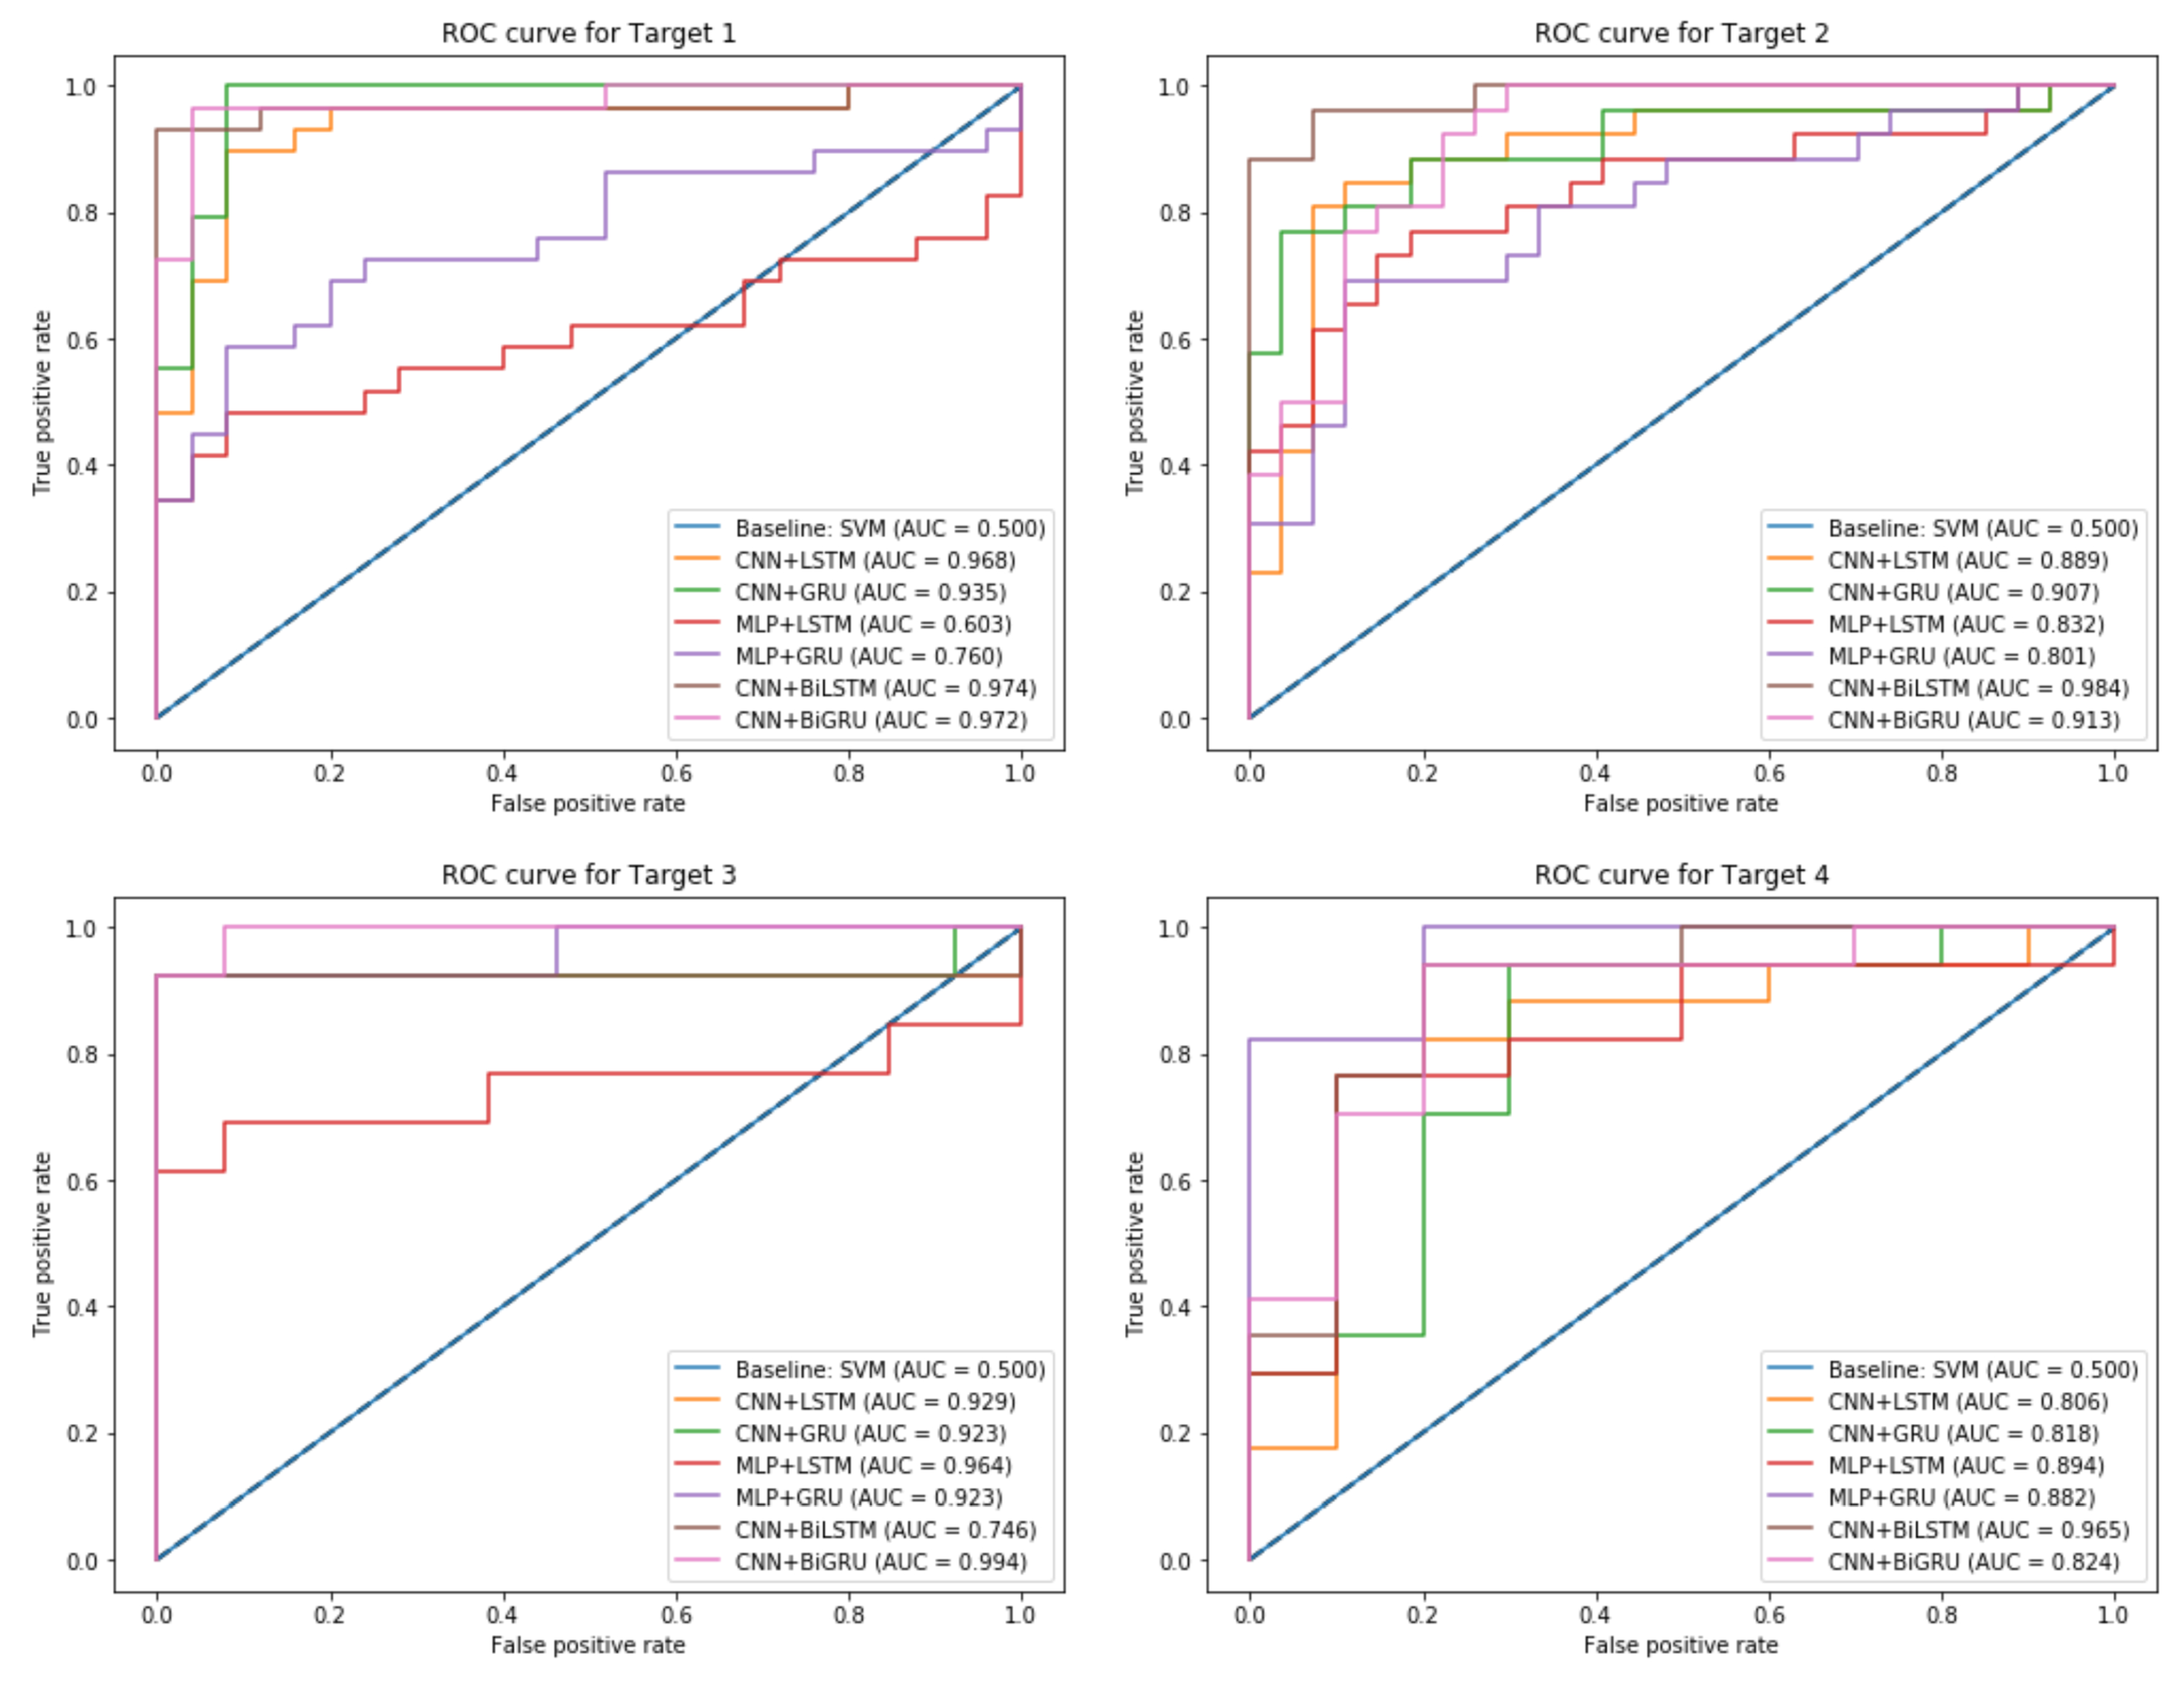
The proposed ensemble-learning framework joined two different models where each model was designated for one class. The CNN and MLP models performed well for the output class 1. However, the LSTM, GRU, BiLSTM, and BiGRU performed well for the output class 0. This difference that appeared in the performance can be explained by the fact that CNN and MLP models were designed to create a complex feature mapping by using connectivity pattern between the neurons. It appears that this was suitable for the minority output class 1. However, the remaining recurrent neural networks models (LSTM, GRU, BiLSTM, and BiGRU) were designed to benefit from the sequential dependencies between the features and the majority output class 0. The proposed ensemble-learning framework that was enhanced by the balancing method could benefit from combining the two characteristics and created a new model that had a better performance for the two output classes. Experimental results proved that the CNN model outperformed the MLP model, and this can be explained by the fact that CNN is more effective as it can go deeper. Its layers are sparsely connected rather than the fully connected hidden layers in MLP. CNN architecture is also able to optimize the number of parameters by sharing weights while conserving enough information. The BiLSTM and BiGRU models outperformed the unidirectional LSTM and GRU models. This validates the benefit of learning from the sequential orders of the features to correctly predict the output class. The bidirectional models could profit from making the prediction of the current state using the information coming from both previous steps and later time steps. Compared to the unidirectional models, BiLSTM and BiGRU models were capable of exploiting the two directional context-information from the features. The experiments also showed that our proposed models could show better results than a standard baseline model such as SVM that performed poorly for all the targets with a maximum ACC score of 68%. Comparison of the different models is illustrated in Figure 12, where each subplot shows the AUC score plot that of each target (i.e., a heart disease type).
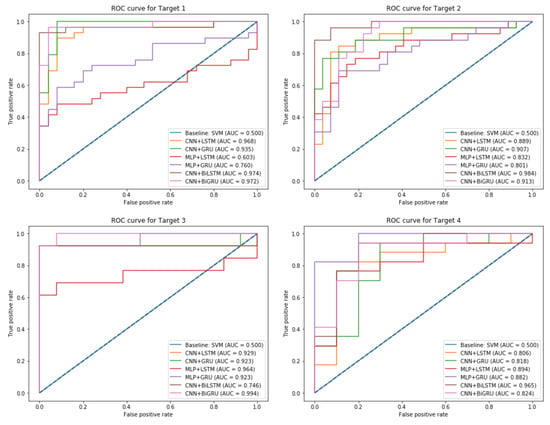
Figure 12.
ROC Curve plot and AUC score for the different output Targets.
As illustrated in Figure 12, the baseline model SVM has the lowest AUC score of 0.5 compared to the proposed ensemble-learning framework that uses different associations of neural network models. This can be explained by the lack of complex learning that a simple model can achieve for classifying such a real-dataset. The subplots explain a comparative performance of the different combinations of models for each target variable and indicates that our proposed method achieved the highest performance with a maximum AUC score of 0.97 for Target 1, 0.98 for Target 2, 0.99 for Target 3, and 0.96 for Target 4.
6. Discussion and Conclusions
In this paper, we found that binary classification of heart disease dataset is challenging in terms of size, distribution of records, and number of important features. We demonstrated that features selection techniques succeeded to properly reduce a large number of features. The target of this work is to classify four types of heart disease. However, each type has very unbalanced distribution due to the large proportion of collected records indicating patients were not diagnosed with any type of disease. Therefore, our proposed framework demonstrated a technique of averaging and random under-balancing of the records, in order to equally generate proportional dataset for building the classification models.
We tackled the classification problem by designing different neural network models. The proposed methodology framework includes unidirectional neural network including convolutional neural network and recurrent neural network architectures. From the text mining point of view [25], we presented a bidirectional recurrent neural network that outperformed the results of unidirectional models. Experiments were conducted to select the best models for every output class label. Some models were more suitable for one class label than for the other. This finding opens a way to incorporate intelligibly the models into an ensemble-learning framework that concatenates the predictions result for each class into a general prediction result.
The framework of this work was assessed on different versions of the initial dataset and within different combinations of models. This served as a validation for the methodology of the features selection and for the neural network models design. Comparing to the works [78,79], our framework does not penalize records in the dataset, but it creates an artificial balance and monotony to the training dataset. Nevertheless, the designed models achieved a high classification performance, despite the quality of our structured dataset.
Moreover, this work does not use a benchmark dataset to validate the proposed methodology. The classification performance of the suggested models may noticeably change if the size of the dataset and the records distribution increases. While the features selection is related to the target variables, the original number of features can be robustly reduced for a larger dataset without integrating the independent variables. We presented a comparison of the proposed methodology with SVM as a baseline model, showing its low classification performance against the neural network models.
The significance of this work to the clinical domain rests on the ability of advanced deep learning models to adapt to a small collection of patient records. As a result, the suggested methodology framework connects every category of records to the appropriate model, and then concatenates their results into a final diagnosis. This approach is able to achieve accurate diagnosis in case of unbalanced distribution of health records.
Future works may include implementing other designs of neural networks such as Generative Adversarial Network (GAN) or Attention-based Recurrent Neural Network. This will give a better insight into the behavior of the prediction of different types of heart disease. Moreover, converting the binary classification of each output target into a multi-label classification task may be considered for our dataset in order to solve its imbalance and maintain its structure.
Author Contributions
Conceptualization, A.B.; Data curation, C.C.O.; Methodology, A.B.; Project administration, B.G.-Z.; Supervision, A.E.; Validation, B.G.-Z. and A.E.; Writing—original draft, A.B.; Writing—review & editing, B.G.-Z. All authors have read and agreed to the published version of the manuscript.
Funding
This research was funded by grant GV IT-905-16.
Acknowledgments
The authors gratefully acknowledge the support from Dr. Jose Juan Parcero, working in Medica Norte Hospital for providing the dataset and assisting on the clinical part of the research and to the grant GV IT-905-16.
Conflicts of Interest
The authors declare no conflict of interest.
Appendix A
| Index | Variables | Description |
| 1 | Age | |
| 2 | Gender Female | |
| 3 | Gender Male | |
| 4 | TA_sist | Systolic Blood Pressure |
| 5 | TA_dist | Diastolic Blood Pressure |
| 6 | FC | Heart Rate |
| 7 | Col | cholesterol |
| 8 | LDL | lipoproteins- bad |
| 9 | HDL | high density lipoprotein |
| 10 | TG | Triglycerides |
| 11 | HVI | Left ventricular hypertrophy |
| 12 | GL | Glycemic load (day value) |
| 13 | Peso | |
| 14 | HAS | Systolic Arterial Hypertension |
| 15 | HAS_REACTIVA | |
| 16 | HAS_limitrofe | |
| 17 | HAScFondo | |
| 18 | PRE-HAS | |
| 19 | Dislipidemia | It is the presence of abnormal elevation of fat concentration in the blood (cholesterol, triglycerides, HDL and LDL cholesterol). |
| 20 | Dislipidemia_aterogenica | is a triad of lipoprotein alterations characterized by elevated triglycerides (<150 mg/dL), low HDL cholesterol (<40 mg/dL in men and <50 mg/dL in women) and a greater presence of small LDL particles and dense that is associated with an elevated cardiovascular risk |
| 21 | Dislipidemia_hipercolesterolemia | Increases in triglyceride concentrations |
| 22 | Dislipidemia_mixta | is a lipid and lipoprotein alteration associated with elevated cardiovascular risk and characterized by the joint presence of hypercholesterolemia and hypertriglyceridemia, with elevations of cholesterol linked to very low density lipoproteins (cVLDL) and low density lipoprotein cholesterol (LDLc) |
| 23 | DM2 | Diabetes_melitus 2 |
| 24 | Diabetes_melitus | |
| 25 | Pre-Diabetes | |
| 26 | ObesidadI | |
| 27 | ObesidadII | |
| 28 | ObesidadIII | |
| 29 | CARDIOANGIOESCLEROSIS | It consists of an increase in collagen fibers and acid mucopolysaccharides and a decrease in elastic and smooth muscle fibers. These alterations produce an arterial ectasia with loss of elasticity, as can be seen in the aorta of the elderly. |
| 30 | HIPOTIROIDISMO | occurs when the thyroid gland does not produce enough thyroid hormone to meet the body’s needs |
| 31 | HIPOTIROIDISMO_SUBCLINICO | it is an alteration in the function of the thyroid gland that has few symptoms or very nonspecific and that is detected in a blood test when high TSH values (above the reference range of the laboratory) but with a normal free T4. |
| 32 | BRADICARDIA | it supposes the emission, on the part of the sinus node, of less than 60 ppm (pulsations per minute), or its lack of total function, in which case the frequency that takes control is that of the atrioventricular nodule, of about 45–55 ppm, approximately. |
| 33 | BRADICARDIA_EXTREMA | coronary heart disease |
| 34 | TAQUIARRITMIA | (heart rate> 100 bpm) occurring ’above’ the ventricles, ie in the atria or atrioventricular node |
| 35 | TAQUICARDIA_COMPENSADORA | |
| 36 | TAQUICARDIA_REFLEJA_REACTIVA | |
| 37 | TAQUICARDIA_SAPRAVENTRICULAR | they are arrhythmias with a heart rate higher than 100 bpm that originate in the atria or atrioventricular node |
| 38 | TAQUICARDIA_SINUSAL | It consists of a heart rhythm originated and driven normally, but with a heart rate higher than usual. It is physiological and occurs due to anxiety, exercise, anemia, alcohol consumption, heart failure or nicotine. In general, it does not require specific treatment, but the cause must be acted upon: quitting tobacco, correcting anemia, etc. |
| 39 | TAQUICARDIA_SINUSAL_REACTIVA | |
| 40 | TSVP | Paroxysmal supraventricular tachycardia |
| 41 | ANGOR_PECTORIS | is a pain and disease of the coronary arteries, usually of an oppressive nature, located in the retrosternal area, caused by insufficient blood supply (oxygen) to the cells of the heart muscle. |
| 42 | INSUFICIENCIA TRICUSPIDEA | Its most frequent cause is dilatation of the right ventricle. It does not usually produce signs or symptoms, although severe tricuspid regurgitation can cause cervical pulsations, a holosystolic murmur, and heart failure induced by right ventricular dysfunction or atrial fibrillation. |
| 43 | INSUFICIENCIA_MITRAL | Also known as mitral regurgitation, it is a disorder of the mitral valve of the heart, characterized by reflux of blood from the left ventricle to the left atrium during systole. |
| 44 | INSUFICIENCIA_VENOSA_LINFATICA | It is a condition in which the veins have problems returning blood from the legs to the heart. |
| 45 | INSUFICIENCIA_VENOSA_PERIFERICA | Is a disease in which the venous return is difficult, especially in standing, and in which the venous blood flows back in the opposite direction to the normal, that is, in the case of the lower limbs, it circulates from the deep venous system to the superficial one. |
| 46 | FA_PAROXISTICA | It is the most frequent sustained cardiac arrhythmia. |
| 47 | HIPOTENSION_ORTOSTATICA | It is defined as the inability of the body to regulate blood pressure quickly. It is produced by sudden changes in body position (from lying down to standing). It usually lasts a few seconds or minutes and can cause fainting. |
| 48 | HIPOTENSION_POSTURAL | It is a form of low blood pressure that occurs when you stand up after sitting or lying down. Orthostatic hypotension can make you feel dizzy or dazed, and you can even faint |
| 49 | ANSIEDAD | Mental state characterized by great restlessness, intense excitement and extreme insecurity. |
| 50 | SX_METABOLICO | Is a group of conditions that put you at risk of developing heart disease and type 2 diabetes? These are High blood pressure. Glucose (a type of sugar) high in the blood |
| 51 | ANGIODISPLASIA_INTESTINAL | It is a small malformation that causes dilation and vascular fragility of the colon, resulting in an intermittent loss of blood from the intestinal tract. The lesions are often multiple and often involve the blind or the colonascent, although it can occur in other areas. |
| 52 | ANEMIA | A syndrome that is characterized by an abnormal decrease in the number or size of red blood cells in your blood or in your hemoglobin level |
| 53 | ANEMIA_CRONICA | is a type of anemia found in people with certain long-term (chronic) conditions that involve inflammation. |
| 54 | SOPLO | The heart has valves that close with each heartbeat, which causes the blood to flow in only one direction. The valves are located between the chambers. The murmurs can happen for many reasons, for example: When a valve does not close well, and the blood is returned (regurgitation) |
| 55 | HIPERURICEMIA | Increase in the amount of uric acid in the blood |
| 56 | CIC | Chronic ischemic heart disease |
| 57 | IRC | Chronic renal insufficiency |
| 58 | DISFUNCION_SISTOLICA | It refers to a clinical syndrome characterized by signs and / or symptoms of heart failure in the context of a structural heart disease that causes a decrease in the contractile function of the left ventricle |
| 59 | ARRITMIA | It is a disorder of the heart rate (pulse) or heart rate. The heart may beat too fast (tachycardia), too slow (bradycardia), or irregularly |
| 60 | ARRITMIA_CARDIACA | |
| 61 | ARRITMIA_SINUSAL | Is the variation of the heart rate of the sinus node with the respiratory cycle? |
| 62 | ARRITMIA_VENTRICULAR | Is a heart rhythm disorder (arrhythmia) caused by abnormal electrical signals in the lower chambers of the heart (ventricles)? |
| 63 | CALCIFICACION_CORONARIA | A passive and degenerative process that frequently occurred with advanced age, atherosclerosis, several metabolic alterations (such as diabetes mellitus and final stages of kidney disease), and in rare genetic diseases. |
| 64 | PROSTATISMO | when it causes urinary retention |
| 65 | UROPATIA_OBSTRUCTIVA | It occurs when urine cannot be drained through the urinary tract. The urine is returned to the kidney and causes it to swell. This condition is known as hydronephrosis. Obstructive uropathy can affect one or both kidneys |
| 66 | TROMBOFLEBITIS | It is an inflammatory process that causes blood clots to form that produce blockages in one or more veins, in general, in the legs. The affected vein may be near the surface of the skin (thrombophlebitis superficial) or at a deep level of a muscle (deep vein thrombosis). |
| 67 | TROMBOSIS | Colloquially called blood clot, it is the final product of the blood coagulation stage in hemostasis. There are two components in a thrombus: aggregate platelets and red blood cells that form a plug, and a mesh of reticulated fibrin protein |
| 68 | ATEROMATOSIS | It is a multifactorial inflammatory process that affects the wall of the arteries, has a long clinical evolution, and manifests itself in highly evolved stages causing a cardiovascular event |
| 69 | ESTEATOSIS | fatty liver disease |
| 70 | FIBROSIS_PULMONAR | Is a condition in which the tissue in the lungs heals and, therefore, becomes thick and hard. This causes difficulties when breathing and it is possible that the blood does not receive enough oxygen |
| 71 | COLITIS | is an inflammatory bowel disease that causes lasting inflammation and ulcers (sores) in the digestive tract |
| 72 | HIPERCOLESTEROLEMIA | Increase in the normal amount of cholesterol in the blood |
| 73 | FARINGOAMIGDALITIS | Is the acute infection of the pharynx or the palatine tonsils? Symptoms may include angina, dysphagia, cervical lymphadenopathy, and fever. The diagnosis is clinical, complemented by culture or rapid antigenic testing. |
| 74 | DIVERTICULAR | It is a condition that occurs when small bags or sacs are formed that push outward through the weak points in the wall of your colon. Diverticulosis can also cause problems such as diverticular bleeding and diverticulitis. |
| 75 | CEFALEA_CRONICA | headache |
| 76 | CEFALE_VASOMOTORA | tension headache |
| 77 | ANEURISMA_RENAL | The etiology is usually related to fibromuscular dysplasia, arteriosclerosis of the renal artery, which may be congenital, associated with arteritis, or with a traumatic history. |
| 78 | LITIASIS_RENAL | |
| 79 | ALZHEIMER | |
| 80 | EPOC | Chronic obstructive pulmonary disease (COPD) is a chronic inflammatory disease of the lungs that obstructs the flow of air from the lungs. Symptoms include shortness of breath, cough, mucus production (sputum) and whistling when breathing. |
| 81 | ACALASIA_ESOFAGICA | This is called the lower esophageal sphincter (LES). Normally, this muscle relaxes when you swallow to let food pass into the stomach. In people with achalasia, this muscle ring does not relax so well. In addition, the normal muscular activity of the esophagus (peristalsis) is reduced. |
| 82 | CANDIDIASIS_ESOFAGICA | It refers to the infection of the oral mucosa. Candida is responsible for the majority of oral fungal infections and C. albicans is the main causative species of infection. The infection can spread to the esophagus causing esophageal candidiasis. |
| 83 | RAYNAUD | Is a rare disorder of the blood vessels that usually affects the fingers and toes? |
| 84 | ORTOSTATISMO | It is a drop in blood pressure that comes because of a person having been standing for a long time or when standing after sitting or lying down. |
| 85 | HEPATITIS_C | |
| 86 | CREST | It is a limited form of scleroderma. In this modality of the entity, it is typical that Raynaud’s syndrome precedes the presentation of the rest of the disease symptoms in years. |
| 87 | GLAUCOMA | is an eye disease that steals your vision gradually |
| 88 | DISFUNCION_ERECTIL | |
| 89 | HIPPERPARATIROIDISMO | is an alteration that consists of the parathyroid glands secreting a greater amount of parathyroid hormone, regulator of calcium, magnesium, and phosphorus in the blood and bone |
| 90 | RESEQUEDAD_VAGINAL | |
| 91 | TABAQUISMO_CRONICO | |
| 92 | STENT | (coronary artery stent) is a small tube of metal mesh that expands inside a heart artery |
| 93 | FA_CRONICA | chronic arterial frequency |
| 94 | ICVV | diastolic heart failure |
| 95 | AORTA_BIVALVA | It regulates the flow of blood from the heart to the aorta. The aorta is the largest blood vessel that carries oxygen-rich blood to the heart |
| 96 | AASV | extracorporeal, more invasive or implantable ventricular assist devices (AAV)—AASVs divert the patient’s circulation so that they completely discharge the ventricle (blood is taken from the atrium or directly from the injured ventricle and recast in the aorta or AP) |
| 97 | ITG | Impaired glucose tolerance. |
| 98 | LES | Systemic lupus erythematosus (SLE) is an inflammatory disease |
| 99 | Aldactone_25 | Drugs |
| 100 | Almetec_tri | |
| 101 | Aspirina_100 | |
| 102 | Aspirina_81 | |
| 103 | AspirinaInf | |
| 104 | Atacand_8mg | |
| 105 | Atacand_16mg | |
| 106 | Angiotrofin_30mg | |
| 107 | Atorvastatina_41 | |
| 108 | Atozet_10 | |
| 109 | Atozet_40 | |
| 110 | Biconcor_6 | |
| 111 | Centrum_performance | |
| 112 | Co-Enzyme_401 | |
| 113 | Concor_11 | |
| 114 | CONCOR_2.6 | |
| 115 | Cordarone_201 | |
| 116 | Crestor_41 | |
| 117 | Daflon_501 | |
| 118 | Diltiazem_121 | |
| 119 | DUOALMETEC_41 | |
| 120 | Elantan_21 | |
| 121 | Elicuis_6 | |
| 122 | Espironolactona_26 | |
| 123 | Eutirox_100 | |
| 124 | Eutirox_75 | |
| 125 | HALCION_0.26 | |
| 126 | Insulina_tresiba | |
| 127 | Jardianz_6 | |
| 128 | Jardianz_Duo | |
| 129 | Carnitine_501 | |
| 130 | Lanoxin_0.26 | |
| 131 | Lipitor_81 | |
| 132 | Metformina_500 | |
| 133 | Metformina_850 | |
| 134 | Miccil_2 | |
| 135 | Norfenon_301 | |
| 136 | Omega_3.1001 | |
| 137 | Procorolan_6 | |
| 138 | Telmisartan_81 | |
| 139 | Trulicity_1.6 | |
| 140 | Trulicity_2.6 | |
| 141 | VYTORIN_11 |
References
- Mozaffarian, D.; Benjamin, E.J.; Go, A.S.; Arnett, D.K.; Blaha, M.J.; Cushman, M.; Howard, V.J. Heart disease and stroke statistics-2016 update a report from the American Heart Association. Circulation 2016, 133, e38–e48. [Google Scholar]
- Trifirò, G.; Pariente, A.; Coloma, P.M.; Kors, J.A.; Polimeni, G.; Miremont-Salamé, G.; Caputi, A.P. Secondary use of EHR: Data quality issues and informatics opportunities. Pharmacoepidemiol. Drug Saf. 2009, 18, 1176–1184. [Google Scholar] [PubMed]
- Botsis, T.; Hartvigsen, G.; Chen, F.; Weng, C. Data mining on electronic health record databases for signal detection in pharmacovigilance: Which events to monitor. Summit Transl. Bioinform. 2010, 1, 1176–1184. [Google Scholar]
- Birkhead, G.S.; Klompas, M.; Shah, N.R. Uses of electronic health records for public health surveillance to advance public health. Annu. Rev. Public Health 2015, 36, 345–359. [Google Scholar] [CrossRef]
- Impedovo, D.; Pirlo, G.; Vessio, G. Dynamic handwriting analysis for supporting earlier Parkinson’s disease diagnosis. Information 2018, 9, 247. [Google Scholar] [CrossRef]
- Kumar, S.; Singh, M. Big data analytics for healthcare industry: Impact, applications, and tools. Big Data Min. Anal. 2018, 2, 48–57. [Google Scholar] [CrossRef]
- Wang, G.; Li, W.; Zuluaga, M.A.; Pratt, R.; Patel, P.A.; Aertsen, M.; Vercauteren, T. Interactive medical image segmentation using deep learning with image-specific fine tuning. IEEE Trans. Med Imaging 2018, 37, 1562–1573. [Google Scholar] [CrossRef]
- Zhang, J.; Kowsari, K.; Harrison, J.H.; Lobo, J.M.; Barnes, L.E. Patient2vec: A personalized interpretable deep representation of the longitudinal electronic health record. IEEE Access 2018, 6, 65333–65346. [Google Scholar] [CrossRef]
- Shin, H.C.; Roth, H.R.; Gao, M.; Lu, L.; Xu, Z.; Nogues, I.; Summers, R.M. Deep convolutional neural network for computer-aided detection: CNN architectures, dataset characteristics and transfer learning. IEEE Trans. Med Imaging 2016, 35, 1285–1298. [Google Scholar] [CrossRef]
- Ghoniem, R.M. A Novel Bio-Inspired Deep Learning Approach for Liver Cancer Diagnosis. Information 2020, 11, 80. [Google Scholar] [CrossRef]
- Nikhar, S.; Karandikar, A.M. Prediction of heart disease using machine learning algorithms. Int. J. Adv. Eng. Manag. Sci. 2016, 2, 1275–1278. [Google Scholar]
- Abdar, M.; Książek, W.; Acharya, U.R.; Tan, R.S.; Makarenkov, V.; Pławiak, P. A new machine learning technique for an accurate diagnosis of coronary artery disease. Comput. Methods Programs Biomed. 2019, 179, 104992. [Google Scholar] [CrossRef] [PubMed]
- Maglogiannis, I.; Loukis, E.; Zafiropoulos, E.; Stasis, A. Support vectors machine-based identification of heart valve diseases using heart sounds. Comput. Methods Programs Biomed. 2009, 95, 47–61. [Google Scholar] [CrossRef] [PubMed]
- Tjahjadi, H.; Ramli, K. Noninvasive Blood Pressure Classification Based on Photoplethysmography Using K-Nearest Neighbors Algorithm: A Feasibility Study. Information 2020, 11, 93. [Google Scholar] [CrossRef]
- Shickel, B.; Tighe, P.J.; Bihorac, A.; Rashidi, P. Deep EHR: A survey of recent advances in deep learning techniques for electronic health record (EHR) analysis. IEEE J. Biomed. Health Inform. 2017, 22, 1589–1604. [Google Scholar] [CrossRef]
- Miotto, R.; Wang, F.; Wang, S.; Jiang, X.; Dudley, J.T. Deep learning for healthcare: Review, opportunities and challenges. Brief. Bioinform. 2017, 19, 1236–1246. [Google Scholar] [CrossRef]
- Rajamhoana, S.P.; Devi, C.A.; Umamaheswari, K.; Kiruba, R.; Karunya, K.; Deepika, R. Analysis of neural networks based heart disease prediction system. In Proceedings of the 2018 11th International Conference on Human System Interaction (HSI), Gdańsk, Poland, 4–6 July 2018; pp. 233–239. [Google Scholar]
- Acharya, U.R.; Oh, S.L.; Hagiwara, Y.; Tan, J.H.; Adam, M.; Gertych, A.; San Tan, R. A deep convolutional neural network model to classify heartbeats. Comput. Biol. Med. 2017, 89, 389–396. [Google Scholar] [CrossRef]
- Khan, M.A. An IoT Framework for Heart Disease Prediction Based on MDCNN Classifier. IEEE Access 2020, 8, 34717–34727. [Google Scholar] [CrossRef]
- Miotto, R.; Li, L.; Dudley, J.T. Deep learning to predict patient future diseases from the electronic health records. In Proceedings of the European Conference on Information Retrieval, Padua, Italy, 20–23 March 2016; pp. 768–774. [Google Scholar]
- Choi, E.; Schuetz, A.; Stewart, W.F.; Sun, J. Using recurrent neural network models for early detection of heart failure onset. J. Am. Med Inform. Assoc. 2016, 24, 361–370. [Google Scholar] [CrossRef]
- Park, H.D.; Han, Y.; Choi, J.H. Frequency-Aware Attention based LSTM Networks for Cardiovascular Disease. In Proceedings of the 2018 International Conference on Information and Communication Technology Convergence (ICTC), Jeju Island, Korea, 17–19 October 2018; pp. 1503–1505. [Google Scholar]
- Park, S.; Kim, Y.J.; Kim, J.W.; Park, J.J.; Ryu, B.; Ha, J.W. [Regular Paper] Interpretable Prediction of Vascular Diseases from Electronic Health Records via Deep Attention Networks. In Proceedings of the 2018 IEEE 18th International Conference on Bioinformatics and Bioengineering (BIBE), Taichung, Taiwan, 29–31 October 2018; pp. 110–117. [Google Scholar]
- Yang, Y.; Wang, Y.; Yuan, X. Bidirectional extreme learning machine for regression problem and its learning effectiveness. IEEE Trans. Neural Netw. Learn. Syst. 2012, 23, 1498–1505. [Google Scholar] [CrossRef]
- Fei, H.; Tan, F. Bidirectional grid long short-term memory (bigridlstm): A method to address context-sensitivity and vanishing gradient. Algorithms 2018, 11, 172. [Google Scholar] [CrossRef]
- Wang, P.; Qian, Y.; Soong, F.K.; He, L.; Zhao, H. A unified tagging solution: Bidirectional lstm recurrent neural network with word embedding. arXiv 2015, arXiv:1511.00215. Available online: www.arxiv.org/abs/1511.00215 (accessed on 9 March 2020).
- Jagannatha, A.N.; Yu, H. Bidirectional RNN for medical event detection in electronic health records. In Proceedings of the Conference Association for Computational Linguistics, Berlin, Germany, 7–12 August 2016; pp. 473–482. [Google Scholar]
- He, R.; Liu, Y.; Wang, K.; Zhao, N.; Yuan, Y.; Li, Q.; Zhang, H. Automatic cardiac arrhythmia classification using combination of deep residual network and bidirectional LSTM. IEEE Access 2019, 7, 102119–102135. [Google Scholar] [CrossRef]
- Usama, M.; Ahmad, B.; Wan, J.; Hossain, M.S.; Alhamid, M.F.; Hossain, M.A. Deep Feature Learning for Disease Risk Assessment Based on Convolutional Neural Network With Intra-Layer Recurrent Connection by Using Hospital Big Data. IEEE Access 2018, 6, 67927–67939. [Google Scholar] [CrossRef]
- Rajesh, K.N.; Dhuli, R. Classification of imbalanced ECG beats using re-sampling techniques and AdaBoost ensemble classifier. Biomed. Signal Process. Control. 2018, 41, 242–254. [Google Scholar] [CrossRef]
- Esfahani, H.A.; Ghazanfari, M. Cardiovascular disease detection using a new ensemble classifier. In Proceedings of the 2017 IEEE 4th International Conference on Knowledge-Based Engineering and Innovation (KBEI), Tehran, Iran, 22 December 2017; pp. 1011–1014. [Google Scholar]
- Pasanisi, S.; Paiano, R. A hybrid information mining approach for knowledge discovery in cardiovascular disease (CVD). Information 2018, 9, 90. [Google Scholar] [CrossRef]
- Zabihi, M.; Rad, A.B.; Kiranyaz, S.; Gabbouj, M.; Katsaggelos, A.K. Heart sound anomaly and quality detection using ensemble of neural network without segmentation. In Proceedings of the 2016 Computing in Cardiology Conference (CinC), Vancouver, BC, Canada, 11–14 September 2016; pp. 613–616. [Google Scholar]
- Kang, Q.; Chen, X.; Li, S.; Zhou, M. A noise-filtered under-sampling scheme for imbalanced classification. IEEE Trans. Cybern. 2016, 47, 4263–4274. [Google Scholar] [CrossRef]
- Wang, S.; Minku, L.L.; Yao, X. Resampling-based ensemble methods for online class imbalance learning. IEEE Trans. Knowl. Data Eng. 2014, 27, 1356–1368. [Google Scholar] [CrossRef]
- Chatzakis, I.; Vassilakis, K.; Lionis, C.; Germanakis, I. Electronic health record with computerized decision support tools for the purposes of a pediatric cardiovascular heart disease screening program in Crete. Comput. Methods Programs Biomed. 2018, 159, 159–166. [Google Scholar] [CrossRef]
- Sowmiya, C.; Sumitra, P. Analytical study of heart disease diagnosis using classification techniques. In Proceedings of the 2017 IEEE International Conference on Intelligent Techniques in Control, Optimization and Signal Processing (INCOS), Tamilnadu, India, 23–25 March 2017; pp. 1–5. [Google Scholar]
- Mohan, S.; Thirumalai, C.; Srivastava, G. Effective Heart Disease Prediction Using Hybrid Machine Learning Techniques. IEEE Access 2019, 7, 81542–81554. [Google Scholar] [CrossRef]
- Wu, J.; Roy, J.; Stewart, W.F. Prediction modeling using EHR data: Challenges, strategies, and a comparison of machine learning approaches. Med. Care 2010, 48, S106–S113. [Google Scholar] [CrossRef] [PubMed]
- Tao, R.; Zhang, S.; Huang, X.; Tao, M.; Ma, J.; Ma, S.; Shen, C. Magnetocardiography-Based Ischemic Heart Disease Detection and Localization Using Machine Learning Methods. IEEE Trans. Biomed. Eng. 2018, 66, 1658–1667. [Google Scholar] [CrossRef] [PubMed]
- Pérez, J.; Pérez, A.; Casillas, A.; Gojenola, K. Cardiology record multi-label classification using latent Dirichlet allocation. Comput. Methods Programs Biomed. 2018, 164, 111–119. [Google Scholar] [CrossRef] [PubMed]
- Arabasadi, Z.; Alizadehsani, R.; Roshanzamir, M.; Moosaei, H.; Yarifard, A.A. Computer aided decision making for heart disease detection using hybrid neural network-Genetic algorithm. Comput. Methods Programs Biomed. 2017, 141, 19–26. [Google Scholar] [CrossRef]
- Kumar, V.; Garg, M.L. Deep learning in predictive analytics: A survey. In Proceedings of the 2017 International Conference on Emerging Trends in Computing and Communication Technologies (ICETCCT), Dehradun, India, 17–18 November 2017; pp. 1–6. [Google Scholar]
- Taslimitehrani, V.; Dong, G.; Pereira, N.L.; Panahiazar, M.; Pathak, J. Developing EHR-driven heart failure risk prediction models using CPXR (Log) with the probabilistic loss function. J. Biomed. Inform. 2016, 60, 260–269. [Google Scholar] [CrossRef]
- Bizopoulos, P.; Koutsouris, D. Deep Learning in Cardiology. IEEE Rev. Biomed. Eng. 2018, 12, 168–193. [Google Scholar] [CrossRef]
- Hsiao, H.C.; Chen, S.H.; Tsai, J.J. Deep learning for risk analysis of specific cardiovascular diseases using environmental data and outpatient records. In Proceedings of the 2016 IEEE 16th International Conference on Bioinformatics and Bioengineering (BIBE), Taichung, Taiwan, 31 October–2 November 2016; pp. 369–372. [Google Scholar]
- Manogaran, G.; Varatharajan, R.; Priyan, M.K. Hybrid recommendation system for heart disease diagnosis based on multiple kernel learning with adaptive neuro-fuzzy inference system. Multimed. Tools Appl. 2018, 77, 4379–4399. [Google Scholar] [CrossRef]
- Li, J.; Chen, Z.Z.; Huang, L.; Fang, M.; Li, B.; Fu, X.; Zhao, Q. Automatic classification of fetal heart rate based on convolutional neural network. IEEE Internet Things J. 2018, 6, 1394–1401. [Google Scholar] [CrossRef]
- Golgooni, Z.; Mirsadeghi, S.; Baghshah, M.S.; Ataee, P.; Baharvand, H.; Pahlavan, S.; Rabiee, H.R. Deep Learning-Based Proarrhythmia Analysis Using Field Potentials Recorded From Human Pluripotent Stem Cells Derived Cardiomyocytes. IEEE J. Transl. Eng. Health Med. 2019, 7, 1–9. [Google Scholar] [CrossRef]
- Maknickas, V.; Maknickas, A. Atrial fibrillation classification using qrs complex features and lstm. In Proceedings of the 2017 Computing in Cardiology (CinC), Rennes, France, 24–27 September 2017; pp. 1–4. [Google Scholar]
- Grzegorczyk, I.; Soliński, M.; Łepek, M.; Perka, A.; Rosiński, J.; Rymko, J.; Gierałtowski, J. PCG classification using a neural network approach. In Proceedings of the 2016 Computing in Cardiology Conference (CinC), Vancouver, BC, Canada, 11–14 September 2016; pp. 1129–1132. [Google Scholar]
- Bozkurt, B.; Germanakis, I.; Stylianou, Y. A study of time-frequency features for CNN-based automatic heart sound classification for pathology detection. Comput. Biol. Med. 2018, 100, 132–143. [Google Scholar] [CrossRef]
- Li, R.; Zhang, X.; Dai, H.; Zhou, B.; Wang, Z. Interpretability Analysis of Heartbeat Classification Based on Heartbeat Activity’s Global Sequence Features and BiLSTM-Attention Neural Network. IEEE Access 2019, 7, 109870–109883. [Google Scholar] [CrossRef]
- Lee, J.G.; Jun, S.; Cho, Y.W.; Lee, H.; Kim, G.B.; Seo, J.B.; Kim, N. Deep learning in medical imaging: General overview. Korean J. Radiol. 2017, 18, 570–584. [Google Scholar] [CrossRef] [PubMed]
- Mamoshina, P.; Vieira, A.; Putin, E.; Zhavoronkov, A. Applications of deep learning in biomedicine. Mol. Pharm. 2016, 13, 1445–1454. [Google Scholar] [CrossRef] [PubMed]
- Zhu, F.; Ye, F.; Fu, Y.; Liu, Q.; Shen, B. Electrocardiogram generation with a bidirectional LSTM-CNN generative adversarial network. Sci. Rep. 2019, 9, 1–11. [Google Scholar] [CrossRef] [PubMed]
- Li, L.J.; Niu, C.Q.; Pu, D.X.; Jin, X.Y. Electronic Medical Data Analysis Based on Word Vector and Deep Learning Model. In Proceedings of the 2018 9th International Conference on Information Technology in Medicine and Education (ITME), Hangzhou, China, 19–21 October 2018; pp. 484–487. [Google Scholar]
- Chen, C.W.; Tseng, S.P.; Kuan, T.W.; Wang, J.F. Outpatient Text Classification Using Attention-Based Bidirectional LSTM for Robot-Assisted Servicing in Hospital. Information 2020, 11, 106. [Google Scholar] [CrossRef]
- Miao, K.H.; Miao, J.H.; Miao, G.J. Diagnosing coronary heart disease using ensemble machine learning. Int. J. Adv. Comput. Sci. Appl. (IJACSA) 2016, 7, 30–39. [Google Scholar]
- Yekkala, I.; Dixit, S.; Jabbar, M.A. Prediction of heart disease using ensemble learning and Particle Swarm Optimization. In Proceedings of the 2017 International Conference on Smart Technologies for Smart Nation (SmartTechCon), Bengaluru, India, 17–19 August 2017; pp. 691–698. [Google Scholar]
- Das, R.; Turkoglu, I.; Sengur, A. Effective diagnosis of heart disease through neural network ensembles. Expert Syst. Appl. 2009, 36, 7675–7680. [Google Scholar] [CrossRef]
- Das, R.; Turkoglu, I.; Sengur, A. Diagnosis of valvular heart disease through neural network ensembles. Comput. Methods Programs Biomed. 2009, 93, 185–191. [Google Scholar] [CrossRef]
- Wang, L.; Zhou, W.; Chang, Q.; Chen, J.; Zhou, X. Deep Ensemble Detection of Congestive Heart Failure using Short-term RR Intervals. IEEE Access 2019, 7, 69559–69574. [Google Scholar] [CrossRef]
- Altan, G.; Kutlu, Y.; Allahverdi, N. A new approach to early diagnosis of congestive heart failure disease by using Hilbert–Huang transform. Comput. Methods Programs Biomed. 2016, 137, 23–34. [Google Scholar] [CrossRef]
- Batista, G.E.; Prati, R.C.; Monard, M.C. A study of the behavior of several methods for balancing machine learning training data. ACM SIGKDD Explor. Newsl. 2004, 6, 20–29. [Google Scholar] [CrossRef]
- Wosiak, A.; Karbowiak, S. Preprocessing compensation techniques for improved classification of imbalanced medical datasets. In Proceedings of the 2017 Federated Conference on Computer Science and Information Systems (FedCSIS), Prague, Czech Republic, 3–6 September 2017; pp. 203–211. [Google Scholar]
- Ge, H.; Sun, K.; Sun, L.; Zhao, M.; Wu, C. A selective ensemble learning framework for ECG-based heartbeat classification with imbalanced data. In Proceedings of the 2018 IEEE International Conference on Bioinformatics and Biomedicine (BIBM), Madrid, Spain, 3–6 December 2018; pp. 2753–2755. [Google Scholar]
- LeCun, Y.; Bengio, Y.; Hinton, G. Deep learning. Nature 2015, 521, 436. [Google Scholar] [CrossRef] [PubMed]
- Jain, A.; Zamir, A.R.; Savarese, S.; Saxena, A. Structural-RNN: Deep learning on spatio-temporal graphs. In Proceedings of the IEEE Conference on Computer Vision and Pattern Recognition, Las Vegas, NV, USA, 26 June–1 July 2016; pp. 5308–5317. [Google Scholar]
- Hochreiter, S.; Schmidhuber, J. Long short-term memory. Neural Comput. 1997, 9, 1735–1780. [Google Scholar] [CrossRef] [PubMed]
- Chung, J.; Gulcehre, C.; Cho, K.; Bengio, Y. Gated feedback recurrent neural network. In Proceedings of the 2015 International Conference on Machine Learning, Lille, France, 6–11 July 2015; pp. 2067–2075. [Google Scholar]
- Dal Pozzolo, A.; Caelen, O.; Johnson, R.A.; Bontempi, G. Calibrating probability with undersampling for unbalanced classification. In Proceedings of the 2015 IEEE Symposium Series on Computational Intelligence, Cape Town, South Africa, 8–10 December 2015; pp. 159–166. [Google Scholar]
- Fernández, A.; Garcia, S.; Herrera, F.; Chawla, N.V. SMOTE for learning from imbalanced data: Progress and challenges, marking the 15-year anniversary. J. Artif. Intell. Res. 2018, 61, 863–905. [Google Scholar] [CrossRef]
- Liang, T.; Xu, X.; Xiao, P. A new image classification method based on modified condensed nearest neighbor and convolutional neural network. Pattern Recognit. Lett. 2017, 94, 105–111. [Google Scholar] [CrossRef]
- Yu, Y.; Lin, H.; Meng, J.; Wei, X.; Zhao, Z. Assembling deep neural networks for medical compound figure detection. Information 2017, 8, 48. [Google Scholar] [CrossRef]
- King, R.D.; Ouali, M.; Strong, A.T.; Aly, A.; Elmaghraby, A.; Kantardzic, M.; Page, D. Is it better to combine predictions? Protein Eng. 2000, 13, 15–19. [Google Scholar] [CrossRef]
- Zeng, Z.Y.; Lin, J.J.; Chen, M.S.; Chen, M.H.; Lan, Y.Q.; Liu, J.L. A Review Structure Based Ensemble Model for Deceptive Review Spam. Information 2019, 10, 243. [Google Scholar] [CrossRef]
- Lin, W.C.; Tsai, C.F.; Hu, Y.H.; Jhang, J.S. Clustering-based undersampling in class-imbalanced data. Inf. Sci. 2017, 409, 17–26. [Google Scholar] [CrossRef]
- Loyola-González, O.; Martínez-Trinidad, J.F.; Carrasco-Ochoa, J.A.; García-Borroto, M. Study of the impact of resampling methods for contrast pattern based classifiers in imbalanced databases. Neurocomputing 2016, 175, 935–947. [Google Scholar] [CrossRef]
© 2020 by the authors. Licensee MDPI, Basel, Switzerland. This article is an open access article distributed under the terms and conditions of the Creative Commons Attribution (CC BY) license (http://creativecommons.org/licenses/by/4.0/).

