Driver Drowsiness Estimation Based on Factorized Bilinear Feature Fusion and a Long-Short-Term Recurrent Convolutional Network


Abstract
:1. Introduction
2. Related Work
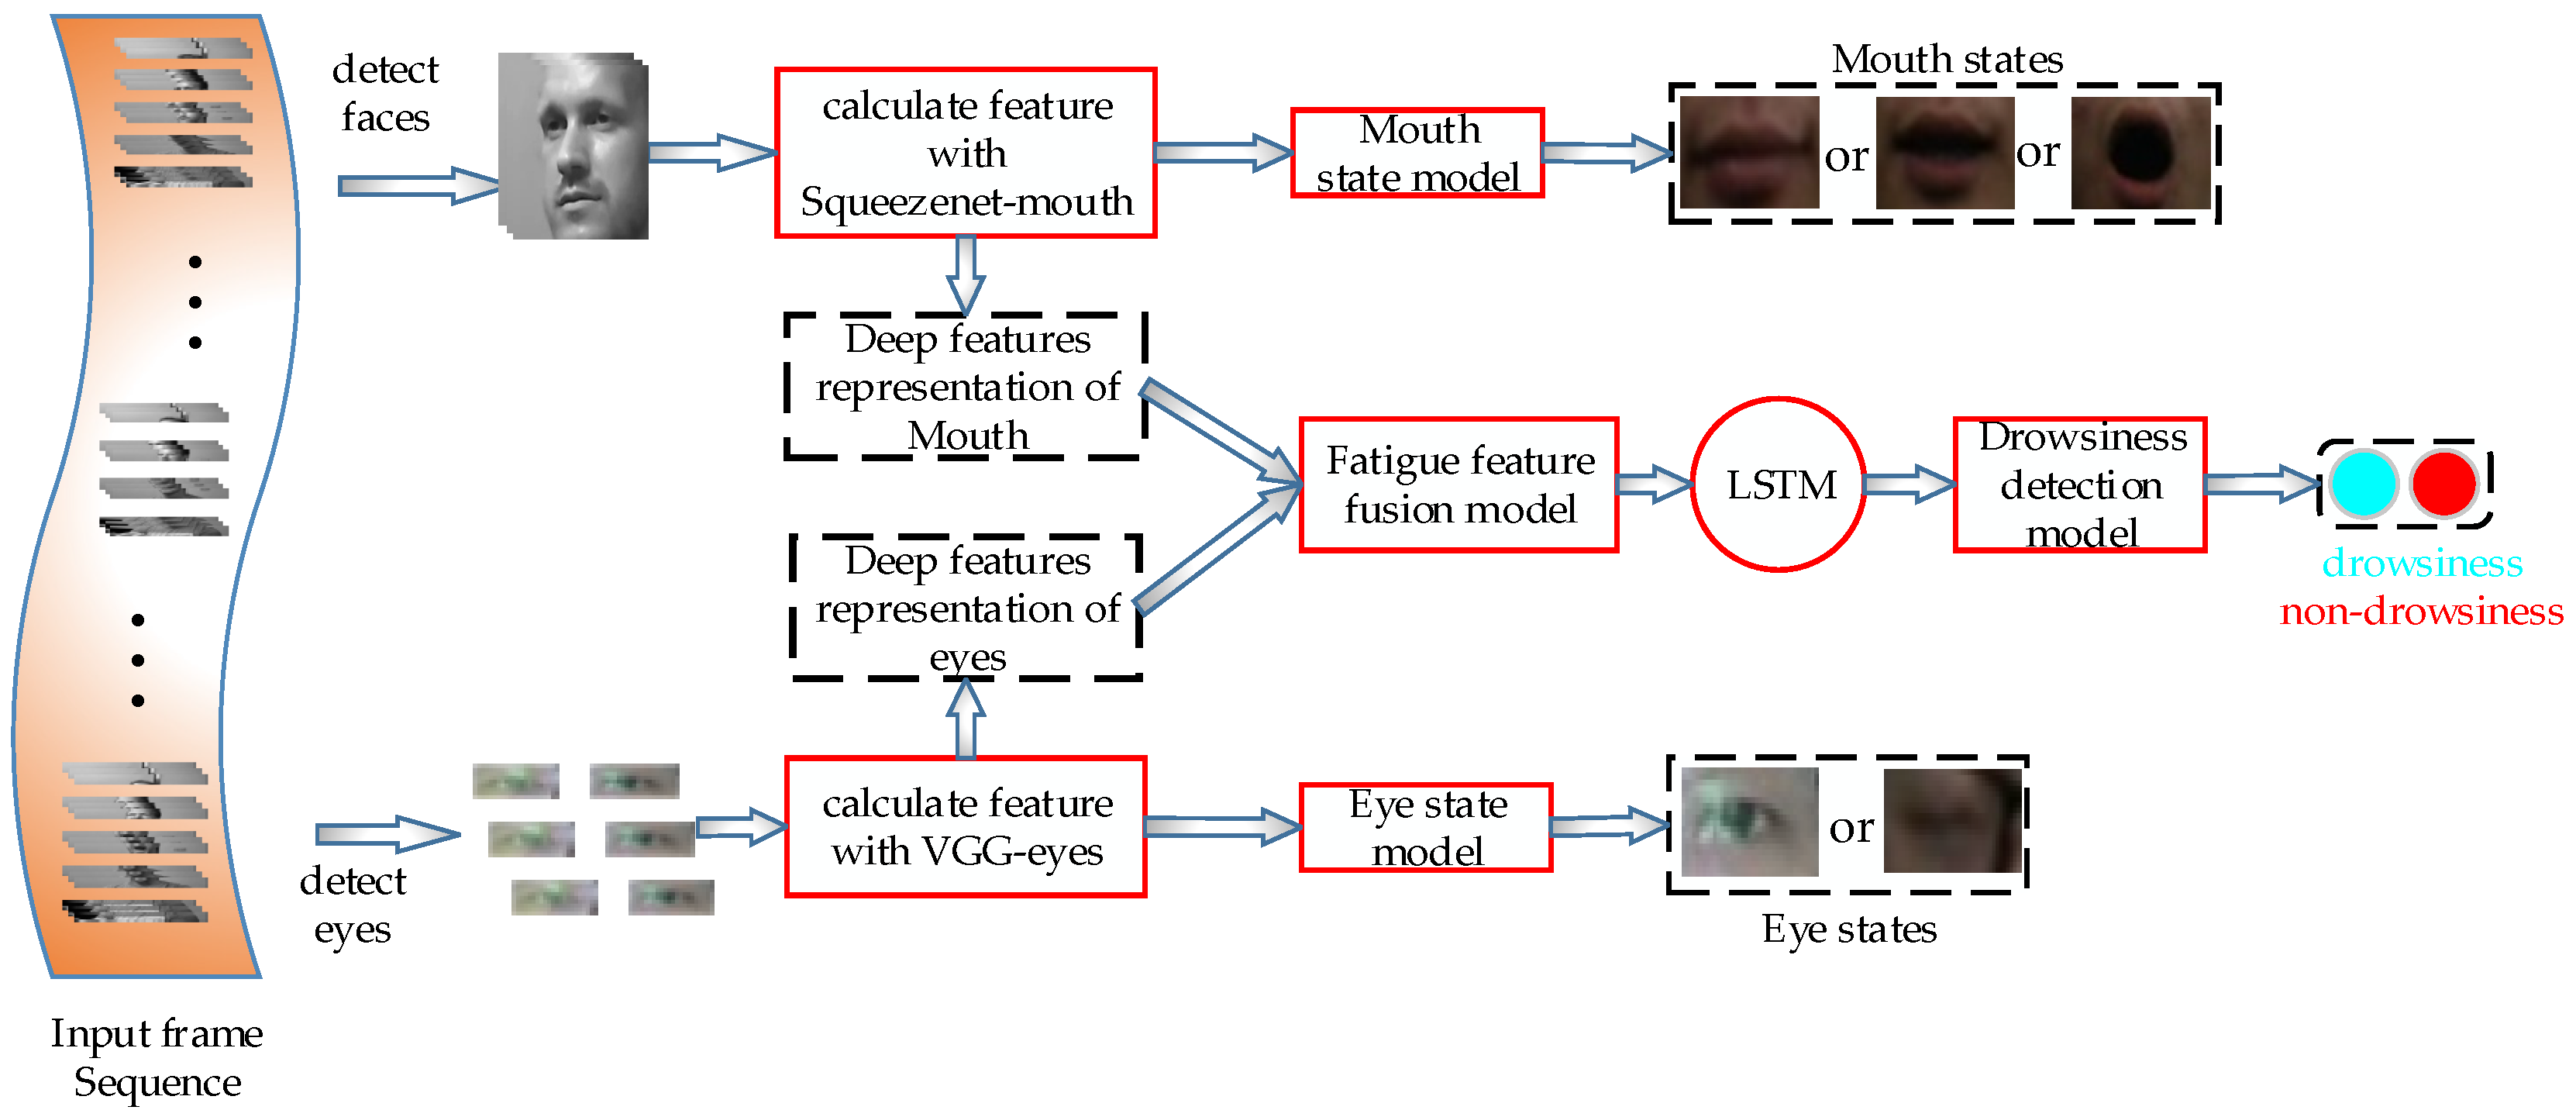
3. Proposed Work
3.1. Fatigue Feature Extraction
3.1.1. Mouth State Model
3.1.2. Eye State Model
3.2. Fatigue Feature Fusion
3.3. Driver Drowsiness Detection
4. Experiment
4.1. Dataset
4.2. Experimental Details
4.2.1. Dataset Preprocessing
4.2.2. Model Training
4.2.3. Environment
4.3. Performance of Proposed Method
5. Conclusions and Future Work
Author Contributions
Funding
Informed Consent Statement
Data Availability Statement
Conflicts of Interest
References
- He, J.; Choi, W.; Yang, Y.; Lu, J.; Peng, K. Detection of driver drowsiness using wearable devices: A feasibility study of the proximity sensor. Appl. Ergon. 2017, 65, 473–480. [Google Scholar] [CrossRef] [PubMed]
- Jie, Z.; Mahmoud, M.; Stafford-Fraser, Q.; Robinson, P.; Dias, E.; Skrypchuk, L. Analysis of Yawning Behaviour in Spontaneous Expressions of Drowsy Drivers. In Proceedings of the 2018 13th IEEE International Conference on Automatic Face & Gesture Recognition (FG 2018), Xi’an, China, 15–19 May 2018; pp. 571–576. [Google Scholar]
- Zhao, L.; Wang, Z.C.; Wang, X.J.; Liu, Q. Driver drowsiness detection using facial dynamic fusion information and a DBN. IET Intell. Transp. Syst. 2018, 12, 127–133. [Google Scholar] [CrossRef]
- Zhang, Y.; Hua, C.J. Driver fatigue recognition based on facial expression analysis using local binary patterns. Optik 2015, 126, 4501–4505. [Google Scholar] [CrossRef]
- Wang, P.; Shen, L. A method of detecting driver drowsiness state based on multi-features of face. In Proceedings of the 2012 5th International Congress on Image and Signal Processing, Chongqing, China, 16–18 October 2012; pp. 1171–1175. [Google Scholar]
- Park, S.; Pan, F.; Kang, S.; Yoo, C.D. Driver Drowsiness Detection System Based on Feature Representation Learning Using Various Deep Networks. In Proceedings of the 13th Asian Conference on Computer Vision (ACCV), Taipei, Taiwan, 20–24 November 2016; pp. 154–164. [Google Scholar]
- Li, Y.H.; Wang, N.Y.; Liu, J.Y.; Hou, X.D. Factorized Bilinear Models for Image Recognition. In Proceedings of the 2017 IEEE International Conference on Computer Vision (ICCV), Venice, Italy, 22–29 October 2017; pp. 2098–2106. [Google Scholar]
- Fu, R.R.; Wang, H.; Zhao, W.B. Dynamic driver fatigue detection using hidden Markov model in real driving condition. Expert Syst. Appl. 2016, 63, 397–411. [Google Scholar] [CrossRef]
- Lee, B.G.; Lee, B.L.; Chung, W.Y. Mobile Healthcare for Automatic Driving Sleep-Onset Detection Using Wavelet-Based EEG and Respiration Signals. Sensors 2014, 14, 17915–17936. [Google Scholar] [CrossRef] [Green Version]
- Li, G.; Chung, W.Y. Detection of Driver Drowsiness Using Wavelet Analysis of Heart Rate Variability and a Support Vector Machine Classifier. Sensors 2013, 13, 16494–16511. [Google Scholar] [CrossRef] [Green Version]
- Gromer, M.; Salb, D.; Walzer, T.; Madrid, N.M.; Seepold, R. ECG sensor for detection of driver’s drowsiness. Procedia Comput. Sci. 2019, 159, 1938–1946. [Google Scholar] [CrossRef]
- Khushaba, R.N.; Kodagoda, S.; Lal, S.; Dissanayake, G. Driver Drowsiness Classification Using Fuzzy Wavelet-Packet-Based Feature-Extraction Algorithm. IEEE Trans. Biomed. Eng. 2011, 58, 121–131. [Google Scholar] [CrossRef] [Green Version]
- Forsman, P.M.; Vila, B.J.; Short, R.A.; Mott, C.G.; Dongen, H.P.V. Efficient driver drowsiness detection at moderate levels of drowsiness. Accid. Anal. Prev. 2013, 50, 341–350. [Google Scholar] [CrossRef]
- Morris, D.M.; Pilcher, J.J.; Switzer, F.S., III. Lane heading difference: An innovative modal for drowsy driving detection using retrospective analysis around curves. Accid. Anal. Prev. 2015, 80, 117–124. [Google Scholar] [CrossRef]
- Wang, M.S.; Jeong, N.T.; Kim, K.S. Drowsy behavior detection based on driving information. Int. J. Automot. Technol. 2016, 17, 165–173. [Google Scholar] [CrossRef]
- Hu, X.; Lodewijks, G. Detecting fatigue in car drivers and aircraft pilots by using non-invasive measures: The value of differentiation of sleepiness and mental fatigue. J. Saf. Res. 2020, 72, 173–187. [Google Scholar] [CrossRef] [PubMed]
- Abtahi, S.; Hariri, B.; Shirmohammadi, S. Driver Drowsiness Monitoring Based on Yawning Detection. In Proceedings of the 2011 IEEE International Instrumentation and Measurement Technology Conference, Binjiang, China, 10–12 May 2011; pp. 1206–1209. [Google Scholar]
- Yuen, K.; Martin, S.; Trivedi, M.M. Looking at Faces in a Vehicle: A Deep CNN Based Approach and Evaluation. In Proceedings of the 2016 IEEE 19th International Conference on Intelligent Transportation Systems (ITSC), Rio de Janeiro, Brazil, 1–4 November 2016; pp. 649–654. [Google Scholar]
- Garcia, I.; Bronte, S.; Bergasa, L.M.; Almazan, J.; Yebes, J. Vision-based drowsiness detector for Real Driving Conditions. In Proceedings of the 2012 IEEE Intelligent Vehicles Symposiu, Alcala de Henares, Spain, 3–7 June 2012; pp. 618–623. [Google Scholar]
- Du, G.; Li, T.; Li, C.; Liu, P.X.; Li, D. Vision-Based Fatigue Driving Recognition Method Integrating Heart Rate and Facial Features. IEEE Trans. Intell. Transp. Syst. 2020, 1–12. [Google Scholar] [CrossRef]
- Sun, W.; Zhang, X.R.; Peeta, S.; He, X.Z.; Li, Y.F. A Real-Time Fatigue Driving Recognition Method Incorporating Contextual Features and Two Fusion Levels. IEEE Trans. Intell. Transp. Syst. 2017, 18, 3408–3420. [Google Scholar] [CrossRef]
- Deng, W.H.; Wu, R.X. Real-Time Driver-Drowsiness Detection System Using Facial Features. IEEE Access 2019, 7, 118727–118738. [Google Scholar] [CrossRef]
- Donahue, J.; Hendricks, L.A.; Rohrbach, M.; Venugopalan, S.; Guadarrama, S.; Saenko, K.; Darrell, T. Long-Term Recurrent Convolutional Networks for Visual Recognition and Description. IEEE Trans. Pattern Anal. Mach. Intell. 2017, 39, 677–691. [Google Scholar] [CrossRef]
- Parkhi, O.M.; Vedaldi, A.; Zisserman, A. Deep face recognition. Proc. BMVC 2015, 1, 6. [Google Scholar]
- Shih, T.H.; Hsu, C.T. MSTN: Multistage Spatial-Temporal Network for Driver Drowsiness Detection. In Proceedings of the 13th Asian Conference on Computer Vision (ACCV), Taipei, Taiwan, 20–24 November 2016; pp. 146–153. [Google Scholar]
- Hong, S.; Oh, J.; Lee, H.; Han, B. Learning Transferrable Knowledge for Semantic Segmentation with Deep Convolutional Neural Network. In Proceedings of the 2016 IEEE Conference on Computer Vision and Pattern Recognition (CVPR), Las Vegas, NV, USA, 27–30 June 2016; pp. 3204–3212. [Google Scholar]
- Yu, J.; Park, S.; Lee, S.; Jeon, M. Driver Drowsiness Detection Using Condition-Adaptive Representation Learning Framework. IEEE Trans. Intell. Transp. Syst. 2019, 20, 4206–4218. [Google Scholar] [CrossRef]
- Lin, T.Y.; RoyChowdhury, A.; Maji, S. Bilinear CNN Models for Fine-Grained Visual Recognition. In Proceedings of the 2015 IEEE International Conference on Computer Vision (ICCV), Santiago, Chile, 7–13 December 2015; pp. 1449–1457. [Google Scholar]
- Iandola, F.N.; Han, S.; Moskewicz, M.W.; Ashraf, K.; Dally, W.J.; Keutzer, K. SqueezeNet: AlexNet-Level Accuracy with 50× Fewer Parameters and <0.5 MB Model Size. Available online: https://openreview.net/pdf?id=S1xh5sYgx (accessed on 4 November 2016).
- Simonyan, K.; Zisserman, A. Very deep convolutional networks for large-scale image recognition. arXiv 2014, arXiv:1409.1556. [Google Scholar]
- Weng, C.H.; Lai, Y.H.; Lai, S.H. Driver Drowsiness Detection via a Hierarchical Temporal Deep Belief Network. In Proceedings of the 13th Asian Conference on Computer Vision (ACCV), Taipei, Taiwan, 20–24 November 2016; pp. 117–133. [Google Scholar]
- Viola, P.; Jones, M. Rapid object detection using a boosted cascade of simple features. In Proceedings of the 2001 IEEE Computer Society Conference on Computer Vision and Pattern Recognition CVPR 2001, Kauai, HI, USA, 8–14 December 2001; p. 1. [Google Scholar]
- Goodfellow, I.J.; Erhan, D.; Luc Carrier, P.; Courville, A.; Mirza, M.; Hamner, B.; Bengio, Y. Challenges in representation learning: A report on three machine learning contests. Neural Netw. 2015, 64, 59–63. [Google Scholar] [CrossRef] [Green Version]
- Tieleman, T.; Hinton, G. Rmsprop: Divide the Gradient by a Running Average of Its Recent Magnitude. Coursera: Neural Networks for Machine Learning; University of Toronto: Toronto, ON, Canada, 2012. [Google Scholar]
- Kingma, D.; Ba, J. Adam: A method for stochastic optimization. arXiv 2014, arXiv:1412.6980. [Google Scholar]
- Jung, H.; Lee, S.; Yim, J.; Park, S.; Kim, J. Joint Fine-Tuning in Deep Neural Networks for Facial Expression Recognition. In Proceedings of the 2015 IEEE International Conference on Computer Vision (ICCV), Santiago, Chile, 7–13 December 2015; pp. 2983–2991. [Google Scholar]


| Category | Original Dataset Annotation | One-Hot Vectors | |
|---|---|---|---|
| Drowsiness status | Stillness | 0 | 10 |
| Drowsy | 1 | 01 | |
| Mouth status | Stillness | 0 | 100 |
| Yawning | 1 | 010 | |
| Talking and laughing | 2 | 001 | |
| Eye status | Stillness | 0 | 10 |
| Sleepy-eyes | 1 | 01 |
| No Glasses | Glasses | Sunglasses | Night (No Glasses) | Night (Glasses) | Average | |
|---|---|---|---|---|---|---|
| Mouth | 0.973 | 0.954 | 0.887 | 0.932 | 0.919 | 0.933 |
| Eye | 0.934 | 0.847 | 0.773 | 0.891 | 0.802 | 0.849 |
| Frames | Drowsiness (F1-Score) | Non-Drowsiness (F1-Score) | Average | |
|---|---|---|---|---|
| Conv | 30 | 0.774 | 0.742 | 0.758 |
| 40 | 0.781 | 0.745 | 0.763 | |
| 50 | 0.786 | 0.750 | 0.768 | |
| fc | 30 | 0.729 | 0.659 | 0.694 |
| 40 | 0.734 | 0.668 | 0.701 | |
| 50 | 0.740 | 0.674 | 0.707 |
| Scenario | Deep Belief Network (DBN) | Multi-Stage Spatio-Temporal Network (MSTN) | VGG- faceNet | Long short-Term Recurrent Convolutional Network (LRCN) | DDD-FFA | Deep Drowsiness Detection -Independent Average Architecture (DDD-IAA) | Proposed Work |
|---|---|---|---|---|---|---|---|
| No glasses | 0.652 | 0.703 | 0.638 | 0.687 | 0.794 | 0.698 | 0.802 |
| Glasses | 0.623 | 0.635 | 0.705 | 0.617 | 0.741 | 0.759 | 0.774 |
| Sunglasses | 0.587 | 0.604 | 0.570 | 0.714 | 0.618 | 0.698 | 0.709 |
| Night (no glasses) | 0.630 | 0.676 | 0.737 | 0.573 | 0.702 | 0.749 | 0.785 |
| Night (glasses) | 0.602 | 0.613 | 0.741 | 0.556 | 0.683 | 0.747 | 0.721 |
| Average | 0.619 | 0.646 | 0.678 | 0.629 | 0.708 | 0.730 | 0.758 |
Publisher’s Note: MDPI stays neutral with regard to jurisdictional claims in published maps and institutional affiliations. |
© 2020 by the authors. Licensee MDPI, Basel, Switzerland. This article is an open access article distributed under the terms and conditions of the Creative Commons Attribution (CC BY) license (http://creativecommons.org/licenses/by/4.0/).
Share and Cite
Chen, S.; Wang, Z.; Chen, W. Driver Drowsiness Estimation Based on Factorized Bilinear Feature Fusion and a Long-Short-Term Recurrent Convolutional Network. Information 2021, 12, 3. https://doi.org/10.3390/info12010003
Chen S, Wang Z, Chen W. Driver Drowsiness Estimation Based on Factorized Bilinear Feature Fusion and a Long-Short-Term Recurrent Convolutional Network. Information. 2021; 12(1):3. https://doi.org/10.3390/info12010003
Chicago/Turabian StyleChen, Shuang, Zengcai Wang, and Wenxin Chen. 2021. "Driver Drowsiness Estimation Based on Factorized Bilinear Feature Fusion and a Long-Short-Term Recurrent Convolutional Network" Information 12, no. 1: 3. https://doi.org/10.3390/info12010003