2. Literature Overview
As a non-parametric methodology based on mathematical programming, DEA is widely and increasingly used in banking industry efficiency measurement. Consequently, many research papers have already used different DEA models to investigate different problems in the field of banking. According to the results of previous research papers, the level of inefficiency is generally lower for larger banks when compared to smaller banks because larger banks usually report higher levels of pure technical efficiency as a result of a high level of concentration and the lack of competition [
4]. The results of an efficiency measurement using the DEA approach, which focused on the Croatian banking industry in the period 1995 to 2000, found that smaller banks are efficient at a global level, but large banks are efficient at a local level [
5]. The efficiency testing of the Czech banking sector using data envelopment window analysis indicated larger banks were less efficient in comparison to the other banks due to the fact that larger banks have a larger deposit base and an inappropriate size of operations [
6]. Efficiency analysis of the Lithuanian banking sector found larger banks had more appropriate business models than smaller banks [
7]. A measurement of the efficiency in the case of the Brazilian banking sector found small banks had increasing returns to scale in comparison to large banks [
8]. Regarding bank-specific characteristics, size has a significant negative impact on scale efficiency, which indicates large banks suffer from inefficiency [
9]. This conclusion was in contrast to the research findings of [
10,
11], which argued that the positive effects of the economies of scale and scope on growth, expansion, and profitability are more pronounced in small banks than in large banks; however, small banks can benefit from economies of scale only up to determined sizes, after which it is disadvantageous for them [
9]. Measurements of European banking industry efficiency revealed that smaller and post-transition countries have more efficient banking systems [
12]. In general, it can be concluded that the majority of the previous DEA research findings (mostly using basic models) suggest that small banks are more efficient than large ones. However, because the Croatian banking sector is highly concentrated, this study focused on analysing only large banks, and added sensitivity analysis using the bootstrap and fuzzy data approach within the DEA methodology. Researches on bank efficiency undertaken using bootstrap and fuzzy DEA are not common, even though they are useful for analysing small markets with uncertain data and an uncertain sample.
The bootstrap DEA (BDEA) approach in banking has been used in resolving uncertainty problems of the traditional DEA efficiency measurement approach, in addition to the small sample issue [
13]. This was found in research measuring the efficiency of twelve Islamic banks in Malaysia, where the BDEA approach was able to trace existing bias issues, providing more accurate and sound efficiency results [
13]. Because the BDEA approach allows determination of the scores’ sensitivity due to the sample distribution inefficiency [
14], this was found to be the main advantage over traditional DEA models. This approach found an average level of efficiency for 30 large Brazilian banks in the period 2010–2013, suggesting that all of them should improve the performance of their production resources (deposits, total assets, and manual labour were classified as inputs, and credit operations as output); that is, they should reduce expenses and also increase revenues, because the presented results highlighted an average level of efficiency [
14]. The low relevance in this type of comparison was a result of analysis by segments [
14]. The results of the BDEA approach applied to a sample of Vietnamese banks in the period 1999–2009 indicate that large and very large banks are more efficient than small and medium-sized banks, with small banks having the lowest efficiency scores in the system; non-state-owned commercial banks are more efficient than state-owned commercial banks in terms of overall efficiency (Stewart et al. 2016). Network BDEA and the black box DEA were used on a sample of six big Canadian banks for the period 2000–2017 in order to examine which of the two models provided more accurate results on how the 2007 financial crisis and the increasing competition level due to new technologies affected efficiency [
15]. The results indicated that the 2007 financial crisis resulted in lower performance efficiencies. However, this decline was not substantial for the production and investment stages when the revenue generation stage experienced the largest impact. A comparison of BDEA with the black box DEA model concluded that the network BDEA provides more insightful and accurate results in terms of banks’ efficiencies [
15]. Samad [
16] obtained overall bias-corrected technical efficiency (OTEBC), bias-corrected pure technical efficiency (PTEBC) and bias-corrected scale efficiency (SE) of the Islamic banks of the Gulf Cooperating Countries (GCC) during 2014–2016 using the Simar and Wilson [
17] BDEA. Decomposing the OTEBC, the paper found the PTEBC and the SE were 91% and 59.8%, respectively, and thus PTEBC was greater than the OTBBC (82.4%) and the SE (59.8%) of the GCC Islamic banks [
16]. Although the paper found that most banks of the GCC region were inefficient because they operated under either increasing or decreasing returns to scale (IRS or DRS), DRS was the major source of inefficiency [
16].
Fuzzy DEA has been applied for investigating numerous problems in banking. The fuzzy-slack-based measure (SBM) was derived for evaluating the impact of the variability of a risk variable VaR (as a fuzzy variable) on the efficiency values of Taiwanese banks [
17], using trigonometry as the basis to estimate efficiency values as triangular membership functions. The model demonstrated the implications of risk and the significant effects of risk volatility on banks’ efficiency: the larger the volatility, the larger the difference between the upper and lower bounds of the efficiency value; thus, risk volatility affects the efficiency value [
17]. Puri and Yadav [
18] proposed a fuzzy DEA (FDEA) model with undesirable fuzzy outputs which can be solved as a crisp linear program for each
α in (0, 1]. This used an
α-cut approach to measure the performance of public sector banks (PuSBs) in India in the period 2009–2011 and to analyse the influence of uncertainty in the data on the efficiency results. The results obtained in this research depicted the impact of undesirable output on the performance of PuSBs and highlighted the influence of the presence of uncertainty in the data on the efficiency results. The findings show that the efficiency results of many PuSBs varied with the variation in
α during the selected period [
18]. Similarly, Tlig and ben Hamed [
19] evaluated the efficiency of commercial Tunisian banks in terms of several crisp and imprecise datasets. Fuzzy data envelopment analysis (FDEA), the possibility approach, and an approach based on relations between fuzzy numbers (BRONF) were used to obtain the efficiency score of each bank. The results show that, in a competitive environment, non-financial inputs and outputs should be taken into account in order to obtain credible and realistic efficiency scores [
19]. Further, fully fuzzy cost-efficiency (FFCE) and fully fuzzy revenue-efficiency (FFRE) models, where input–output data and prices include uncertainty of fuzzy forms, were proposed and compared with existing approaches for proving their effectiveness in real-world situations [
20]. The concepts of fully fuzzy linear programming problems (FFLPPs) and linear ranking functions have been used to transform FFCE and FFRE models into crisp linear programming problems (LPPs), and to evaluate fuzzy cost-efficiency (FCE) and fuzzy revenue-efficiency (FRE) measures of the DMUs as triangular fuzzy numbers. Singh and Kumar [
21] ranked the fuzzy DEA efficiency scores of ten Indian banks and compared the results to those obtained from conventional DEA. They showed that fuzzy DEA can effectively characterize the uncertainty of inputs and outputs while measuring efficiency, and thus differentiate between efficient and inefficient banks.
3. Methodology
This analysis is based on the DEA BCC model. Firstly, we run the BCC model with financial data collected from the banks’ financial statements. Then we introduce bootstrap and fuzzy DEA to provide a sensitivity analysis of the obtained results (
Figure 1). DEA is a useful efficiency measurement tool in cases of multiple inputs and multiple outputs, where input–output transformation relationships are unknown [
22]. Although the traditional DEA models demand precise input and output data, the uncertainty theory can be applied in cases where the data cannot be precisely measured.
Firstly, we calculate the efficiency scores for each bank from the sample using the BCC model. We use BCC because it assumes variable returns to scale (VRS), which is a natural assumption for this analysis, and is also present in our data. It is one of the basic DEA models which provides the needed information, i.e., whether the DMUs are efficient, compared to others in the set, given the chosen criteria. The formulation of the BCC model is as follows. Let there be
N DMUs:
DMU1,
DMU2, …,
DMUN. They all use the same
m inputs to produce
s outputs. Let
X = [
xij] be an input matrix, and
Y = [
yrj] an output matrix,
,
,
, in which each column represents input/output quantities of a
DMUj. The efficiency scores are obtained by solving the BCC model for each
DMUo =
DMUj expressed as follows [
23]:
where
ur and
vi,
,
, are weights,
is a small non-Archimedean quantity, and letting
vo be unconstrained in sign implies variable returns to scale. If the solution of the model equals 1, then the DMU
o is considered efficient. We choose output orientation that assumes all banks aim at maximizing their output given the available inputs. Because the number of banks in our sample is relatively small compared to the number of criteria (variables), we treat each bank in each year as a unique entity (pooled sample). This approach allows us to compare the efficiency between years and to observe the changes in efficiency over the observed period, assuming that production possibilities were the same in the whole period. There are models that deal with panel data, such as the Malmquist index (MI) and DEA Window Analysis. Window Analysis measures the efficiency of DMUs over consecutive overlapping time frames of a certain size. Because samples used in those time frames are variable and the efficiency frontier is not the same, the results are not comparable in our case. The Malmquist index would provide information on the changes in the efficiency over time of DMUs regarding themselves and the others. Because we wanted to derive pure technical efficiency and determine if a bank is efficient compared to others over time, given the used set of criteria, we chose to use the pooled BCC model instead, which can also be seen as a window analysis over the largest time frame. Moreover, our analysis would still suffer from a small sample if the MI was used.
Secondly, to exclude the possibility that the sample significantly impacts the efficiency results, we use the bootstrapping approach introduced by Simar and Wilson [
24]. The bootstrap procedure can be summarized as follows, according to [
25]. Let
be a data generating process (DGP), where
T is a production possibilities set defined as
and
f is a joint density function. The bootstrapping procedure analyses the sensitivity of the distance from a fixed point
to the estimated frontier, relative to the sampling variation of the estimator of the frontier, taking into account the entire set of empirical observations [
21]. The bootstrap algorithm has the following steps:
- (1)
For each input-output bundle
, estimates
,
, are computed using the BCC linear program (the envelopment form):
- (2)
Using the bootstrap method and the data generating process (DGP), a random sample of
size
N is generated. Then, a sample is smoothed with a smoothing parameter (see [
21] for the procedure), providing
.
- (3)
A pseudo-set is calculated.
- (4)
Bootstrap estimates
of
are computed for
, by solving
- (5)
Steps 2–4 are repeated to provide for an a set of estimates . We use B = 2000.
Thirdly, because we rely on financial reporting and its punctuality, we examine the influences of the input and output data variations on the efficiency scores using fuzzy DEA. A fuzzy DEA model was developed to integrate the concept of fuzzy set theory with the traditional DEA by representing imprecise data with fuzzy sets: we evaluate the efficiency with imprecise data as it considers the fuzzy characteristics of inputs and outputs [
21]. Zadeh [
26] introduced fuzzy sets and several fuzzy DEA models have since been developed (e.g., [
23,
27], etc.). We use fuzzy data analysis, proposed by Kao and Liu [
23], using the Model (1). We assume symmetrical triangular fuzzy data, with a centred (true) value and lower and upper bounds calculated as a 10% deviation from the centre. The fuzzy DEA procedure calculates the intervals of efficiency scores at different confidence levels. The lower bound of the efficiency score of a considered DMU is calculated by setting its inputs and outputs to their least favourable values; and at their most favourable values for the other DMUs. Let
and
be
α-level sets, which represent different levels of confidence intervals for inputs and outputs, where
and
and
are fuzzy data
,
,
.
and
are their membership functions. Using
α-cuts, the lower efficiency score boundary for DMU
o = DMU
j,
is found by solving:
The upper value
can be found by solving the Model (5) where the inputs and outputs of a considered DMU are set to their most favourable values, and at their least favourable values for the other DMUs. Lower and upper values of efficiency scores with
α = 1 indicate that it is definitely possible that the efficiency score will fall in the range
, where lower and upper values are generally the same [
21]. At the other extreme, if
α is set to zero, the solution indicates that efficiency scores will never exceed or fall below the range
.
Finally, using Chen and Klein’s procedure [
28], we rank the fuzzy efficiency ranges for a chosen set of
α to obtain the ranking of the observed DMUs [
29]. The greater the Chen and Klein (CK) index, the more preferred the fuzzy number. The CK index is calculated as:
where
,
.
The whole DEA analysis was executed using the DEA Solver Pro 12.0 and the deaR package in R by Coll-Serrano, Bolós and Benítez.
4. Results and Discussion
The dataset used in this DEA analysis (based on [
30]) includes four inputs and two outputs. The selection of variables is crucial in DEA because a greater number of variables results in less discerning efficiency results [
31]. Additionally, the selection of variables must stem from the research problem and the criteria, which define efficiency [
32]. From the profitability perspective, as the banks’ ultimate goal, we concentrate on variables that make the greatest contribution to profit. Because banks’ main business activity assumes accumulation of deposits in the funding part, credit activity on the asset side, and payment transactions as the main financial services, these activities comprise the most significant groups of incomes and expenses in banks’ income statements, consequently impacting the banks’ profits. Therefore, we decided to use interest income (II) and non-interest income (NII) as outputs. II includes interests from the bank’s credit activities and other related revenues, and NII encompasses incomes from commissions and fees. The inputs in our analysis are expenses from the bank’s business activity; interest expenses (IE) connected to deposits collection accompanied by other related expenses, and non-interest expenses (NIE) that encompass all expenses on commissions and fees. The other two inputs are general administrative expenses and depreciation (AED), and the total expenses on value adjustments and loss provisions (EVA). AED includes costs of employees and amortization, office supplies, etc. The sample contains all large private banks in Croatia (asset share near or over 5% in total) during 2009–2018: Hypo banka/Addiko (HYPO/ADI), Erste banka (ESB), OTP bank, Privredna banka Zagreb (PBZ), Raiffeisen banka (RAIF), Societe Generale/Splitska banka (SOGE/SPL), and Zagrebačka banka (ZAB). The data was collected from banks’ financial statements.
Table 1 contains basic descriptive statistics results for variables included in this analysis including average, minimum, and maximum values for each bank.
Using the mentioned data, we calculate the BCC efficiency scores, and then ran a bootstrap and fuzzy model. Because we used a pooled sample approach, the sample of seven banks in 10 years corresponds to 69 DMUs (no data was available for bank SOGE/SPL in 2018 due to the merger with OTP bank). Firstly, we investigated banks’ efficiencies obtained by a BCC model. The results (
Table 2) reveal that the overall efficiency of the considered sample fluctuated throughout the observed period. Both the average efficiency score (
Table 2, row Avg.) and the share of efficient banks in the sample (
Table 2, last row) reveal that large banks in 2009 were not severely damaged by the global financial crisis. There were two reductions in efficiency: in 2010, caused by the deterioration of HYPO/ADI and ZABA; and in 2013, which continued until 2015, due to efficiency variations of HYPO, ESB, and OTP.
The obtained results can be explained by including the financial indicator analysis of the Croatian banking sector, shown in
Table 3. Taking into consideration that the asset share of the seven largest banks is about 85%, these observations are mainly the result of their business performance. The reasons for the obtained efficiency results relate to a postponed spill-over effect of the 2008 financial crisis on the economy; slowing of the banks’ credit activity (visible in the declining trend in interest income (II) values), which banks tried to offset with non-interest income (NII); and the deterioration in the existing credit portfolio quality (significant growth and volatility of expenses on value adjustments and loss provisions (EVA)), which obviously intensified from 2010 onwards (
Table 3). The financial crisis and its overflow to the economy resulted in a prolonged recession in Croatia, lasting until 2015. Large international banks significantly changed their business strategies in the region, with some of them decreasing their asset share significantly, while others used this market condition for takeovers. Additionally, the conversion of the Swiss francs loan portfolio into loans in euros took place in 2015. This also had a significantly negative impact on banks’ income statements and, consequently, on the most important accounting-based profitability indicators (ROAA, ROAE, NIM) and cost-efficiency indicator (CIR). In general, 2016 was the first year of total recovery from the crisis, which was reflected in the overall profitability and efficiency results. After five years of decline, total banking sector assets started to recover in 2017 (
Table 3). A visible decrease in the number of banks and an increase in concentration between 2009 and 2018 shows that bankruptcy and voluntary winding-up proceedings, initiated in some of the banks, impacted the survival of the efficient and competitive banks.
According to the BCC results, ZAB was the leading bank, and OTP was relatively efficient in 9 of the 10 years. They were closely followed by ESB, which was also an accommodating bank in its business strategy. Surprisingly, PBZ, which is one of the leading banks in Croatia (ranked second according to asset share), was not a leader in terms of its efficiency. The least efficient bank was SOGE/SPL, which was found to be relatively efficient only in 2017, just before the merger with OTP bank. Due to the merger, 2018 data are missing for SOGE/SPL. The results of OTP can be explained by its specific business strategy in the observed period, primarily oriented to the conglomerisation process with the aim to become one of the leading banks in Croatia. For that reason, OTP was included in the sample although it was technically a medium-sized bank, but consistently on the upper until 2018. Because the banking sector experienced significant legal, social, financial, and economic adjustments, banks’ business performance and competitiveness were significantly impacted. Consequently, many smaller banks were forced to be acquired or merged, mostly by larger banks. Among these, OTP was notable: firstly, Banco Populare Croatia merged with OTP in 2014; in 2018 OTP moved its head office to Split; and finally, in November 2018, SPL merged with OTP. After that merger, the enlarged OTP was ranked fourth according to asset size in the Croatian banking market, having a market share of more than 10%.
The estimated efficiency depends on the sample inputs and outputs, and consequently on the efficient frontier. As explained previously, we included OTP in a group of large banks even though OTP only became a large bank in 2018 (until then it was a medium-sized bank with 1% < total assets < 5%). Moreover, HYPO/ADI became a medium-sized bank in 2018, but had total assets slightly below the 5% limit, so it was left in the sample. To exclude the possibility that these interventions in the sample affected the results, we chose to run a BCC model with a bootstrap approach. The bootstrapping BCC was performed using 2000 replications with the optimal bandwidth factor, as proposed by Daraio and Simar [
25], referred to as the “robust normal-reference rule”. The range of the efficiency scores, and the lower and upper 95% confidence intervals (CI), are presented in
Figure 2.
Figure 2 shows 95% confidence intervals of bias-corrected efficiency scores obtained in the bootstrap procedure after 2000 replications of randomly generated samples from the original set. The shorter the interval, the greater the certainty about the presented efficiency score. Moreover, it is preferred for the bar in
Figure 2 to be closer to the value of 1. Results presented in
Figure 2 confirm that HYPO/ADI and SOGE/SPL had large deviations in their (in) efficiency during the study period. OTP was the most consistent bank in terms of its efficiency during the observed period, experiencing a small dip in 2015. RAIF had low variability but nonetheless worrisome efficiency results, which place it as one of the least efficient banks, in line with SOGE/SPL and HYPO/ADI. Thus, it can be seen that SOGE/SPL is extremely unlikely to be relatively efficient regardless of the generated sample. However, SOGE/SPL and RAIF appear to have had a stronger recovery in 2017 (smaller CI closer to 1), whereas the efficiency intervals of RAIF and HYPO/ADI in 2018 overlap a great deal. ZAB and ESB have the highest efficiencies and are shown to be the most efficient. Their efficiency scores have little variability, with the narrowest confidence intervals concentrated around 1.
Moreover, the difference in the efficiency of ESB and ZAB is not pronounced; the ranges of their bootstrapped efficiency scores overlap to a large degree. PBZ is a follower of ZAB, ESB, and OTP; its 95% CIs overlap with those of OTP and ZABA in the first and last years, and the CI narrows towards inefficiency during 2012–2015. These findings are independent of the inclusion of OTP and HYPO/ADI in our sample, meaning that similar results would be achieved using the sample without OTP (and HYPO bank in 2018).
Furthermore, the total expenses on value adjustments and loss provisions (EVA) are usually detected as a grey area in which possibly doctored numbers can be found in banks’ financial statements. Therefore, to analyse how much slight deviations in banks’ EVA from their true values can affect the efficiency results, and to thus exclude the impact of the possibly doctored numbers of EVA on the efficiency score, we applied fuzzy data analysis using the
α-cuts approach proposed by Kao and Liu [
23]. We chose to use triangular fuzzy numbers with a 10% deviation from the original values for variable I4 (EVA). Alpha-cuts were calculated for 11 equally distributed values between (and including) 0 and 1. Using the model (4)–(6), we obtained a set of intervals for efficiency scores
for each value of alpha. These intervals are bounded by the lower and upper values of the efficiency scores for each value of alpha. Increasing the value of alpha shortens the interval of the efficiency score and increases imprecision. For example, for
α = 0, we obtain a range for which we are sure that the efficiency score will never be outside of the interval, and for
α = 1 we are sure that the efficiency score will definitely fall within that interval, although it is imprecise [
23].
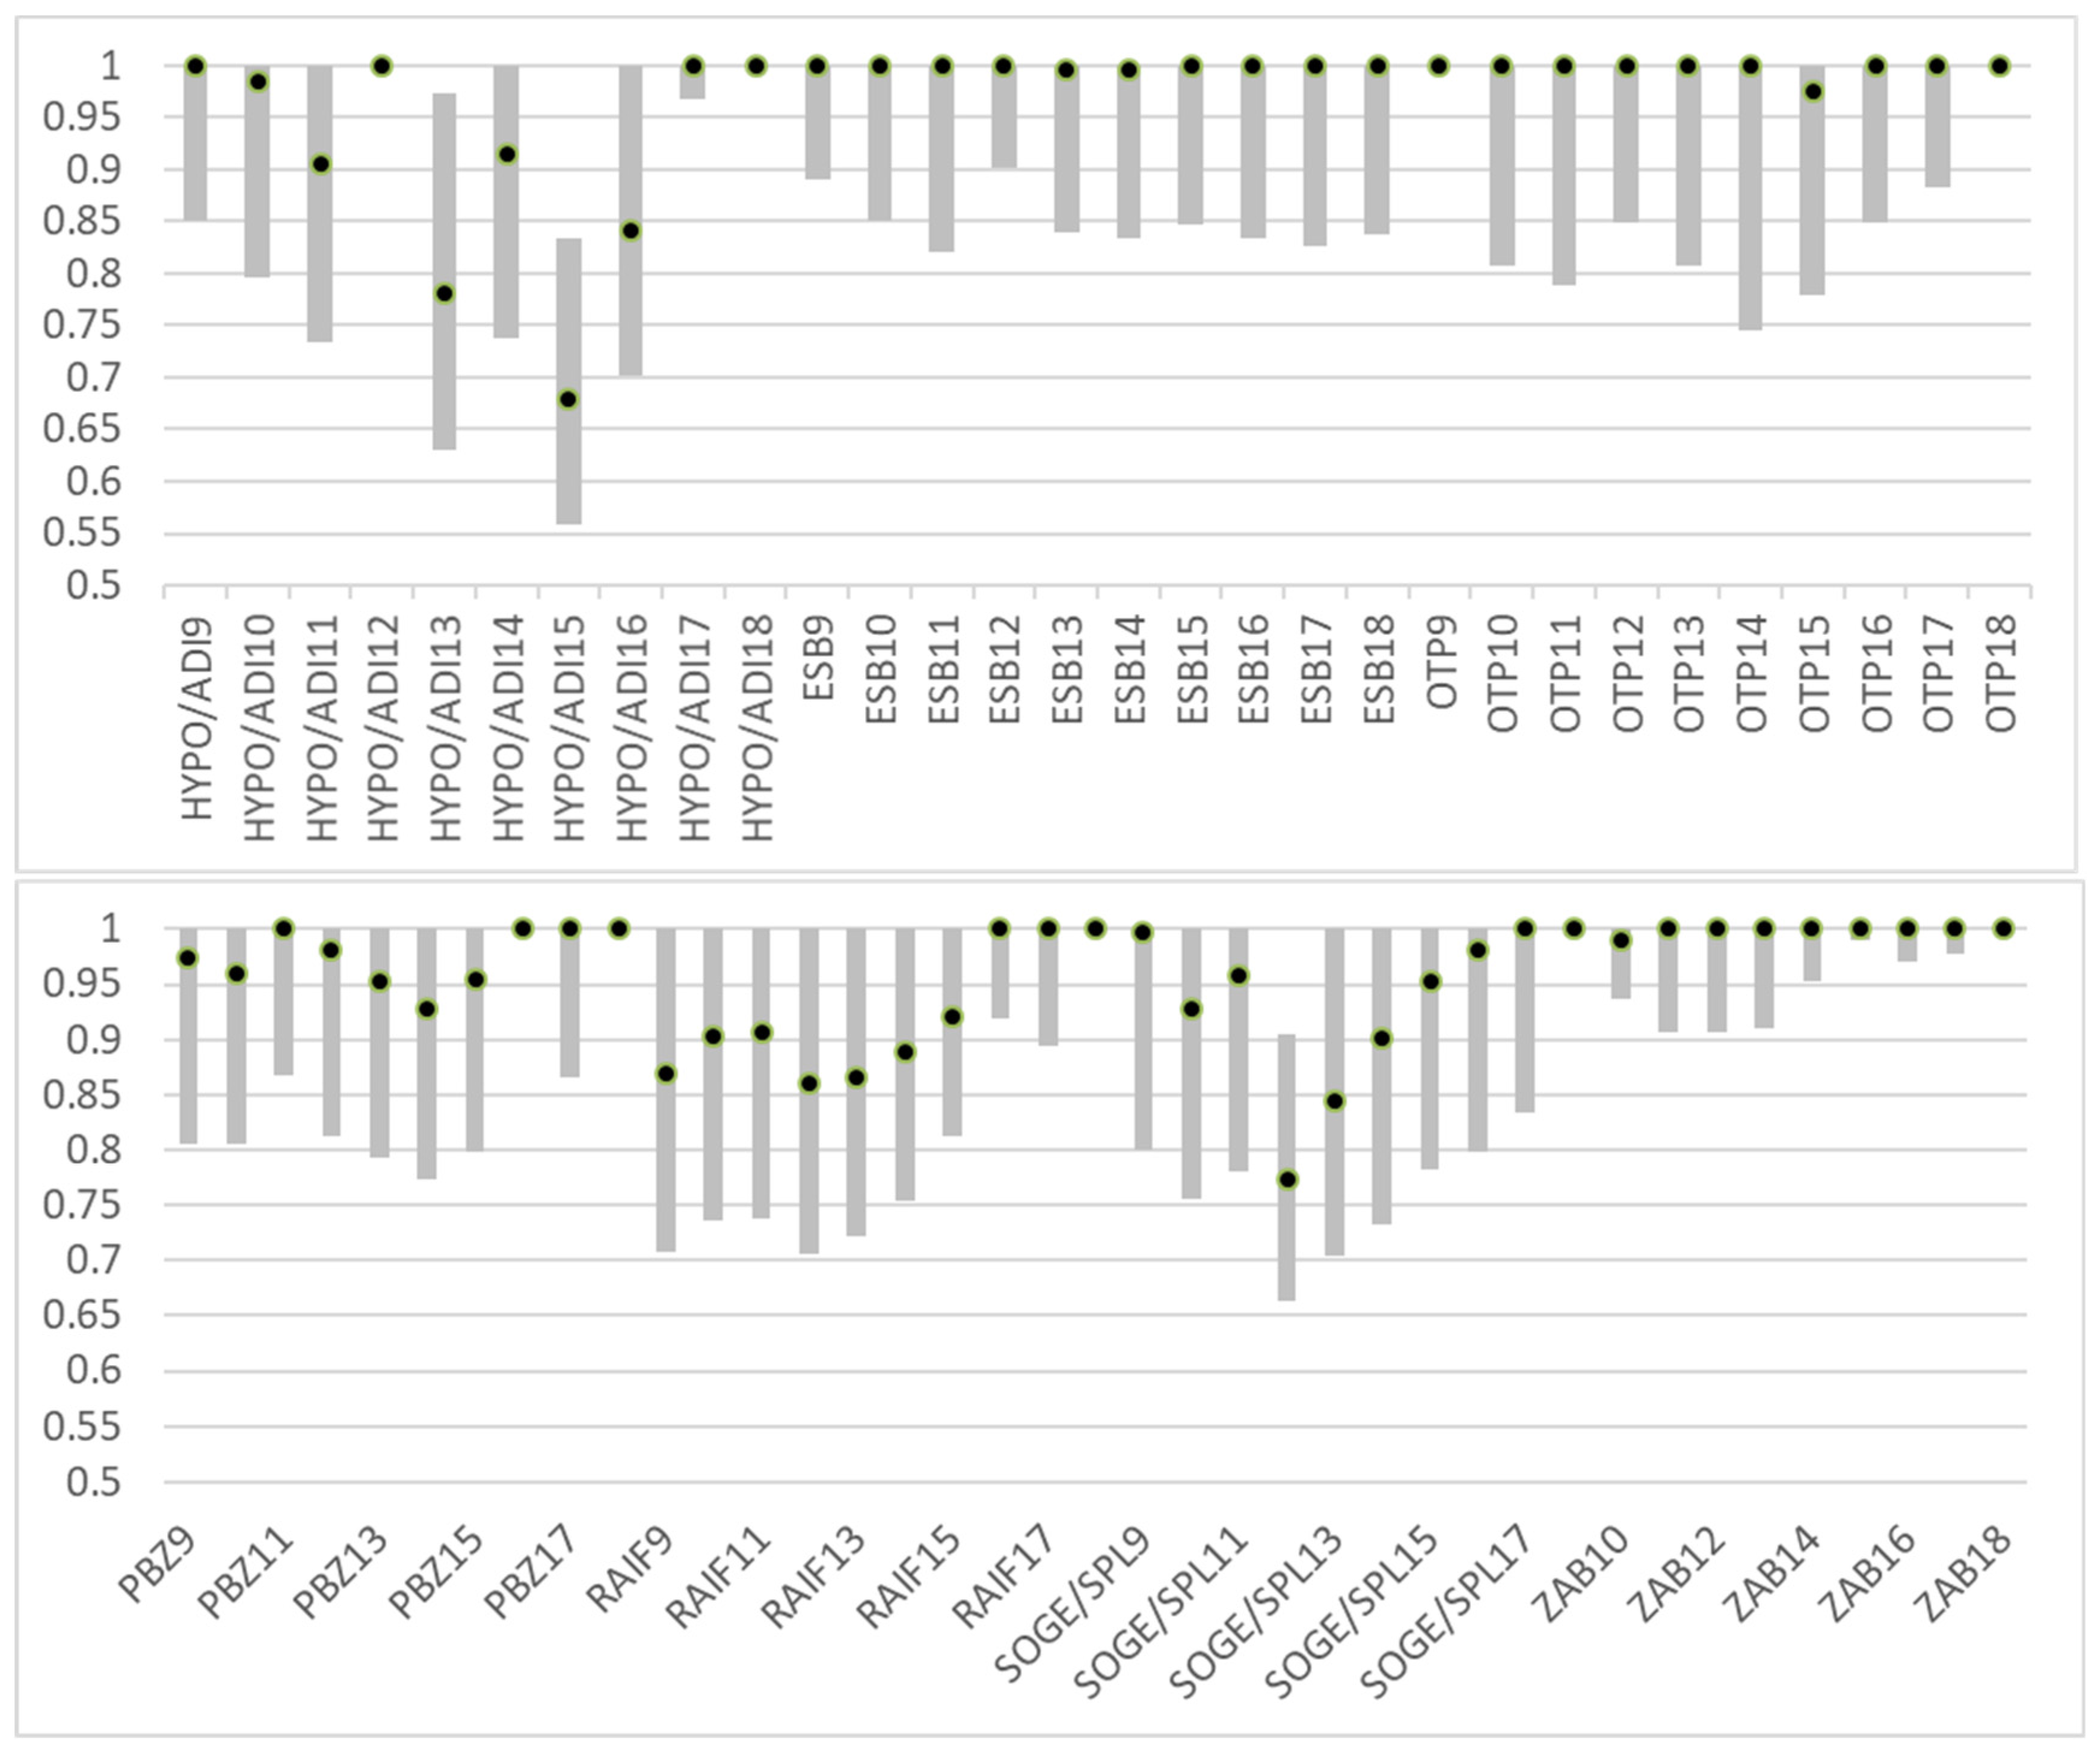
Figure 3 shows the intervals of the efficiency scores for all banks for
α = 0 and point values obtained for
α = 1. The narrower the interval at
α = 0, the more robust the efficiency score to variability in EVA. Banks whose ranges of efficiency scores in
Figure 3 are among the narrowest and closer to the value of 1 can be considered efficient because their efficiency is almost independent of the 10% volatility in the EVA data. These banks are ZABA in 2009 and 2014–2018; RAIF in 2018; PBZ in 2016 and 2018; OTP in 2009 and 2018; and HYPO/ADI in 2012 and 2017–2018. The efficiency of large banks with wider intervals of the efficiency measure, including the value 1, is more dependent on the volatility of the value of EVA. Banks whose fuzzy efficiency score intervals do not include the upper value of 1 can be regarded as inefficient regardless of the 10% volatility in EVA. These are HYPO/ADI in 2013 and 2015, and SOGE/SPL in 2012. For
α = 1, we obtain the same lower and upper bound, shown as a dot in
Figure 3. These values indicate the narrowest fuzzy efficiency score, which is the most imprecise.
Using the CK index ([
28,
29]), we ranked the banks following the efficiency scores obtained by a fuzzy model (
Table 4), using Equation (6) for
.
Following the presented results, ZAB seems to be the most resilient to small data changes in EVA. If we compare these results to original BCC results, ZAB was BCC-efficient in all years but 2010, and here we observe that its efficiency depends on the value of EVA, although not significantly. Even though ESB and OTP were on a par with ZAB according to the original BCC results, this reveals that their efficiency scores are much more dependent on the variations in EVA. It was expected that HYPO/ADI and SOGE/SPL are at the bottom of the leader board, and that HYPO/ADI is possibly the least efficient bank due to its riskier business strategy and connected affairs before Addiko took ownership of HYPO bank. This also reveals that RAIF had a significant deviation in its business, ranging from the possibly most efficient (2018) to possibly least efficient (2009–2014) bank in the sample. The 10% variability in EVA included in the fuzzy models does not significantly affect the original findings of efficiency obtained by the BCC model.


