Abstract
The modeling of the graphical representation of business processes (BP) or workflows in enterprise information systems (IS) is often to represent various activities, entities, relations, functions, and communicate between them in an enterprise to achieve the major goal of operational support. In this work, we decided to use graph representation approaches, especially hypergraphs to depict the complex relationships that exist among the artifacts and constituents of BP for more efficient and accurate manipulations. We used bipartite and further hypergraph formats for storing and curating data. We have investigated the various descriptive languages and representation models of BP as process modeling, workflow and process integration, and object-oriented (OO) languages. We have carried out experiments using different approach combinations, but for observing quiltedrepresentation, we focused on the main consistencies of “DBP”. As the final approach, we used the “DBP” stream and data schemes that are defined by us to proceed with using pure Python for manually generating data and external Python libraries to store, curate, and visualize “DBP”.
1. Introduction
Nowadays, the term BP modeling and its management play an important role in organizations because they make available their business and data in a format that designers can use for their models to represent the different processes. The hypergraph representation has shown its superiority in correlation formulation among samples, and has broad applications for solving problems in several domains and various fields. The goal of this paper is to show the value of several models by establishing a taxonomy for the negative and positive features (advantages and disadvantages) that facilitate making comparison analysis between models. These similarities aid us in finding a syntactical element in the representation codes and functionalities that prove helpful for the models’ transformations. The other aim is to show the importance role of the hypergraph in different domains, and especially for BP performance.
The hypergraph is widely used, which proves its importance nowadays. The representation of the hypergraph concept implemented in Python using matrices and forms can be applied in our future works. The hypergraph implemented is used for process instances by several new methods, and the implementation aims to represent the hypergraph in different ways for easier use later.
The paper structure follows the introduction with the second section, which introduces several basic concepts associated with BP definition, while the third section defines the concept of BP modeling, its patterns, and the purpose of those various BP modeling tools.
A survey on existing models with a detailed list of advantages and disadvantages for each model is represented in the fourth section. In the same section, we summarize the comparative points between the previously listed models. The relevant theories of the hypergraph as a sound ground representation, application domains, and their importance are presented in Section five.
In the sixth section, an experimental part is represented with the various tools used. The later three dedicated approaches that we established during research are defined in the seventh section. This is followed by the different ways of representation.
The last section defines hypergraph-based representation for BP. Finally, the conclusion summarized the various ideas discussed in the paper and describes future work, which explains the expression of the hypergraph for ameliorating BP representation.
2. Business Processes
The notion of process has become an important asset for daily life in organizations and enterprises. It helps to achieve organizational objectives and defines IS management. It has a relevant role related to the concept of information. The use of BP can be considered diverse, according to the view of the company or the structure of resources used. Taking into consideration various references, there are several perspectives defining and conceptualizing BP:
The definition below is a combination of [1,2] in order to well define the concept:
Definition 1.
BP is a collection of activities that takes one or more kinds of input and creates an output that is of value to the customer. Generally, it is a set of activities undertaken in a specific objective that can accomplish a specific organizational goal.
Another definition from [3] mentioned the following:
Definition 2.
A BP is a step-by-step algorithm to achieve a business objective when the steps of the process are called activities.
The Workflow Management Coalition (WfMC) defines BP as follows:
Definition 3.
A BP is a set of procedures or activities related to each other to collectively achieve a business purpose by challenging roles and functional interactions within an organizational structure.
In addition, this definition given by [4] describes the term BP as follows:
Definition 4.
BPs are a structured set of work activities that lead to specified business outcomes for customers.
Grover and Teng [5] introduced BP as well by the following:
Definition 5.
A BP is nothing more than logically related tasks that use the resources of a company to achieve its defined business outcome.
The term BP is intended to embrace not only the control flow [6], i.e., the chronological sequence of function execution, but also the descriptions of data, organizations, and resources that are directly associated with it.
The definition of BP can be simple, including solely a sequence of activities, or a complex, including a controlled composition of services and activities performed under condition, in parallel, or encapsulated in sub-processes. In order to define a BP, it is necessary to define the following:
- Activities which are the basic elements of a BP and assignment of resources.
- Business services providing a business operation.
- Business logic, including the rules that define the control through flow during the BP execution.
A detailed consideration of the various referenced definitions is excluded from the scope of this paper. The focus of this paper is on a BP model, and the definitions listed in this paragraph are all acceptable definitions to accomplish the set goals. The next section explores a BP modeling concept.
3. Modeling of Business Processes and Its Patterns
We often model BP to represent the activities, items, entities, their relation, and intercommunication between them in an enterprise, which are needed for its success. BP modeling and management [7] today emphasize the term BP because it renders available the business and data in a format that designers can use for models.
Within a definition for a BP, in the last section, the next step is to define the BP model, which is generally an abstract representation of reality that excludes much of the world’s infinite detail. According to [8], the concept of the BP model is defined as the following:
Definition 6.
The BP model is the abstraction of how systems and individuals collaborate to meet a business need described in the notation and representation of knowledge and expertise of the practice of the profession.
Another definition mentioned in [9] is as follows:
Definition 7.
The model is an abstract representation of reality. Details that are unnecessary are not included as a rule in most modeling efforts. The modeler determined which aspects of the real system are of interest and which system elements are to be modeled.
A BP model or schema is a formal representation that must present all the elements as well as the objective or the reason behind the creation of the process, the event causing its initialization, the inputs, the outputs, the resources consumed, the activities carried out, and the execution sequence. BP modeling tools that allow process representation is a lighter digital method that can then be transferred to a live automated process.
BP modeling is one of the most commonly used techniques in requirements analysis [10], often taking data flow diagrams as a form. There are several newly developed methods for modeling, and these techniques vary significantly. Most BP modeling approaches focus on some diagram-like graphics, which reveal the coordination between activities in BP.
The BP diagrams should contain activities and activities connectors, a way to represent decision points, and other strategies to express various activity coordination patterns: (patterns mean the recurrence of same basic features during the life cycle of a process) sequential flow, branching, and parallel execution. In the following are defined various basic patterns BP models:
- Sequence is an ordered series of steps following each other, or series of activities where each activity starts after completing the previous one.
- Exclusive choice can be perceived as a branch that comes from a single activity and goes to precisely one of several paths. The path is chosen either by using a decision or by the mean of a condition.
- Parallel split is defined as a gateway that uses a simple control link to partition two or more activities. These activities are processed and run in parallel. We can also define it as a branch from a single activity that dispatches to multiple parallel paths.
- Multiple choice, compared to the exclusive choice, allows the choosability between all possible alternative paths at the performance time. Its execution is made by choosing only one or more parallel branches that satisfy a particular condition.
- Multiple merge is multiple paths merging without any control. It is a point at which one or more branches of the control thread join without synchronization.
- Cycle is a mechanism that uses some conditions to repeat a collection of patterns defining a set of activities, actions, and work tasks, i.e., the same instructions multiple times.
The purposes of various BP modeling tools are as follows:
- A BP model is a kind of plan that guides the flow of the trade from the start to the end to provide a clear understanding of how the process works;
- It provides the basis for improving the process and support BPM requirements;
- It serves as a basis for decision support, affects decisions by setting priorities on objectives, and works as a basis for obtaining resources;
- It provides consistency and controls the process.
4. Business Process Models
4.1. Existing Business Process Models
Several researchers made a comparison between various existing models [11] and compared them based on four views of a BP, namely, the informational view, the functional view, the dynamic view, and the organizational view. In a previous study [12], we compared several BP tools based on structural, syntactic and semantic factors. In the literature, there exist different BP models and languages as bellow:
4.2. Petri-Nets
The classical petri-net was invented by Carl Adam Petri in the 1960s Since then, researchers have used it to model and analyze all kinds of processes with applications ranging from communication protocols, hardware, and embedded systems to flexible manufacturing systems and user interactions. Recently, researchers extended the classical Petri-net with color, time, and hierarchy [13]. These extensions facilitate the modeling of complex processes, where data and time are important factors.
Petri-nets gained an increase in usage and acceptance as a method for describing information flow and control [14]. As a modeling language, it graphically depicts the distributed system’s structure as a directed graph with annotations. Such Petri-nets have place nodes, transition nodes, and directed arcs connecting places with transitions. Petri-nets model the dynamic behavior of systems. The places of a Petri-net contain tokens; the firing of transitions removes tokens from the input places of the transition and adds them to its output places.
Example 1.
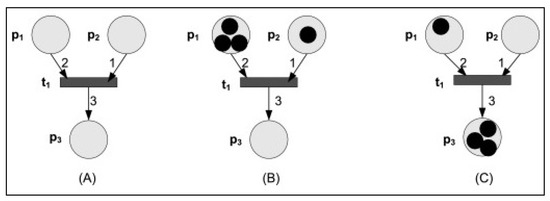
Figure 1 shows Petri-nets firing rules (https://www.sciencedirect.com/topics/computer-science/petrinets, Accessed Date: 7 November 2020). (A) An unmarked net with one transition t1 with two input places, p1 and p2, and one output place, p3. (B) The marked net, the net with places populated by tokens; the net before firing the enabled transition t1. (C) The marked net after firing transition t1, two tokens from place p1 and one from place p2, are removed and transported to place p3.
Figure 1.
Firing rules of Petri-nets.
4.2.1. Finite State Machines (FSM)
An FSM is a well-known model for formal system specification. It is also a standard model used in the mathematical foundation of computer science. This model concept is defined and discussed in innumerable books and papers. An FSM is a behavioral model that contains states and transitions. In our dissertation, FSM representation is often used as a BP model—the focus of this section. We present its components and its utility in detail.
FSM is composed of three sets: a set of states, a set of actions, and a set of transitions labeled between states—an initial state and final states. It has a five-element tuple: , where M is an input alphabet, Q is a finite set of states of A, in Q is the initial state, is the final states, and is the transition function.
Figure 2 shows the structure and the different elements of the FSM, where is the initial state, is the final state, and are transitions.
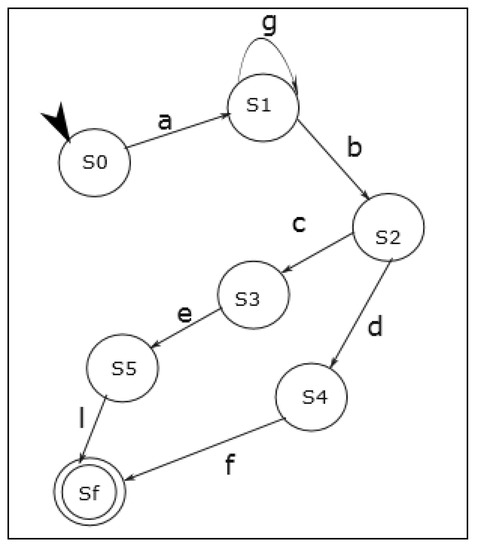
Figure 2.
FSM structure.
4.2.2. Business Process Model Notation (BPMN)
BPMN is a fundamental ontology that represents domain information model entities. BPMN [15] creates a standard to fill the gap between the design and implementation of BP. It provides a visual language in the form of graphical notation for defining BP in a diagram.
BPMN is a standard language for describing BP, particularly at the domain analysis level and high-level system design. A growing number of process design, EA, and workflow automation tools provide modeling environments for BPMN.
The most significant advantage of BPMN is that it is a standard with a well-defined syntax. Therefore, many business analysts are familiar with it, which makes collaboration much more effortless. Additionally, most modeling tools support BPMN (https://creately.com/blog/diagrams/business-process-modelling-techniques/, Accessed Date: 8 November 2020), which makes it much easier to share and edit, even if using different software. All these make BPMN the most popular BP modeling technique at the moment.
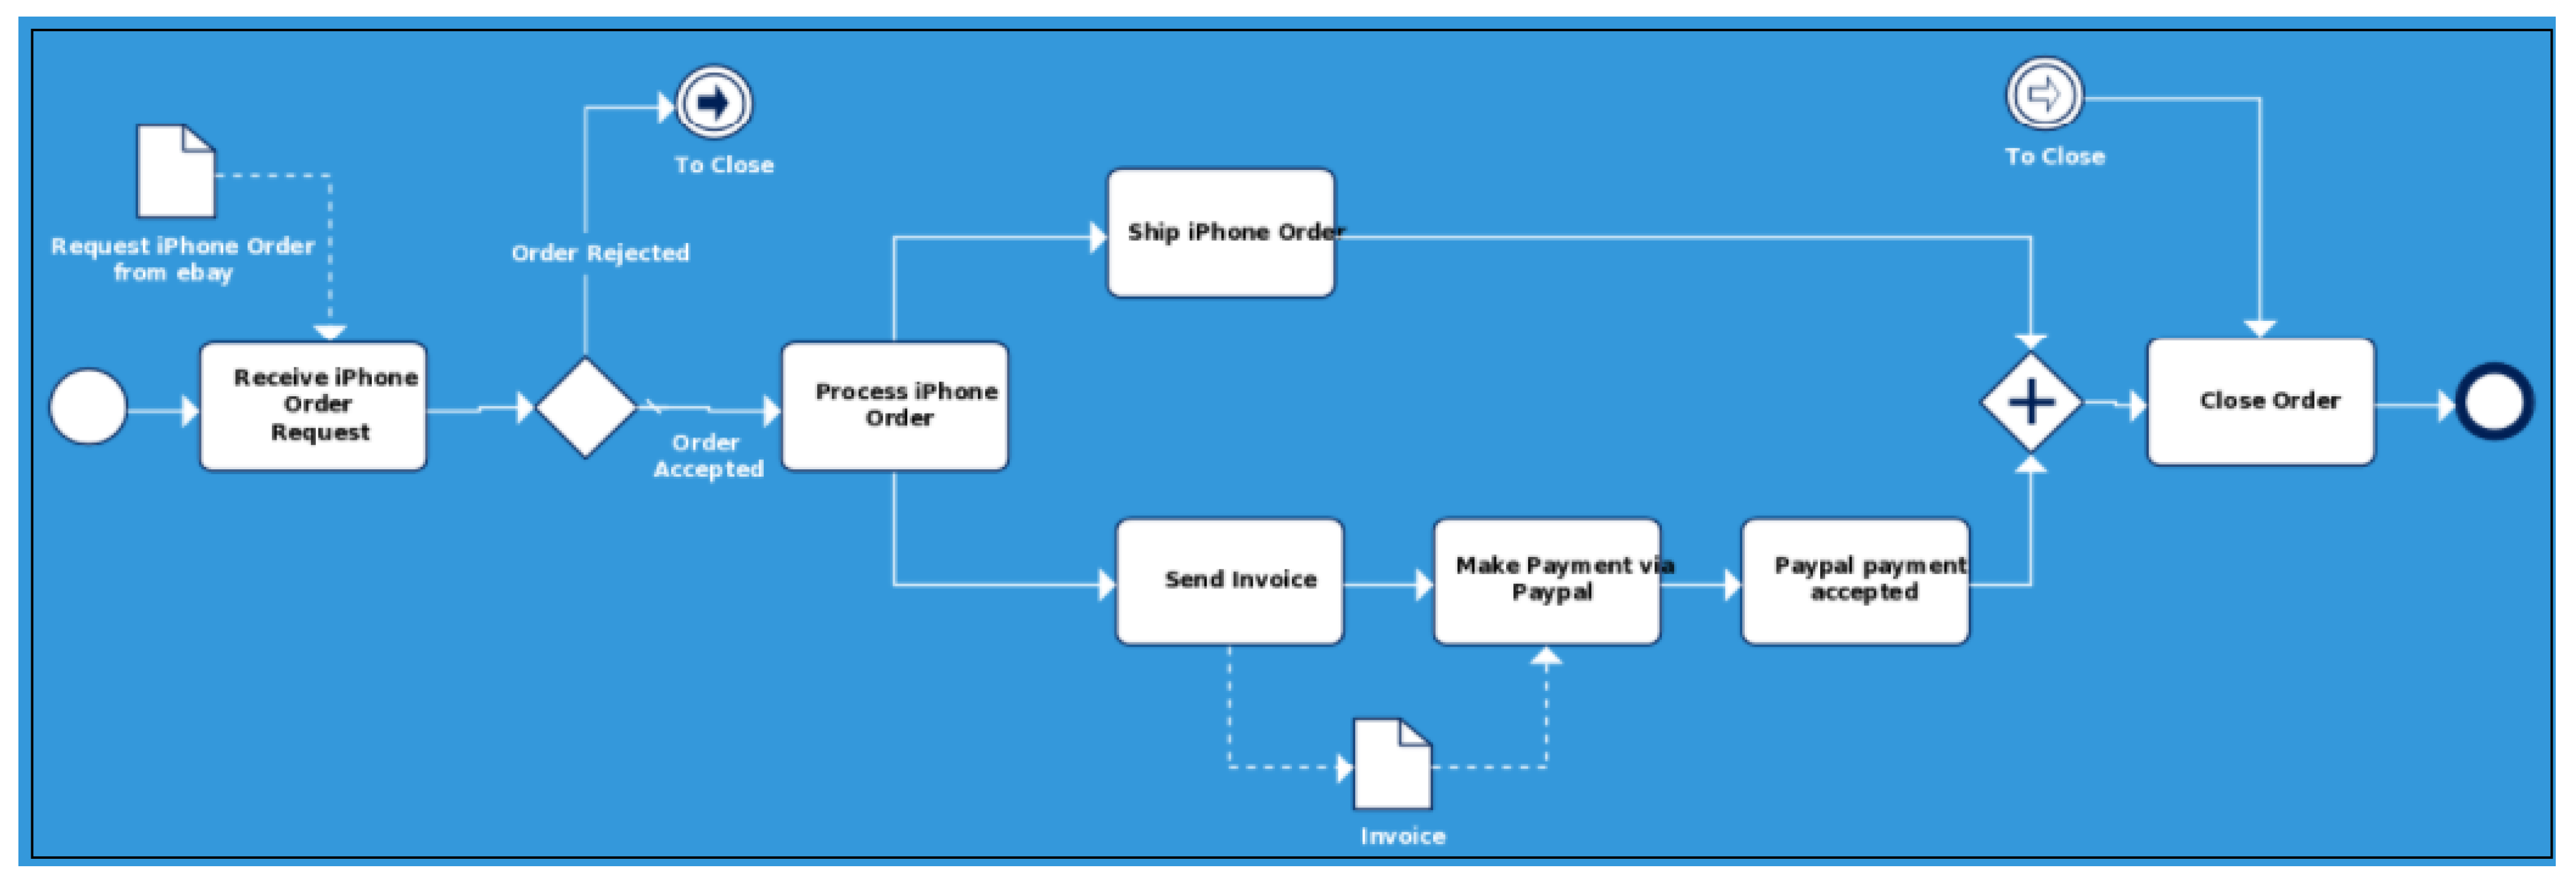
Figure 3 describes an example where an order of an iPhone from eBay (https://creately.com/blog/examples/bpmn-templates-model-processes/, Accessed Date: 8 November 2020) is expressed by a BP.

Figure 3.
BPMN diagram of iPhone ordering process from eBay.
This standard provides organizations the capability of understanding internal business procedures in a graphical notation. It also provides an ability to communicate these procedures in a standard manner. Furthermore, the graphical notation facilitates the understanding of the performance [16], collaborations and business transactions between organizations.
4.2.3. Unified Modeling Language (UML)
UML is one of the most used modeling languages. UML is a meta-model with several packages; each package introduces concepts expressed through graphical notation and diagrams. The UML language is a standard offered by the Object Management Group (OMG) that allows defining functional and technical needs in an object-oriented (OO) development environment, using several diagrams and several concepts to increase the semantics of these models.
UML is a standard offered by the OMG, allowing functional and technical needs in an OO development environment. It uses several diagrams and several concepts to increase the semantics of these models. UML is used when modeling BP, using OO analysis tools. Jacobson and Booch Rumbaugh developed UML as a universal notation for OO analysis. UML offers specialized diagrams (including diagrams of activity diagram, sequence diagram, class diagram, state charts, etc.), each having a specific function.
The diagram commonly used in UML to model processes is the activity diagram. It allows the description of the process behavior in the form of flow or activity flow. We can use UML to model BP, model the logic of the use cases or user scenarios, or model a business participant with the related business activities and business logic. The UML activity diagrams are the OO equivalent to the data flow and flowchart diagrams using structured development methods.
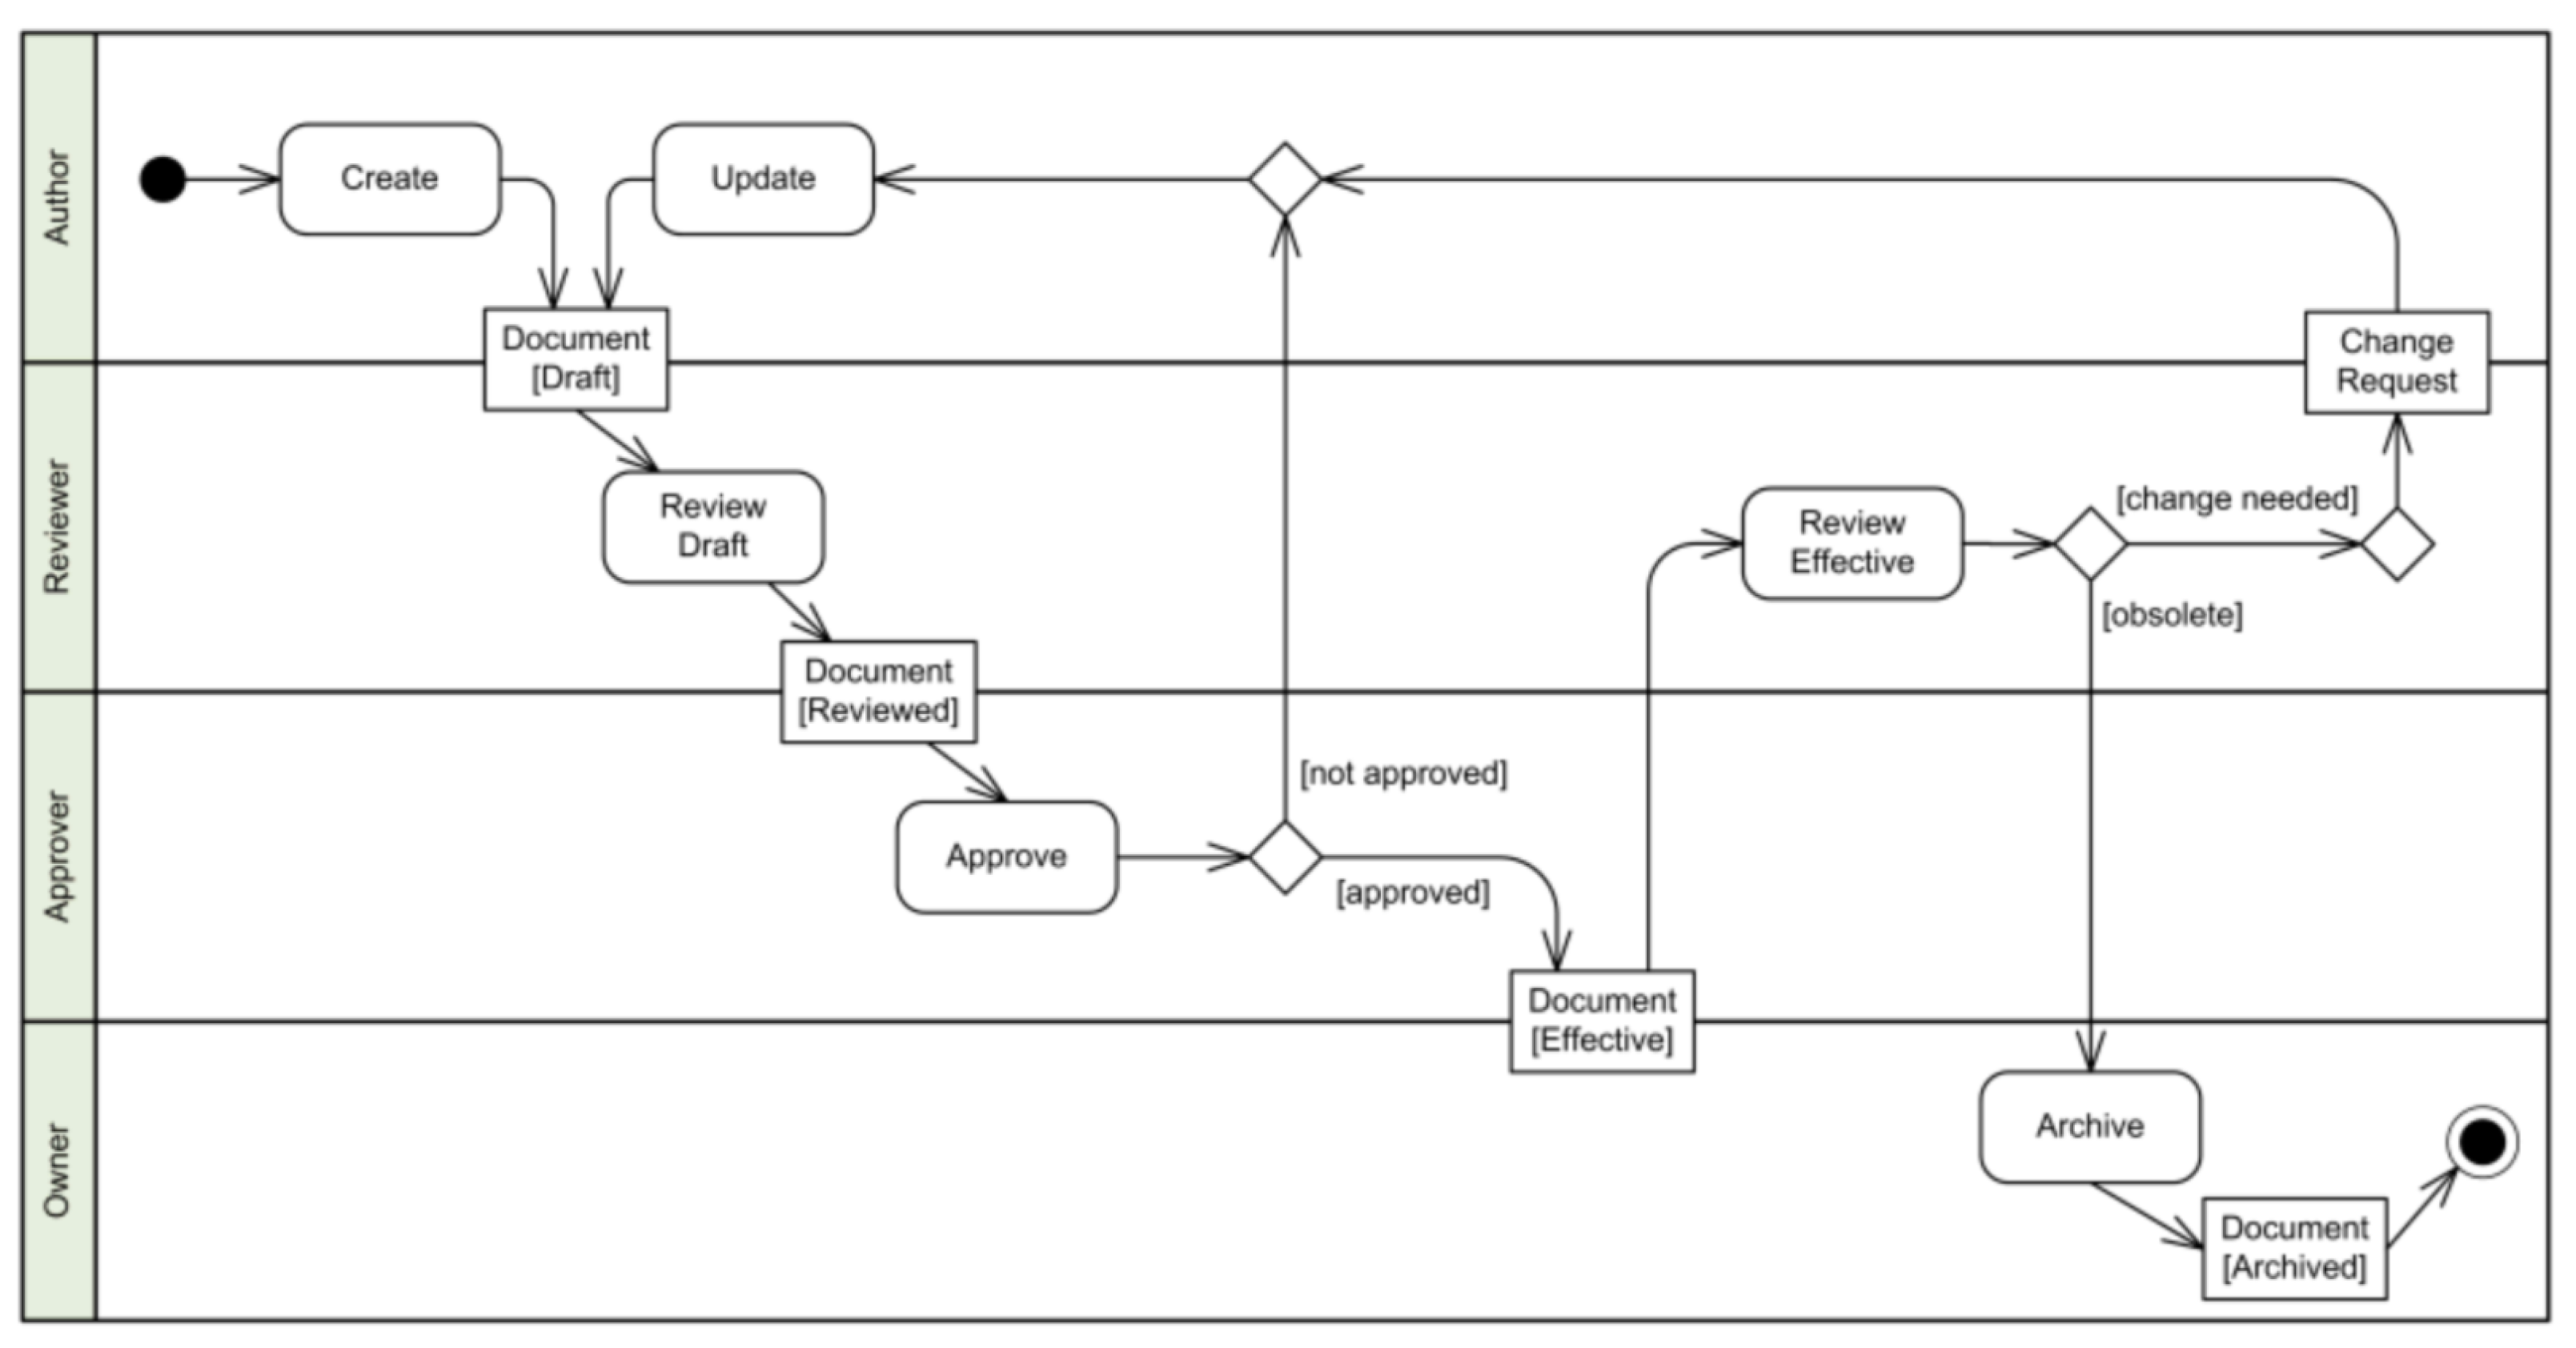
The diagram commonly used in UML to model processes is the activity diagram. Figure 4 (https://www.uml-diagrams.org/document-management-uml-activity-diagram-example.html, Accessed Date: 15 December 2020) illustrates an example of document management process activity.
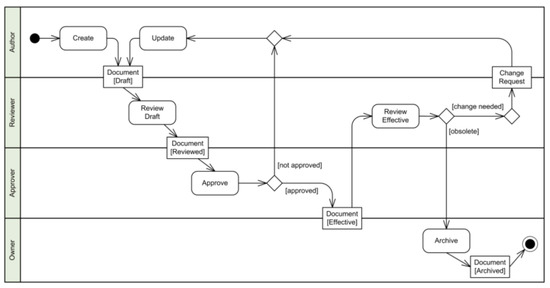
Figure 4.
An example of document management process activity.
4.2.4. Business Process Execution Language (BPEL)
BPEL [17,18] is a standardized language for specifying the behavior of a BP based on interactions between a process and its service partners. It defines how multiple services interact with a web service, using WSDL documents through a set of operations and messages to deal with it.
A BPEL process uses a set of variables to represent the messages exchanged between partners (they also represent the state of BPs). The WSDL document is represented through a set of operations and statements to deal with it. A BPEL process uses a set of variables to represent the messages exchanged between partners. They also represent the state of BP.
BPEL with the XML semantics have become the rapid method for information extension. We use it as an interactive language for web services. BPEL is XML-based in textual format and contains complex constraints. The article [19] used it to model BP, and provides a fundamental ontology to represent domain information model entities.
Example 2.
<process name = “Supplier process”>
<partnerLinks>
<partnerLink name = “client” …/>
<partnerLink name = “warehouse” …/>
</partnerLinks>
<variables>
<variable name = “BdC” type = “xsld: Command”/>
<variable name = “resBDC” messageType = “string” />
<variable name = “availability” type= “string”/>
</variables>
<sequence>
<receive name = “receiveBdC”
partnerLink = “client” portType =“ptCommand”
operation = “opCommand” variable =“BdC”
createInstance = “yes”/>
<invoke name = “demandavailability”
partnerLink = “warehouse”
…
inputVariable = “BdC”
outputVariable = “availability”/>
<switch>
<case …> < ! available case >
< ! Initialize var repBdC with positive response >
<reply name = “ResponseBdC”
partnerLink = “client”
portType = “ptCommand”
operation = “opCommand”
inputVariable = “resBDC”/>
<ow>
<invoke name = “sendShippingSlip” …/>
<receive name = “ReceiveTransferOrder” …/>
</ow>
</case>
<case …> < ! case availability >
< ! Initialize var resBdC with negative response >
…
</case>
</switch>
</sequence>
</process>
In this Example 2 of BPEL code, named supplier process, we have two main tags: variables, partnerlinks and the part of the activities between the two tags of the start and end of the process (the root element of the BPEL).
- Partnerlinks: there are two partners who represent the participants of the customer and warehouse process.
- Variables: BdC, resBDC and availability.
- The activities part: this is a sequence of activities (receive, invoke, switch) included between the two kicks at the start and end of the sequence.
4.2.5. Process Algebras
In computer science, the process algebras (or process calculi) is a diverse family of related approaches for formally modeling concurrent systems. Process algebras provides a tool for the high-level description of interactions, communications, and synchronizations between a collection of independent agents or processes [20].
Process algebra is a specification approach for communication between processes and events. Its essential components are the syntax as determined by the well-formed combination of operators and more elementary terms. The syntax of a process algebra [12] is the set of rules that define the combinations of symbols. These symbols are correctly structured programs in that language: the process algebra described by the structural operational semantic (SOS) approach, and the various approaches of the calculus of communicating systems (CCS), communicating sequential processes (CSP) and algebra of communicating processes (ACP). The semantic-based on algebraic laws are the fundamental axioms of an equations system and process.
4.2.6. Event Driven Process Chain (EPC)
A flowchart called “event-driven process chain” (also known as merely “EPC”) is used for modeling the BP, configuring a so-called “enterprise resource planning” implementation as well as for improving the BP. It is also a modeling language invented by Professors Wihelm and Nuttgens in 1992, EPC; instead, a semi-formal modeling language [21] for the description of BP is used for its visualization and analysis in the realm of BPM. The EPC representation allows signifying other business IS features, such as data structure resources and functions, using nine elements, including events, functions, a unit of organization, paths, control flows, logical connectors, information flows and materials, moreover and organizational unit assignment. EPC is used to describe the operational sequence of processes using rules for EPC modeling.
A simple event-driven process chain (Figure 5) (https://www.ariscommunity.com/event-driven-process-chain, Accessed Date: 20 December 2020) may look as follows:
Figure 5.
Example of EPC.
4.3. BP Models Advantages and Disadvantages
From several references and deep research about BP models, we conclude the two Table 1 and Table 2 below, which show the various advantages and disadvantages of each model described in the previous section.

Table 1.
BP models’ advantages.
Table 2.
BP models’ disadvantages.
4.4. Viewpoints of Comparison
There are numerous BP models in the literature; we have chosen some particular BP models that proved to be useful. To see the similarities and the discrepancies, we may highlight various viewpoints in our comparison. Mainly, we can group them based on several aspects, including context, ambiguity, structure, semantic, notation, terminology:
- Petri-net has a simple structure, and it is easy to analyze, simple and, suitable for testing the model. However, the low-level net is not suitable for performance analysis. To enable this function, we need to use time and color.
- Petri-net is a graphical and mathematical tool, usually applied in the simulation of discrete-event dynamic systems.
- FSM is easy to understand by users and its well-known formal model can be easily checked.
- UML Activity diagrams and BPMN are quite similar technologies, and they are suitable for static modeling of BP. Nonetheless, BPMN is more convenient and has much more symbolic power than UML since BPMN covers simulation and executing process models by automating (wherever possible) the process steps.
- UML is a visual language for OO modeling approaches; it is mainly used in software modelling and helps model class connections.
- Both FSM and UML are techniques used during both design and specification phases of development depending on mathematical and computational tools.
- Petri-nets and process algebra are formal graphical representations that are understandable because of their design in the form of a graph, they have useful connections both to graph and linear algebra which can be exploited for the verification of systems.
- Often, we use BPMN and BPEL (Initially and by design) in conjunction: BPMN for the business user-centered perspective and BPEL for the technical specification.
- Both the EPC and UML activity diagrams have similar concepts and have different contexts under which they are developed. They focus on modeling a system (process inside system). No restrictions appear to exist on the structures of EPC, but non-trivial structures can involve parallelism and have ill-defined execution semantics. Once they are as we described, they resemble UML activity diagrams.
- The UML models are richer of concept than others because of the higher view of modeling for specific cases, but EPC structure can be expressed more efficiently rather than UML.
5. Hypergraph as a Sound Ground Representation
5.1. Theory of the Hypergraph Concept and Definitions
Hypergraphs as representational structures are apt for system modeling, analysis and specification, exclusive to information and software systems. Formal tools consistency checking are available by test algorithms.
Unlike other mathematical theories of the 20th century, the hypergraph theory is one of the fresh independent theories proposed to generalize the theory of graph. The 1960s witnessed the birth of this hypergraph theory in France (France school) by C. Berge, and the leaders of mathematics from Hungary: Paul Erdös, László Lovász, Paul Turán.... It was the first generalization of hypergraph concepts. It was a generalization of the concept of graphs into the hypergraph, which they extended, as well as the concept of edge into (hyperedge).
A hypergraph is a structure that describes complex relationships that can be explored among models during the analysis and design of IS; it is a generalized graph theory that plays a vital role in discrete mathematics [22]. We start with its basic definitions as follows.
Hypergraphs generalize the notion of a graph by defining hyperedges that contain families of vertices, unlike conventional edges which join only two vertices. From a theoretical point of view, hypergraphs make it possible to generalize certain theorems of graphs, or even to factor several of them into one. From a practical point of view, they are sometimes referred to as graphs since they better model certain types of constraints. In this section, we present some essential terms of hypergraphs.
Definition 8.
We say Hypergraph H is pair of a finite set of and a set E. where V are vertices (without repetition) and E elements are edges, which are a subset of V [23], where m , and .
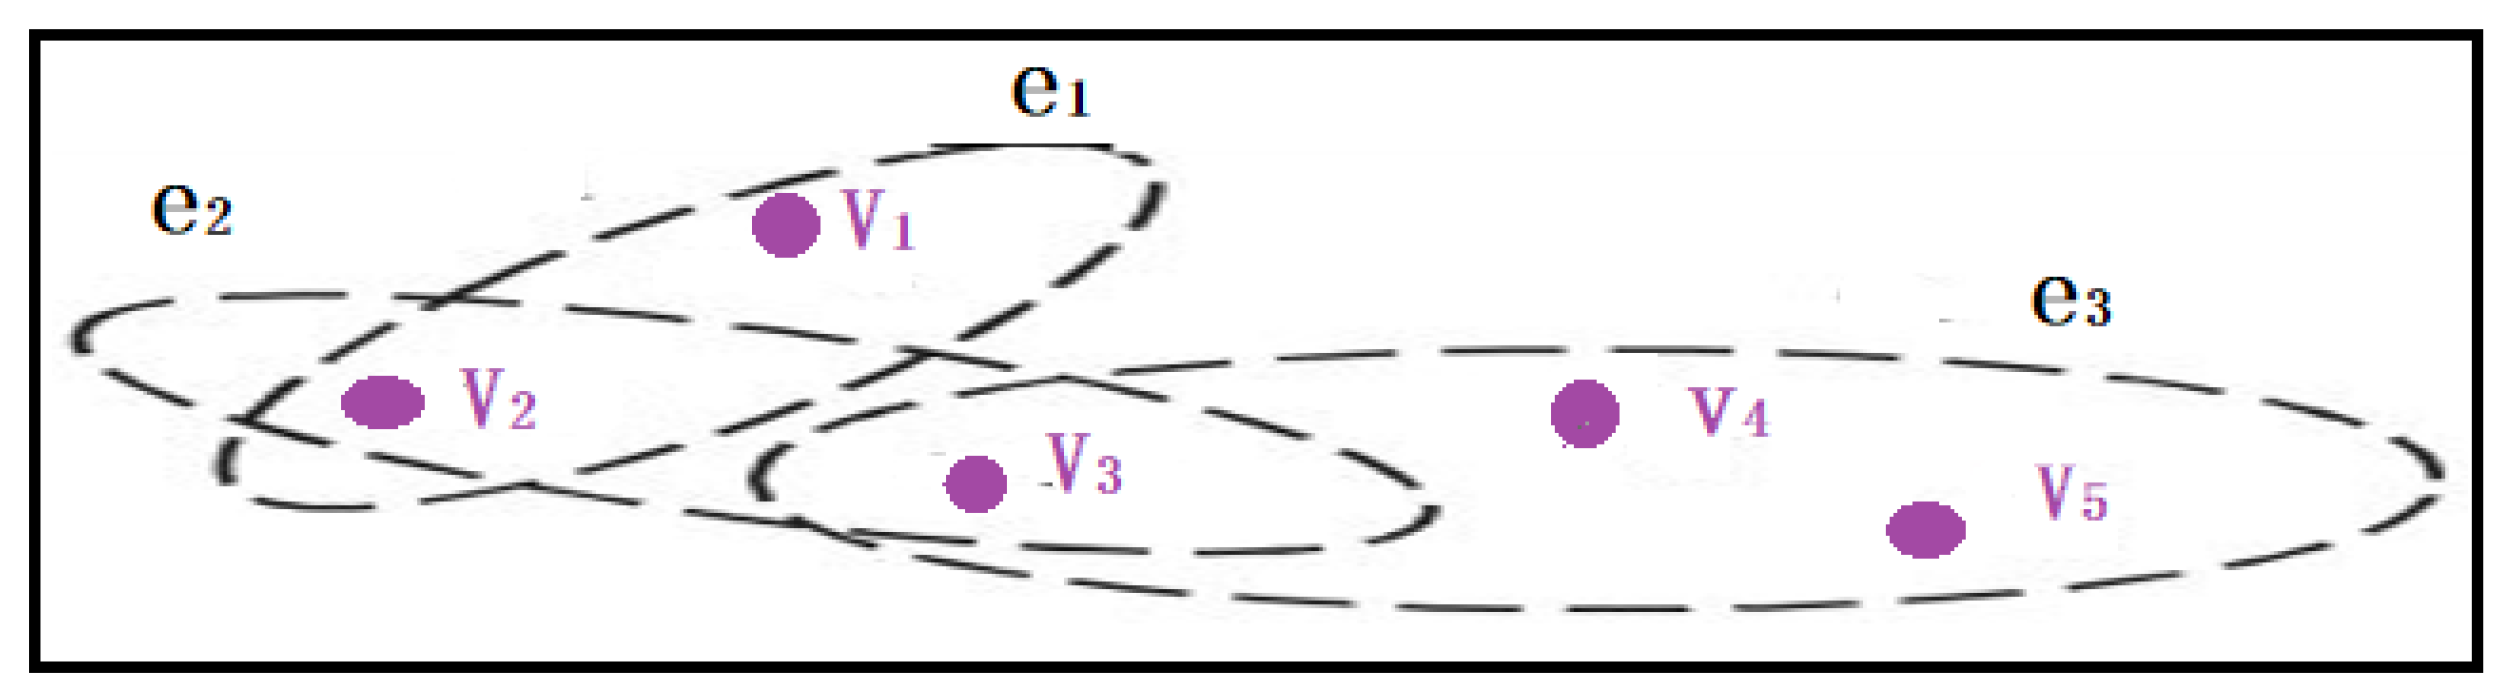
Example 3.
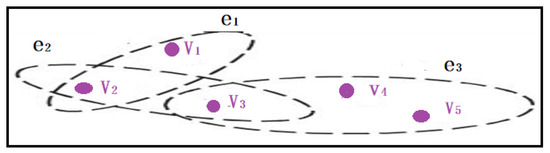
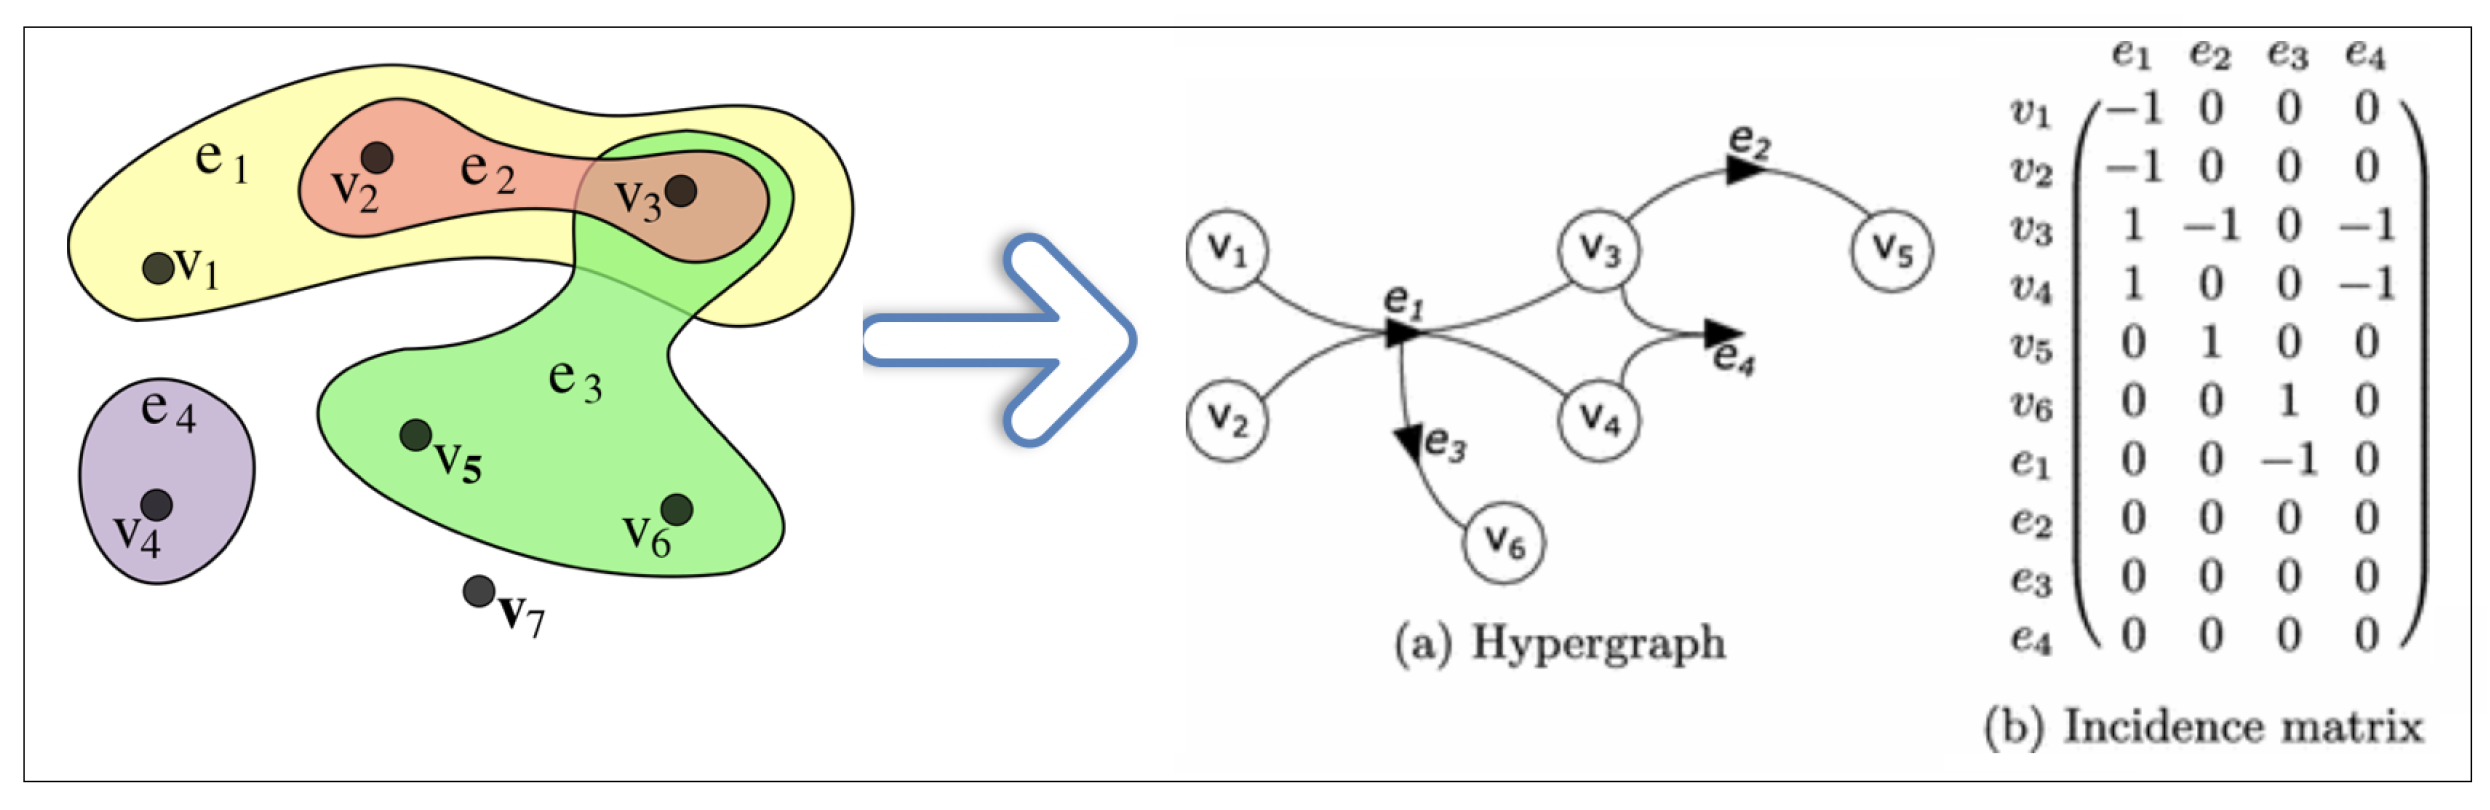
The example below Figure 6 shows the structure of hypergraph, where are edges and are vertices (nodes).
Figure 6.
Hypergraph structure.
Formally, let denote a hypergraph [24], where V denotes a finite set of nodes V, E denotes the set of hyperedges e, and w is a weight function defined as . Each hyperedge is a subset of V and is assigned a positive weight .
Definition 9.
We say a hypergraph is of order n if and the size of a hypergraph is equal to the number of occurrences of the vertices in its hyperedges.
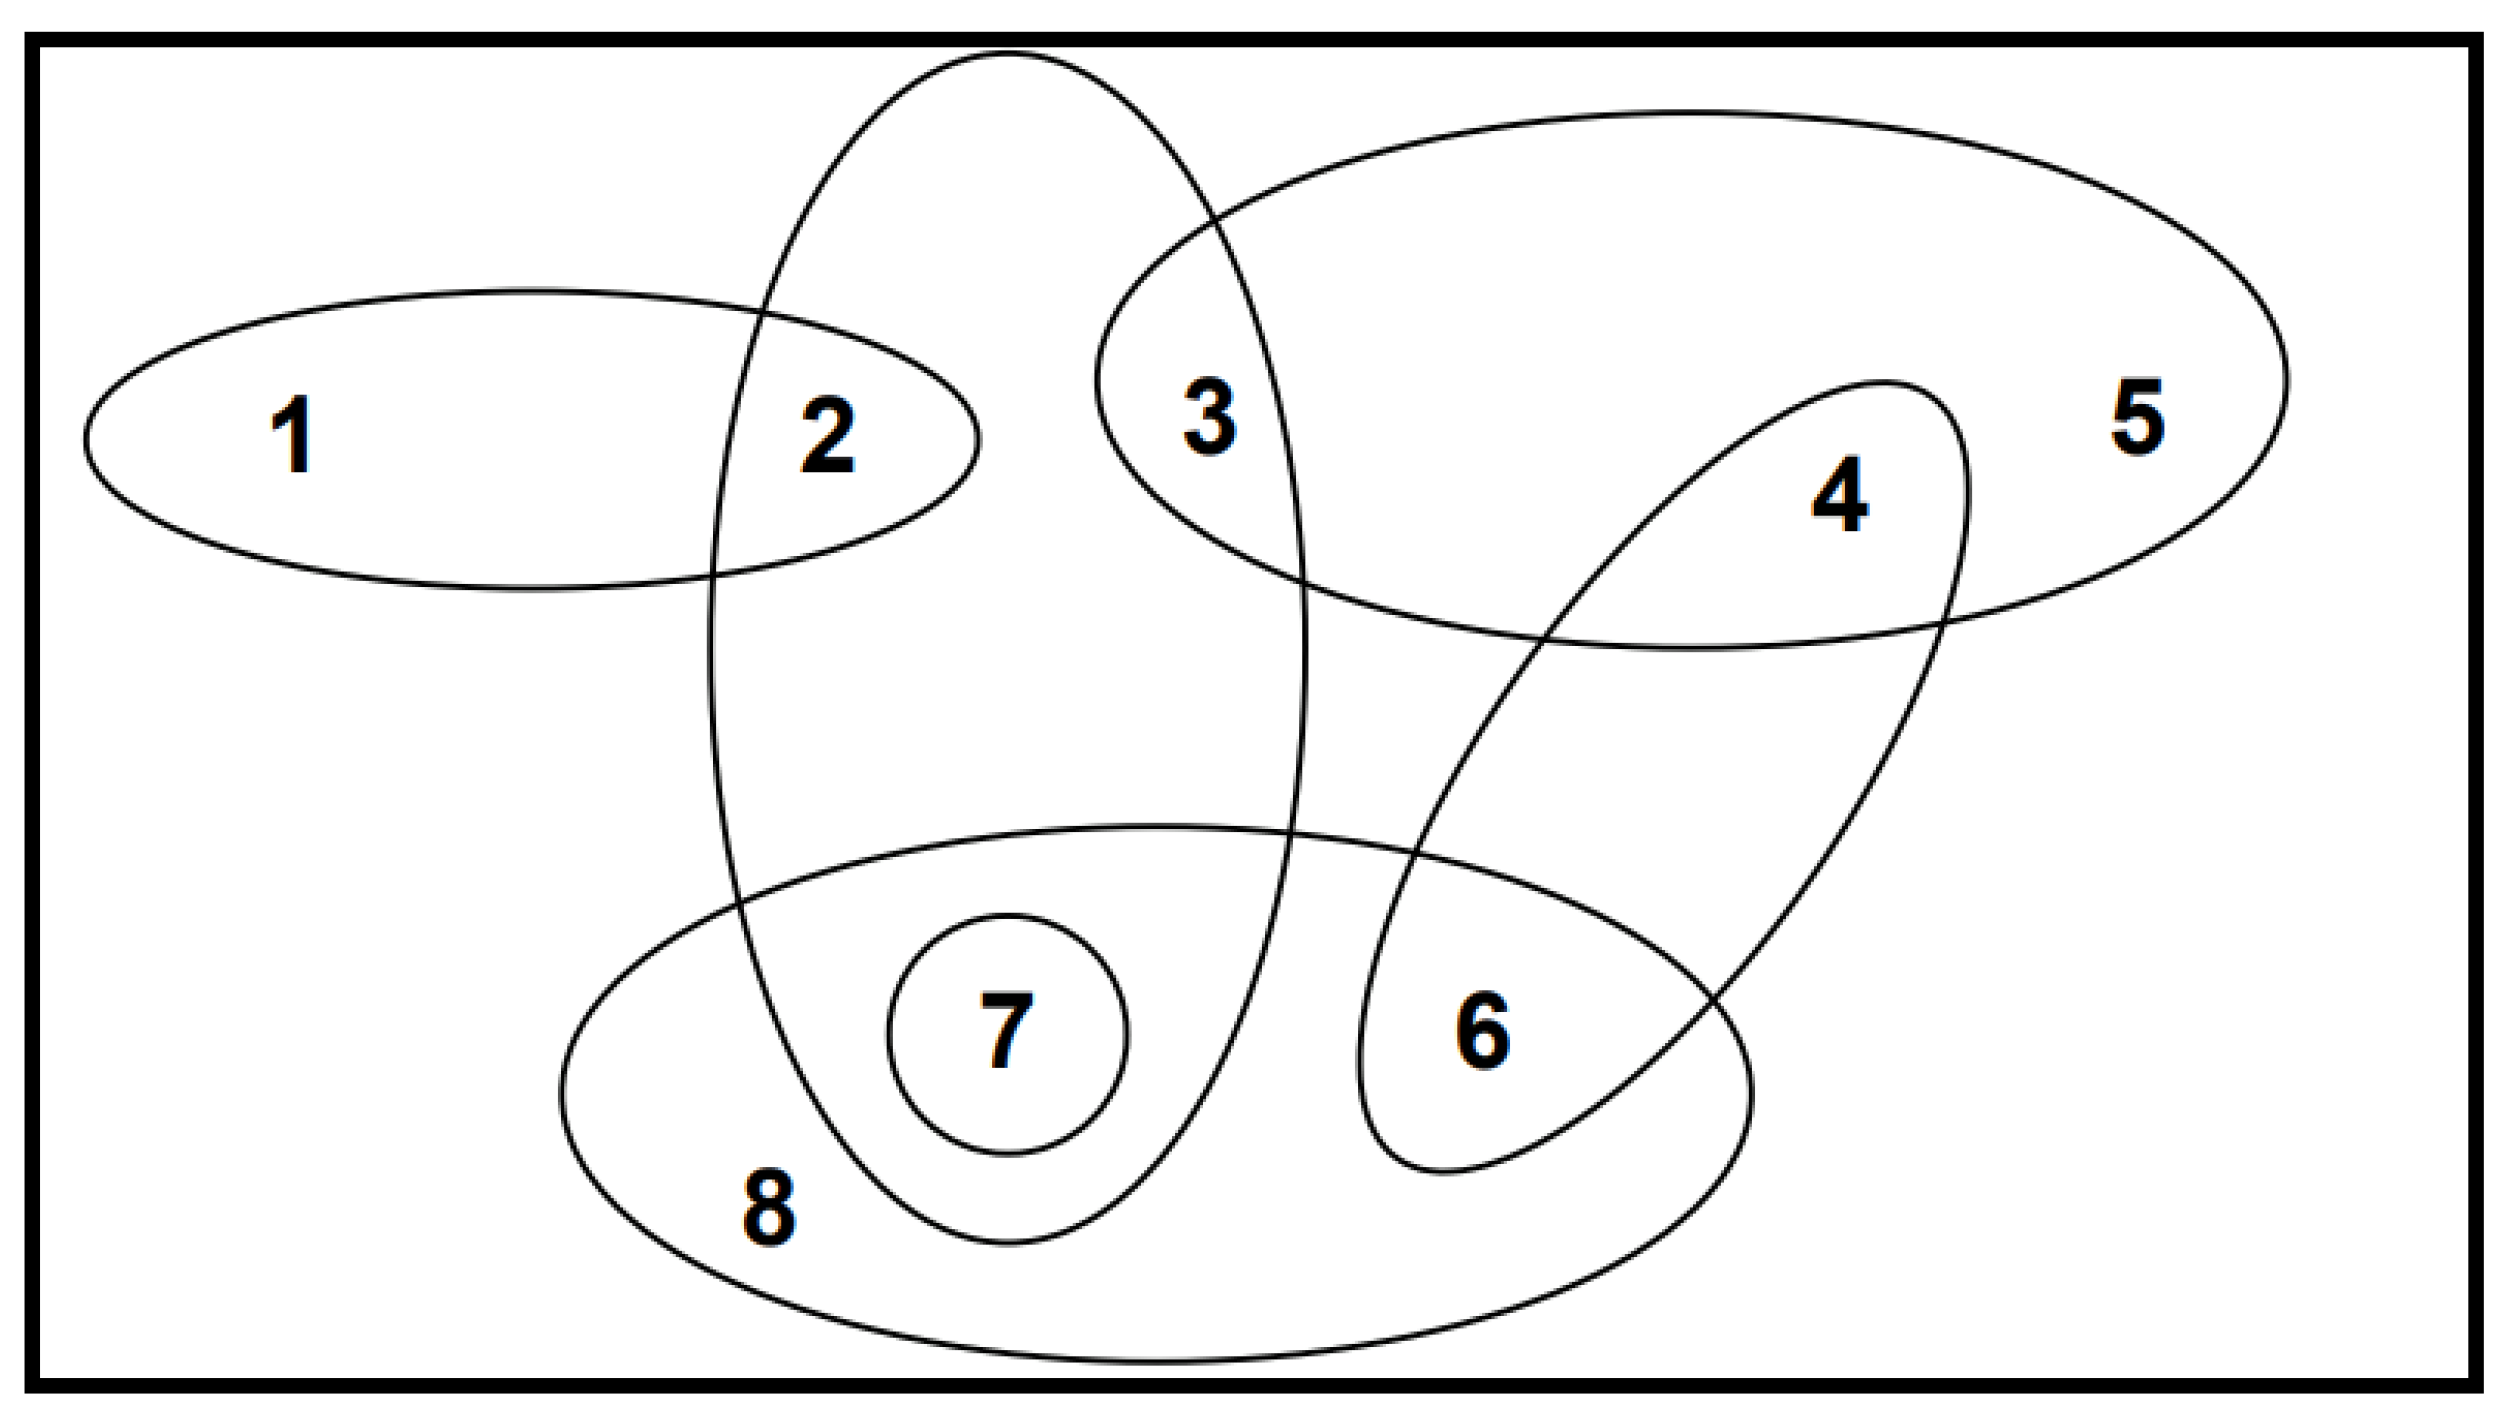
Example 4.

Figure 7 illustrates a hypergraph of order 8 and size 15: and
Figure 7.
Hypergraph example.
A Generalized hypergraph could be defined as follows.
Definition 10.
We define a generalized or extended hypergraph [25] in that some of the hyperedges are denoted in certain cases as vertices; therefore, a generalized hyperedge e may consist of both vertices and hyperedges, as well. The hyperedges that are contained within the hyperedge e should be different from hyperedge e.
In defining [26], we have the concept of directed hyperedge or hyperarcs as follows.
Definition 11.
A hyperarc is an ordered pair (From, To ) of (possibly empty) disjoint subsets of vertices; X is the tail of E, while Y is the head . The concept of the directed hypergraphs is an ordered pair of vertices and hyperarcs that are directed hyperedges, i.e., each hyperarc is an ordered pair that contains a tail and a head.
5.2. Application of Hypergraph Representation
In recent years, hypergraphs have been largely applied in various studies and in different domains. In this section, we introduce several domains to explain more the value of the hypergraph.
Hypergraph learning has achieved considerable performance in many implementations and areas. Several authors [27] expressed the hypergraph for clustering by using a clique average to transform it into a simple graph.
In addition, the hypergraph is also used in the domain of data structure [28], multiple learning [29] and video segmentation [30]; they are used to solve many difficulties in the field of images processing [31], classification and to connect the high order of relationships and samples, where samples are vertices and edges are similarity between two ones.
Another researcher [32] suggested a semi-supervised learning method called hyper-prior for group factor expression data by using biological knowledge as a constraint.
In [30], the researcher used the task of image clustering as an issue of hypergraph partition. Each image and its nearest neighbors form two kinds of hyperedges based on the descriptors of shape or appearance. In another work [26], a hypergraph-based image retrieval approach was proposed, where hypergraph-based 3D object recognition was proposed.
The big importance and the huge application areas of hypergraph representation solve different issues, and thus is important as follows:
- The hypergraph model has a strong theory for solving real-world problems;
- The hypergraph could be a networks model because of its mathematical tools;
- The hypergraph generalizes theorems on the graph;
- Hypergraphs are an appropriate structure for modeling, examining and specifying systems;
- Its formal tools for consistency checking are available by test algorithms;
- It is able to describe complex relationships during the design and analysis phase of the IS;
- Hypergraphs can be grasped in their capabilities to describe heterogeneous finite structures.
6. Experiment: Hypergraph Representation
BP modeling is mainly used to map a workflow so that we can understand, analyze, and make positive changes to that workflow or process. The usage of diagram visualizations helps us to understand this process and make better decisions.
Our experiments can be represented as three dedicated and independent approaches. The first two approaches are Amazon Web Services (AWS) services, wrapped up with Python programming language. The last is assumed as pure Python implementation with HyperNetX (HyperNetX library: https://github.com/pnnl/HyperNetX, Accessed Date: 8 February 2021)), NetworkX (NetworkX library official documentation: https://networkx.github.io/X, Accessed Date: 8 February 2021) and Pandas (Pandas library official documentation: https://pandas.pydata.org/, Accessed Date: 8 February 2021), external libraries.
Approaching AWS services, we realized that it is too costly a decision, which invoked the reason to swap to the last approach with manual generating data and the rest of activities. Beyond this, it was conceived that AWS allows us to handle a very wide range of tasks. However, we need to focus on a more tidy problem definition. We concluded that most of the known models are outdated and are not as flexible as we needed. However, it must be highlighted that some of them are used far more effectively in other industries and for different purposes. Because of that, we considered focusing on simulating within the bipartite graph and hypergraph representations.
6.1. AWS Services
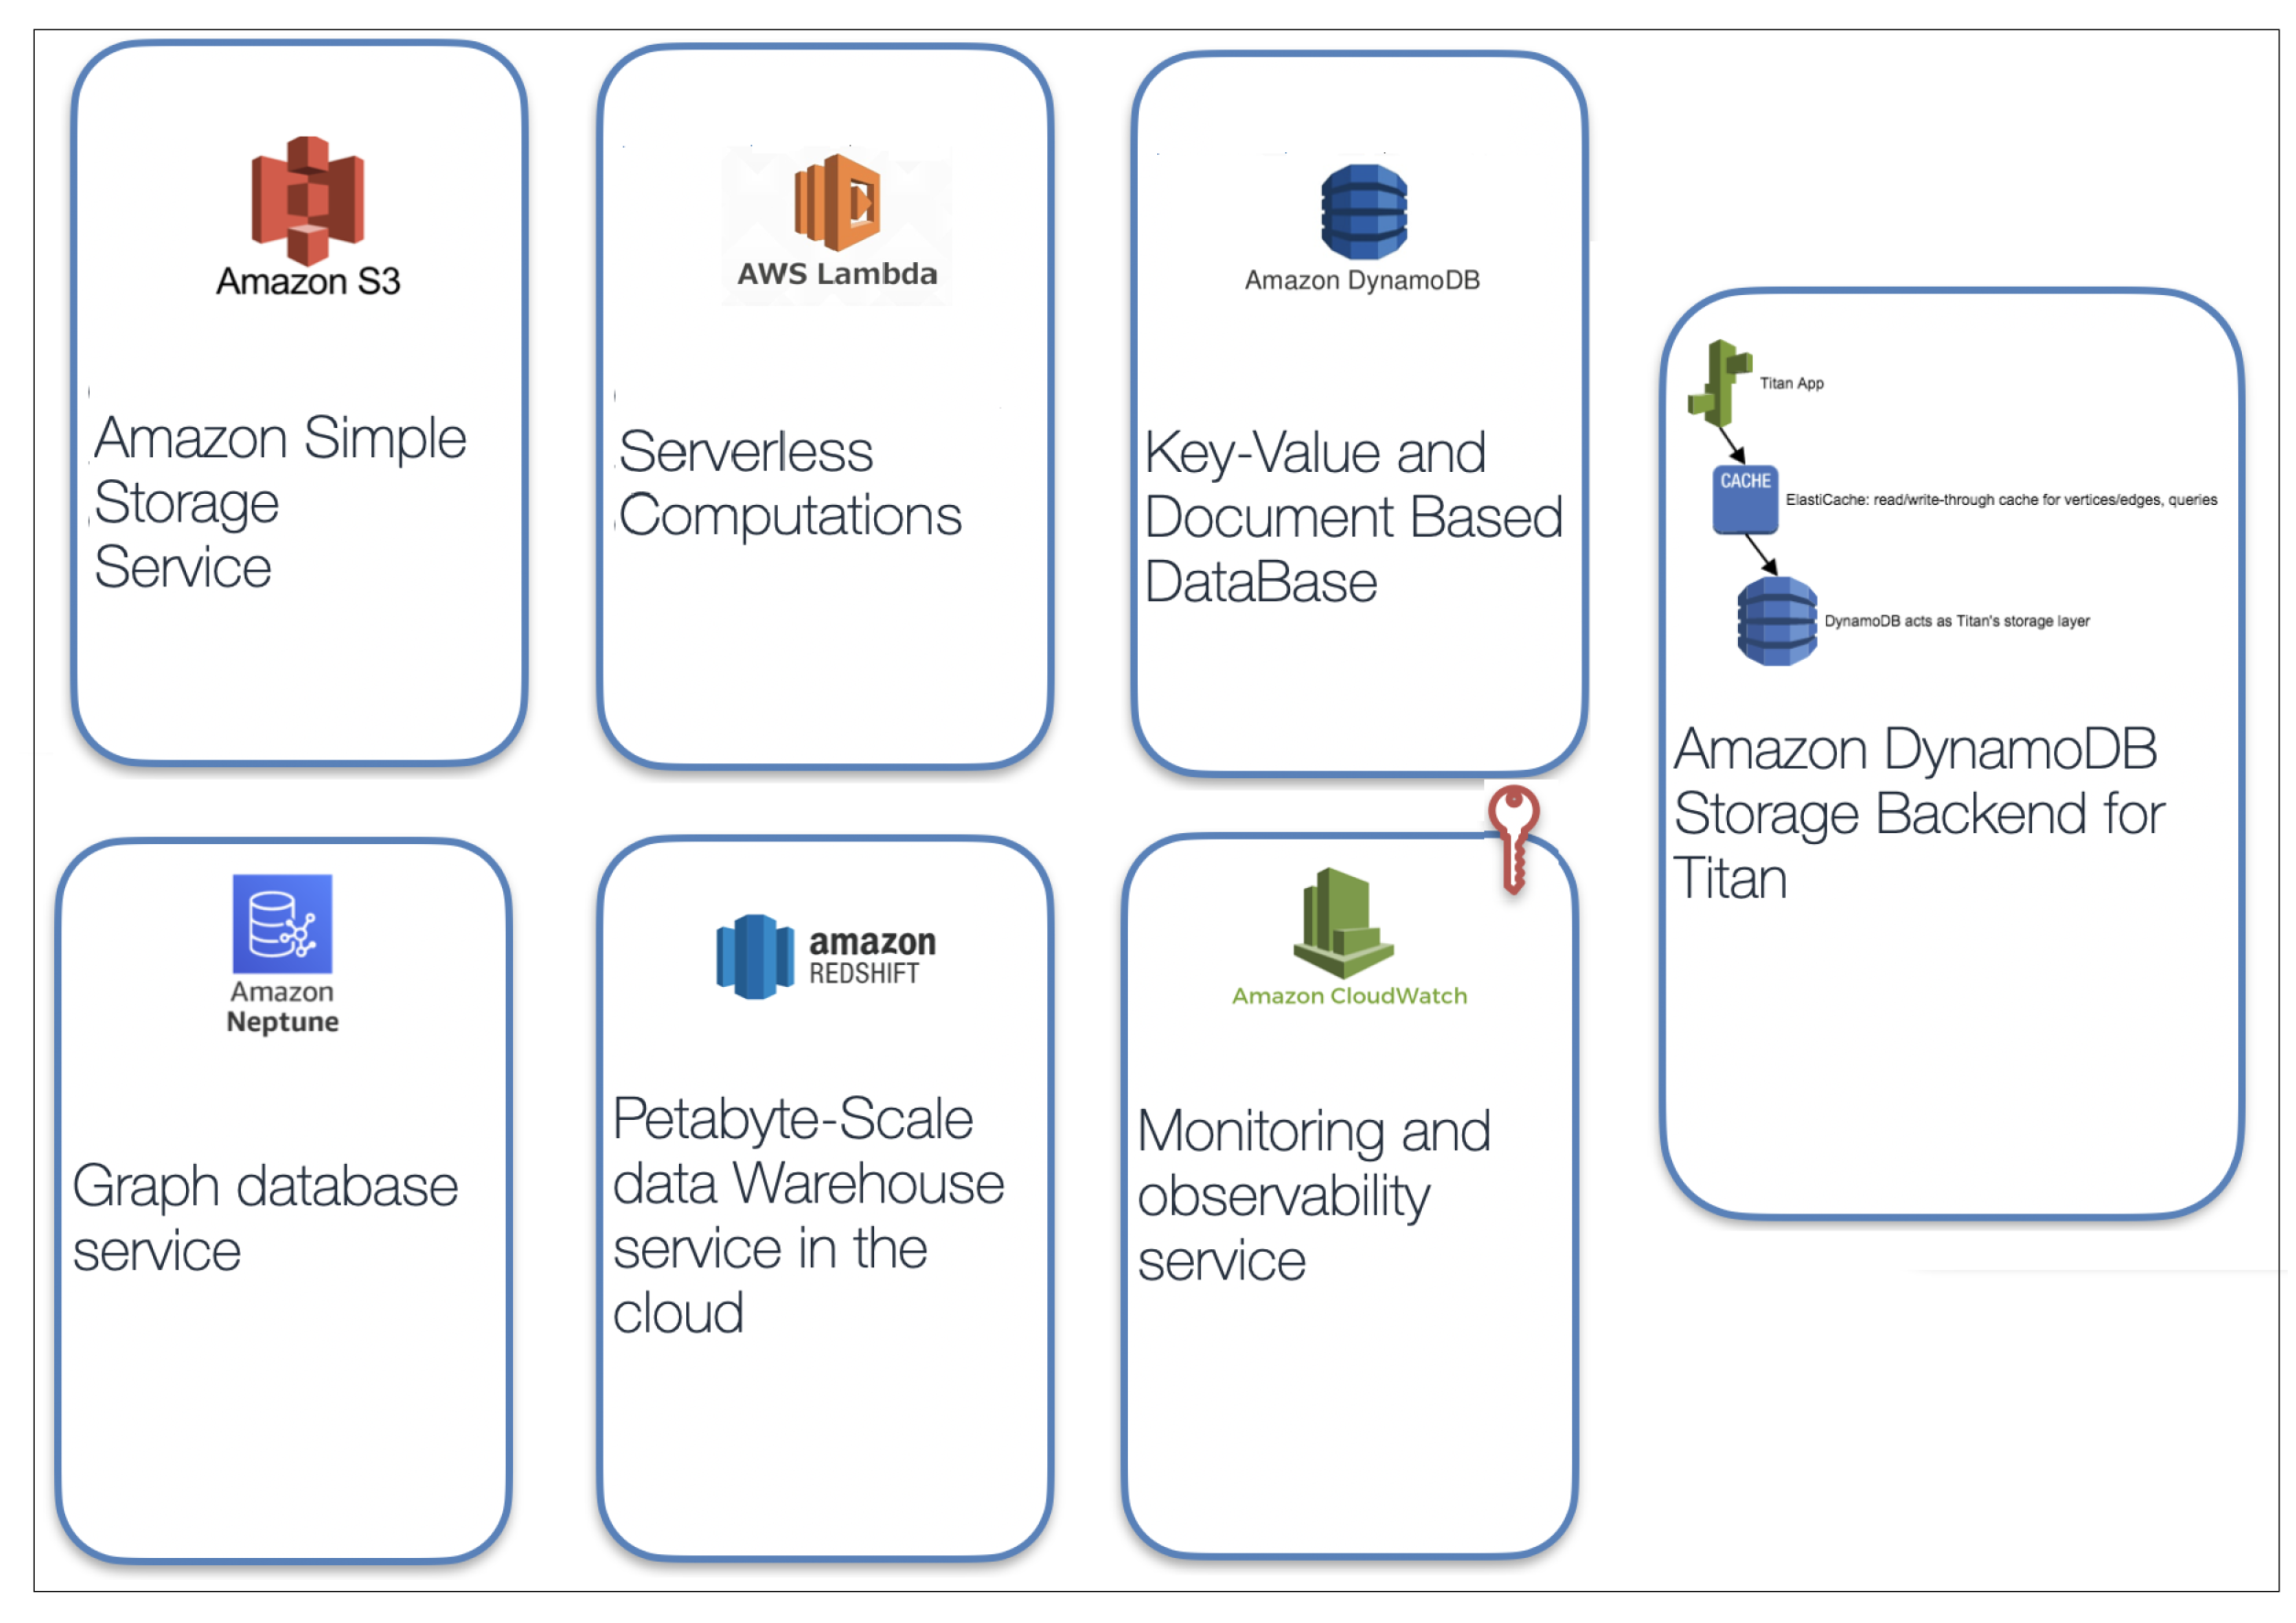
We decided to use multiple AWS services as the main components because they allow us to increase the time-box for achieving results. AWS is a cloud computing service and the world’s most comprehensive and broadly adopted cloud platform, offering over 175 fully-featured services from data centers globally. While experimenting, we used as in the Figure 8 the following services:
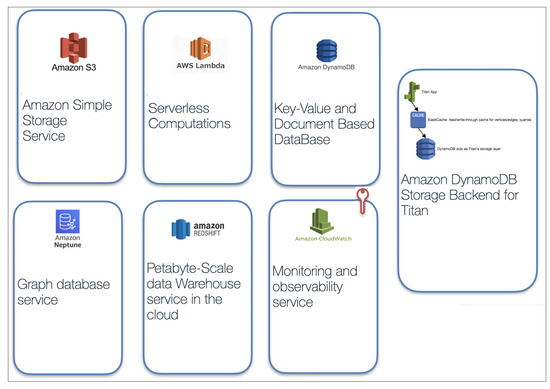
Figure 8.
AWS services.
- S3 (AWS S3: official Amazon Cloud Services documentation, https://aws.amazon.com/s3/, Accessed Date: 10 February 2021):simple storage service that offers industry-leading scalability, data availability, security, and performance.
- Lambda-service (AWS Lambda, official Amazon Cloud Services documentation, https://aws.amazon.com/lambda/, Accessed Date: 20 February 2021):lets us run code without provisioning or managing servers.
- DynamoDB-key-value and document database (AWS DynamoDB, official Amazon Cloud Services documentation, https://aws.amazon.com/dynamodb/, Accessed Date: 22 February 2021):delivers single-digit millisecond performance at any scale.
- Neptune—fast and reliable, fully-managed graph database service (AWS Neptune, official Amazon Cloud Services documentation, https://aws.amazon.com/neptune/, Accessed Date: 25 February 2021): makes it easy to build and run applications that work with highly connected datasets.
- Redshift—fully managed (AWS Redshift, official Amazon Cloud Services documentation, https://aws.amazon.com/redshift, Accessed Date: 25 February 2021) petabyte-scale data warehouse service in the cloud.
- DynamoDB + Cache + Titan—Amazon DynamoDB Storage Backend for Titan, enables storing Titan graphs of any size in fully-managed DynamoDB tables. Graph databases are optimized for fast traversal of complex relationships required for social networks, recommendation engines, fraud detection, inventory management, and more. Titan is a popular graph database designed to efficiently store and traverse both small and large graphs up to hundreds of billions of vertices and edges.
- CloudWatch—monitoring and observability service (AWS CloudWatch, official Amazon Cloud Services documentation, https://aws.amazon.com/cloudwatch/, Accessed Date: 26 February 2021) built for DevOps engineers.
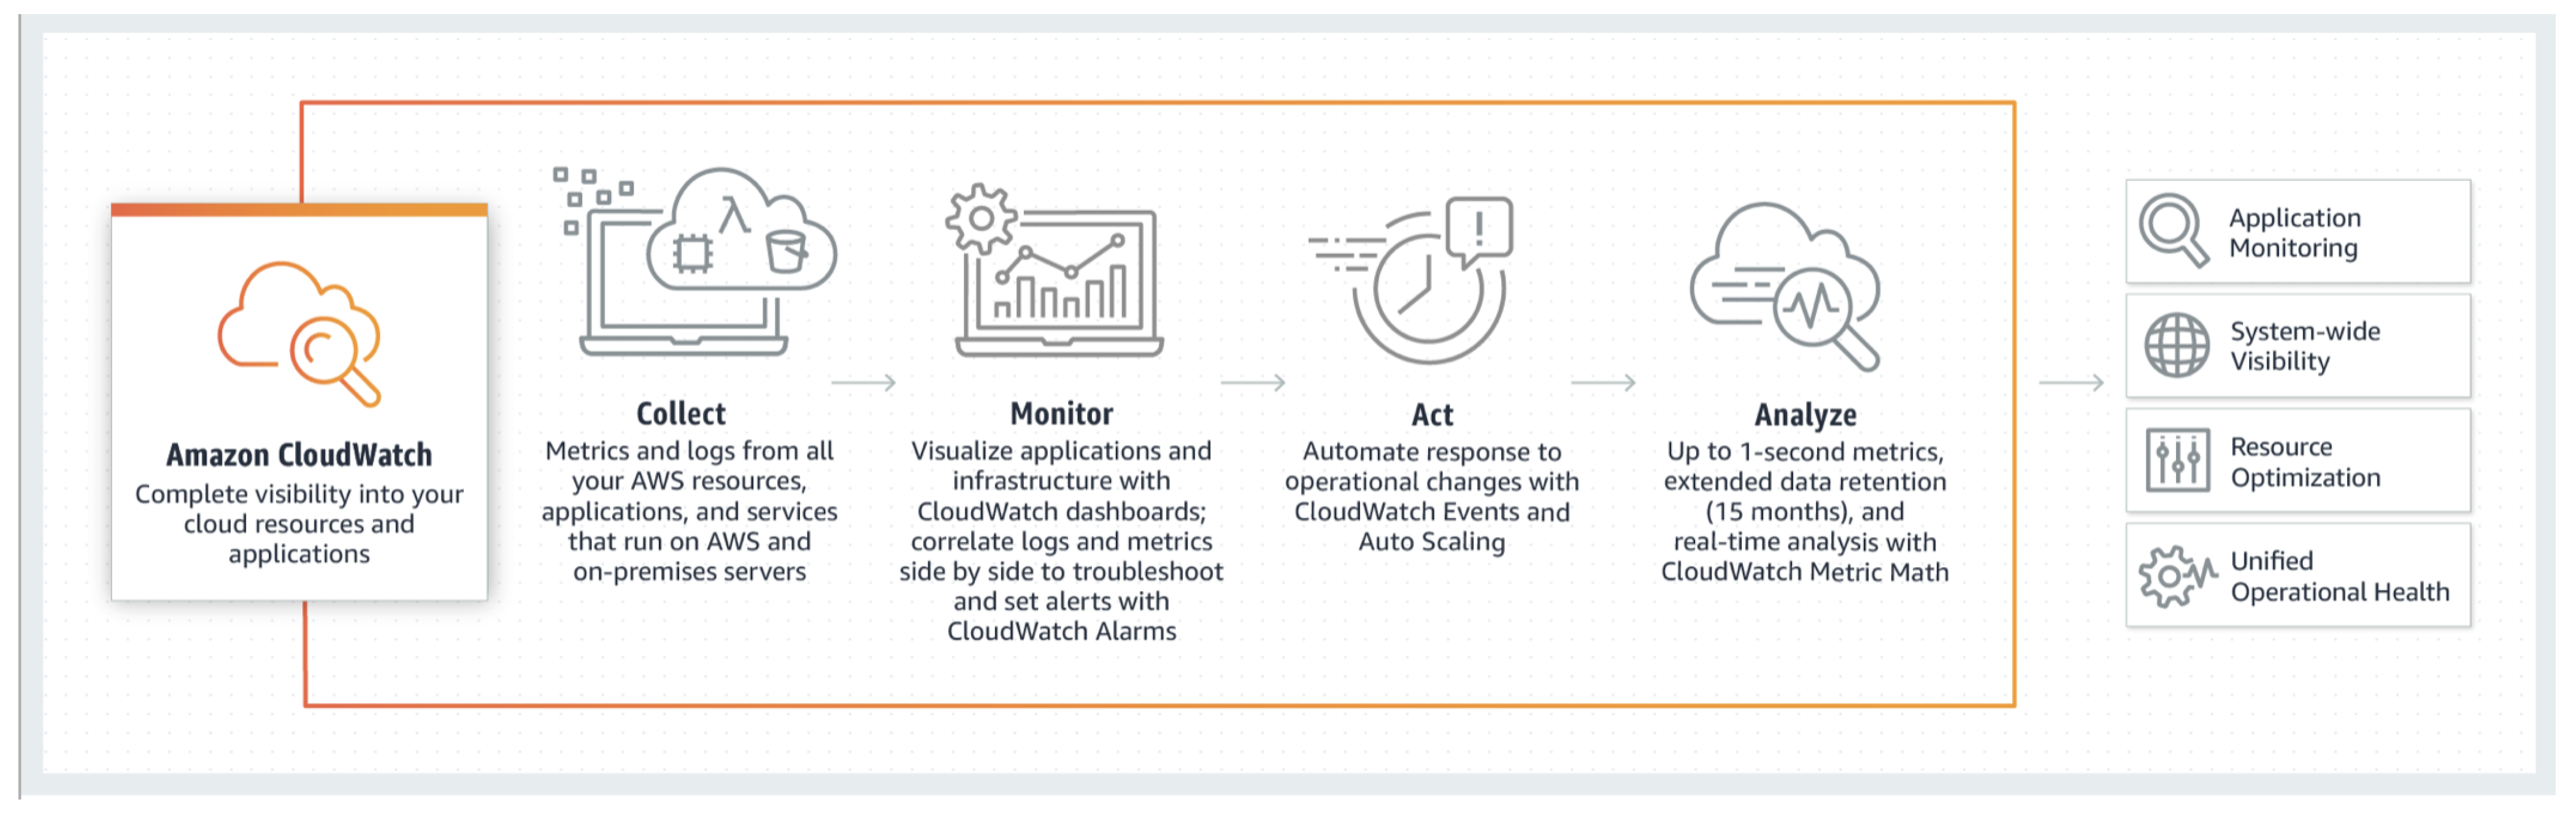
6.2. AWS CloudWatch
CloudWatch as in the Figure 9 bellow, stood as one of the main components within our experiments, because it collects monitoring and operational data in the form of logs, metrics and events, and visualizes it, using automated dashboards so that we can obtain a unified view of the AWS resources, applications, and services that run in AWS and on-premises. It can correlate the metrics and logs to better understand the health and performance of the resources.

Figure 9.
AWS CloudWatch.
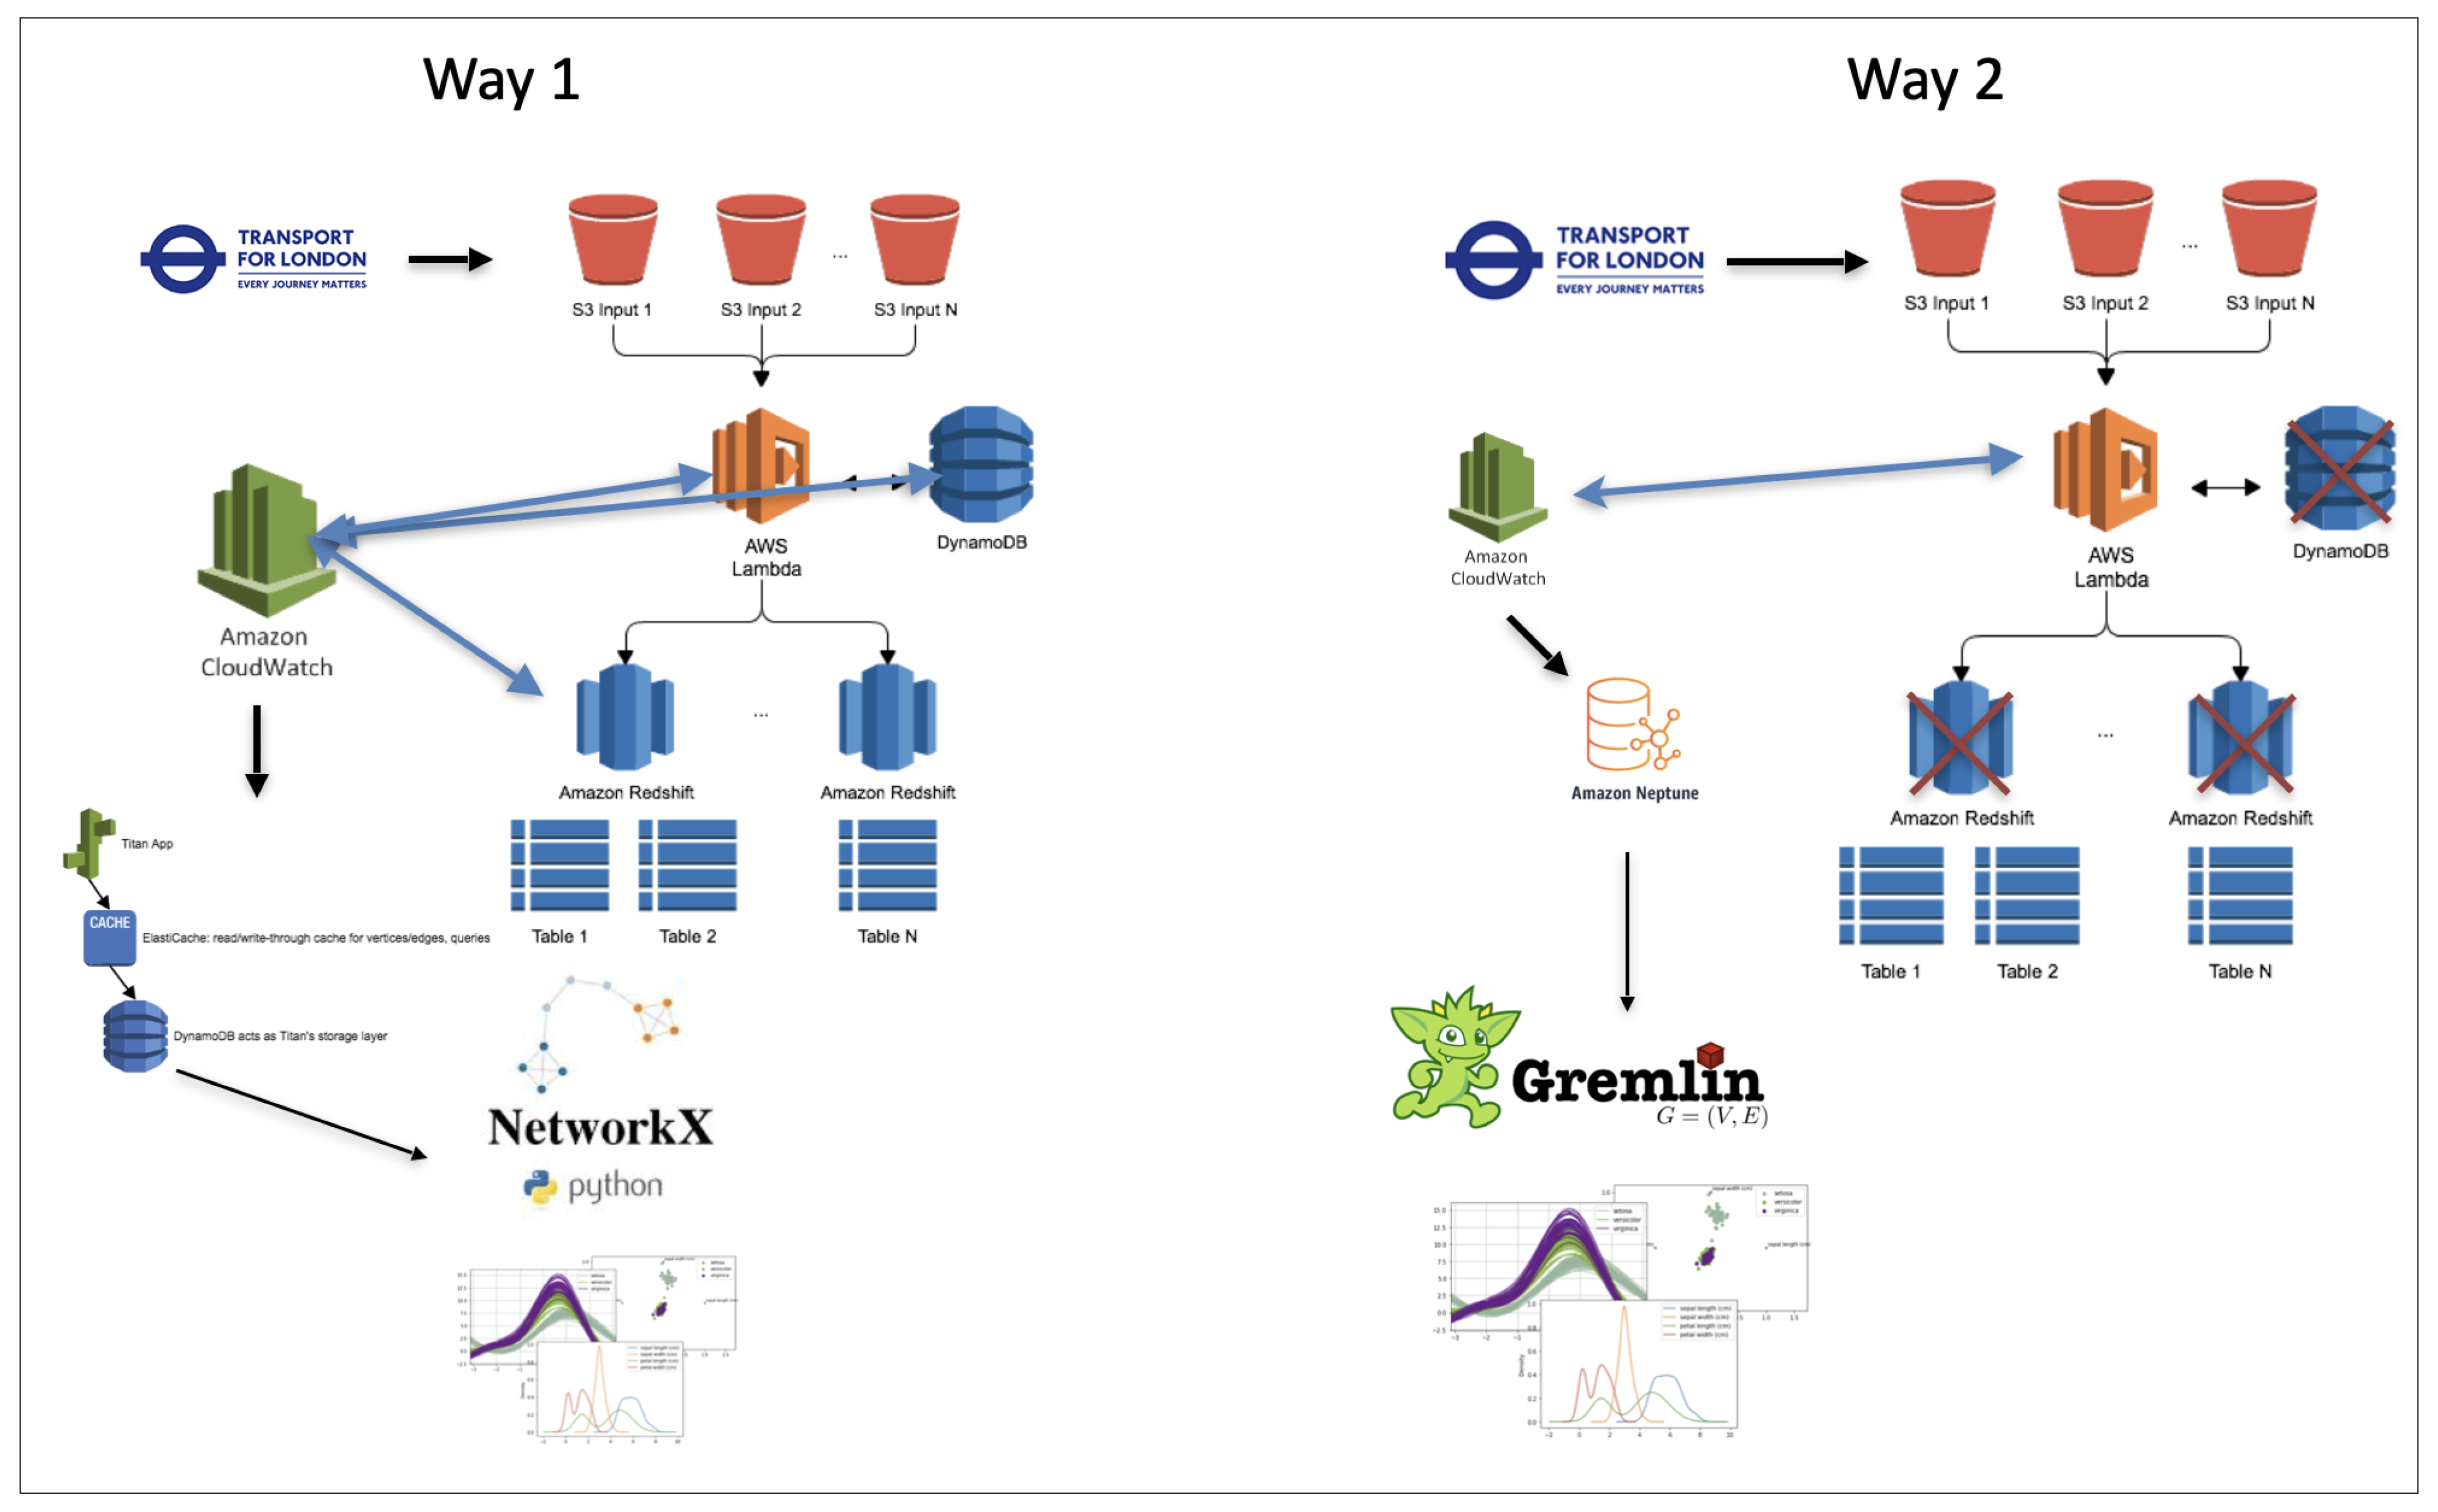
7. The Approaches Used
The diagram below Figure 10 presents the two first approaches that the schema used. First of all, we partially set up these tools as a pipeline. The key was to obtain first the “environment” and observations immediately. Therefore, we decided to focus not on creating a complicated chain of tools, but we tried to obtain that setup as soon as possible. We created a script that parses data from a 3rd party API (as a source of data, we decided to take the London transportation API (Transport for London API official documentation: https://tfl.gov.uk/, Accessed Date: 8 April 2021), as we mentioned before). We obtained data about car accidents for different years. Here, we solely focused on the process rather than the actual data.
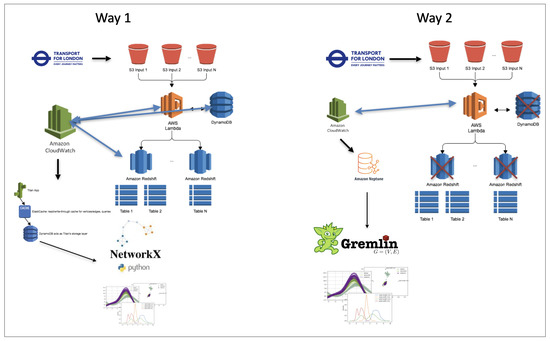
Figure 10.
Approaches schema.
After passing the data to S3 under a dedicated bucket and with a specified key, AWS Lambdas were automatically triggered to process and forward data to DynamoDB and Redshift in parallel. We decided to use two different databases because, firstly, we considered storing processed data and logs separately, and we wanted to create processes similar to the real work pipelines.
We aligned the processing steps because the format of input data from TFL was in JSON format. We converted it into “.csv” (CSV: Comma Separated Value) for further convenience to interact with DBs. In the meanwhile, all the used AWS components were tracked by CloudWatch. We monitored it also. Once the data were passed to DynamoDB, we prepared pure Python functionality to grep data from CloudWatch to analyze the features of processes as well as to explore and define the CloudWatch custom metrics.
The main complexity within DynamoDB is found in the Titan App and Elastic Cache. Titan and the others are not favored, and they are not maintained properly; moreover, it lacks documentation. Based on that, we decided to simplify our chain of tools, but on another, we kept the complexity of the processes. The second approach came up here.
The first few steps remained unchanged. Needless to say, we found that few other AWS services fit our purpose best by the provided documentation. Here, the main difference is in AWS Neptune and Gremlin, which allows obtaining from out of the box, graph-based features, and language (Gremlin) to query that data from Neptun.
We established in the second approach a specified scheme in the documentation, but once we launched that chain of tools, we received an alarm immediately (which we have set up beforehand for such kinds of expected cases). We would like to point out that AWS Neptun is the best service, out of the box, to store and manage graph-based data.
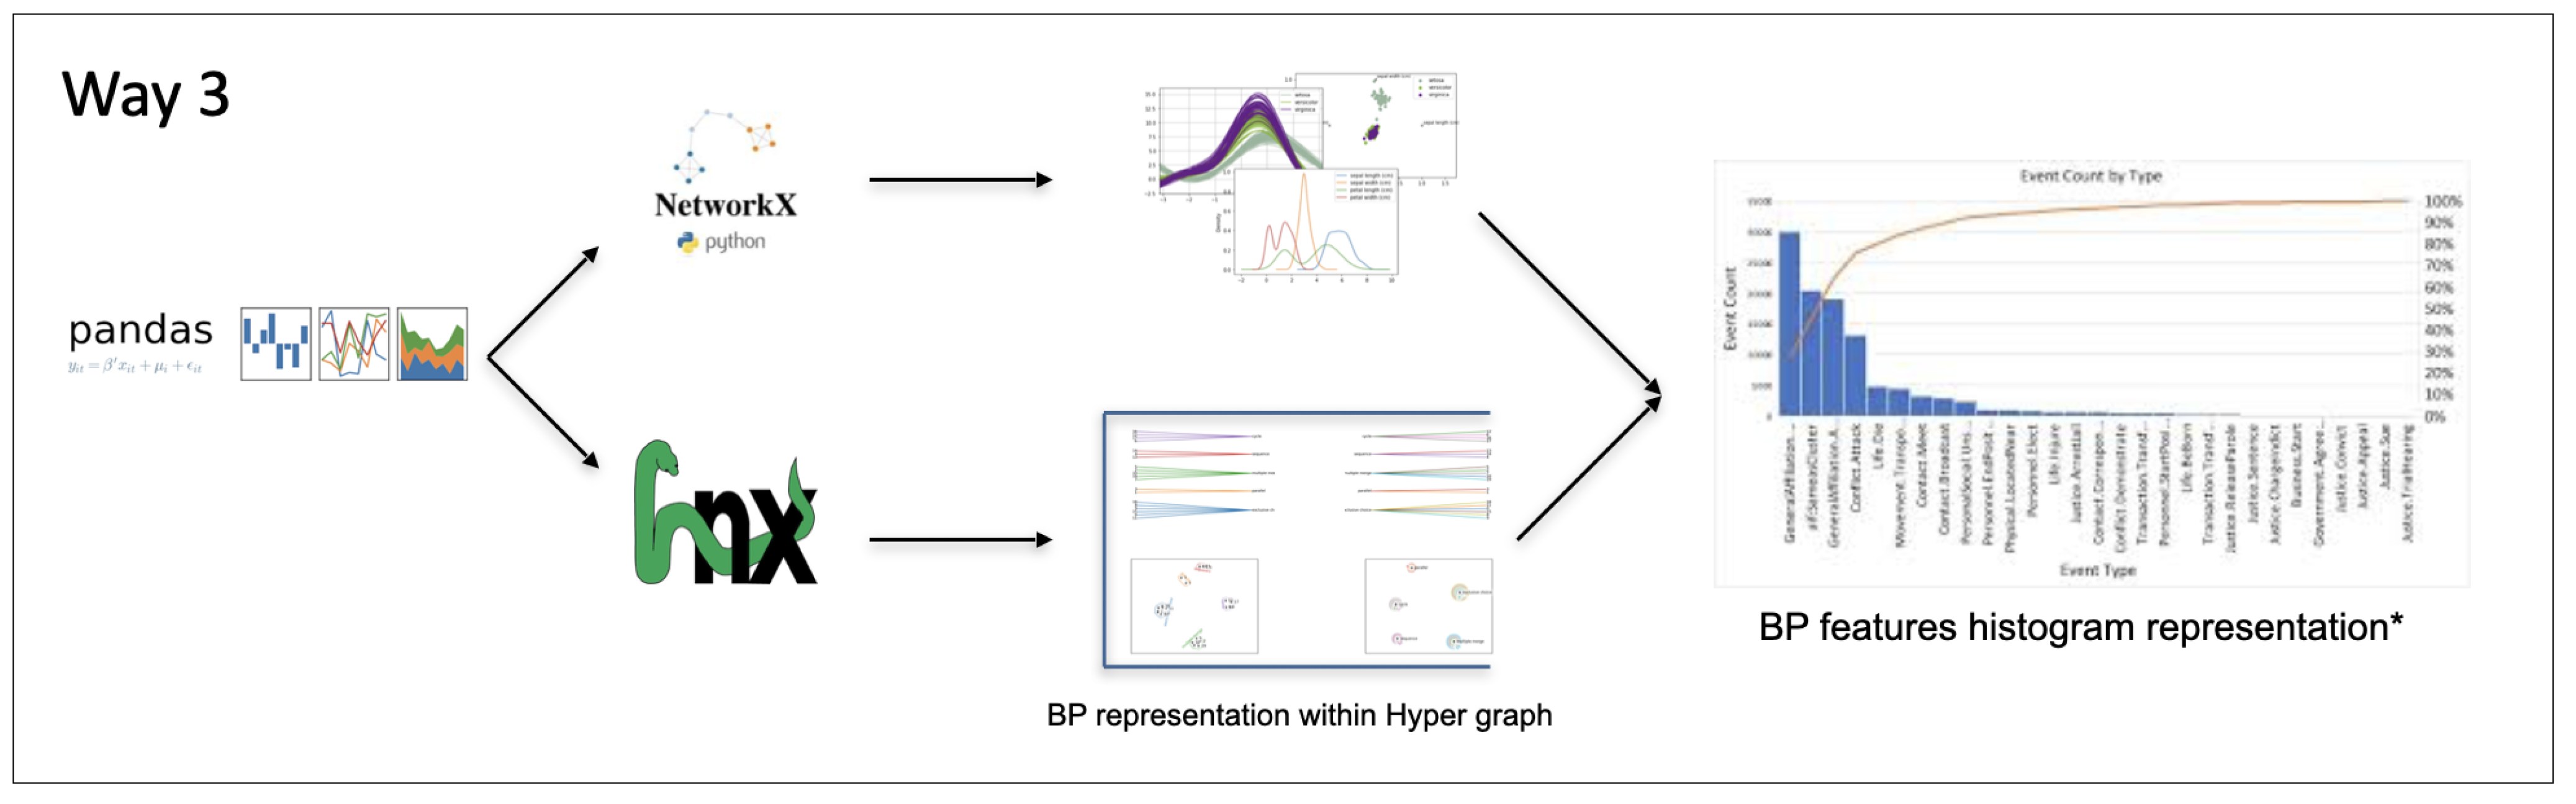
After all, we were looking at the most time-efficient methods of solving our task. Based on that, we manually generated data, and then we applied open-source tools to analyze these data and pass them into a bipartite graph and further into a hypergraph. Then, we tried to compute the performance of the finally collected observations.
The third approach schema is presented in the following diagram Figure 11:
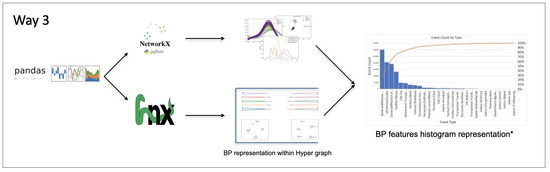
Figure 11.
Third approach schema.
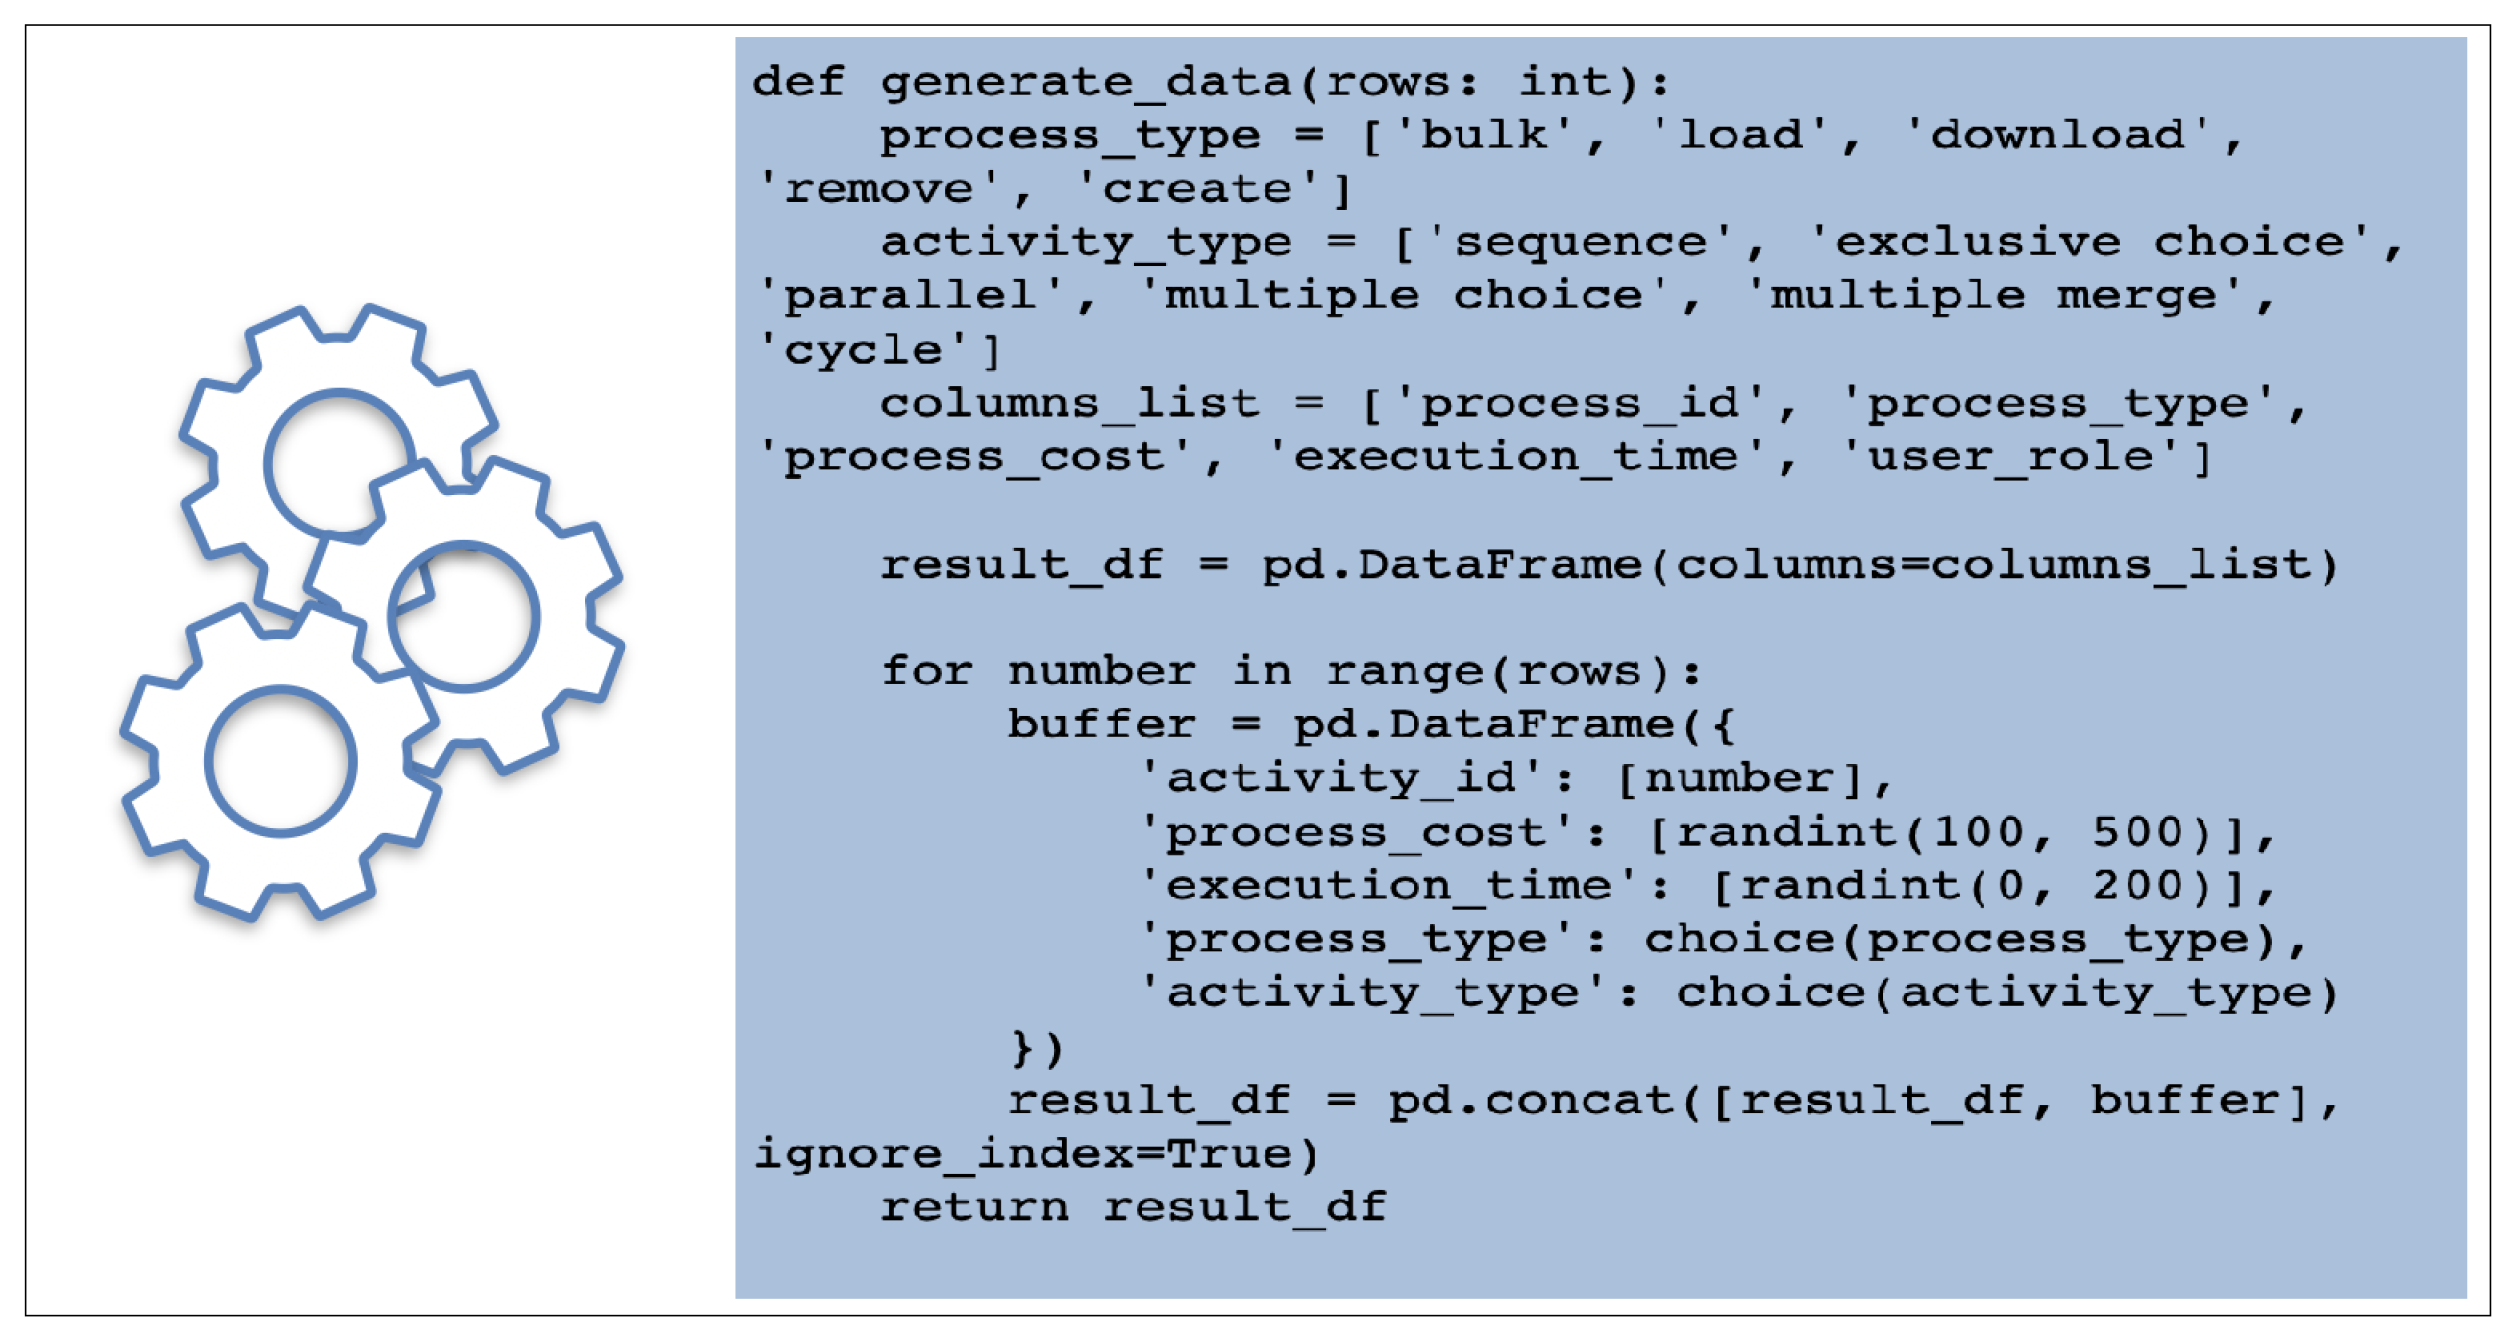
After exploring the metrics, we assumed the following types for process type data: bulk; load; download; remove; and create. For activity types, we considered the following: multiple merge; multiple choice; parallel; exclusive choice; sequence; and cycle. Finally, we defined the following characteristics for process features: process id; process type; process cost; execution time; and user role. These are the steps followed:
- Generate simulated BP data;
- Pass generated data into a bipartite graph;
- Pass BP data into hypergraph;
- Apply Smith normal form.
7.1. Simulation of Generated BP Data
We defined process types and activity types that stand for interactions inside of process types and process features, additionally. Figure 12 shows more details, as follows:
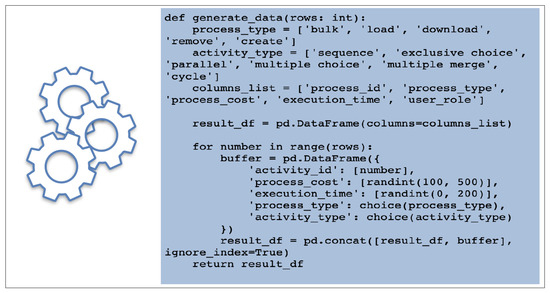
Figure 12.
Generate simulated BP data.
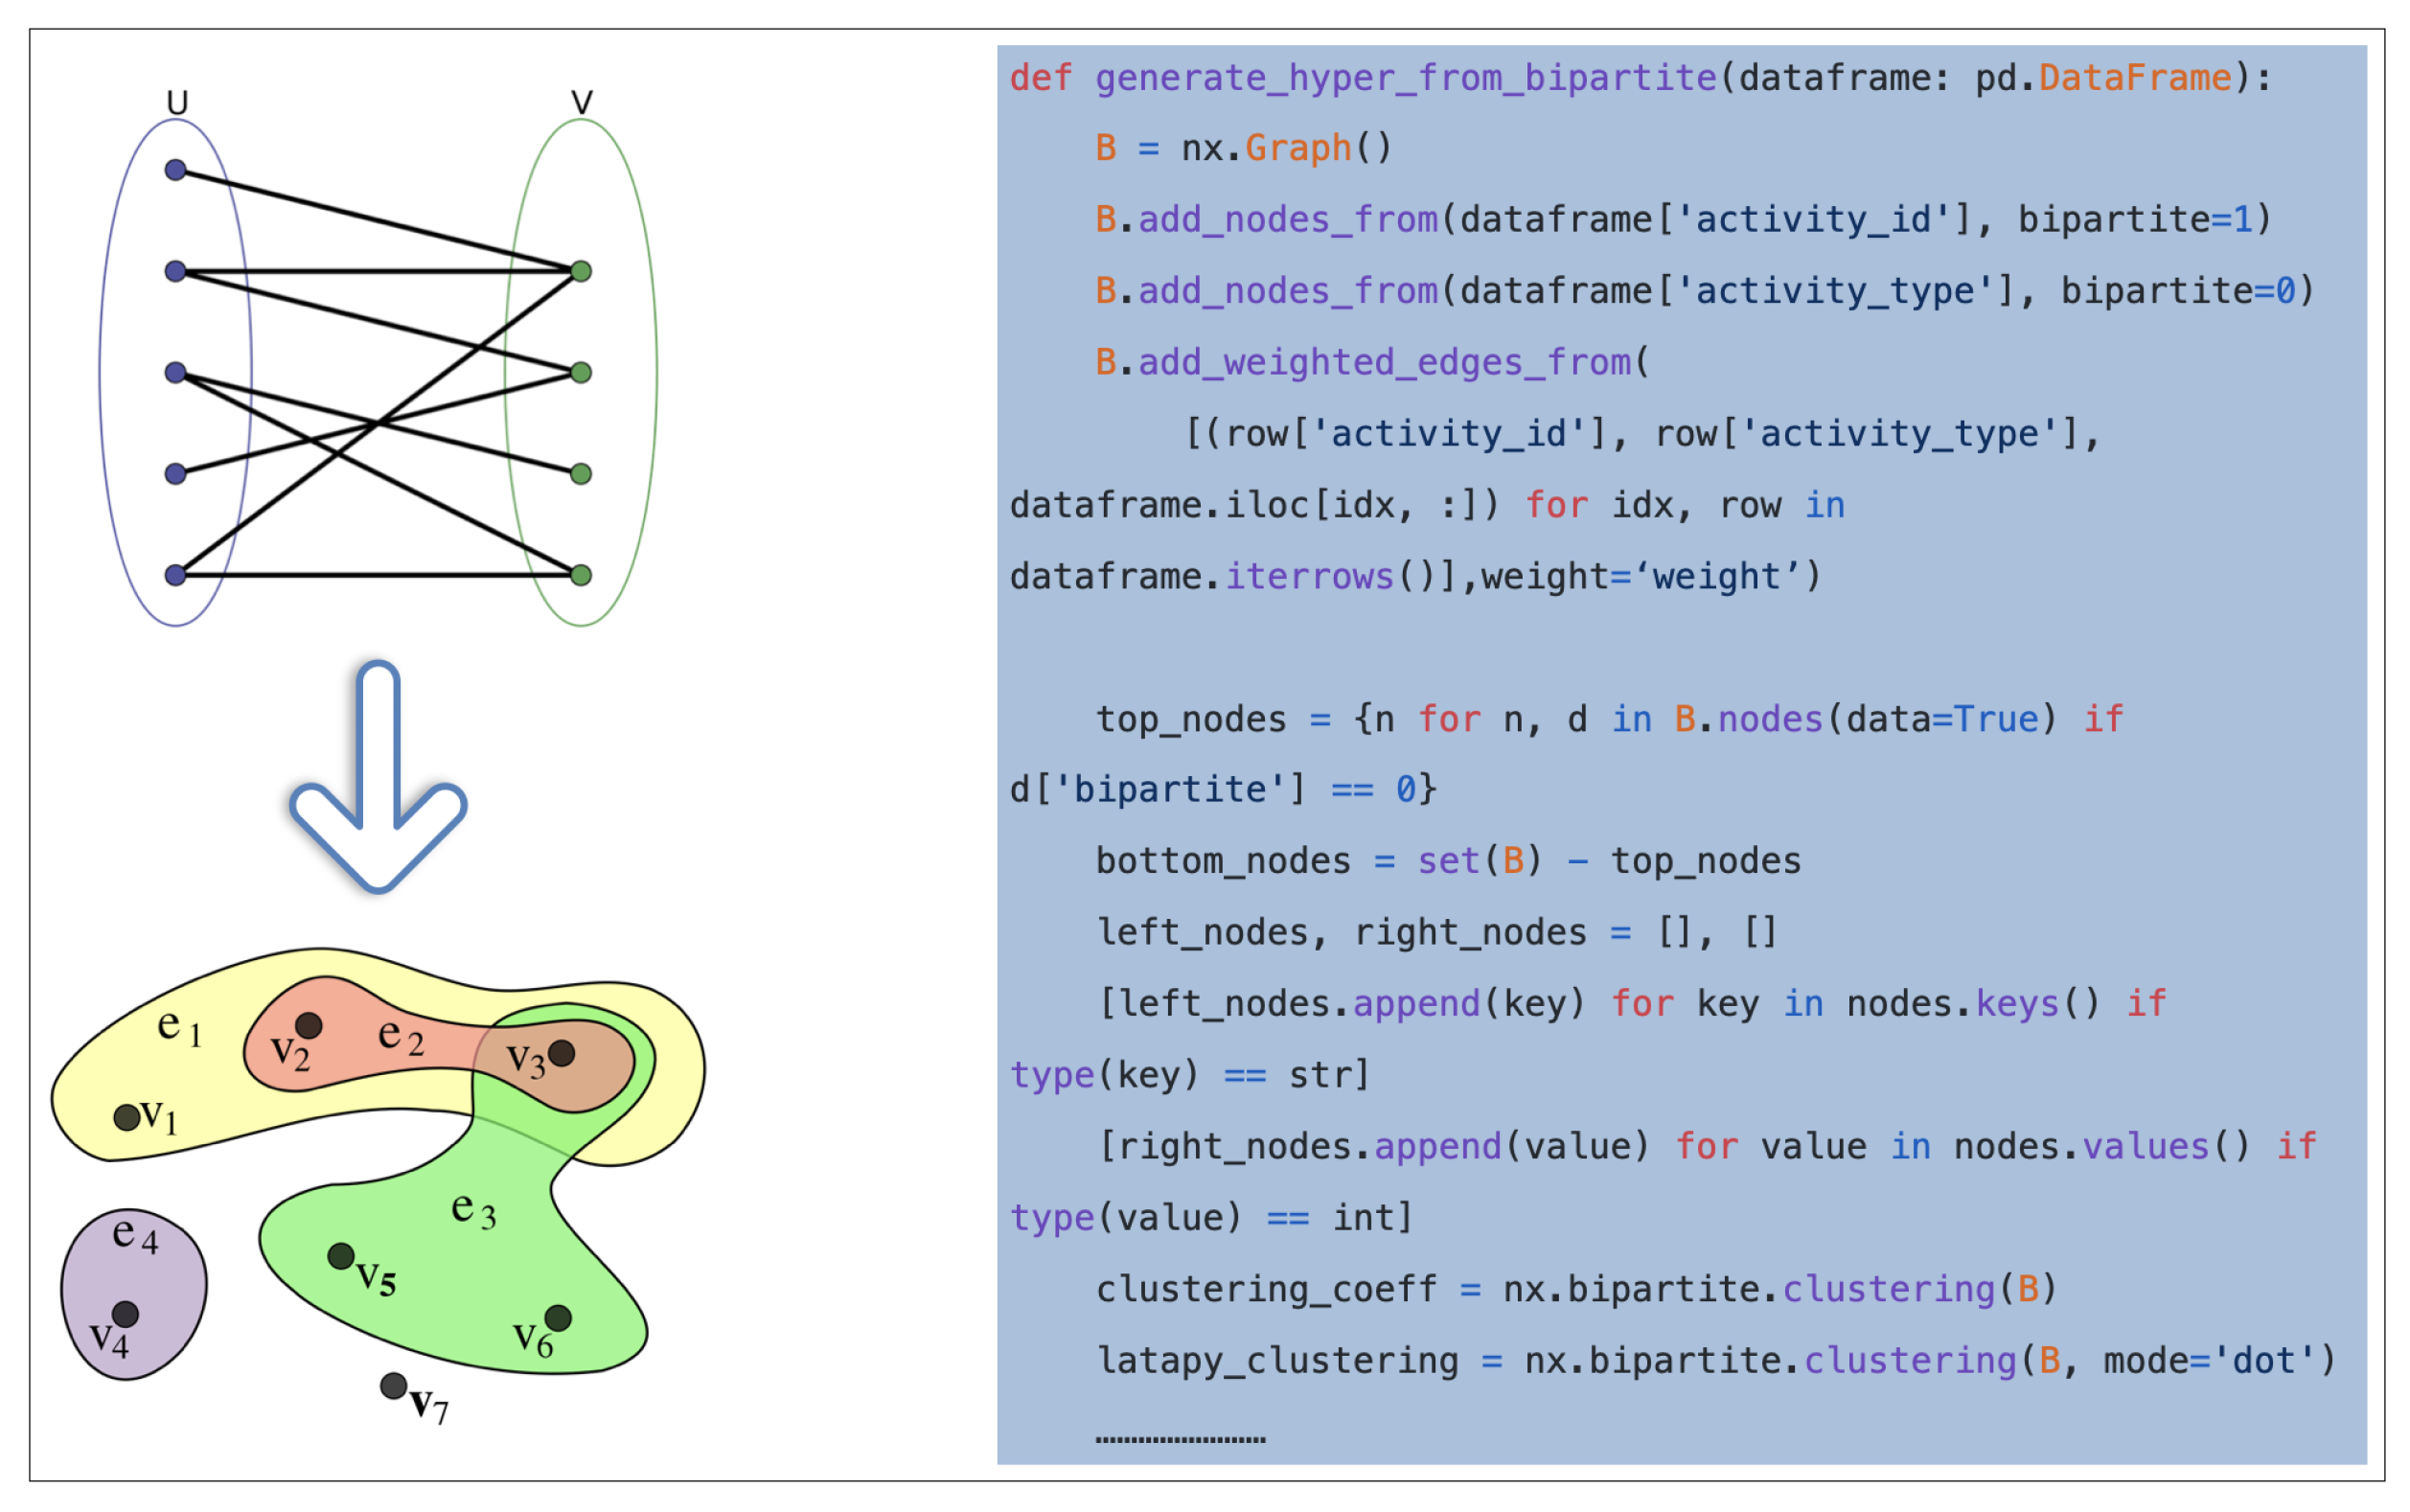
7.2. From Bipartite Graph to Hypergraph
After we generated the data, we forwarded them into a bipartite graph, shown in Figure 13.
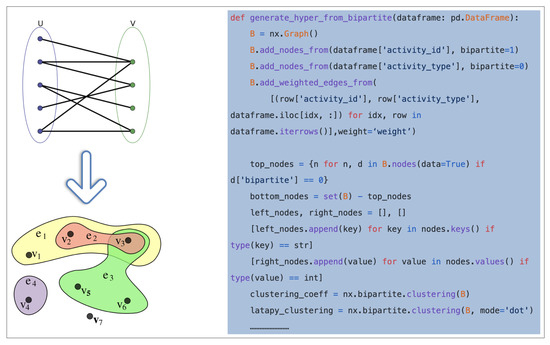
Figure 13.
From bipartite graph to hypergraph.
The reason for this is to have a more convenient basis to form a hypergraph itself from the obtained bipartite graph, which will be more convenient to form a hypergraph itself from the obtained bipartite graph. In this context, we relied on two dedicated functions. We first handled the input (previously generated data) and created a bipartite graph; then, we cast the bipartite graph into a hypergraph.
7.3. Smith Normal Form
Afterward, we applied the Smith normal form as the figure explain Figure 14 to find similar process groups and make further computations.
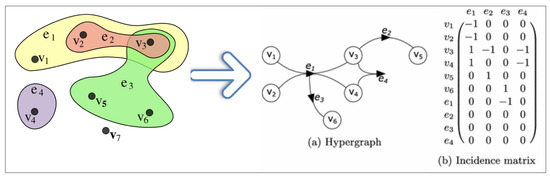
Figure 14.
Smith normal form.
In mathematics, the Smith normal form (HyperNetX, homology and Smith normal form: https://pnnl.github.io/HyperNetX/build/algorithms/algorithms.html#homology-and-smith-normal-form, Accessed Date: 13 April 2021) is a normal form that is defined for any matrix with entries in a principal ideal domain (PID) in a simplistic way.
An incidence matrix is a matrix that shows the relationship between two classes of objects. If the first class is X and the second is Y, the matrix has one row for each element of X and one column for each element of Y.
The purpose of computing the homology groups for data generated hypergraphs is to identify data sources that correspond to interesting features in the topology of the hypergraph.
The elements of one of these homology groups are generated by k dimensional cycles of relationships in the original data that are not bound together by higher-order relationships. Ideally, we want the briefest description of these cycles; we want a minimal set of relationships exhibiting interesting cyclic behavior. This minimal set is the basis for the homology group.
The cyclic relationships in the data are discovered using a boundary map represented as a matrix. To discover the basis, we compute the Smith normal form of the boundary map. This module computes the homology groups for data represented as an abstract with chain groups and . The boundary matrices are represented as rectangular matrices over . These matrices are diagonalized and represented in Smith normal form. The kernel and image bases are computed, and the Betti numbers and homology basis are returned.
As an output of the Smith normal form “step”, we obtained an array of calculated homology and then invoked interpretation, which returned the data as represented in associated with the array. Later on, we could visualize the obtained interpretations.
8. Hypergraph Based Representation for BP
We used the hypergraphs as a tool for describing IS from various viewpoints, a formal method to analyze the system, and to check the conformance, compliance, and consistency of the set of models. It was used to define the different elements of processes, its analysis tools being based on mathematics with several algorithms of computer science. Hypergraphs can be for the description of BP.
The BP plays a big role in the Enterprise IS upon which we based on the process because if the workflow of the BP is well represented and organized, we can keep ensure the success of the whole IS. The BP representation can be made by using the transformation to FSM, which is described in hypergraphs. Then, we perform model checking activities on the representation [33].
The common goal in the modeling is to yield a conceptual and technical view that represents effectively and systematically all elements; the hypergraph can be used for BP, where each edge can associate with any number of nodes. The various parts of the process should be well defined with the different elements of the hypergraph, taking into account the properties of the process flow and patterns.
As we mentioned before, the hypergraphs are apt tools for representing complex and simple structures because of the strong mathematical structure, where the activities of the process are represented by vertices that are linked with relationships defined by hyperarcs, respecting the direction of the flow and the relationship between them, which is described by the tails and the heads of the hyperarcs.
A design problem of workflows and BP is providing consistent and timely feedback about a case to the involved citizens. A formal model grounded in graph theory provides the opportunity to reconcile various aspects in an integrated and consistent view. The systematic description of the complex relationships makes it possible to monitor, track, and manage the cases.
The formalized model can solve the above-mentioned problems with case management, which appears in document-centric IS, with a special emphasis on BP. The BP description in hypergraphs is transformed into bipartite graphs and showcased in matrices, according to the Smith normal form. The Smith normal form representation offers an opportunity to evaluate the dissimilarities between business processes, i.e., the violation of integrity and consistency in the case of dynamically changed business processes can be highlighted.
9. Conclusions
To conclude, we should consider the following achievements:
- We achieved an automatic method of generating simulated BP data with dedicated features;
- We established an automatic method of obtaining a visualization of generated data in terms of hypergraphs and bipartite graphs;
- We applied the Smith normal form to detect similar BP within generated data;
- We realized that with AWS, it is too costly for research work (excepting research within enterprises);
- Generating simulated data needs a lot of domain knowledge of BP.
Moreover, we can say that any model has its advantage and disadvantages, which can make it strong or weak, and any model has its specific domain to apply more, but the formal models are still strong because of the easy understanding and the ability for verification and checking. From this definition of the hypergraph, it is easy to see the simplicity and the significance of the hypergraph representation, which will be applied in our future work as a DBP model to describe the complex process as well as its resources and functionalities.
Author Contributions
K.B. and B.M. worked on the conceptualization of the raised issue; they wrote the original draft version, and then carried out editing the revision. K.B. carried out the operationalization and coding of the models. B.M. proofread the draft and revision, and supervised the process. B.M. acquired funding to support the creation of the paper. Both authors have read and agreed to the published version of the manuscript.
Funding
The project was supported by the European Union, co-financed by the European Social Fund (EFOP-3.6.3-VEKOP-16-2017-00002) and the project was partially supported by “Application Domain Specific Highly Reliable IT Solutions” project, which was implemented with the support provided from the National Research, Development and Innovation Fund of Hungary, financed under the Thematic Excellence Programme TKP2020-NKA-06 (National Challenges Subprogramme) funding scheme.
Institutional Review Board Statement
Not applicable.
Informed Consent Statement
Not applicable.
Data Availability Statement
The data and code presented in this study are available on request from the author.
Conflicts of Interest
The authors declare no conflict of interest.
References
- Brahimi, M.; Bouzidi, L. Eléments D’architecture Pour Une Mémoire D’ Entreprise Orientée Processus Métier. Rev. Electron. Suisse Sci. L’Inf. (RESSI) 2008, 1661–1802. Available online: http://campus.hesge.ch/ressi/Numero_7_mai2008/articles/HTML/RESSI_043_Brahimi.htm (accessed on 8 December 2020).
- Mejia Bernal, J.F.; Falcarin, P.; Morisio, M.; Dai, J. Dynamic Context-aware Business Process: A Rule-based Approach Supported by Pattern Identification. In Proceedings of the 2010 ACM Symposium on Applied Computing; ACM: New York, NY, USA, 2010; pp. 470–474. [Google Scholar]
- Havey, M. Essential Business Process Modeling; O’Reilly Media, Inc.: Newton, MA, USA, 2005. [Google Scholar]
- Davenport, T.H.; Beers, M.C. Managing Information about Processes. J. Manag. Inf. Syst. 1995, 12, 57–80. [Google Scholar] [CrossRef]
- Grover, V.; Kettinger, W.J.; Teng, J.T.C. Business Process Change in the 21st Century. Bus. Econ. Rev. 2000, 46, 14–18. [Google Scholar]
- Kirchmer, M.; Scheer, A.W. Change Management—Key for Business Process Excellence. In Business Process Change Management; Springer: Berlin/Heidelberg, Germany, 2003; pp. 1–14. [Google Scholar]
- Chen, Q.; Reichard, G.; Beliveau, Y. Interface management-a facilitator of lean construction and agile project management. Int. Group Lean Constr. 2007, 1, 57–66. [Google Scholar]
- Salinesi, C.; Thevenet, L.H. Enterprise Architecture, Des Problèmes Pratiques à L’innovation. Ing. Syst. D’Inf. 2008, 13, 75–105. [Google Scholar] [CrossRef]
- Whitman, L.; Ramachandran, K.; Ketkar, V. A Taxonomy of a Living Model of the Enterprise. In Proceedings of the 2001 Winter Simulation Conference (Cat. No. 01CH37304), Arlington, VA, USA, 9–12 December 2001; Volume 2, pp. 848–855. [Google Scholar]
- Abdulmalek, F.A.; Rajgopal, J. Analyzing the benefits of lean manufacturing and value stream mapping via simulation: A process sector case study. Int. J. Prod. Econ. 2007, 107, 223–236. [Google Scholar] [CrossRef]
- Vasilecas, O.; Vysockis, T.; Rusinaite, T. On goal-oriented business process simulation. In Proceedings of the 2016 IEEE 4th Workshop on Advances in Information, Electronic and Electrical Engineering (AIEEE), Vilnius, Lithuania, 10–12 November 2016; pp. 1–4. [Google Scholar]
- Molnár, B.; Bouafia, K. Adaptive Case Management and Dynamic Business Process Modeling A proposal for document-centric and formal ap-proach. In Proceedings of the AIS 2017 12 th International Symposium on Applied Informatics and Related Areas, Beijing, China, 21–24 August 2017; pp. 2–6. [Google Scholar]
- Moldt, D.; Wienberg, F. Multi-agent-systems based on coloured Petri nets. In Lecture Notes in Computer Science, Proceedings of the 18th International Conference on Application and Theory of Petri Nets, Toulouse, France, 23–27 June 1997; Azéma, P., Balbo, G., Eds.; Springer: Berlin, Germany, 1997; Volume 1248, pp. 82–101. [Google Scholar]
- Peterson, J.L. Petri nets. ACM Comput. Surv. (CSUR) 1977, 9, 223–252. [Google Scholar] [CrossRef]
- Specification, O.F.A. Business Process Modeling Notation Specification. 2006. Available online: https://www.omg.org/bpmn/Documents/OMG_Final_Adopted_BPMN_1-0_Spec_06-02-01.pdf (accessed on 20 November 2020).
- Petrillo, A.; Di Bona, G.; Forcina, A.; Silvestri, A. Building excellence through the Agile Reengineering Performance Model (ARPM): A strategic business model for organizations. Bus. Process. Manag. J. 2018, 24, 128–157. [Google Scholar] [CrossRef]
- Jordan, D.; Evdemon, J.; Alves, A.; Arkin, A.; Askary, S.; Barreto, C.; Bloch, B.; Curbera, F.; Ford, M.; Goland, Y.; et al. Web services business process execution language version 2.0. Oasis Stand. 2007, 11, 5. [Google Scholar]
- Bouafia, K.; Khebizi, A.; Molnár, B. Nouvelle Approche Fonctionnelle de Transformation aux Specifications Abstraites des Services Web Basees sur les afd a Partir des Programmes Bpel. Am. J. Innov. Res. Appl. Sci. 2020, 4, 148–164. [Google Scholar]
- Business Process Model And Notation Specification. Business Process Model and Notation; Object Management Group: Needham, MA, USA, 2006; Volume 2. [Google Scholar]
- Baeten, J.C. A brief history of process algebra. Theor. Comput. Sci. 2005, 335, 131–146. [Google Scholar] [CrossRef] [Green Version]
- Kopp, O.; Unger, T.; Leymann, F. Nautilus Event-Driven Process Chains: Syntax, Semantics, and Their Mapping to BPEL. Available online: http://ceur-ws.org/Vol-224/epk2006-paper5.pdfs (accessed on 21 November 2020).
- Cui, K.; Yang, W.H.; Gou, H.Y. Experimental research and finite element analysis on the dynamic characteristics of concrete steel bridges with multi-cracks. J. Vibroeng. 2017, 19, 4198–4209. [Google Scholar]
- Bretto, A. Hypergraph theory. In An Introduction. Mathematical Engineering; Springer: Cham, Switzerland, 2013. [Google Scholar]
- Li, D.; Xu, Z.; Li, S.; Sun, X. Link prediction in social networks based on hypergraph. In Proceedings of the 22nd International Conference on World Wide Web, Rio de Janeiro, Brazil, 13–17 May 2013; pp. 41–42. [Google Scholar]
- Berge, C. Hypergraphs: Combinatorics of Finite Sets; Elsevier: Amsterdam, The Netherlands, 1984; Volume 45. [Google Scholar]
- Molnár, B.; Benczúr, A. Facet of Modeling Web Information Systems from a Document-Centric View. Int. J. Web Portals 2013, 5, 57–70. [Google Scholar] [CrossRef]
- Ausiello, G.; Italiano, G.F.; Laura, L.; Nanni, U.; Sarracco, F. Structure theorems for optimum hyperpaths in directed hypergraphs. In International Symposium on Combinatorial Optimization; Springer: Berlin/Heidelberg, Germany, 2012; pp. 1–14. [Google Scholar]
- Saligny, L.; Bouillé, F. La Méthode HBDS: Hypergraph-Based Data Structure. 2011. Available online: https://halshs.archives-ouvertes.fr/halshs-00959477/ (accessed on 18 February 2021).
- Sun, L.; Ji, S.; Ye, J. Hypergraph Spectral Learning for Multi-label Classification. In Proceedings of the Fourteenth ACM SIGKDD International Conference on Knowledge Discovery and Data Mining, Las Vegas, NV, USA, 24–27 August 2008; pp. 668–676. [Google Scholar] [CrossRef]
- Ducournau, A. Hypergraphes: Clustering, Réduction et Marches Aléatoires Orientées pour la Segmentation D’images et de Vidéo. Ph.D. Thesis, Ecole Nationale D’ingénieurs de Saint-Etienne, Saint-Etienne, France, 2012. [Google Scholar]
- Rital, S. Hypergraphe de Voisinage Spatiocolorimétrique: Application en Traitement D’images. Ph.D. Thesis, Université de Bourgogne, Dijon, France, 2004. [Google Scholar]
- Tian, Z.; Hwang, T.; Kuang, R. A hypergraph-based learning algorithm for classifying gene expression and array CGH data with prior knowledge. Bioinformatics 2009, 25, 2831–2838. [Google Scholar] [CrossRef] [PubMed] [Green Version]
- Bouafia, K.; Molnár, B. Formal Verification of Analysis Approach for Enterprise Information Systems Architecture Using Hypergraph Representation Based on Finite State Machines for Supporting Business Process Requirements. J. Appl. Bus. Econ. 2020, 22, 265–273. [Google Scholar] [CrossRef]


Publisher’s Note: MDPI stays neutral with regard to jurisdictional claims in published maps and institutional affiliations. |
© 2021 by the authors. Licensee MDPI, Basel, Switzerland. This article is an open access article distributed under the terms and conditions of the Creative Commons Attribution (CC BY) license (https://creativecommons.org/licenses/by/4.0/).