Abstract
Insulators are important safety devices on high-voltage transmission lines. An insulator inspection system based on UAVs is widely used. Insulator defect detection is performed against two main engineering problems: 1. The scarcity of defect images, which leads to a network overfitting problem. 2. The small object detection, which is caused by the long aerial photography distance, and the low resolution of the insulator defect area pictures. In this study, firstly, the super-resolution reconstruction method is used to augment the dataset, which can not only solve the overfitting problem but also enrich the image texture features and pixel values of defect areas. Secondly, in the process of insulator defect detection, a two-stage cascading method is used. In the first stage, the rotated object detection algorithm is used to realize the object location of insulator strings, and then images of the identified insulators are cropped to reduce the proportion of the background area in defect images. In the second stage, YOLO v5 is used for the detection of insulator caps that are missing defects. The method proposed shows good detection effect on the self-built training set which contains only 85 images captured from real inspection environments. The method has practical industrial application value.
1. Introduction
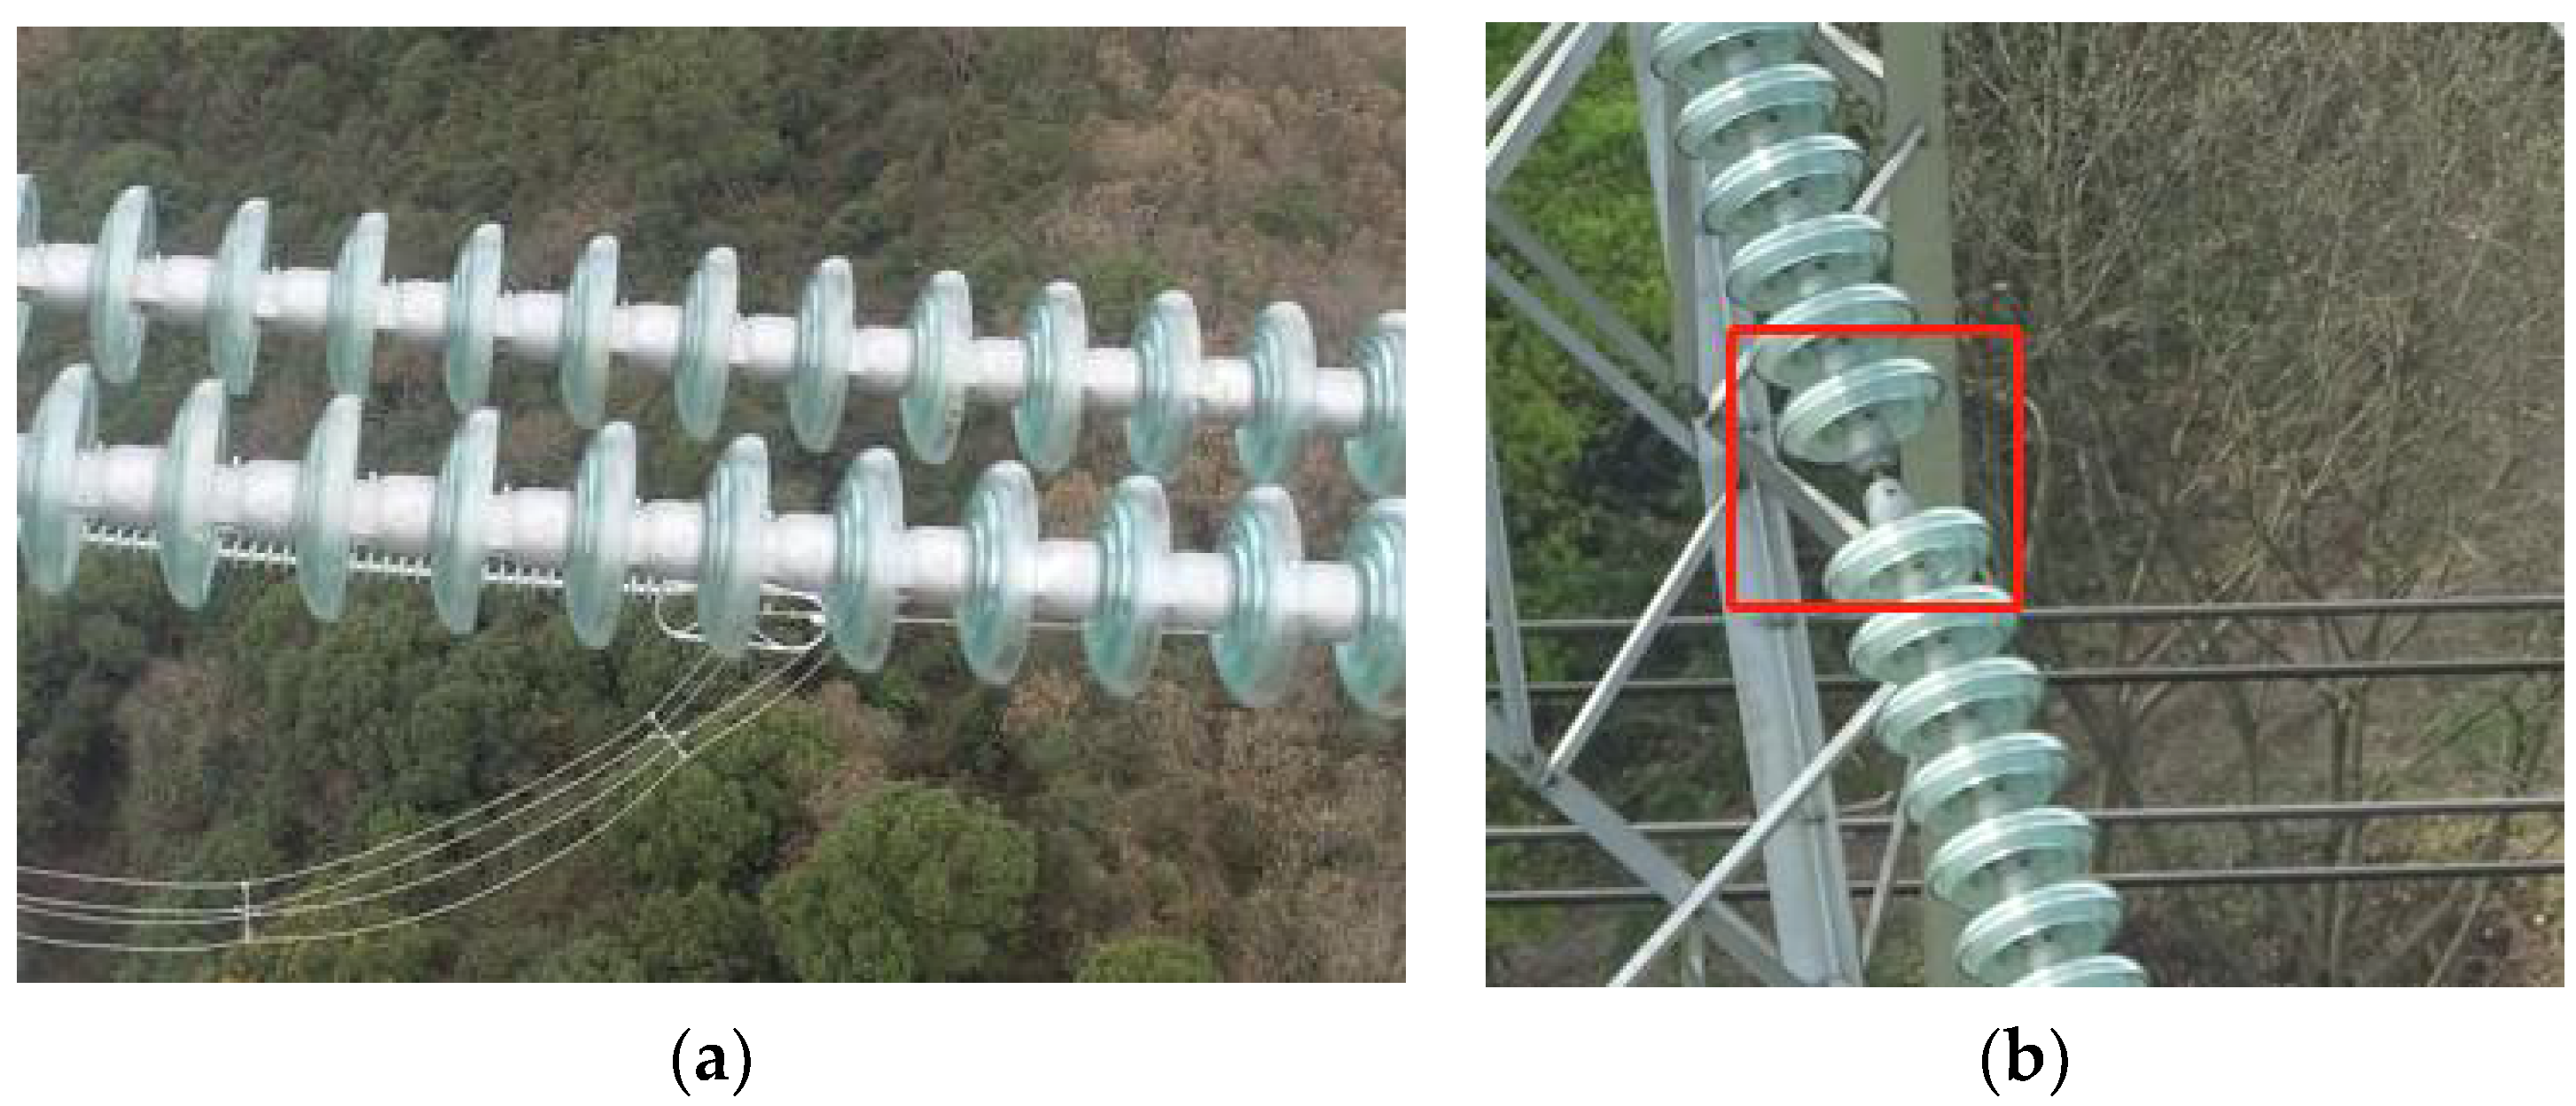
As the most common equipment on a transmission line, an insulator plays a role among conductors, cross bars, and towers. The safe and stable operation of insulators is very important for the safety of transmission. Among the factors affecting the safety performance of insulators, insulator self-explosion (see Figure 1) is the most prominent problem [1,2]. Therefore, the timely detection of faulty insulators is an important way to solve the hidden risks of high-voltage transmission lines.
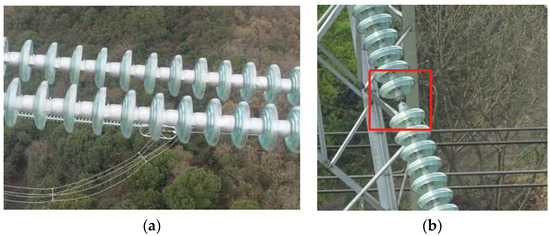
Figure 1.
Insulators on high voltage transmission line: (a)Intact Insulator; (b) Defective Insulator.
In the past few years, with the progress of technology, it has become possible to use cameras carried by UAVs to collect images to inspect high-voltage power transmission systems, including instances of insulator failure. In combination with deep learning technology, this method shows higher and higher efficiency and security, which has become a development trend (see Figure 2). However, in the past, the detection of insulator inspection pictures still depended on manual work, resulting in low efficiency. In order to overcome the problems caused by manual inspection, many automatic detection technologies have been developed [3,4,5]. With the rapid development of computer vision technology and deep learning technology, using image acquisition equipment as medium and deep learning technology to detect the defects of insulator equipment has become a feasible scheme.
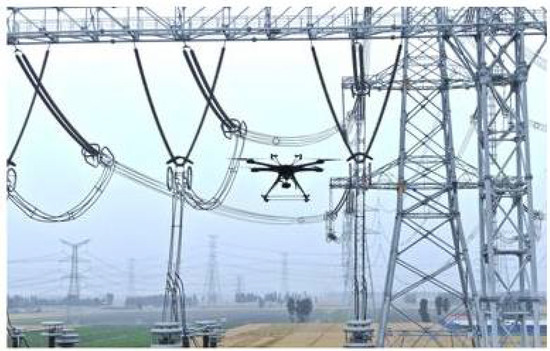
Figure 2.
UAV patrol high voltage power transmission system.
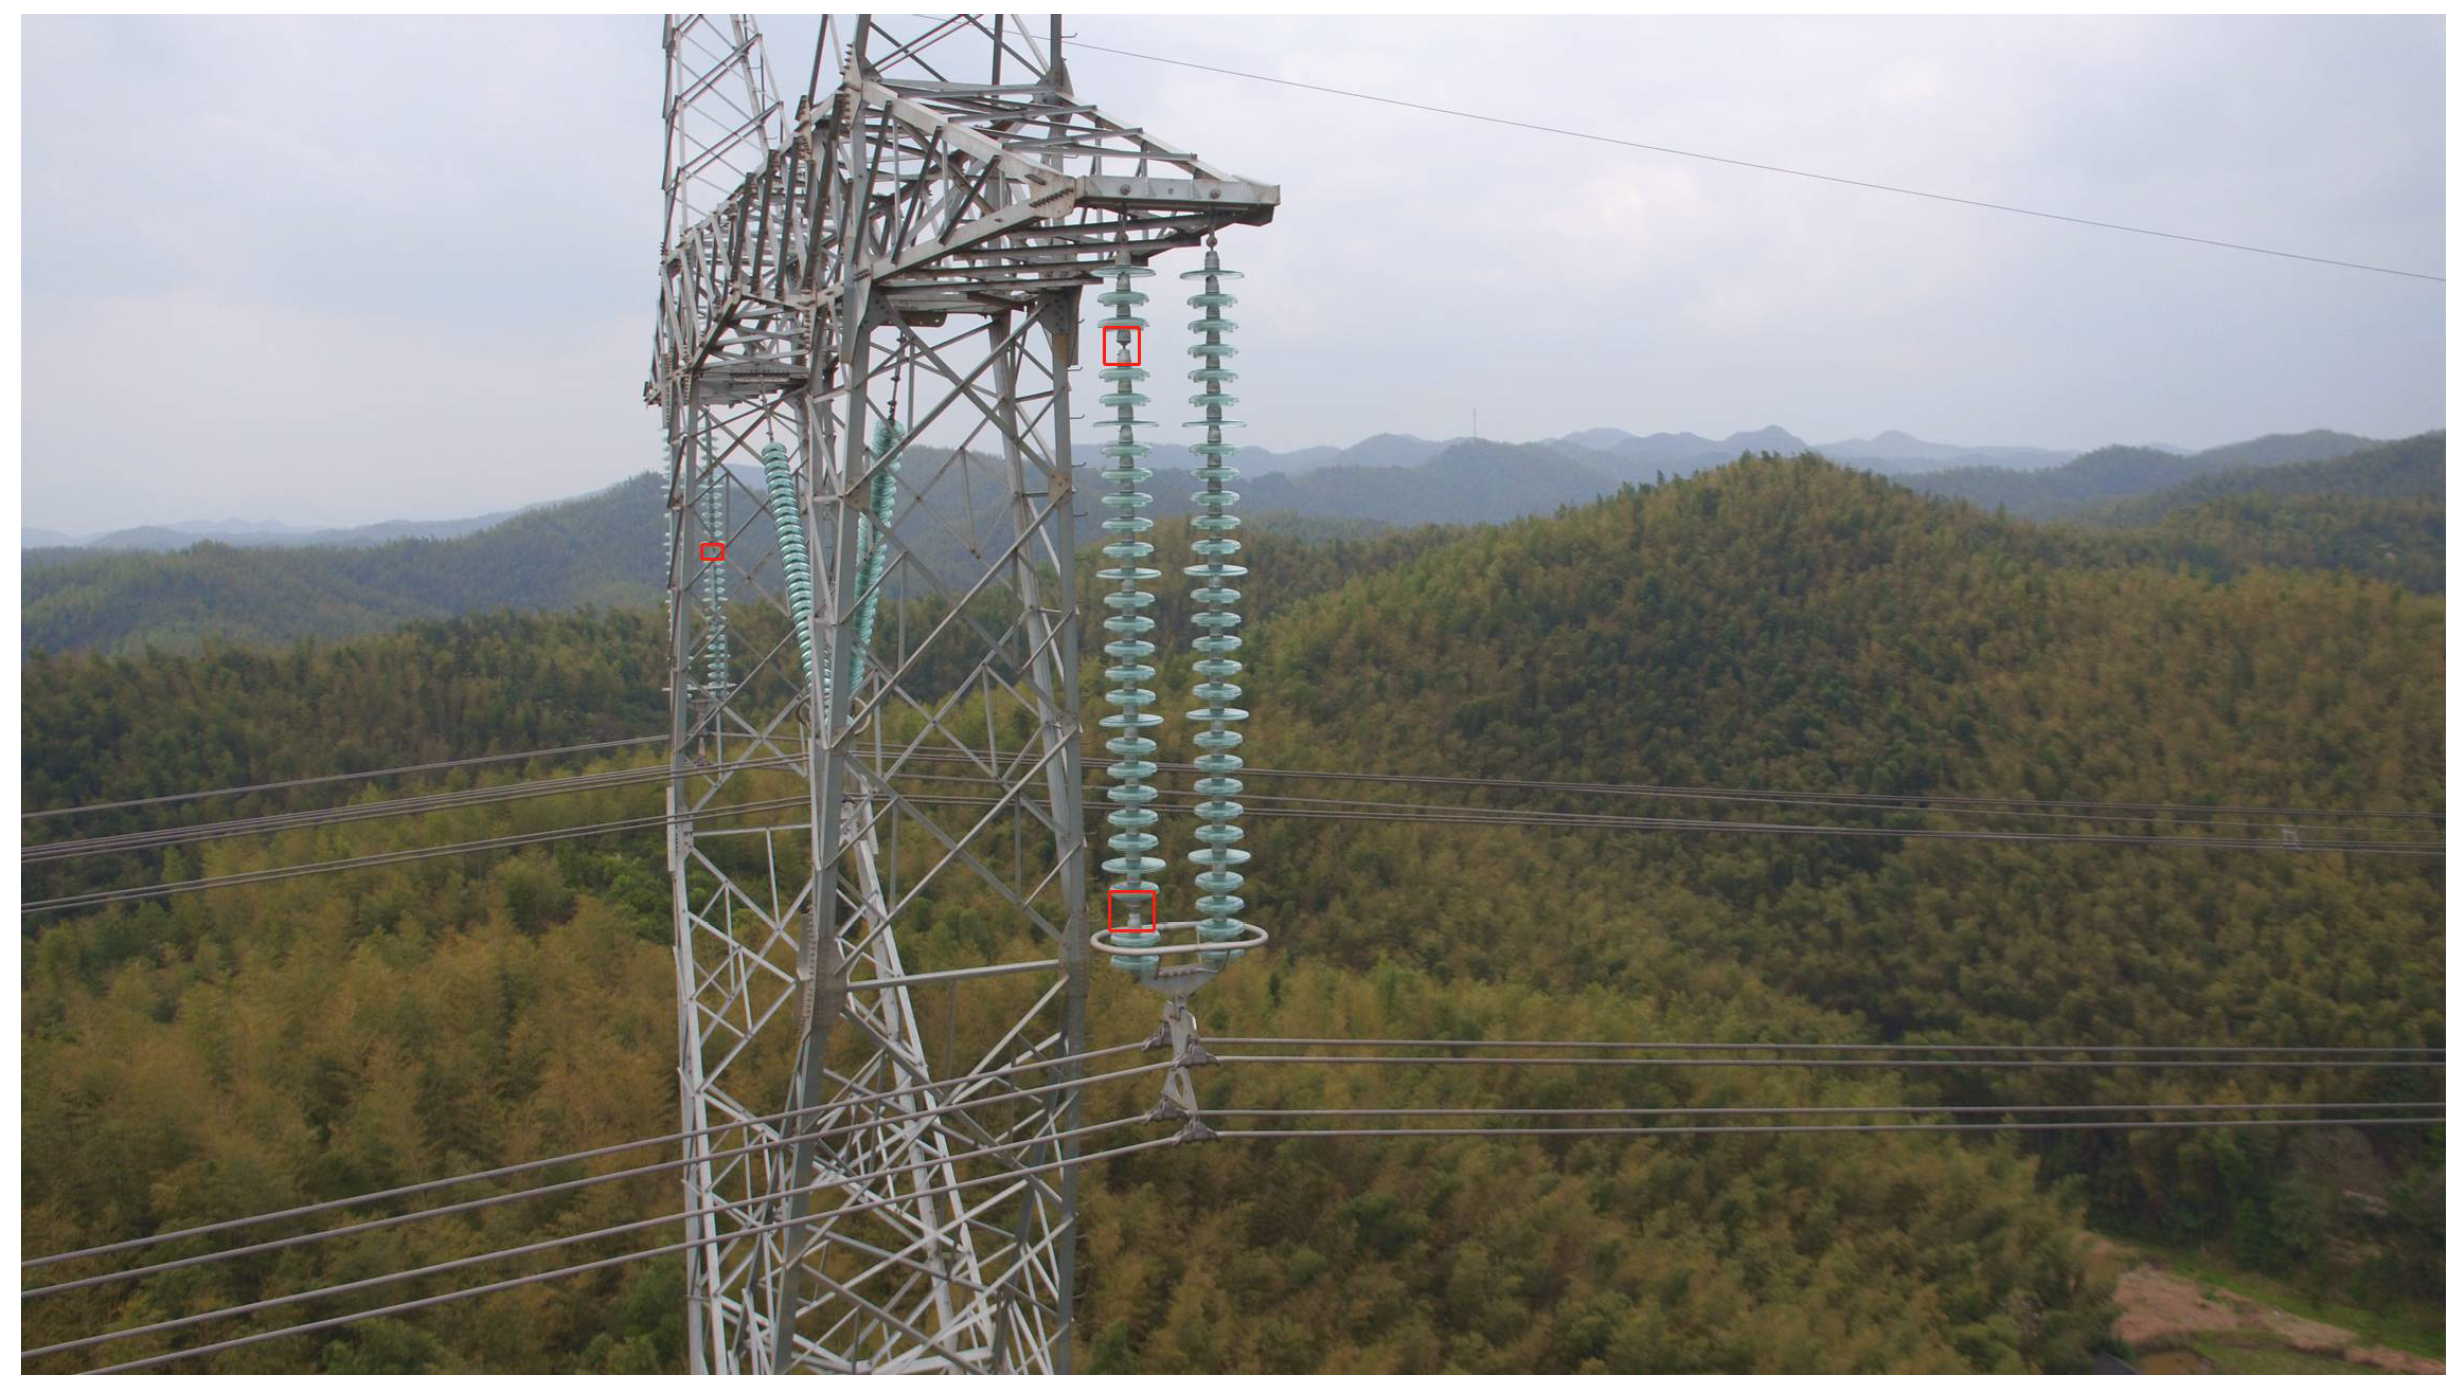
In this study, the insulator image taken by a UAV is used to detect the defect area of the insulator “self-exposure”. Because the number of available defective insulator samples is far less than that of intact insulator samples, which leads to the difference in positive and negative sample distribution, which makes it difficult to develop and deploy the traditional data-driven object detection model. At the same time, because the safety management system of the power grid has strict restrictions on the flight distance between the UAV and the power tower, the UAV cannot obtain snapshots of insulators at close range. This makes the proportion of insulator defect area in many pictures taken by UAV too small, as shown in Figure 3. Thus, insulator defect identification becomes a small object identification problem. Moreover, as shown in the figure, the insulator string is a typical object with a large aspect ratio. Sometimes, the proportion of background area in the object frame formed by horizontal object detection will be relatively large, which is not conducive to improving the proportion of the defect area.
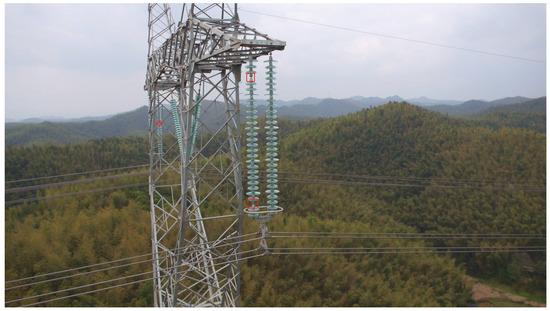
Figure 3.
Self-exploding insulator in image.
In this regard, this paper proposes the following methods to solve the above problems:
First, data augmentation is used to expand a small sample dataset in a more effective and controlled way. In addition to the traditional data augmentation, this study also uses the super-resolution reconstruction method. The super-resolution reconstruction method can not only effectively expand the small sample data set but also solve the problem of making up for the deficiency of pixel values in the insulator defect area.
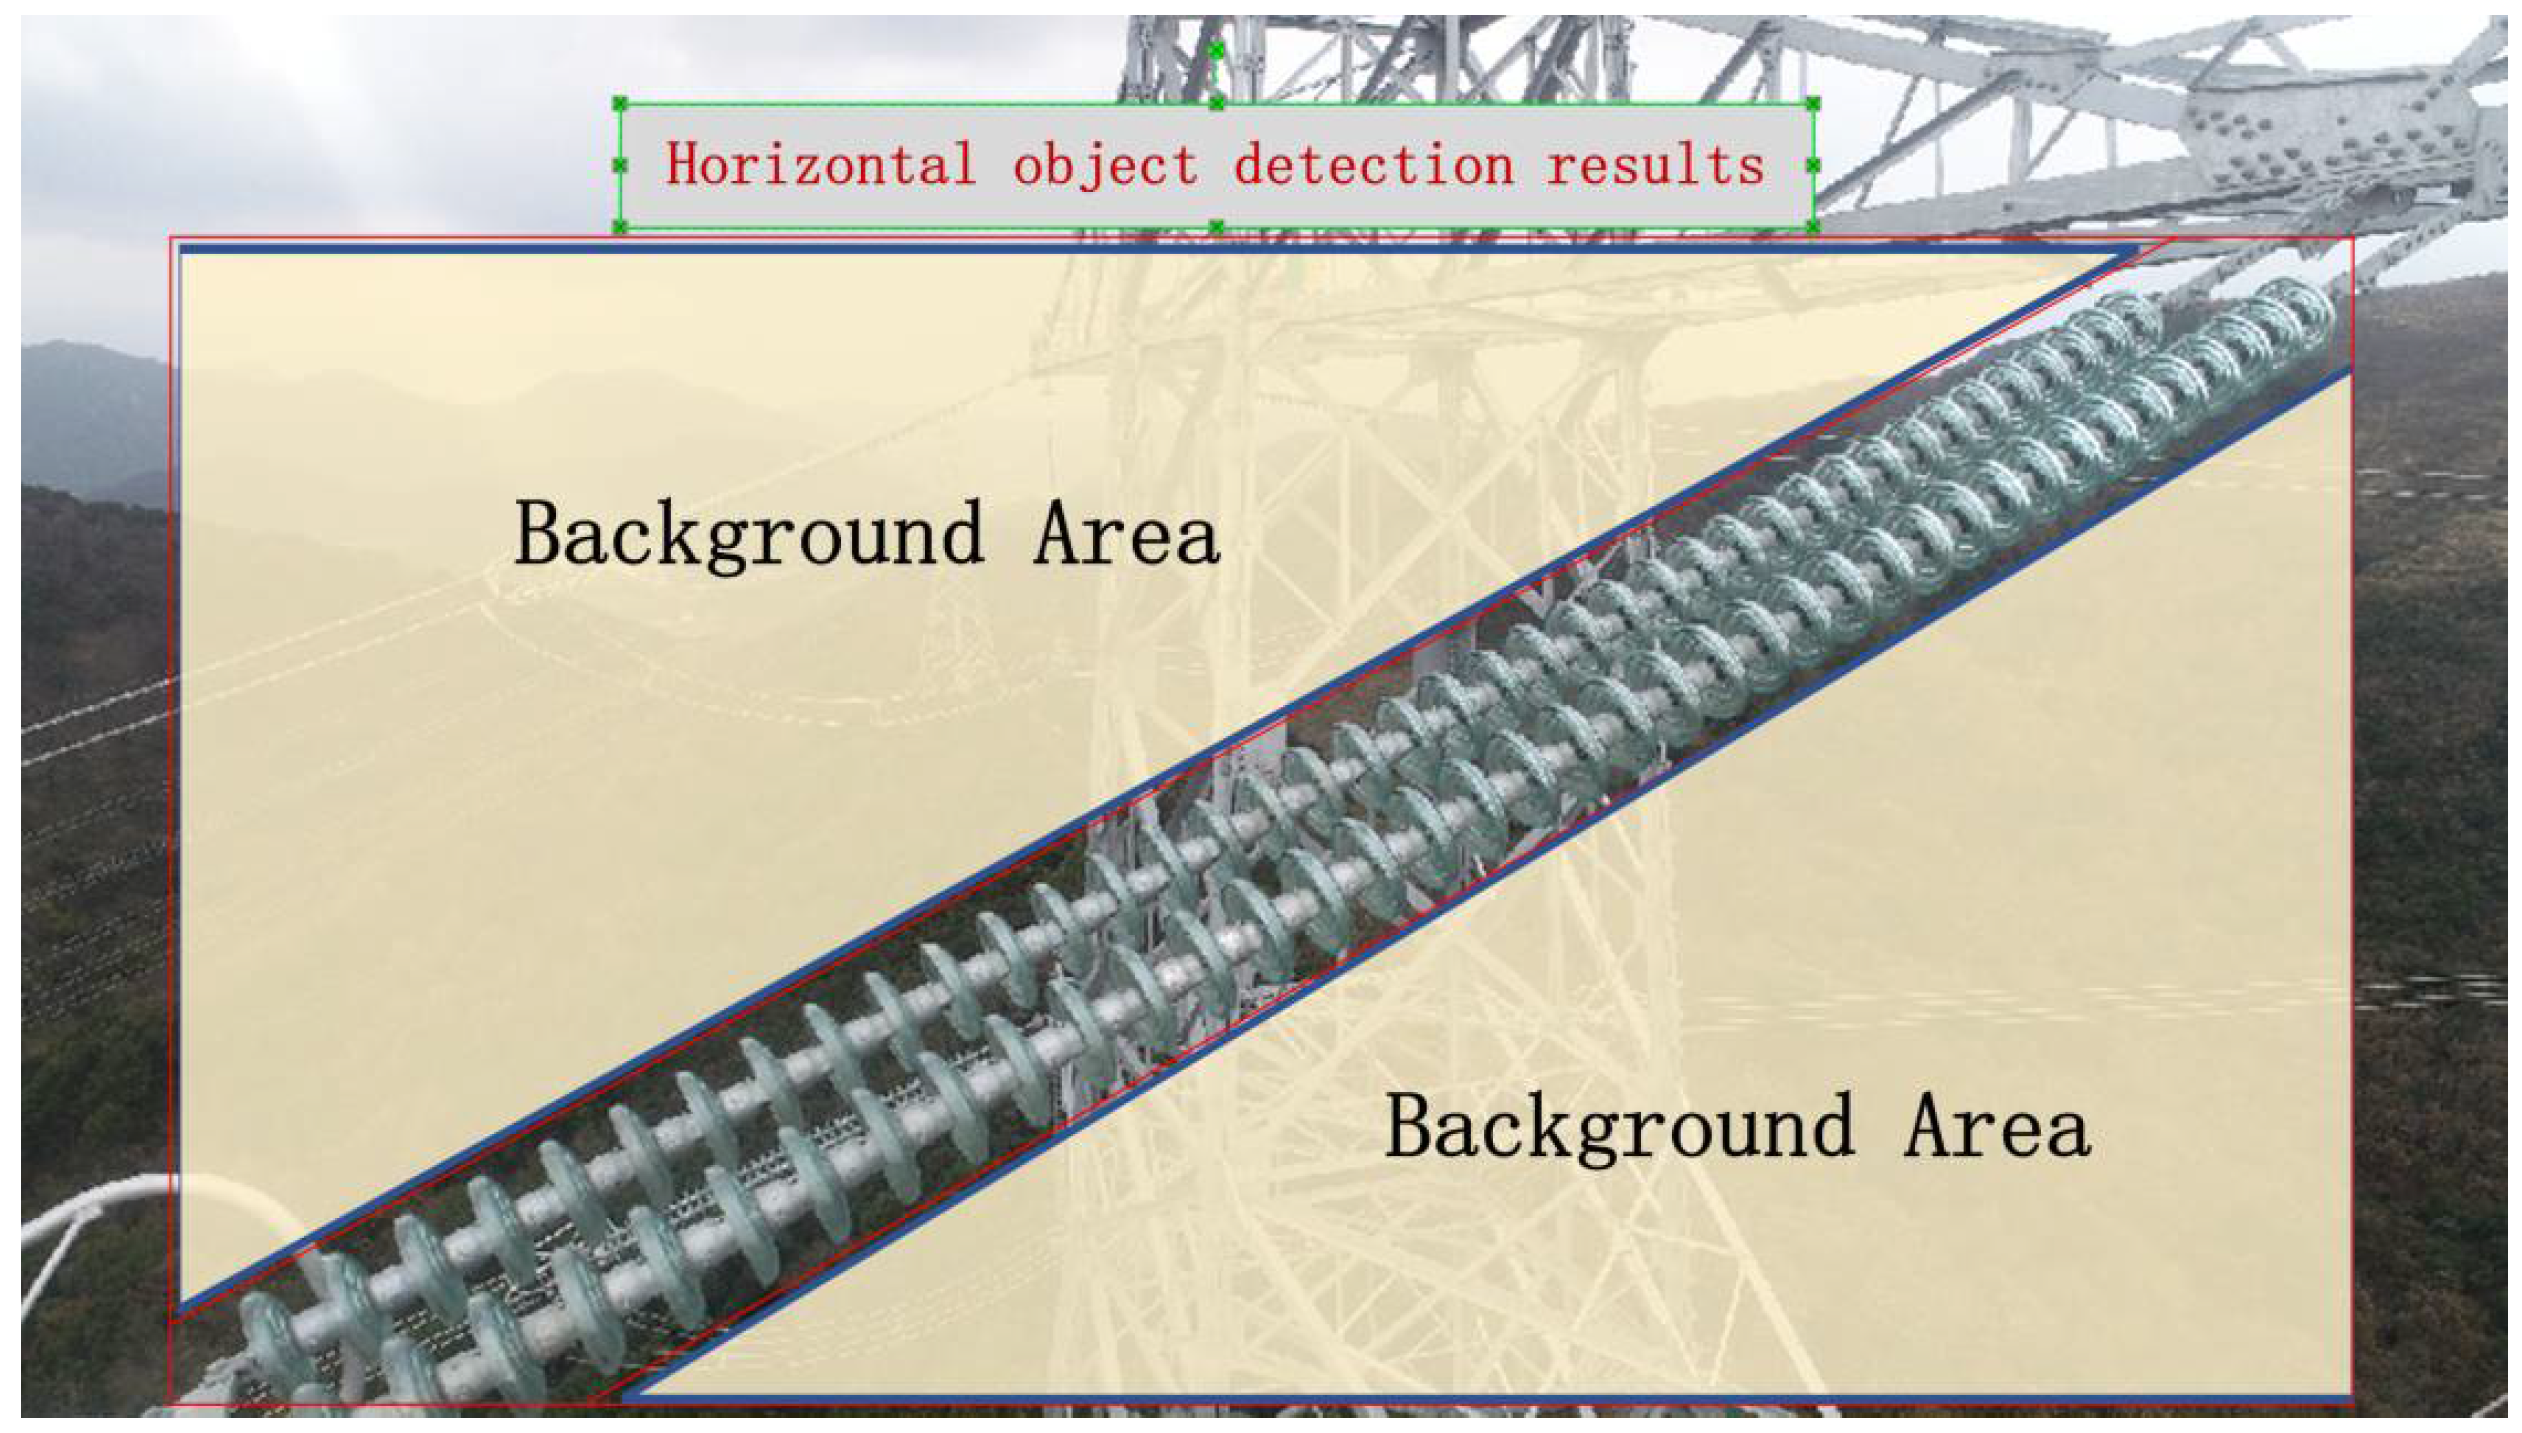
Then, in the object defect detection stage, this paper proposes a two-stage joint detection structure. In the first stage, the complete insulator string is detected, and in the second stage, the defective part is detected in the detected insulator string. Because the insulator string is a narrow and long object and the rotation angle is uncertain, using an object detection algorithm would make it easy to mix too many backgrounds in the pictures of the second stage, making the work of the first stage basically ineffective, as shown in Figure 4. Therefore, this paper introduces rotated object detection technology in the first stage of detection. By detecting the rotating frame of the object, the detection result closer to the shape of the object is obtained so as to remove the interference of the image’s background area.
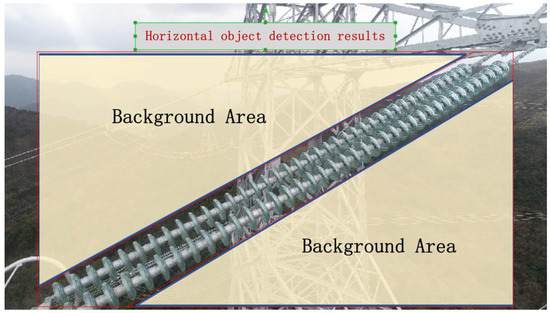
Figure 4.
Horizontal object detection results.
The proposed method is tested on a self-built new data set. The results show that the proposed method can effectively solve the problems and be applied to practical industrial detection.
2. Related Work
The research on insulator detection has had much accumulation, such as the early image processing method of pattern matching based on manually set features such as image color, shape, and texture. With the development of deep learning, the insulator object detection method based on deep learning has gradually become the mainstream.
In order to prevent accidents caused by the too-close distance between a UAV and a power tower and other equipment, the power grid management organization stipulates that a UAV shall keep a considerable distance from high-voltage power equipment. Distance, unstable crosswind, and other factors may cause image distortion, mutual occlusion, and small object imaging of insulators photographed by a UAV. These characteristics of aerial images from a UAV make many algorithms based on regional convolution neural network (RCNN) have a poor effect on small object detection because the algorithm principle needs to propose the region of interest (ROI) in the image and then merge step by step. When merging, the phenomenon of filtering out may occur because the object region is too small, which reduces the recognition accuracy.
2.1. Super-Resolution Reconstruction
The concept of super-resolution reconstruction (SR) first appeared in the field of optics. In the field of optics, SR refers to the process of trying to recover data beyond the diffraction limit. Super-resolution reconstruction uses low-resolution images to generate high-resolution images in order to overcome the lack of pixels in the original images [6,7]. Traditional super-resolution reconstruction algorithms mainly include interpolation amplification algorithms and learning-based super-resolution reconstruction algorithms. Traditional interpolation and amplification algorithms, such as Lanczos interpolation, non-uniform interpolation [8,9], and bicubic interpolation [10], have the advantages of simple structure and easy implementation, but their reconstruction effects are poor. The main advantage of learning-based super-resolution reconstruction is that it has high accuracy due to regression learning, sparse representation, and Adjacent Domain Embedding [11,12,13], but its main disadvantage is that it requires many training resources.
An SR algorithm based on a convolutional neural network (CNN) has been widely used. Dong et al. [14,15] trained a three-layer deep convolution network and reconstructed low-resolution images using bicubic interpolation. VDSR [16], proposed by Kim J., is the first method to introduce global residual to Super Resolution. Done also proposed SRCNN that applies the convolution layer to the pre-ascending scale LR image.
2.2. Object Detection and Rotated Object Detection
In recent years, deep learning has achieved good performance in various object detection tasks. Deep neural networks have shown an excellent ability to extract image features [17,18]. At present, deep learning object detection methods can be divided into single-stage object detection and two-stage object detection. Region-based convolution neural network (RCNN) series are classic two-stage object detection methods. Typical RCNN algorithms include three methods: RCNN, fast RCNN, and faster RCNN [19,20,21]. The three methods are progressive layer by layer, continuously improving the performance of object detection.
Single-step object detection calculates the position and category of the object in the way of regression. This kind of method directly receives the image input and regresses the position and category of the object in the image, which has the advantage of high speed. Typical single-step object detection algorithms include the YOLO series and the SSD series [22,23].
The above methods are based on horizontal object detection. Due to the dense arrangement and irregular shape of objects in horizontal frame object detection, the background proportion in the detection frame of large aspect ratio objects such as insulator string is too large. Therefore, some scholars have proposed a rotation object detection algorithm, and the earlier rotation detection algorithm is RRPN [24]. This algorithm is an extension of the fast RCNN algorithm. By extending the angle of the anchor generated by the FPN part of the fast RCNN algorithm, a more intensive rotation anchor is generated to adapt to the rotation frame detection task, as shown in Figure 5 below. With the development of single-stage horizontal object detection methods, the rotated object detection method [25,26,27] adds the angle of rotation as regression parameters to the horizontal object detection, and the rotation angle of the rotating frame is fitted by the neural network. However, algorithms based on angle regression generally face three main problems [28]: the inconsistency of evaluation metric and loss, the quasi-square detection problem, and the boundary discontinuity; To address these issues, [28] proposes using the GWD algorithm, which uses Wasserstein distance instead of Euclidean distance to evaluate the loss and transform the problem of object detection into the problem of fitting the two-dimensional Gaussian distribution. On the basis of this, KLD [29] further introduces the Kullback–Leibler Divergence loss in the rotation object detection from the aspect of high precision detection and Scale invariance.
Figure 5.
Anchor mechanism in RRPN.
2.3. Insulator Defect Object Detection
For insulator defect detection, scholars have proposed different methods from classical image algorithm to machine learning. Liao Shenglong [30] first used the local characteristics of insulators for rough segmentation and then used the spatial distribution characteristics of insulators to detect insulators. Reference [31] proposed a recognition method combining insulator shape, color, and texture features. The features in parallel lines in different directions of the insulator image are perceived as candidate regions of the insulator and then extended from candidate regions to adjacent regions to locate the insulator using color features. Finally, the area is divided into blocks by using the average distance between insulator pieces, and the broken insulator is found by analyzing the texture characteristics between blocks.
With the rapid development of deep learning in end-to-end object detection, it is possible to apply deep learning to insulator image detection. Based on a convolutional neural network, Chen Qing et al. [32] first extracted the features of insulators by using the trained model and then input the features into a self-organizing feature mapping network (SOM) for significance detection. Miao et al. [33] used the SSD model to identify ceramic insulators and composite insulators from aerial images. Tao et al. [34] proposed a cascade structure of a deep convolution neural network (CNN) based on a regional suggestion network (RPN), which successfully detected insulator defects under good image quality, but still did not propose targeted solutions to small object problems and had large training data.
In short, many previous studies generally used Pascal VOC [35] data set to complete network model training and verification tests, while in a real environment, the insulator image background is more complex, with more shooting light, angles, and so on. The previously proposed method has relative limitations, such as small samples, small objects, and other technical problems that need to be further studied and solved.
3. Proposed Method
In this study, an insulator defect detection method for a small sample data set is adopted, and the problem of a small object caused by an aerial image is overcome. The proposed method adopts the super-resolution reconstruction data enhancement technology and a RetinaNet network cascading architecture for performing localization and detecting defects in insulators.
The method is mainly divided into two parts: firstly, the super-resolution reconstruction based on the Generative Adversarial Networks (SRGAN) is used to expand the defect insulator’s image dataset. Furthermore SRGAN can improve the resolution of the defect area in original images at the same time; secondly, a two-stage cascade network based on the combination of rotating object detection and YOLO V5 [36,37] is proposed to transform defect detection into two stages object detection. In the first stage, a rotated object detection algorithm based on RetinaNet is used to locate the insulator strings, which, in the form of rotated boxes, are going to be cropped from the augmented image dataset, and the background parts of the images are discarded. In the second stage, the YOLO V5 is used to detect detections of insulators from cropped images.
3.1. SRGAN Data Augmentation
SRGAN is a generative adversarial network (GAN) proposed by [38], which produces reconstruction with high realistic image probability. The goal is to generate a high-resolution image (SR) for a given low-resolution image (LR) using a trained generator G.
The training of the generation model G is to fool the discriminator D, which is trained to distinguish the super-resolution image from the real image. With the help of joint learning, the generator can learn to create a solution highly similar to the real image, so the discriminator D can distinguish whether the input is a real image or a super divided image. Its structure is shown in Figure 6.
Figure 6.
Structure of SRGAN Network: (a) Structure of Generator Network; (b) Structure of Discriminator Network.
GAN-based approaches generally deliver visually pleasing outputs, while the reconstruction error-based methods more accurately preserve the spatial details of an image.
The core of SRGAN is to propose a loss function aimed at obtaining better visual perception evaluation, which is different from the previous pursuit of a higher peak signal-to-noise ratio (PSNR) at the pixel-wise image level. PSNR is the most commonly used index to evaluate the effect of the SR algorithm. However, the higher PSNR is obtained by minimizing the MSE of the Euclidean distance between the reconstructed high-pixel image and the original image pixels at the pixel level. The higher the PSNR, the smoother the change of the object edge in the image, which will lead to the blurring of the object edge visually, resulting in the texture detail of the reconstructed image after high magnification being unrealistic. Therefore, the PSNR value is not necessarily consistent with the MOS (mean opinion score).
In order to establish an evaluation and training system closer to MOS, SRGAN proposes a new loss function :
As can be seen from Equation (1), SRGAN abandons the pursuit of MSE minimization and adopts content loss based on VGG19 as its loss function. As Equation (2)
SRGAN [39] also optimized the adversarial loss function of the min-max game between a generator and a discriminator. The resulting loss function is defined based on the probability value of the discriminator on all samples, Equation (3)
In terms of specific applications, the generator network G uses the convolution layer with the same layout in ResNET. The network combines two convolutional layers with small 3 × 3 kernels and 64 feature maps followed by batch normalization layers and Parametric ReLU as the activation function.
Discriminator network D is trained to discriminate real HR images from generated SR samples. It uses LeakyReLU activation and contains eight convolutional layers with an increasing number of 3 × 3 filter kernels, increasing by a factor of 2 from 64 to 512 kernels as in the VGG network. Strided convolutions are used to reduce the image resolution each time the number of feature channels is doubled. The resulting 512 feature maps are followed by two dense layers and a final sigmoid activation function to obtain a probability for sample classification.
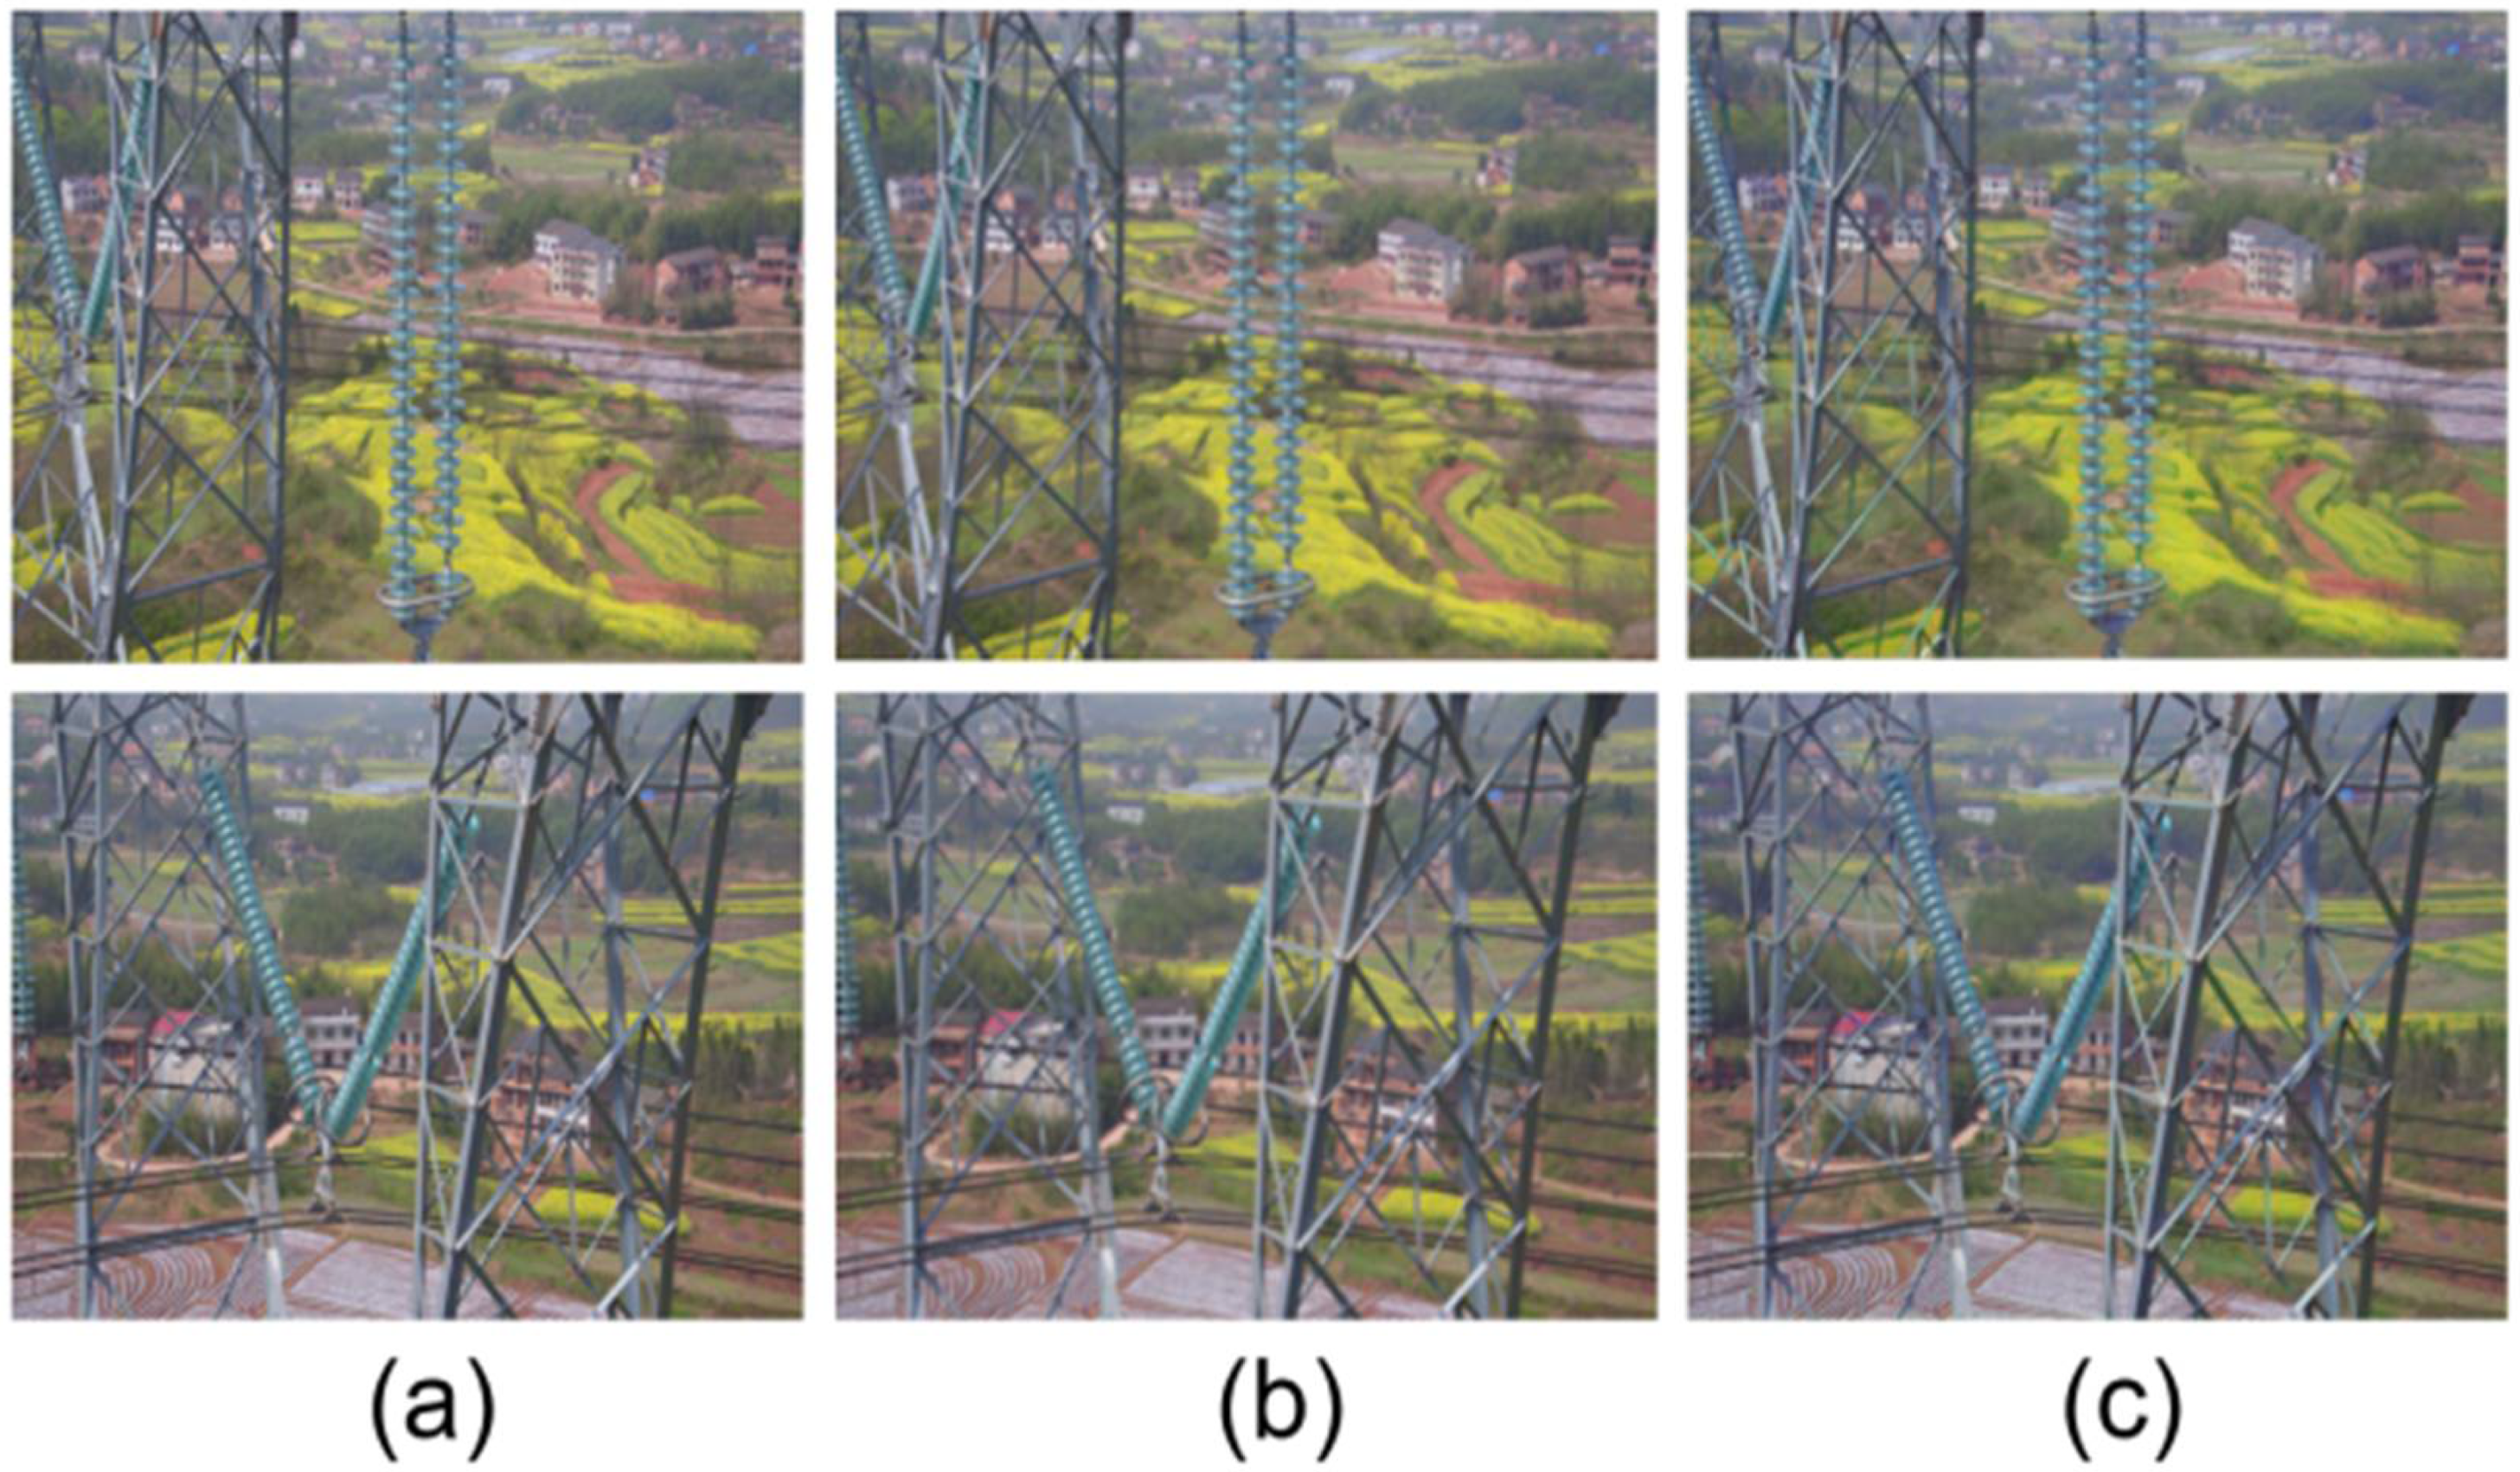
The original data set contains 85 insulator images (OR) with a resolution of 1024 × 768. First, resize the original dataset into 256 × 192 low-resolution images (LR). Then, use SRGAN to generate photo-realistic high-resolution images (SR) with high upscaling factors (4×). Finally, our new data set contains the original data set (OR) and the reconstructed image (SR) generated from the LR image. The example images that were interpolated and super-resolved with a 4× upscaling factor are shown in Figure 7.
Figure 7.
Compared illustration of super-resolution and bicubic interpolation. (a) are the original images. (b) are the high-resolution images which resize from the low-resolution images (256 × 192). (c) are the super-resolution images which are reconstructed by SRGAN.
SRGAN effectively alleviates the scarcity of defective samples and can multiply enlarge our dataset through different high upscaling factors. This method fundamentally solves the contradiction between the small defect sample data and the large capacity of the object detection models. The generated SR images are of higher resolution in the defect area. Under the premise that the shape and texture features of the original images have not changed significantly, appropriate noise is introduced into the images. This makes the trained detection model have strong robustness.
3.2. Two-Stage Cascading Architecture for Insulator Defect Detection with Rotated Object Detection
The original aerial image is denoted as OR, the reconstructed image after super-resolution is denoted as SR, and the length and width of OR and SR are denoted as W and H, respectively. The insulator defect area in the image is denoted as , where denote abscissa and ordinate of the center point of the defect area , respectively, and denote the length and width of , respectively. The task of insulator defect detection can be defined as finding all defect regions in SR, that is, finding the mapping from SR to . With the development of deep learning, there are a lot of deep learning-based object detection methods which can find the mapping from image to region. However, in the task of insulator defect detection, there are an obvious small object detection problems, that is the Equation (4):
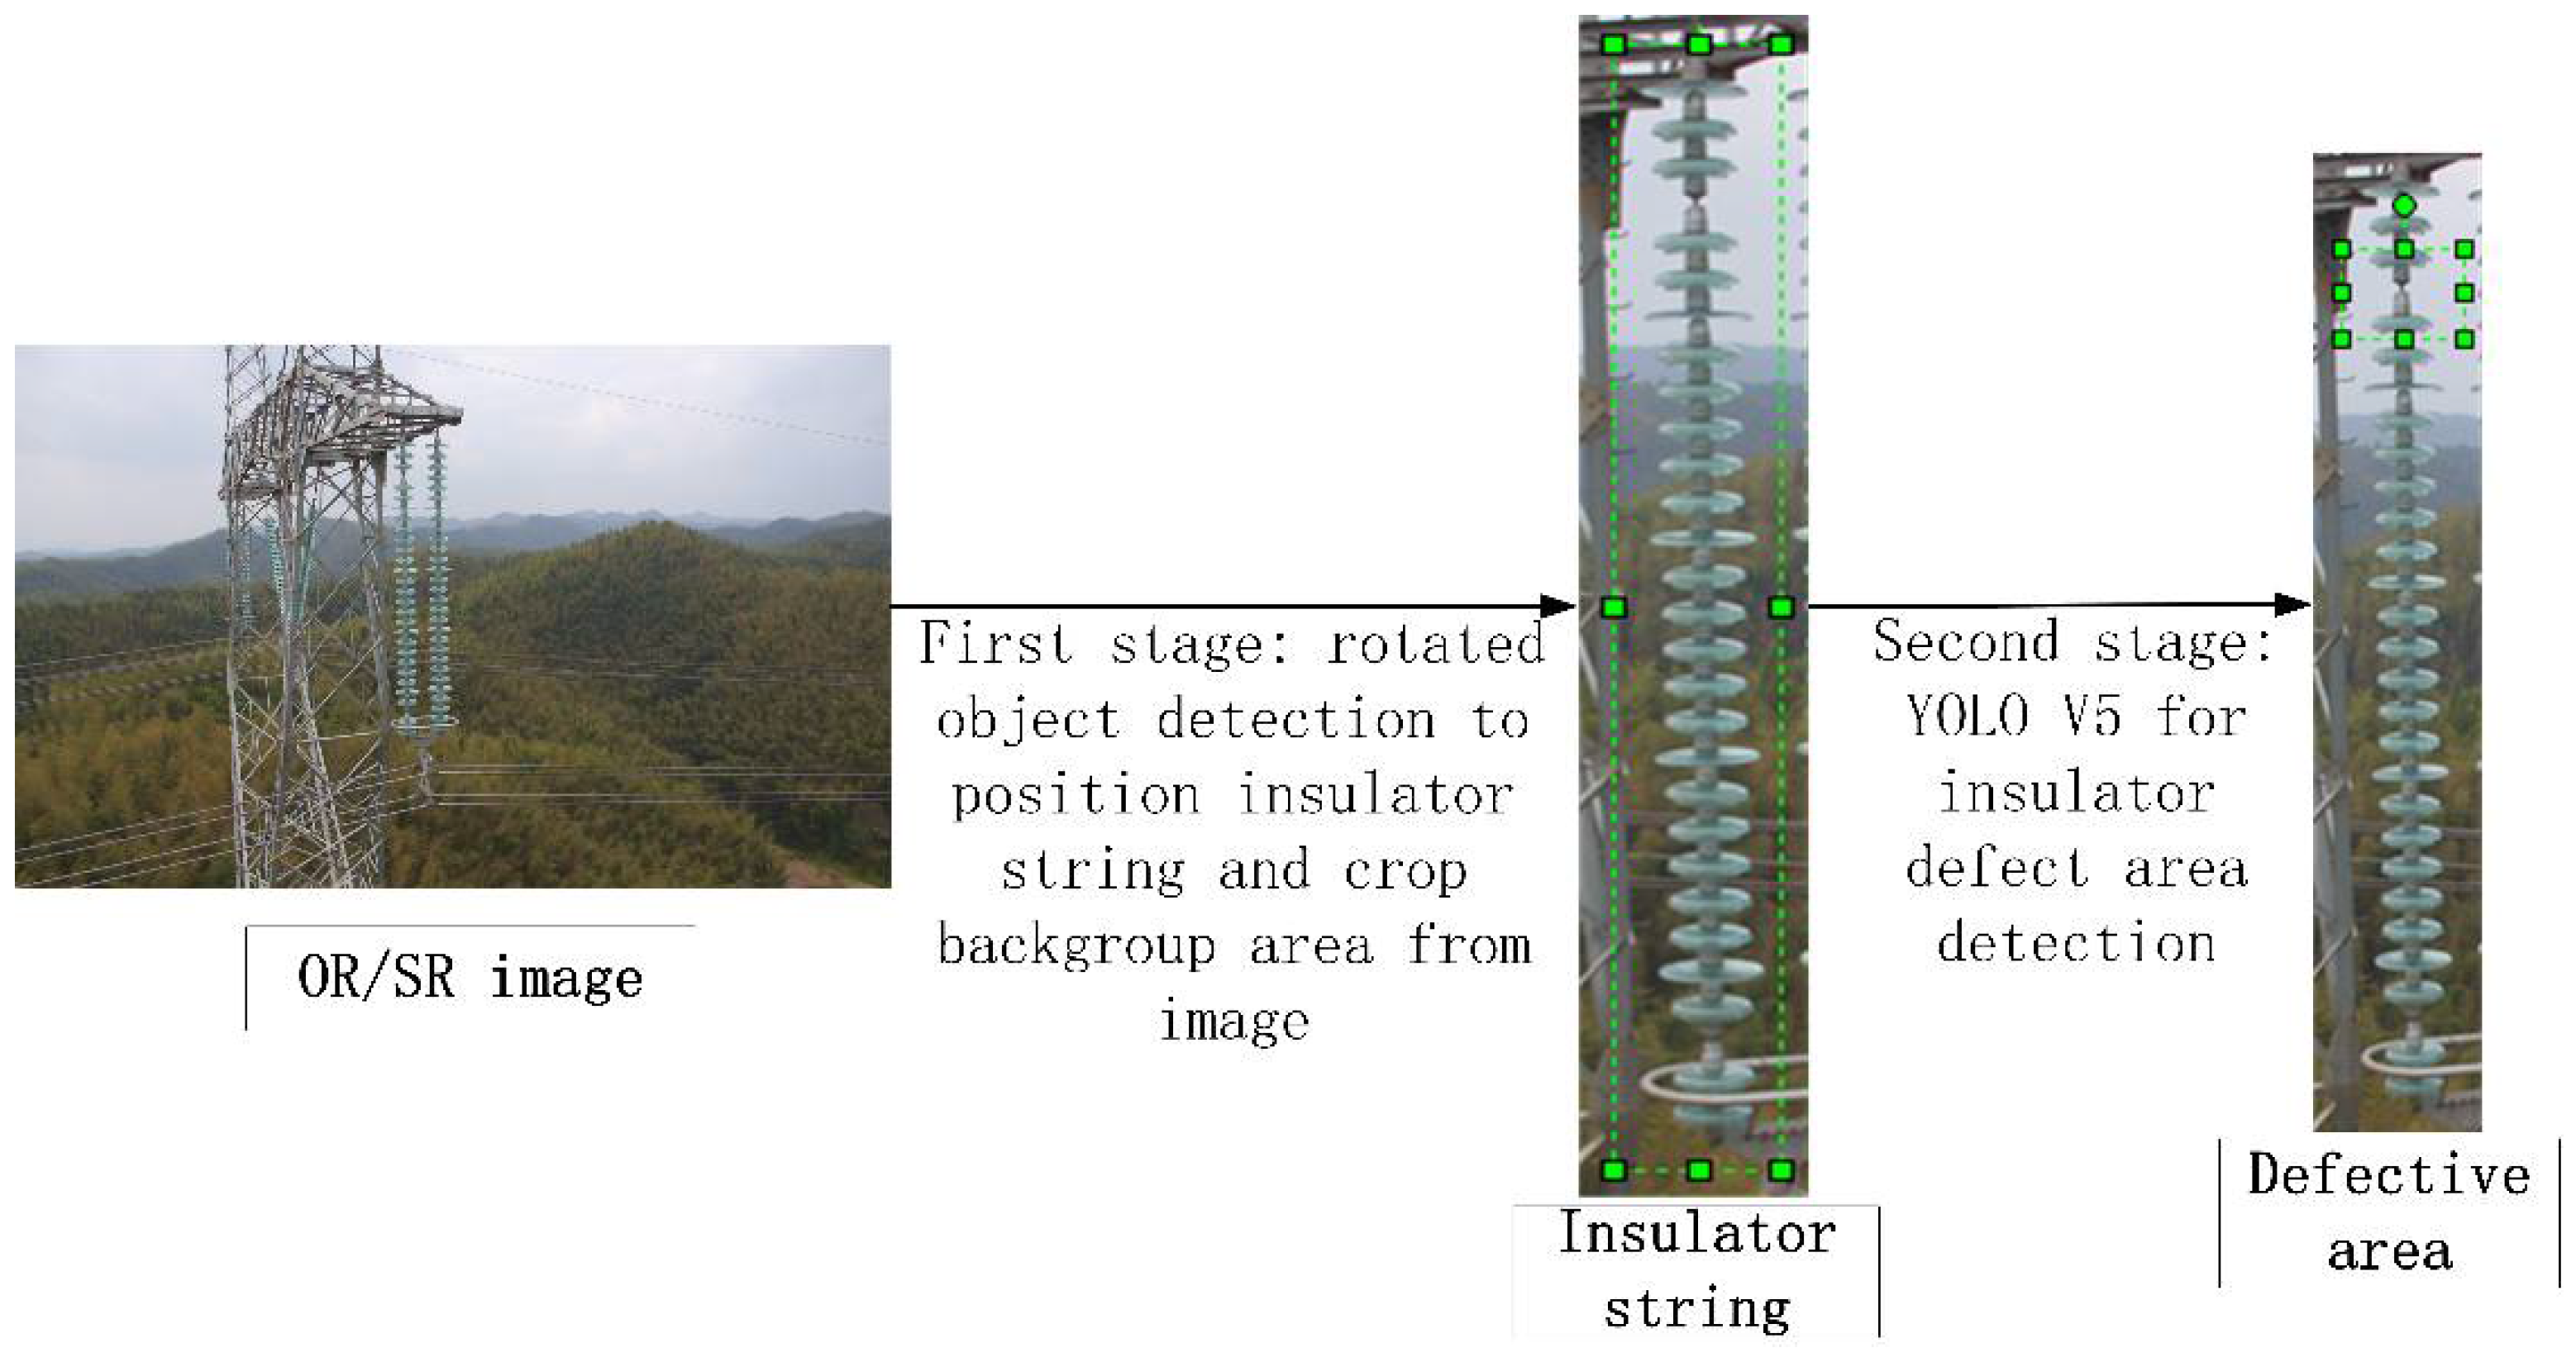
Research has shown that the performance of the object detection algorithm degrades seriously in the case of small object detection. To address this problem, a two-stage cascading framework for insulator defect detection based on rotating object detection is proposed in this paper, as shown in Figure 8. In this framework, the core idea is to ensure that each stage of the image detection object is a relatively large proportion so that they can effectively reduce the detection difficulty and improve detection performance. The framework is composed of two stages. In the first stage, the KLD algorithm is improved and a rotated object detection algorithm for detecting insulator strings is proposed; the invention can effectively reduce the detection range of defect area to of insulator string with length and width of and , where and . In the second stage, this paper uses YOLO V5 to detect the defect region of the insulator string region . Because of the large proportion of and the obvious characteristics in the second stage, the YOLO V5 algorithm can guarantee excellent detection performance.
Figure 8.
Two-stage cascading architecture for insulator defect detection.
The first stage of the two-stage cascade framework proposed in this paper is the object detection of insulator strings. However, when the insulator string is tilted too far in the image, it is difficult for traditional object detection algorithms to remove a large number of background areas, and it cannot effectively solve the problem of small object detection. In order to solve this problem, a rotating frame object detection method is introduced. By detecting the minimum circumscribed rotation rectangle of the insulator string, as many background areas can be removed and the object proportion in the second stage can be further expanded. The rotating object detection uses deep learning to find the optimal mapping from the image to the rotating detection frame for the input image SR so as to obtain the rotating object detection model. The model can be used in rotating object detection tasks to find rotating object regions in images. In order to avoid the difficulty of training caused by the difference of angle and other coordinate dimensions, this study adopts the idea of KLD algorithm to transform the fitting of rotational frames into the fitting of two-dimensional Gaussian distribution , its transformation relation is as the Equation (5).
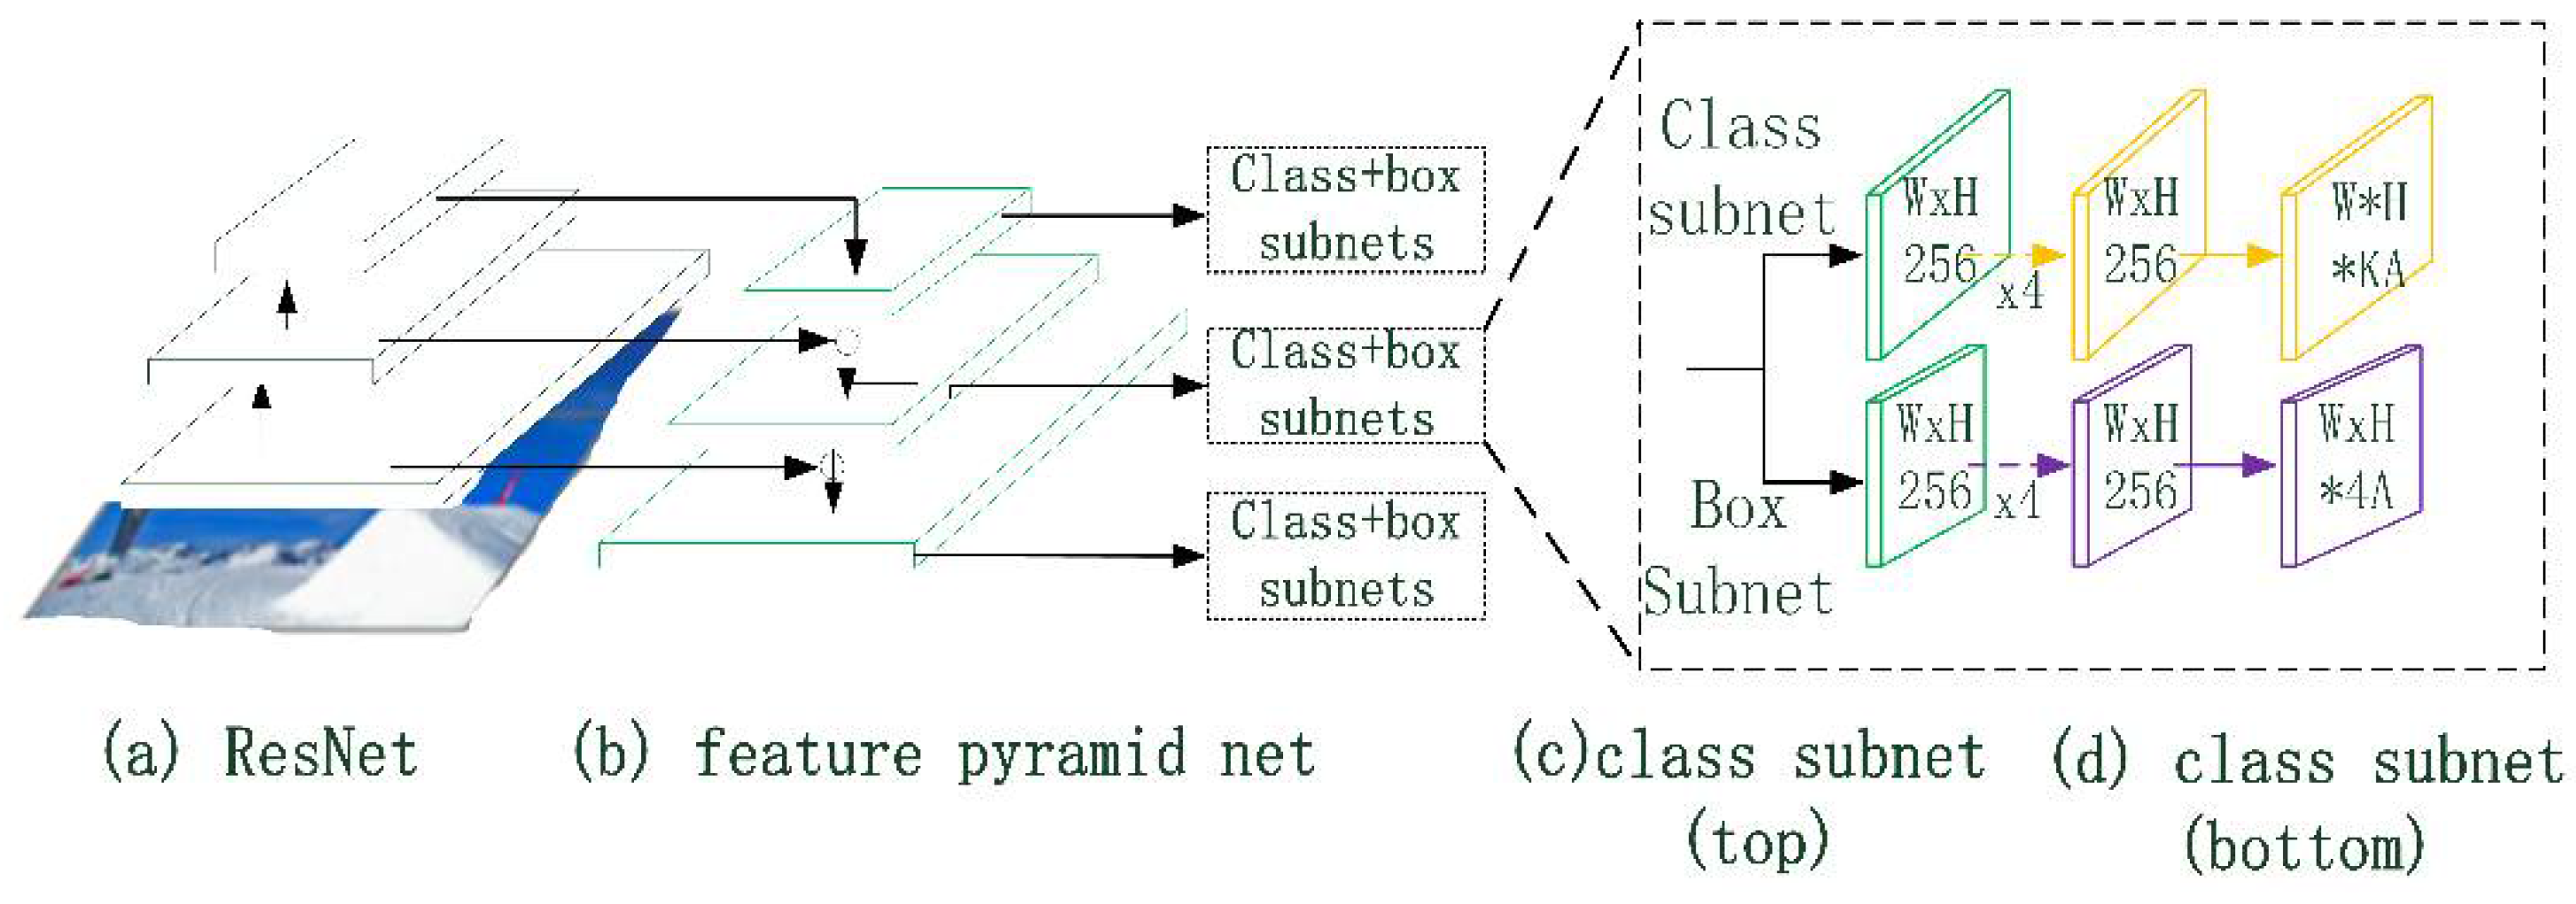
Figure 9 shows the structure of the rotating object detection model, which is inherited from the classical object detection model RetinaNet. The model is composed of classical residual neural network (Resnet), Feature Pyramid Net (Feature Pyramid Net), and several classification/box regression subnets. The residual neural network outputs four different sizes of feature maps, , via ResNet. The output base feature map is fused with , and via up-sampling layers stage by stage and the detection results are outputted via classification subnet and box regression subnet respectively. Unlike RetinaNet, in order to effectively fit a two-dimensional Gaussian distribution , the output of the box subnet is transformed from RetinaNet to . The KLD loss function is adopted according to the transformation relation, as shown in Equation (6):
where the subscripts and represent the distribution results predicted by the model and the real distribution, respectively. Compared with the traditional loss, the KLD loss has the chain coupling relation, in which it is easier to take a derivation of the loss function and pay more attention to the optimization of the angle; therefore, it can effectively alleviate the performance degradation caused by the minor difference in angle prediction during rotating object detection. Through training, the rotating object detection model can be obtained in the first stage. The model is representedas . The prediction of the rotation detection generates the bounding box region . In the first stage, the box region of the rotation detection is extracted and is rotated vertically. Images of the insulator string can be cropped from the SR image as the input of the second stage after the first stage.
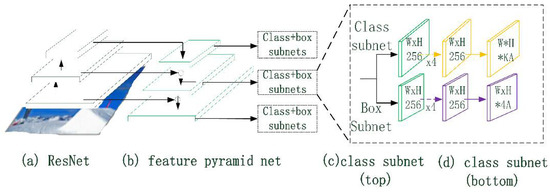
Figure 9.
RetinaNet Network Structure.
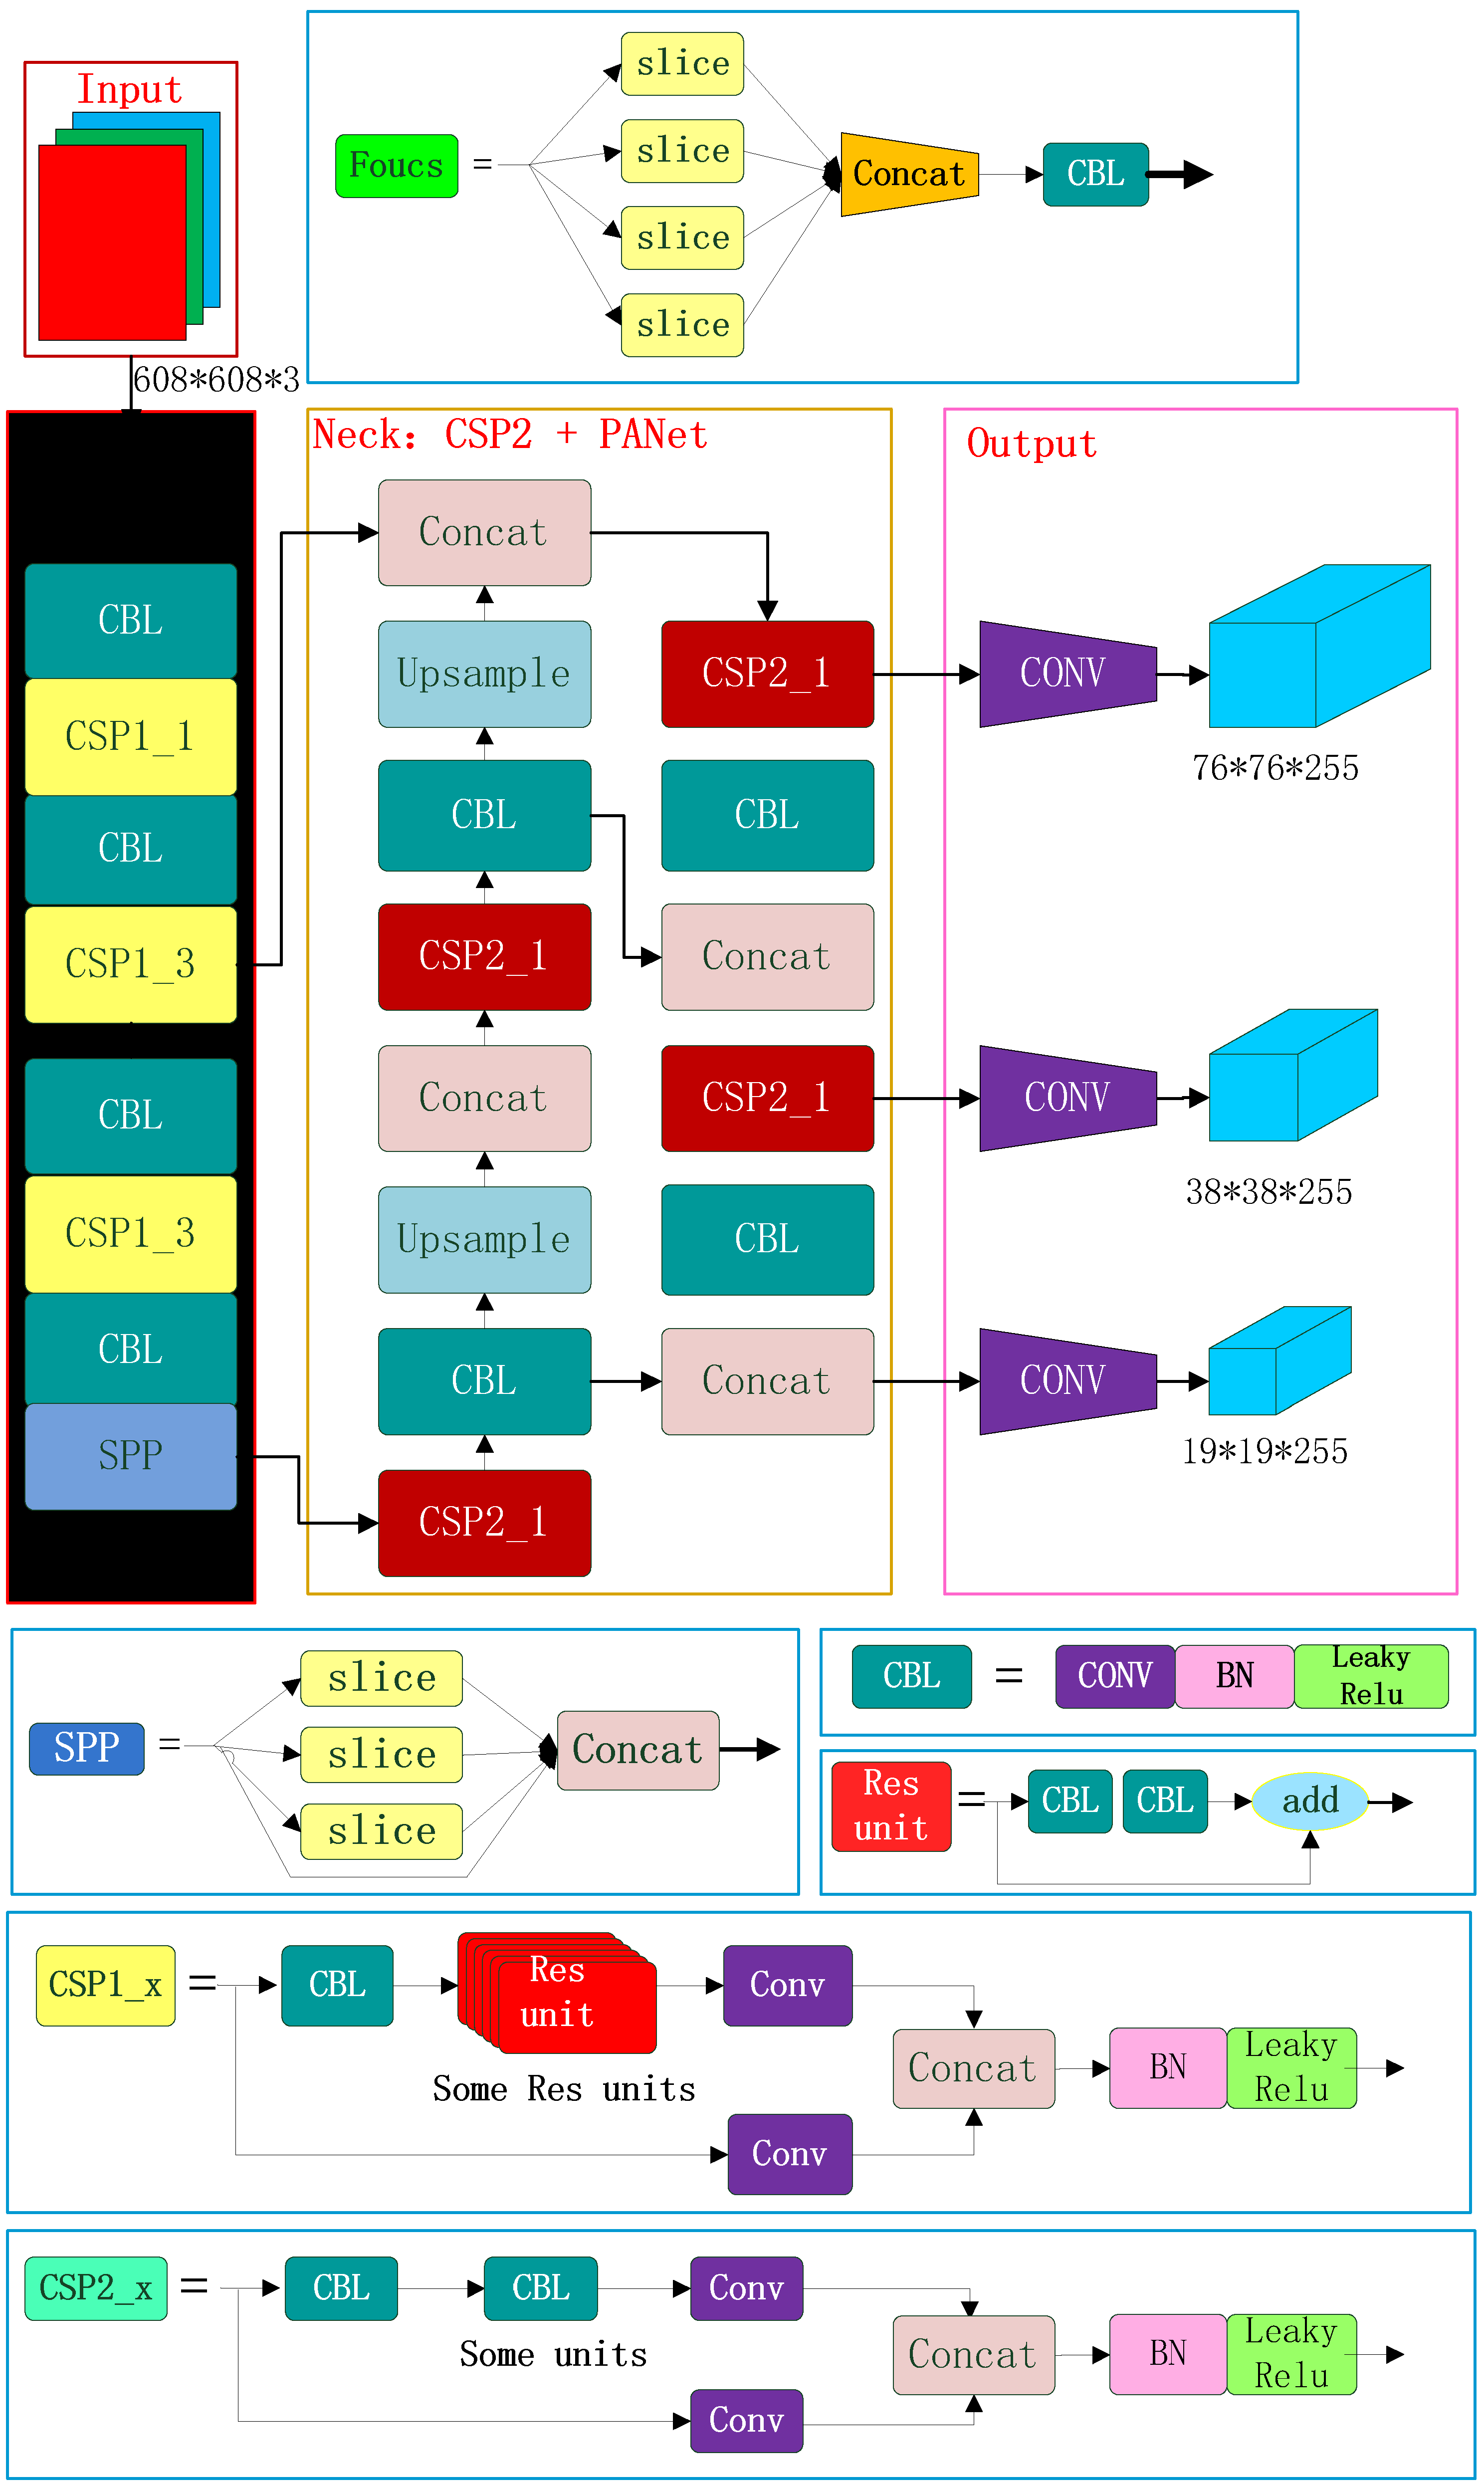
The insulator string is positioned via rotated object detection in SR, and the image of the insulator string is cropped from SR, which is completed in the first stage of the two-stage cascaded framework proposed in this paper. In the second stage, based on the YOLO V5 algorithm, the defect area of is detected. The structure of the defect area detection algorithm is shown in Figure 10.
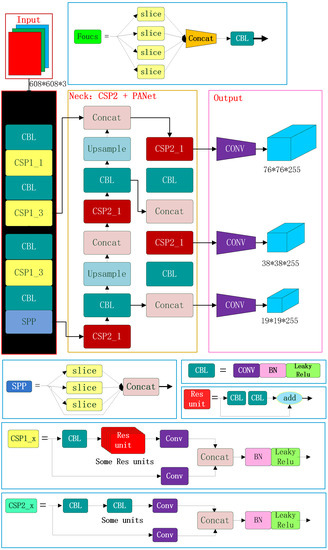
Figure 10.
YOLO V5 Structure.
The input of the defective area detection algorithm adopts the Mosaic data augmentation method. Random operations such as flipping, scaling, and color transformation are performed on pictures each time when they are read so as to enrich the detected background area and to enhance network robustness. Data augmentation is shown in the Equation (7):
where represents the images augmented by the Mosaic method, represents the th image augment method, represents th insulator string image. Furthermore, the anchor box in the algorithm is adaptively generated using the k-means clustering algorithm at the input of the defective area detection algorithm. Then, the images are scaled to a uniform size and sent to the detection network.
In the structure design of insulator defect detection, Focus structure and CSP1 structure are used as the Backbone network, and CSP2 structure and PAN structure are used as the Neck network. The Focus net structure mainly uses slice operation. The Focus structure mainly adopts the slicing operation. The image of is sliced into , and then the feature map of is formed through the convolution operation of a group of 32 convolution kernels. YOLOv5 draws on the design ideas of CSPNet and designs the CSP structure in the network. Two CSP structures are designed in YOLOv5. The CSP1_X structure is used in the Backbone network, and the other CSP2_X structure is used in the Neck. CSP1 includes two branches, one of which is composed of CBL structure, residual components, and convolutional layers, while the other is a branch that only includes convolutional neural networks. The two branches are cascaded first, and then the deep feature map is obtained through L function operation and CBL structure operation. The CSP2_X structure, similar to the CSP1_X structure, also contains two branches. However, the residual components of the first branch in the CSP2_X structure are replaced with two times the number of CBL. The CSP structure introduced in YOLO V5 can effectively strengthen the network feature extraction and fusion capabilities to achieve better performance. In addition, the PAN structure is derived from the idea of PANet in the field of object segmentation. Two feature maps of the same size are fused via cascade operation so as to achieve the purpose of multi-scale fusion.
The output layer of the defect area detection algorithm is mainly used to predict image features, create bounding boxes, and predict object categories. It consists of convolutional layers. When calculating the loss at the output layer, the defect area detection algorithm model uses CIOU_Loss as the loss function for object positioning. The CIOU_Loss loss function is as follows:
where IoU represents the overlap rate between the predicted bounding box and the true bounding box :
where Distance_2 represents the Euclidean distance between the defect position of the insulator and the center point of the real defect position of the insulator. represents the diagonal distance of the real object position . v is a parameter to measure the consistency of aspect ratio; the formula is as follows:
where and represent the length and width of and and represent the length and width of . In addition, the defect area detection algorithm uses weighted Non-Max Suppression (NMS) to suppress the maximum value in the output layer to remove duplicate detection areas. According to the defect area detection algorithm at the second stage, the insulator defect area detection model can be constructed. The model constructs the mapping from the insulator string region image generated by rotating object detection to the insulator defect region , that is, . During prediction, the input image can directly output all insulator defect regions in the image through the model.
To summarize, the task of insulator defect detection aims to the finding optimal solution of mapping from image OR and SR to insulator defect area. Aiming at the small object problem in this task, this paper proposes the two-stage cascading structure of a defect detection insulator, which can decouple the original complex problem of into two simple optimization problems of and . This method can avoid the problem of small object detection and improve insulator defect detection rate.
4. Experimental Results
4.1. Metric
In this paper, mAP (mean Average Precision) is used as the evaluation metric, that is, the average value of Precision under different Recall values is calculated according to the PR curve. Since the model only needs to detect one defect class, mAP is equivalent to AP.
The accuracy rate represents the proportion of positive examples in the examples divided into positive examples, and the calculation formula is:
where represents True Position, represents False Position.
Recall rate is a measure of coverage. Multiple positive examples of the metric are divided into positive examples. The calculation formula is:
where represents False Negative.
4.2. Few-Shot Dataset
First, 85 images of defective insulators with a resolution of 1024 × 768 were captured by using UAV inspection. Then, according to 3.1, each image was down sampled with a 4x down sampling factor, and then LR images were reconstructed with SRGAN. The new SR image is mixed with the original aerial image as a new data set for the experiment. The final data set consists of three parts. The first part is the original image, the second part is an HR (high-resolution) image, which is obtained via bicubic interpolation from an LR (low-resolution) image, and the third part is a SR (super-resolution) image, which is generated via SRGAN. Then, the traditional data enhancement method is used for the images in the training set. Each image is flipped horizontally, cropped randomly, and translated randomly. After the traditional data augmentation, the data set has been further expanded.
4.3. Experimental Details and Results of SRGAN
In the training phase, a warmup is used to update the learning rate. The learning rate increases linearly from a small value until the specified epoch and then decreases linearly. This experiment set the initial learning rate from 10–4 and the end learning rate from 10–6. The first training stage, which increases the learning rate, continues 50 epochs, and the second training stage continues 100 epochs. We set the training batch size from 2 because the image resolution (1024 × 768) is large compared to the memory of our GPUs (Nvidia 2080ti). For a mini-batch size, the warmup updating strategy reduces the model overfitting of mini-batch images in the initial stage of training and keeps a stable distribution through all convolutional layers.
In order to prove the effectiveness of the SR data enhancement method alone, three groups of experiments are designed in this study. The YOLO V5 algorithm implemented with PyTorch is used in the three groups of experiments to detect the insulator defect area in single-stage, which is also prepared for comparing the effects of single-stage defect detection and two-stage defect detection. The results are shown in Table 1. The training set AUG_1 contains 80 original images, and the traditional data augmentation method (horizontally flipped, randomly cropped, and randomly translated) is used on every image. The trained model is overfitting, and the AP on the test set is only 0.291. The training set NOAUG_3 contains original images, HR images, which are directly resized from low-resolution images via bicubic interpolation, and the SR images, which are reconstructed from low-resolution images via SRGAN. The trained model without any traditional data augmentation has 0.52 AP. The final training set AUG_3 performs traditional data augmentation on each image based on NOAUG_3. The AP on AUG_3 is 9% higher than NOAUG_3.

Table 1.
Comparison of different data augmentation strategies (AUG_3, NOAUG_3, AUG_1).
4.4. Experimental Details and Results of Two-Stage Cascading Architecture for Insulator Defect Detection
Because the algorithm proposed in this paper is a two-stage algorithm, this study carries out two-level object labeling on the data set, in which the first level object labeling marks the position of the insulator string in the image, and the second level object labeling marks the position of defective insulators in the image.
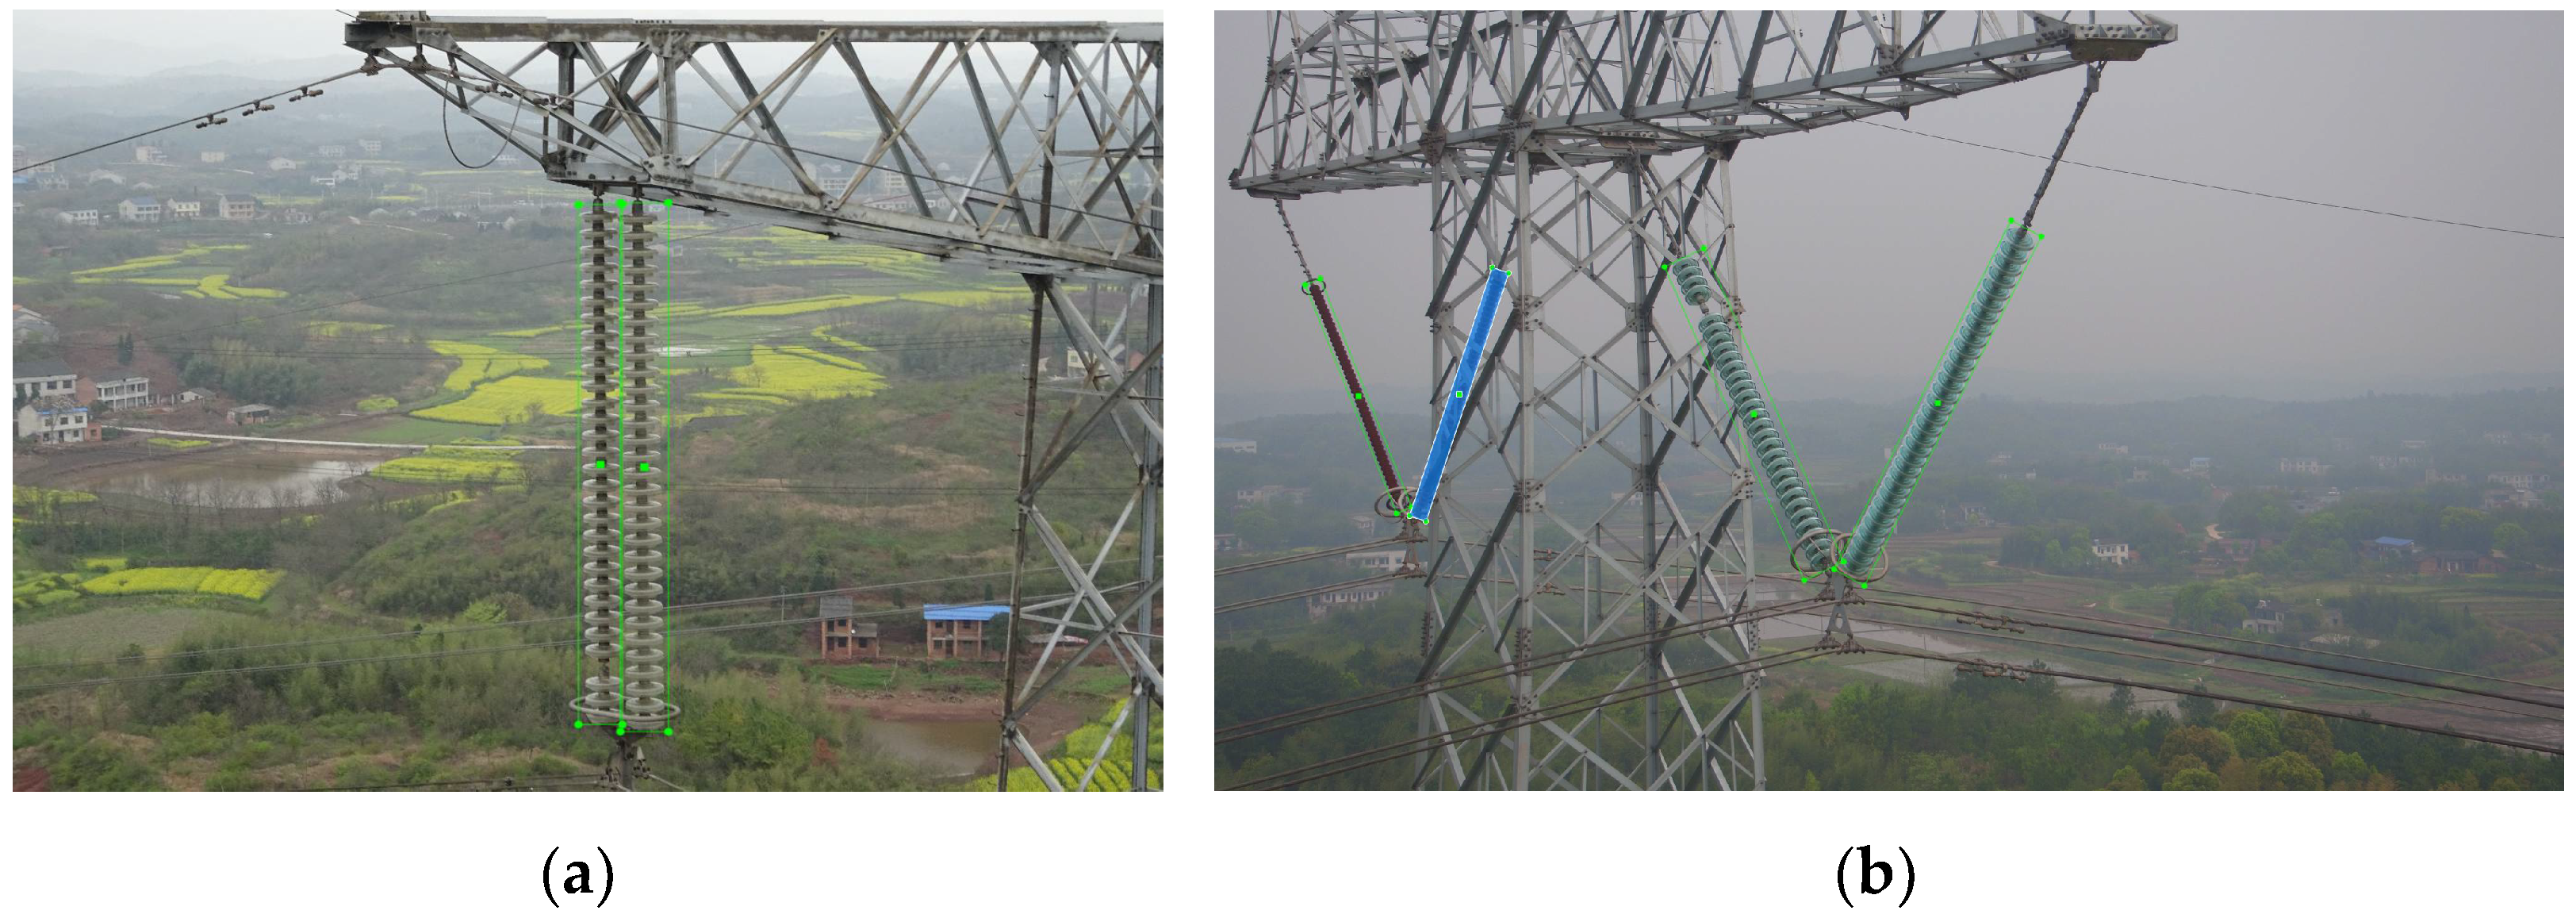
In order to compare the effect difference, this paper adopts the horizontal object detection and rotated object detection methods in the experimental process. Therefore, in the primary object labeling, objects are going to be labelled twice, with a rectangular box and a rotating box, respectively, as shown in Figure 11.
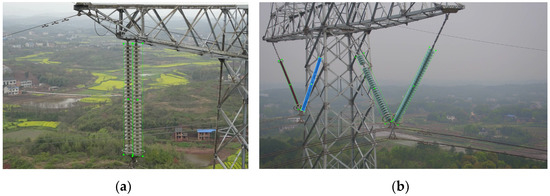
Figure 11.
Object labeling of insulator strings: (a) rectangular box labeling; (b) rotating box labeling.
Accordingly, in the secondary annotation, the prediction results of object detection and rotated object detection are annotated twice, as shown in Figure 12.
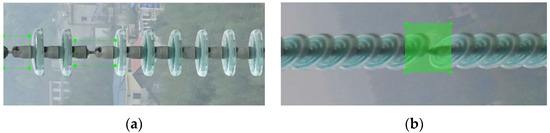
Figure 12.
Object labeling of insulator defective area: (a) Horizontal object detection result labeling; (b) Rotated object detection result labeling.
As can be seen in Table 2, in the first stage, the accuracy of the rotated object detection-based KLD algorithm is basically the same as that of the horizontal detection algorithm, and the improvement is not obvious. However, in the second stage, the recognition accuracy of the image cut by the rotating object frame is 10.4% higher than that of the rectangular frame cut image. It can be seen that the proportion of the background area is reduced, which can effectively improve the inspection accuracy of the system. In addition, comparing the results in Table 1 and Table 2, it can be seen that the AP value of the two-stage detection method proposed in this paper is increased by 12% compared with the single-stage scheme of direct defect area detection on the same data set.
Table 2.
Comparison of two-stage cascading architecture insulator defect detection results.
5. Conclusions
Considering the scarcity of defective insulator samples, SRGAN is used to augment the dataset and enrich the training samples. Combined with HR and SR images, it effectively solves the serious overfitting problem caused by insufficient data during training. Using the augmented dataset of SRGAN in the single-stage detection algorithm based on YOLO V5 achieves the expected results. A total of 32% AP improvement was achieved compared to the dataset without data augmentation, and 9% AP improvement was achieved compared to the dataset augmented with traditional methods. Meanwhile, SRGAN also can enrich the image texture features and pixel values of defect areas. In view of the small object problem in the detection of insulator defects in aerial photographs taken by unmanned aerial vehicles (UAVs), combined with the characteristics of a large aspect ratio of insulator strings, a two-stage cascade structure for insulator defect detection is proposed in this paper. In the first stage, the rotation detection algorithm is used to reduce the interference of the background area, and in the second stage, an insulator defect detection algorithm based on YOLO V5 is proposed. The experimental results show that the proposed structure and algorithm have achieved a 12% AP improvement compared to the single-stage target detection algorithm, which can be applied to practical industrial detection.
Author Contributions
Conceptualization, L.P. and L.C.; methodology, L.P.; software, L.P.; validation, L.P., and W.T.; formal analysis, L.P.; investigation, L.P. and S.Z.; resources, L.P., L.C. and S.Z.; data curation, L.P., W.T. and L.G.; writing—original draft preparation, L.P.; writing—review and editing, L.P.; visualization, L.P. and L.G.; supervision, L.C.; project administration, L.C. and L.P.; funding acquisition, L.C. All authors have read and agreed to the published version of the manuscript.
Funding
This was support by National Key R&D Program of China: 2019YFB2102400.
Institutional Review Board Statement
Not applicable.
Informed Consent Statement
Not applicable.
Data Availability Statement
Not applicable.
Conflicts of Interest
The authors declare no conflict of interest.
References
- Park, K.-C.; Motai, Y.; Yoon, J.R. Acoustic fault detection technique for high-power insulators. IEEE Trans. Ind. Electron. 2017, 64, 9699–9708. [Google Scholar] [CrossRef]
- Zhai, Y.; Wang, D.; Zhang, M.; Wang, J.; Guo, F. Fault detection of insulator based on saliency and adaptive morphology. Multimed. Tools Appl. 2017, 76, 12051–12064. [Google Scholar] [CrossRef]
- Zhao, H.; Dai, R.; Xiao, C. A machine vision system for stacked substrates counting with a robust stripe detection algorithm. IEEE Trans. Syst. Man Cybern. Syst. 2017, 49, 2352–2361. [Google Scholar] [CrossRef]
- Huang, Y.P.; Sithole, L.; Lee, T.-T. Structure from motion technique for scene detection using autonomous drone navigation. IEEE Trans. Syst. Man Cybern. Syst. 2017, 49, 2559–2570. [Google Scholar] [CrossRef]
- Aytekin, Ç.; Rezaeitabar, Y.; Dogru, S.; Ulusoy, L. Railway fastener inspection by real-time machine vision. IEEE Trans. Syst. Man Cybern. Syst. 2015, 45, 1101–1107. [Google Scholar] [CrossRef]
- Deng, C.; Tian, W.; Wang, S.; Zhu, H.S.; Wu, Z.M.; Xiong, Z.W.; Zhong, W. Super-resolution reconstruction of approximate sparsity regularized infrared images. Opt. Precis. Eng. 2014, 22, 1648–1654. [Google Scholar] [CrossRef]
- Peng, Z.H.; Jing, L.; He, Y.M.; Ping, Z. Super-resolution fusion of multi-focus image based on multi-scale sparse dictionary. Opt. Precis. Eng. 2014, 22, 169–176. [Google Scholar] [CrossRef]
- Park, S.C.; Park, M.K.; Kang, M.G. Super resolution image reconstruction: A technical review. IEEE Signal Process. Mag. 2003, 20, 21–35. [Google Scholar] [CrossRef]
- Aftab, H.; Mansoor, A.B.; Asim, M.A. New Single Image Interpolation Technique For Super Resolution. In Proceedings of the IEEE International Multitopic, Karachi, Pakistan, 23–24 December 2008; pp. 592–596. [Google Scholar]
- Hou, H.S.; Andrews, H.C. Cubic spline for image interpolation and digital filtering. IEEE Trans. Signal Process. 1978, 6, 508–517. [Google Scholar]
- Chang, H.; Yeung, D.Y.; Xiong, Y. Super-resolution through neighbor embedding. In Proceedings of the 2004 IEEE Computer Society Conference on Computer Vision and Pattern Recognition, CVPR, Washington, DC, USA, 27 June–2 July 2004; Volume 1, p. I. [Google Scholar]
- Yang, J.; Wright, J.; Huang, T.; Ma, Y. Image Super-Resojution As Sparse Representation Of Raw Image Patches. In Proceedings of the IEEE Computer Society Conference On Computer Vision And Pattern Recognition, Anchorage, AK, USA, 23–28 June 2008; pp. 1–8. [Google Scholar]
- He, H.; Ch, S.W. Single Image Super—Resolution using Gaussian process regression. In Proceedings of the IEEE Computer Society Conference On Computer Vision And Pattern Recognition, Colorado Springs, CO, USA, 20–25 June 2011; pp. 449–456. [Google Scholar]
- Dong, C.; Loy, C.C.; He, K.; Tang, X. Learning a deep convolutional network for image super-resolution. In Proceedings of the European Conference on Computer Vision (ECCV), Zurich, Switzerland, 5–12 September 2014; Springer: Cham, Switzerland, 2014; pp. 184–199. [Google Scholar]
- Dong, C.; Loy, C.C.; He, K.; Tang, X. Image super-resolution using deep convolutional networks. IEEE Trans. Pattern Anal. Mach. Intell. 2016, 38, 295–307. [Google Scholar] [CrossRef] [PubMed]
- Kim, J.; Lee, J.K.; Lee, K.M. Accurate image super-resolution using very deep convolutional networks. In Proceedings of the IEEE Conference on Computer Vision and Pattern Recognition, Las Vegas, NV, USA, 27–30 June 2016; pp. 1646–1654. [Google Scholar]
- Ronneberger, O.; Fischer, P.; Brox, T. U-net: Convolutional networks for biomedical image segmentation. In Proceedings of the 18th International Conference on Medical Image Computing and Computer-Assisted Intervention, Munich, Germany, 5–9 October 2015; pp. 234–241. [Google Scholar]
- Kampffmeyer, M.; Salberg, A.B.; Jenssen, R. Semantic segmentation of small objects and modeling of uncertainty in urban remote sensing images using deep convolutional neural networks. In Proceedings of the 2016 IEEE Conference on Computer Vision and Pattern Recognition Workshops, Las Vegas, NV, USA, 27–30 June 2016; pp. 680–688. [Google Scholar]
- Girshick, R.; Donahue, J.; Darrell, T.; Malik, J. Rich Feature Hierarchies for Accurate Object Detection and Semantic Segmentation. In Proceedings of the 27th IEEE Conference on Computer Vision and Pattern Recognition (CVPR), Columbus, OH, USA, 23–28 June 2014; pp. 580–587. [Google Scholar]
- Girshick, R. Fast R-CNN. In Proceedings of the IEEE International Conference on Computer Vision (ICCV), Santiago, Chile, 7–13 December 2015; pp. 1440–1448. [Google Scholar]
- Ren, S.; He, K.; Girshick, R.; Sun, J. Faster R-CNN: Towards Real-Time Object Detection with Region Proposal Networks. IEEE Trans. Pattern Anal. Mach. Intell. 2017, 39, 1137–1149. [Google Scholar] [CrossRef] [PubMed]
- Redmon, J.; Divvala, S.; Girshick, R.; Farhadi, A. You only look once: Unified, real-time object detection. In Proceedings of the IEEE Conference on Computer Vision and Pattern Recognition, Las Vegas, NV, USA, 26 June–1 July 2016; pp. 779–788. [Google Scholar]
- Liu, W.; Anguelov, D.; Erhan, D.; Szegedy, C.; Reed, S.; Fu, C.Y.; Berg, A. CSSD: Single shot multibox detector. In Proceedings of the European Conference on Computer Vision, Amsterdam, The Netherlands, 8–16 October 2016; Springer: Cham, Switzerland, 2016; pp. 21–37. [Google Scholar]
- Ma, J.; Shao, W.; Ye, H.; Wang, L.; Wang, H.; Zheng, Y.; Xue, X. Arbitrary-oriented scene text detection via rotation proposals. IEEE Trans. Multimed. 2018, 20, 3111–3122. [Google Scholar] [CrossRef]
- Azimi, S.M.; Vig, E.; Bahmanyar, R.; Körner, M.; Reinartz, P. Towards multi-class object detection in unconstrained remote sensing imagery. In Proceedings of the Asian Conference on Computer Vision, Perth, Australia, 2–6 December 2018; Springer: Cham, Switzerland, 2018; pp. 150–165. [Google Scholar]
- Ding, J.; Xue, N.; Long, Y.; Xia, G.S.; Lu, Q. Learning roi transformer for oriented object detection in aerial images. In Proceedings of the IEEE/CVF Conference on Computer Vision and Pattern Recognition, Long Beach, CA, USA, 15–20 June 2019; pp. 2849–2858. [Google Scholar]
- Yang, X.; Yang, J.; Yan, J.; Zhang, Y.; Zhang, T.; Guo, Z. Towards more robust detection for small, cluttered and rotated objects. In Proceedings of the IEEE International Conference on Computer Vision, Seoul, Korea, 27–28 October 2019; Volume 27, pp. 8232–8241. [Google Scholar]
- Yang, X.; Yan, J.; Ming, Q.; Wang, W.; Zhang, X.; Tian, Q. Rethinking rotated object detection with gaussian wasserstein distance loss. In Proceedings of the International Conference on Machine Learning, Virtual, 18–24 July 2021; pp. 11830–11841. [Google Scholar]
- Yang, X.; Yang, X.; Yang, J.; Ming, Q.; Wang, W.; Tian, Q.; Yan, J. Learning High-Precision Bounding Box for Rotated Object Detection via Kullback-Leibler Divergence. arXiv 2021, arXiv:2106.01883. [Google Scholar]
- Liao, S.L. Research on Key Technologies of Component Detection in Aerial Transmission Line Images. Master’s Thesis, Dalian Maritime University, Dalian, China, 2017. [Google Scholar]
- Wang, W.; Wang, Y.; Han, J.; Liu, Y. Recognition and drop-off detection of insulator based on aerial image. In Proceedings of the 2016 9th international symposium on computational intelligence and design (ISCID), Hangzhou, China, 10–11 December 2016; IEEE: New York, NY, USA, 2016; pp. 162–167. [Google Scholar]
- Qing, C.; Bin, Y.; Run, Y. Research on Convolutional Neural Network Detection and Self-Explosion Recognition of Aerial Insulators. J. Electron. Meas. Instrum. 2017, 2017, 942–943. [Google Scholar]
- Miao, X.; Liu, X.; Chen, J.; Zhuang, S.; Fan, J.; Jiang, H. Insulator detection in aerial images for transmission line inspection using single shot multibox detector. IEEE Access 2019, 7, 9945–9956. [Google Scholar] [CrossRef]
- Tao, X.; Zhang, D.; Wang, Z.; Liu, X.; Zhang, H.; Xu, D. Detection of power line insulator defects using aerial images analyzed with convolutional neural networks. IEEE Trans. Syst. Man Cybern. Syst. 2018, 50, 1486–1498. [Google Scholar] [CrossRef]
- Everingham, M.; Van, G.L.; Williams, C.K.; Winn, J.; Zisserman, A. The Pascal Visual Object Classes (VOC) Challenge. Int. J. Comput. Vis. 2010, 88, 303–338. [Google Scholar] [CrossRef]
- Bochkovskiy, A.; Wang, C.Y.; Liao, H.Y.M. YOLO v4: Optimal speed and accuracy of object detection. arXiv 2020, arXiv:2004.10934. [Google Scholar]
- Liu, Y.; Lu, B.H.; Peng, J.; Zhang, Z. Research on the use of YOLOv5 object detection algorithm in mask wearing recognition. World Sci. Res. J. 2020, 6, 276–284. [Google Scholar]
- Ledig, C.; Theis, L.; Huszár, F.; Caballero, J.; Cunningham, A.; Acosta, A.; Aitken, A.; Tejani, A.; Totz, J.; Wang, Z.; et al. PhotoPhoto-realistic single image super-resolution using a generative adversarial network. In Proceedings of the IEEE Conference on Computer Vision and Pattern Recognition, Honolulu, HI, USA, 21–26 July 2017; pp. 4681–4690. [Google Scholar]
- Anwar, S.; Khan, S.; Barnes, N. A deep journey into super-resolution: A survey. ACM Comput. Surv. 2020, 53, 1–34. [Google Scholar] [CrossRef]


Publisher’s Note: MDPI stays neutral with regard to jurisdictional claims in published maps and institutional affiliations. |
© 2022 by the authors. Licensee MDPI, Basel, Switzerland. This article is an open access article distributed under the terms and conditions of the Creative Commons Attribution (CC BY) license (https://creativecommons.org/licenses/by/4.0/).