
Visualizing Social Media Research in the Age of COVID-19


Abstract
:1. Introduction
2. Literature Review
3. Materials and Methods
3.1. Study Design
3.2. Data Collection
3.3. Data Analysis and Visualization
3.4. Interpretation of the Results
4. Results
4.1. Publications and Citations Evolution
4.2. Most Relevant Sources, Countries, and Publications

| Authors | Article Title | Source Title | TC |
|---|---|---|---|
| Gao, J. et al. (2020) [15] | Mental health problems and social media exposure during COVID-19 outbreak | PLOS One | 636 |
| Pennycook, G. et al. (2020) [16] | Fighting COVID-19 Misinformation on social media: Experimental Evidence for a Scalable Accuracy-Nudge Intervention | Psychological Science | 392 |
| Elmer, T. et al. (2020) [17] | Students under lockdown: Comparisons of students’ social networks and mental health before and during the COVID-19 crisis in Switzerland | PLOS One | 332 |
| Cinelli, M. et al. (2020) [19] | The COVID-19 social media infodemic | Scientific Reports | 295 |
| Kouzy, R. et al. (2020) [20] | Coronavirus Goes Viral: Quantifying the COVID-19 Misinformation Epidemic on Twitter | Cureus | 287 |
| Puri, N. et al. (2020) [24] | Social media and vaccine hesitancy: new updates for the era of COVID-19 and globalized infectious diseases | Human Vaccines & Immunotherapeutics | 252 |
| Allington, D. et al. (2021) [21] | Health-protective behavior, social media usage and conspiracy belief during the COVID-19 public health emergency | Psychological Medicine | 251 |
| Ahmed, W. et al. (2020) [22] | COVID-19 and the 5G Conspiracy Theory: Social Network Analysis of Twitter Data | Journal of Medical Internet Research | 211 |
| Islam, M. et al. (2020) [23] | COVID-19–Related Infodemic and Its Impact on Public Health: A Global Social Media Analysis | The American Journal of Tropical Medicine and Hygiene | 211 |
| Ni, M.Y. et al. (2020) [18] | Mental Health, Risk Factors, and Social Media Use During the COVID-19 Epidemic and Cordon Sanitaire Among the Community and Health Professionals in Wuhan, China: Cross-Sectional Survey | JMIR Mental Health | 190 |
| Authors | Article Title | Source Title | TC |
|---|---|---|---|
| Tsao, S.F. (2021) [1] | What social media told us in the time of COVID-19: a scoping review | Lancet | 82 |
| Shani, H.; Sharma, H. (2020) [25] | Role of social media during the COVID-19 pandemic: Beneficial, destructive, or reconstructive? | International Journal of Academic Medicine | 32 |
| Gabarron, E. et al. (2021) [26] | COVID-19-related misinformation on social media: a systematic review | Bull World Health Organization | 19 |
| Venegas-Vera, A.V. et al. (2020) [27] | Positive and negative impact of social media in the COVID-19 era | Reviews in Cardiovascular Medicine | 18 |
| Cavus, N. et al. (2021) [28] | Efficacy of Social Networking Sites for Sustainable Education in the Era of COVID-19: A Systematic Review | Sustainability | 12 |
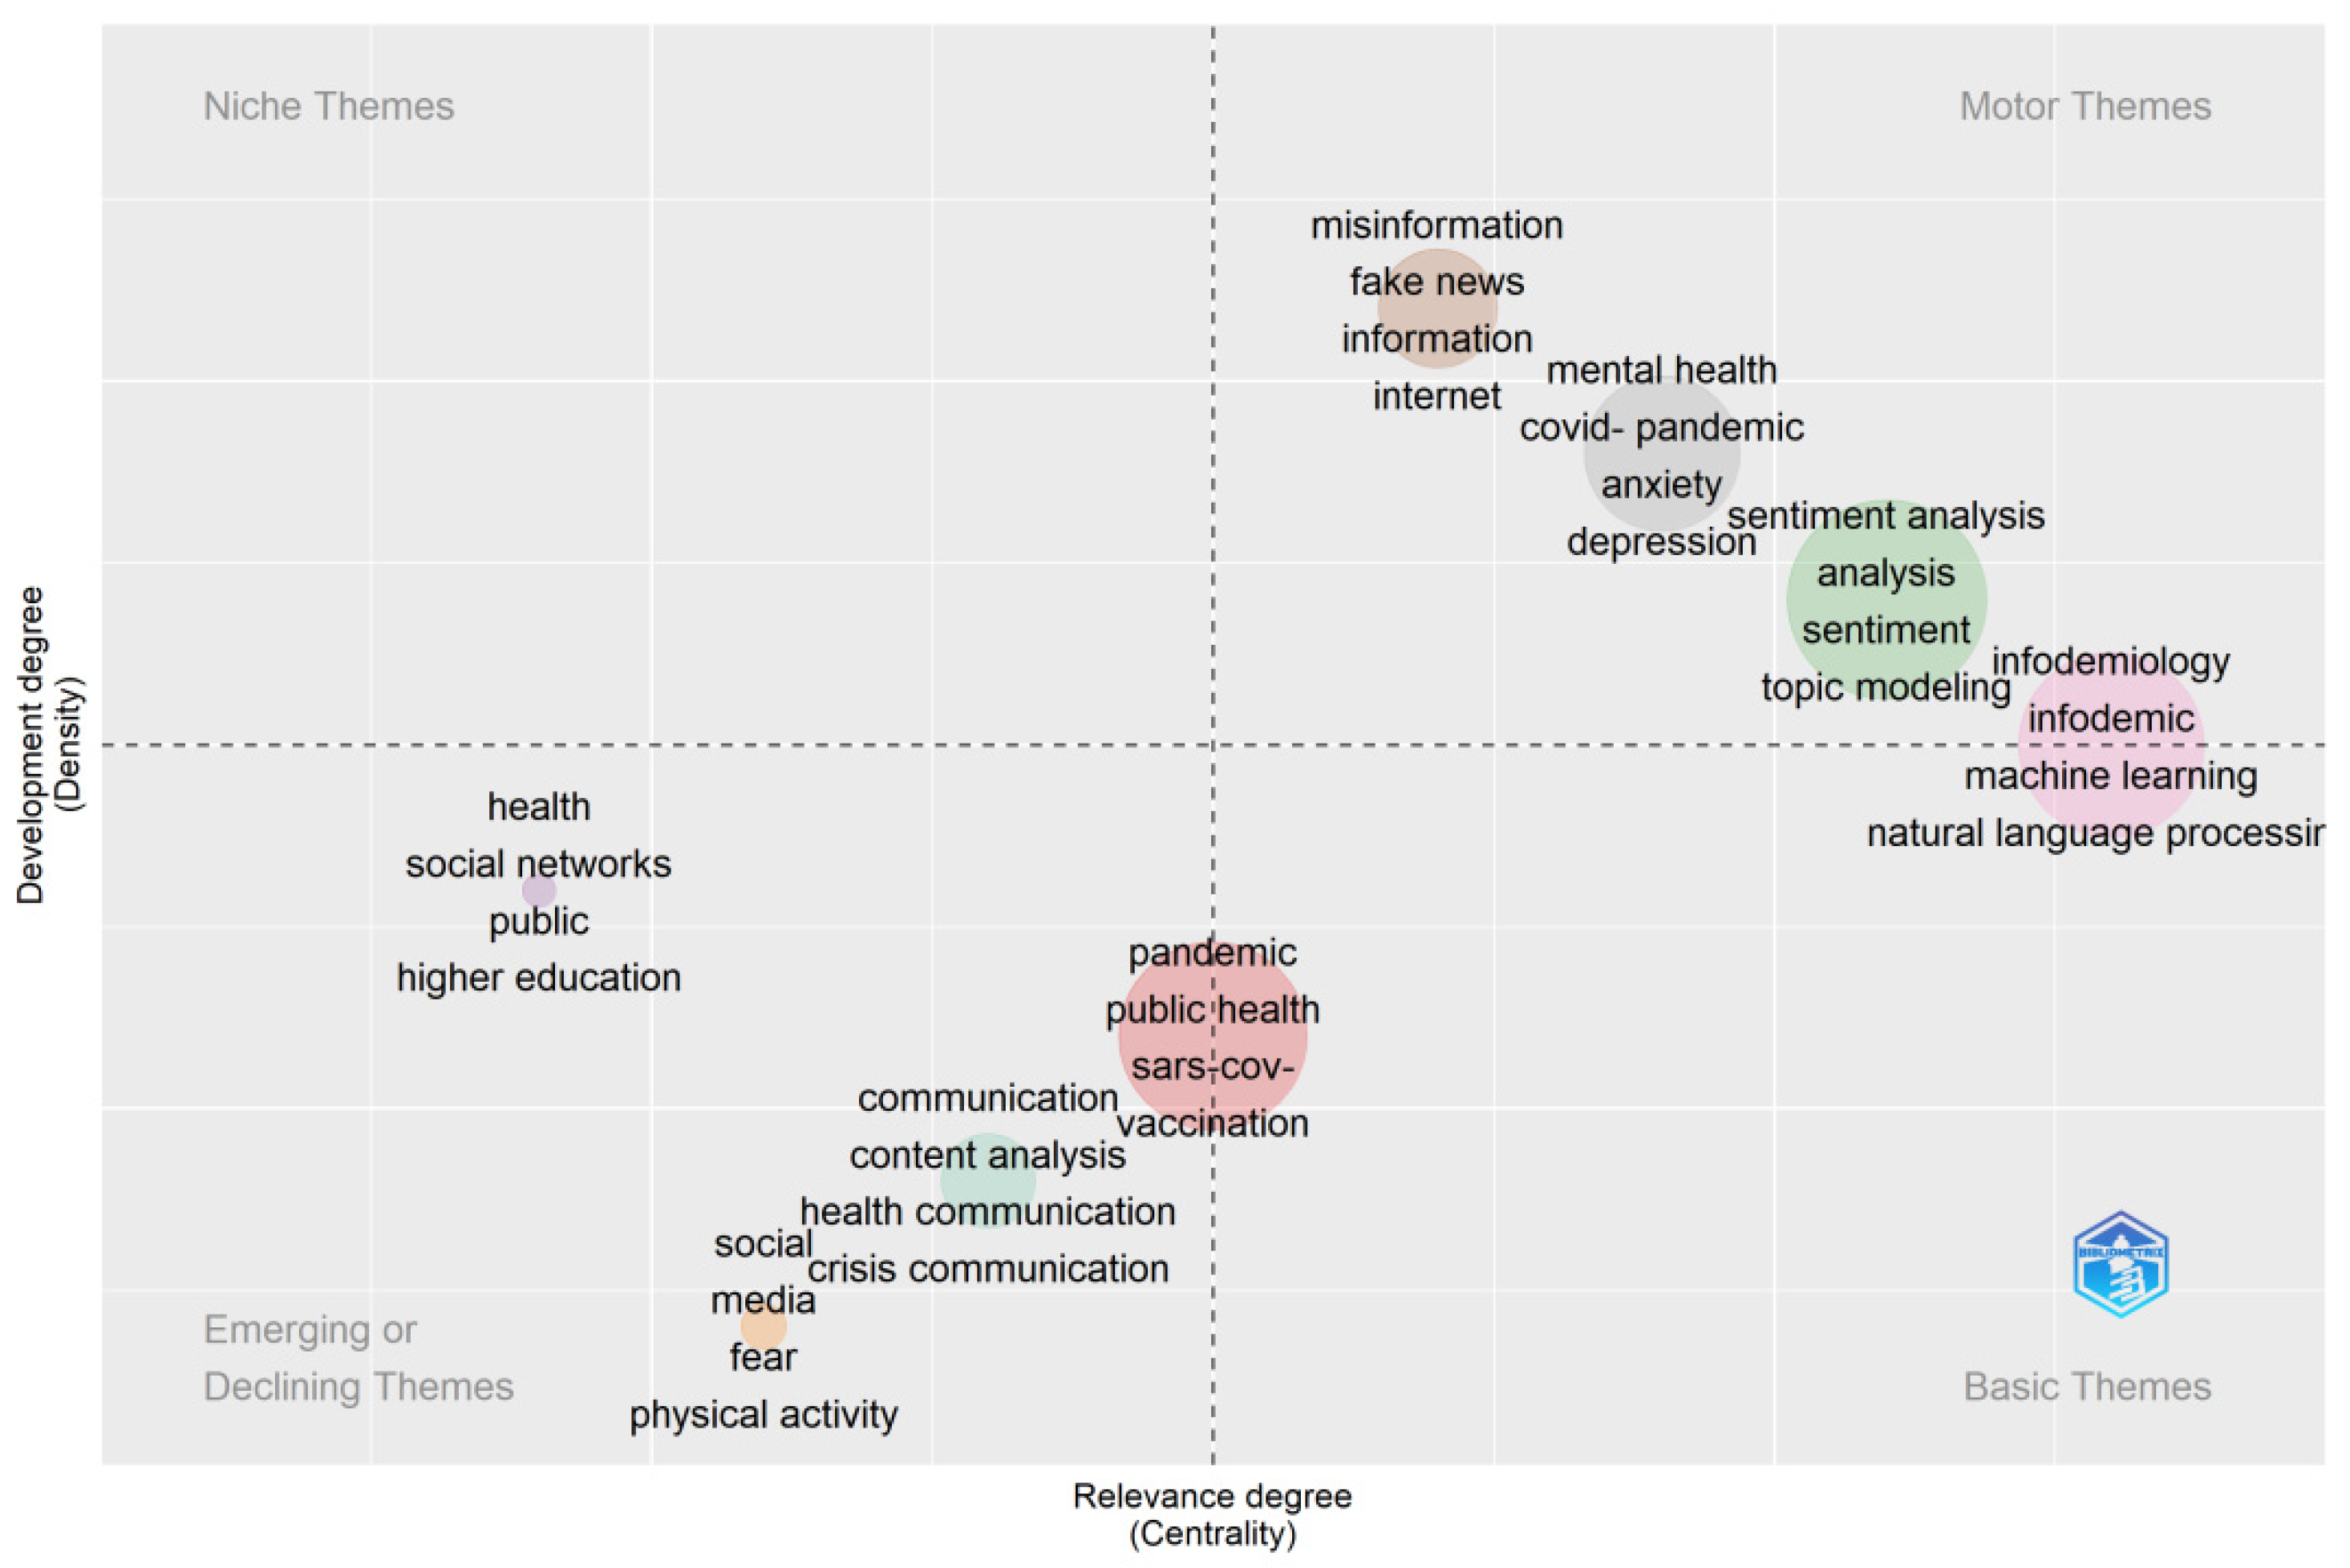
4.3. Research Topics and Keywords Trends
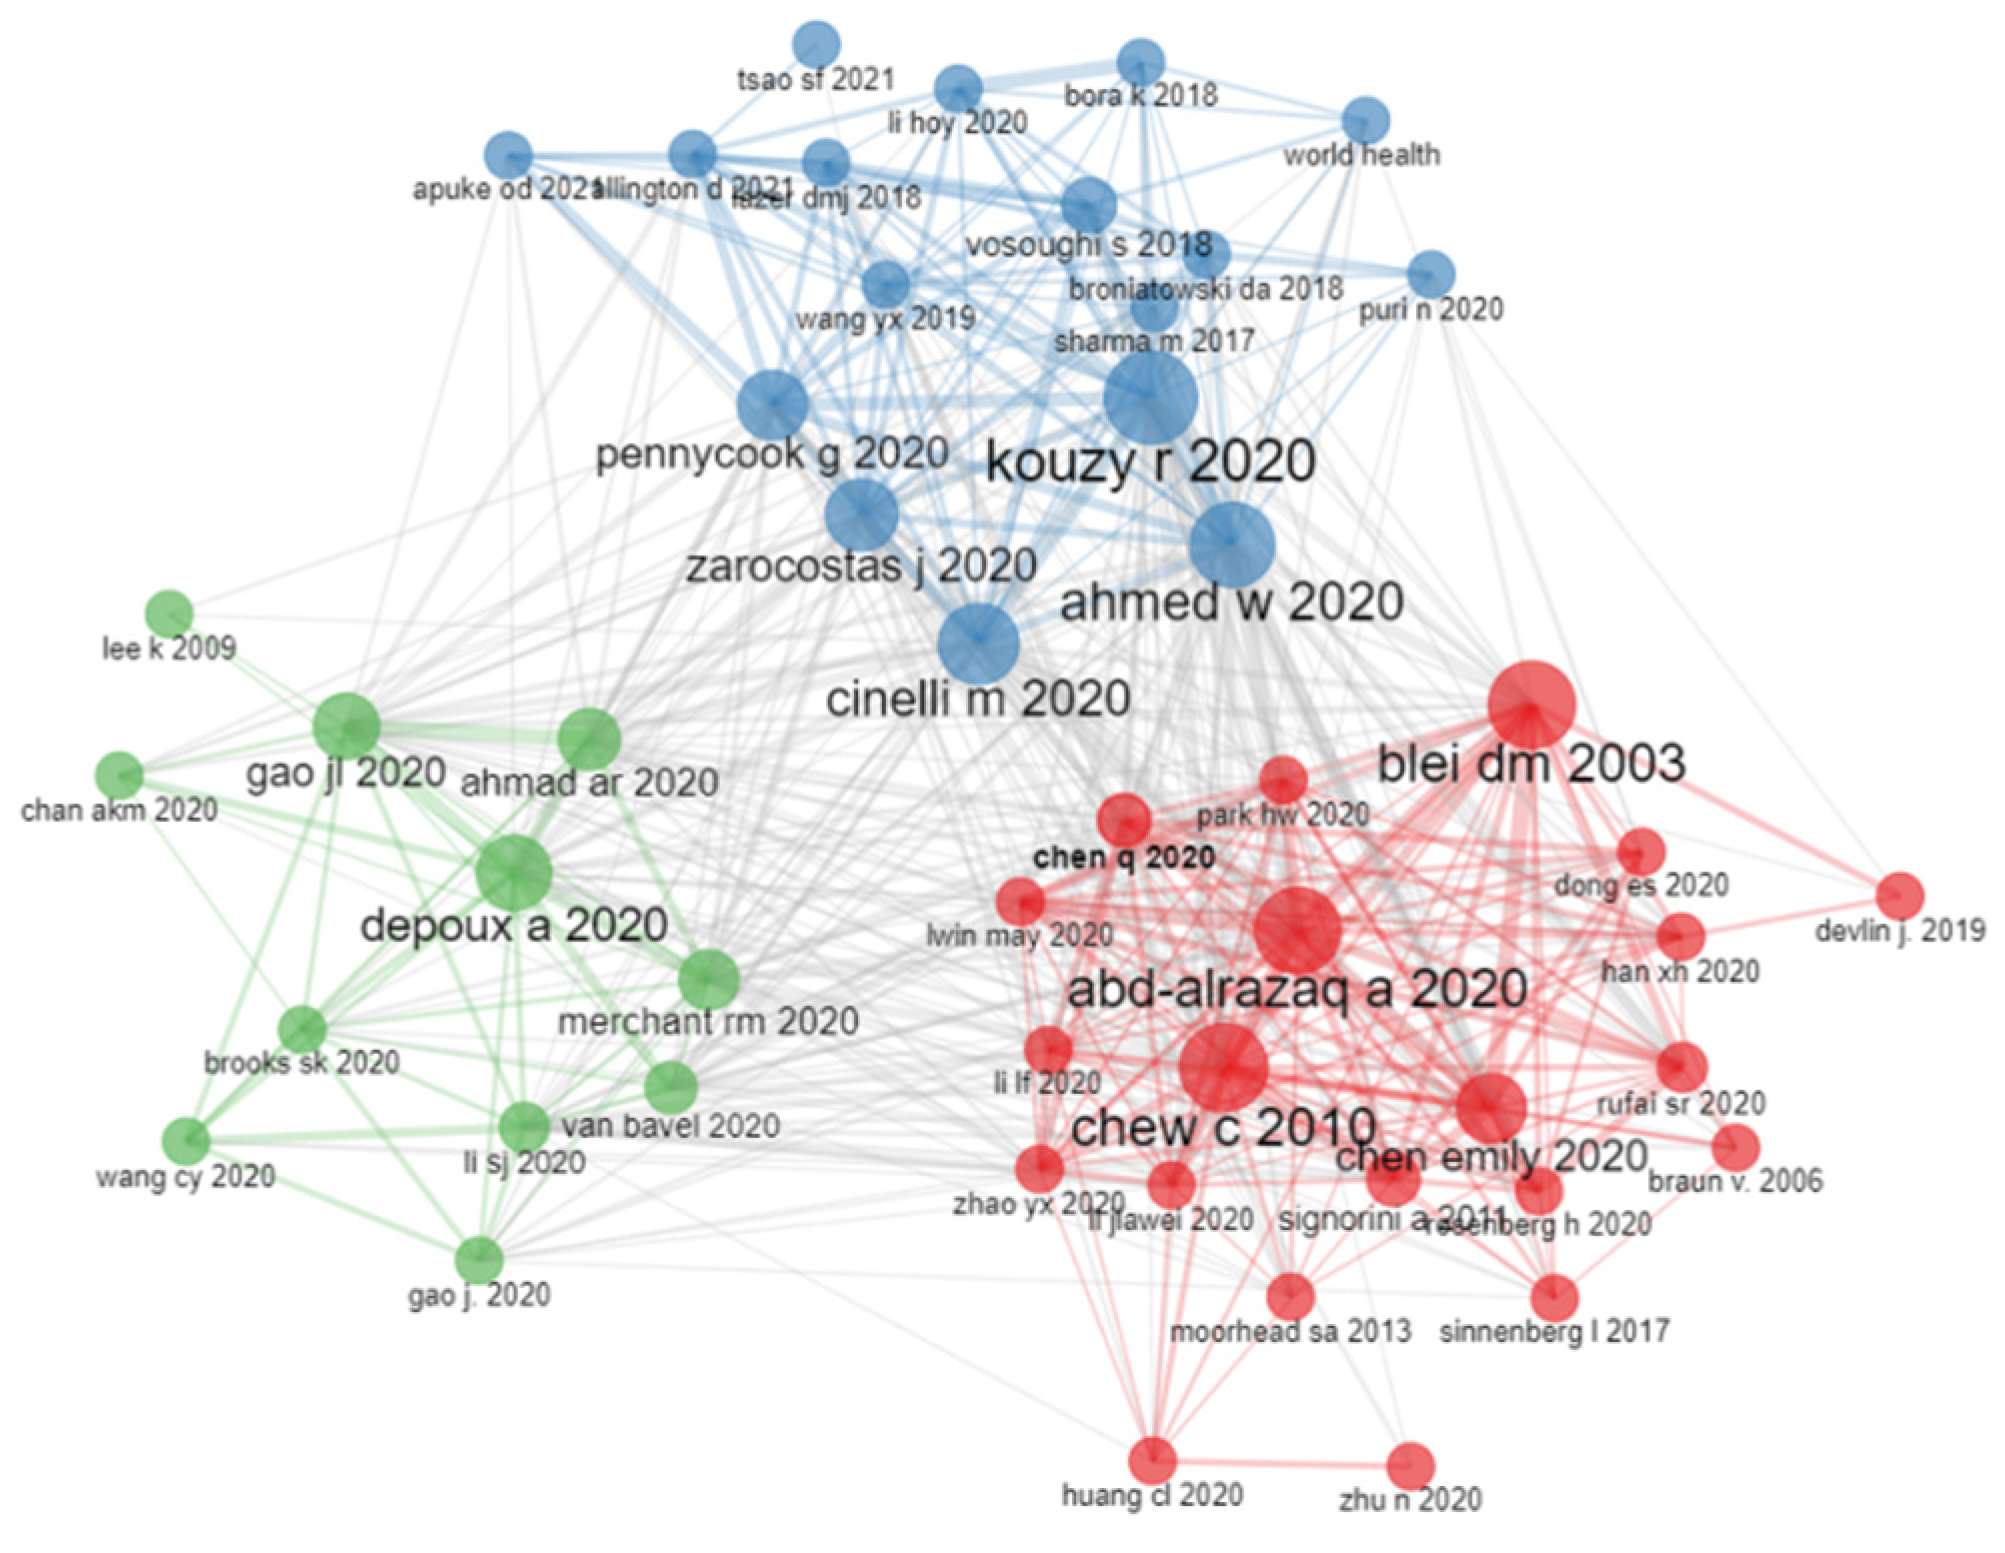
4.4. Co-Citation Network
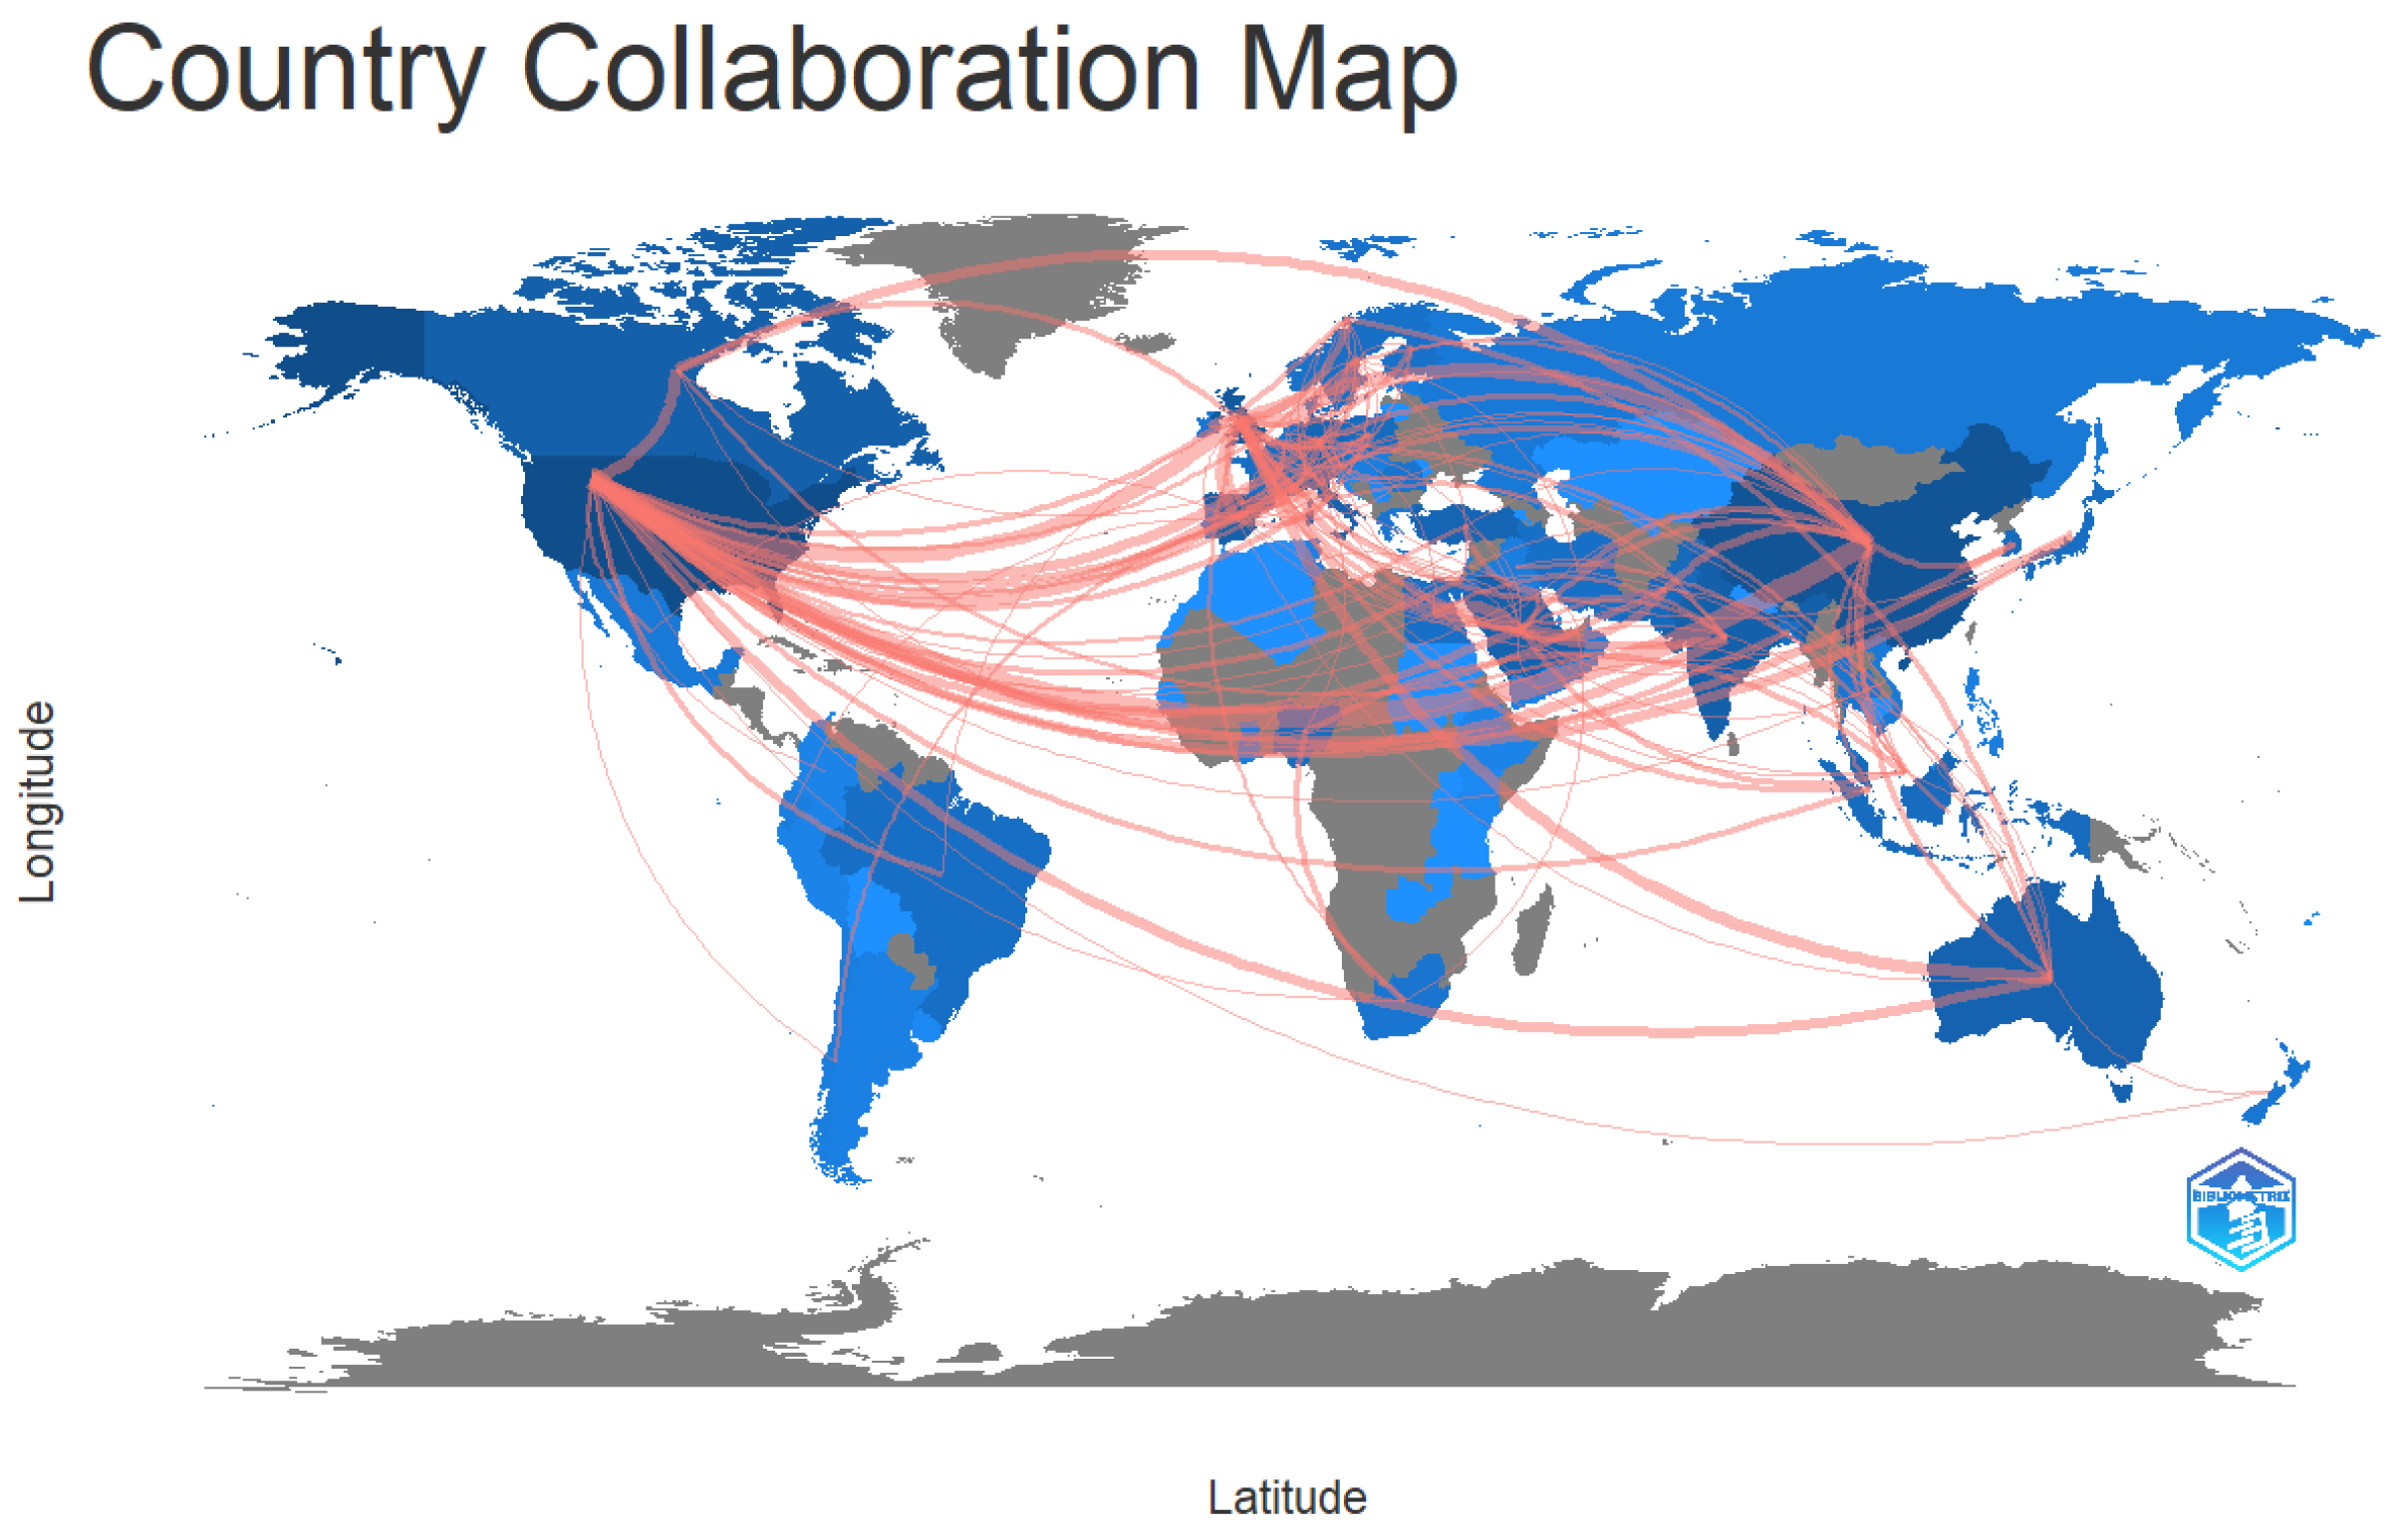
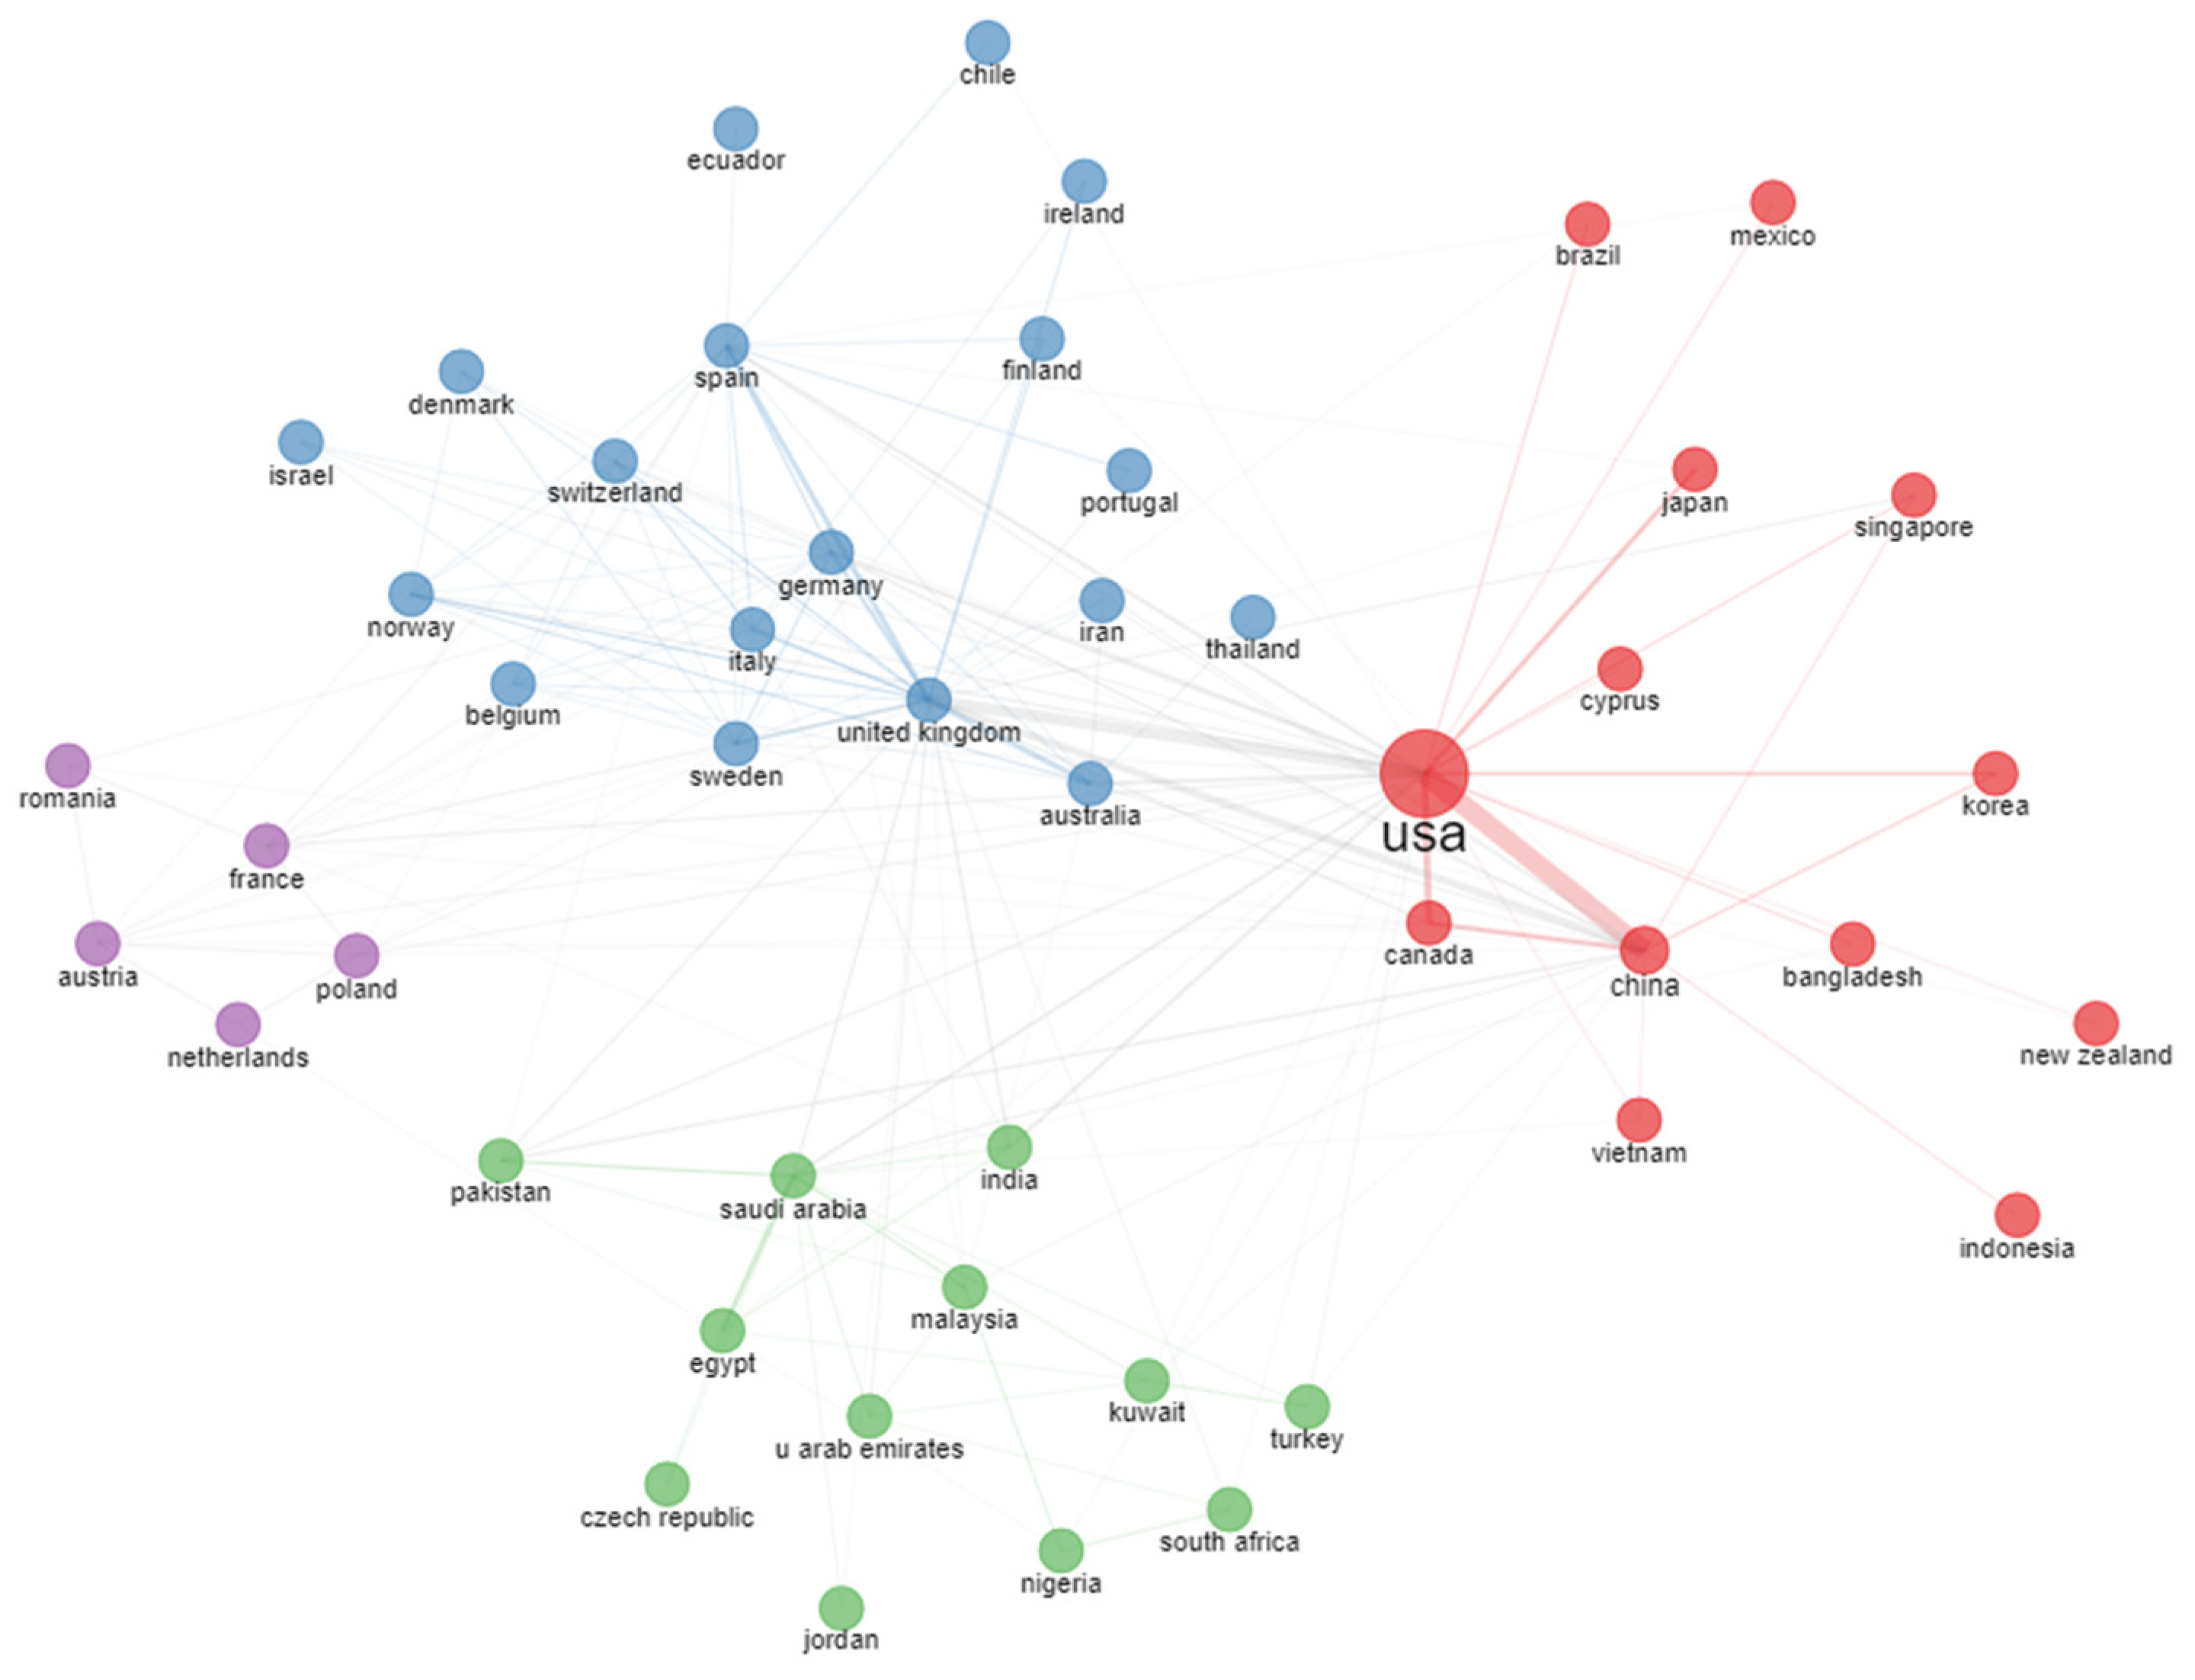
4.5. Country Collaboration Network
5. Discussion and Conclusions
Funding
Institutional Review Board Statement
Informed Consent Statement
Data Availability Statement
Acknowledgments
Conflicts of Interest
References
- Tsao, S.-F.; Chen, H.; Tisseverasinghe, T.; Yang, Y.; Li, L.; Butt, Z. What social media told us in the time of COVID-19: A scoping review. Lancet Digit. Health 2021, 3, 175–194. [Google Scholar] [CrossRef]
- Donthu, N.; Kumar, S.; Mukherjee, D.; Pandey, N.; Lim, W.M. How to conduct a bibliometric analysis: An overview and guidelines. J. Bus. Res. 2021, 133, 285–296. [Google Scholar] [CrossRef]
- Zupic, I.; Cater, T. Bibliometric methods in management and organization. Organ. Res. Methods 2015, 18, 429–472. [Google Scholar] [CrossRef]
- Moral-Muñoz, J.A.; Herrera-Viedma, E.; Santisteban-Espejo, A.; Cobo, M.J. Software tools for conducting bibliometric analysis in science: An up-to-date review. Prof. Inf. 2020, 29, e290103. [Google Scholar] [CrossRef] [Green Version]
- Dhanashree; Garg, H.; Chauhan, A.; Bhatia, M.; Sethi, G.; Chauhan, G. Role of mass media and it’s impact on general public during coronavirus disease 2019 pandemic in North India: An online assessment. Indian J. Med. Sci. 2021, 73, 21–25. [Google Scholar] [CrossRef]
- Nguyen, H.; Nguyen, A. COVID-19 misinformation and the social (media) amplification of risk: A Vietnamese perspective. Media Commun. 2020, 8, 444–447. [Google Scholar] [CrossRef]
- Thanh, P.T.; Tung, L.T. Can risk communication in mass media improve compliance behavior in the COVID-19 pandemic? Evidence from Vietnam. Int. J. Sociol. Soc. Policy 2021, 41, 1–17. [Google Scholar] [CrossRef]
- Giri, S.P.; Maurya, A.K. A neglected reality of mass media during COVID-19: Effect of pandemic news on individual’s positive and negative emotion and psychological resilience. Pers. Individ. Differ. 2021, 180, 110962. [Google Scholar] [CrossRef]
- Aslam, F.; Awan, T.M.; Syed, J.H.; Kashif, A.; Parveen, M. Sentiments and emotions evoked by news headlines of coronavirus disease (COVID-19) outbreak. Humanit. Soc. Sci. Commun. 2020, 7, 23. [Google Scholar] [CrossRef]
- Imran, A.S.; Daudpota, S.M.; Kastrati, Z.; Batra, R. Cross-Cultural Polarity and Emotion Detection Using Sentiment Analysis and Deep Learning on COVID-19 Related Tweets. IEEE Access 2020, 8, 181074–181090. [Google Scholar] [CrossRef]
- Ridhwan, K.M.; Hargreaves, C.A. Leveraging Twitter data to understand public sentiment for the COVID-19 outbreak in Singapore. Int. J. Inf. Manag. Data Insights 2021, 1, 100021. [Google Scholar] [CrossRef]
- Brennen, J.S.; Simon, F.M.; Howard, P.N.; Nielsen, R.K. Types, sources, and claims of COVID-19 misinformation. Reuters Inst. Study J. 2020. Available online: https://ora.ox.ac.uk/objects/uuid:178db677-fa8b-491d-beda-4bacdc9d7069 (accessed on 1 June 2022).
- Song, X.; Petrak, J.; Jiang, Y.; Singh, I.; Maynard, D.; Bontcheva, K. Classification aware neural topic model for COVID-19 disinformation categorisation. PLoS ONE 2021, 16, e0247086. [Google Scholar] [CrossRef] [PubMed]
- Aria, M.; Cuccurullo, C. Bibliometrix: An R-tool for comprehensive science mapping analysis. J. Informetr. 2017, 11, 959–975. [Google Scholar] [CrossRef]
- Gao, J.; Zheng, P.; Jia, Y.; Chen, H.; Mao, Y.; Chen, S.; Wang, Y.; Fu, H.; Dai, J. Mental health problems and social media exposure during COVID-19 outbreak. PLoS ONE 2020, 15, e0231924. [Google Scholar] [CrossRef]
- Pennycook, G.; McPhetres, J.; Zhang, Y.; Lu, J.G.; Rand, D.G. Fighting COVID-19 Misinformation on Social Media: Experimental Evidence for a Scalable Accuracy-Nudge Intervention. Psychol. Sci. 2020, 31, 770–780. [Google Scholar] [CrossRef] [PubMed]
- Elmer, T.; Mepham, K.; Stadtfeld, C. Students under lockdown: Comparisons of students’ social networks and mental health before and during the COVID-19 crisis in Switzerland. PLoS ONE 2020, 15, e0236337. [Google Scholar] [CrossRef] [PubMed]
- Ni, M.; Yang, L.; Leung, C.; Li, N.; Yao, X.; Wang, Y.; Leung, G.; Cowling, B.; Liao, Q. Mental Health, Risk Factors, and Social Media Use During the COVID-19 Epidemic and Cordon Sanitaire Among the Community and Health Professionals in Wuhan, China: Cross-Sectional Survey. JMIR Ment. Health 2020, 7, e19009. [Google Scholar] [CrossRef]
- Cinelli, M.; Quattrociocchi, W.; Galeazzi, A. Valensise, C.M.; Brugnoli, E.; Schmidt, A.L.; Zola, P.; Zollo, F.; Scala, A. The COVID-19 social media infodemic. Sci. Rep. 2020, 10, 16598. [Google Scholar] [CrossRef]
- Kouzy, R.; Abi Jaoude, J.; Kraitem, A.; El Alam, M.B.; Karam, B.; Adib, E.; Zarka, J.; Traboulsi, C.; Akl, E.W.; Baddour, K. Coronavirus Goes Viral: Quantifying the COVID-19 Misinformation Epidemic on Twitter. Cureus 2020, 12, e7255. [Google Scholar] [CrossRef] [Green Version]
- Allington, D.; Duffy, B.; Wessely, S.; Dhavan, N.; Rubin, J. Health-protective behaviour, social media usage and conspiracy belief during the COVID-19 public health emergency. Psychol. Med. 2021, 51, 1763–1769. [Google Scholar] [CrossRef] [PubMed]
- Ahmed, W.; Vidal-Alaball, J.; Downing, J.; López Seguí, F. COVID-19 and the 5G Conspiracy Theory: Social Network Analysis of Twitter Data. J. Med. Internet Res. 2020, 22, e19458. [Google Scholar] [CrossRef] [PubMed]
- Islam, M.S.; Sarkar, T.; Khan, S.H.; Mostofa Kamal, A.H.; Hasan, S.; Kabir, A.; Yeasmin, D.; Islam, M.A.; Amin Chowdhury, K.I.; Anwar, K.S.; et al. COVID-19-Related Infodemic and Its Impact on Public Health: A Global Social Media Analysis. Am. J. Trop. Med. Hyg. 2020, 103, 1621–1629. [Google Scholar] [CrossRef] [PubMed]
- Puri, N.; Coomes, E.A.; Haghbayan, H.; Gunaratne, K. Social media and vaccine hesitancy: New updates for the era of COVID-19 and globalized infectious diseases. Hum. Vaccines Immunother. 2020, 16, 2586–2593. [Google Scholar] [CrossRef]
- Sahni, H.; Sharma, H. Role of social media during the COVID-19 pandemic: Beneficial, destructive, or reconstructive? Int. J. Acad. Med. 2020, 6, 70–75. [Google Scholar]
- Gabarron, E.; Oyeyemi, S.O.; Wynn, R. COVID-19-related misinformation on social media: A systematic review. Bull. World Health Organ. 2021, 99, 455–463A. [Google Scholar] [CrossRef] [PubMed]
- Venegas-Vera, A.V.; Colbert, G.B.; Lerma, E.V. Positive and negative impact of social media in the COVID-19 era. Rev. Cardiovasc. Med. 2020, 21, 561–564. [Google Scholar] [CrossRef]
- Cavus, N.; Sani, A.S.; Haruna, Y.; Lawan, A.A. Efficacy of Social Networking Sites for Sustainable Education in the Era of COVID-19: A Systematic Review. Sustainability 2021, 13, 808. [Google Scholar] [CrossRef]
- Cobo, M.J.; López-Herrera, A.G.; Herrera-Viedma, E.; Herrera, F. An approach for detecting, quantifying, and visualizing the evolution of a research field: A practical application to the fuzzy sets theory field. J. Informetr. 2011, 5, 146–166. [Google Scholar] [CrossRef]
- Chakraborty, K.; Bhatia, S.; Bhattacharyya, S.; Platos, J.; Bag, R.; Hassanien, A.E. Sentiment Analysis of COVID-19 tweets by Deep Learning Classifiers—A study to show how popularity is affecting accuracy in social media. Appl. Soft Comput. 2020, 97, 106754. [Google Scholar] [CrossRef]
- Boon-Itt, S.; Skunkan, Y. Public Perception of the COVID-19 Pandemic on Twitter: Sentiment Analysis and Topic Modeling Study. JMIR Public Health Surveill. 2020, 6, e21978. [Google Scholar] [CrossRef] [PubMed]
- Park, E.; Kim, W.-H.; Kim, S.-B. Tracking tourism and hospitality employees’ real-time perceptions and emotions in an online community during the COVID-19 pandemic. Curr. Issues Tour. 2020. [Google Scholar] [CrossRef]
- Xue, J.; Chen, J.; Hu, R.; Chen, C.; Zheng, C.; Su, Y.; Zhu, T. Twitter Discussions and Emotions About the COVID-19 Pandemic: Machine Learning Approach. J. Med. Internet Res. 2020, 22, e20550. [Google Scholar] [CrossRef] [PubMed]
- Apuke, O.D.; Omar, B. Fake news and COVID-19: Modelling the predictors of fake news sharing among social media users. Telemat. Inform. 2021, 56, 101475. [Google Scholar] [CrossRef]
- Li, L.; Zhang, Q.; Wang, X.; Zhang, J.; Wang, T.; Gao, T.-L.; Duan, W.; Tsoi, K.K.-F.; Wang, F.-Y. Characterizing the Propagation of Situational Information in Social Media During COVID-19 Epidemic: A Case Study on Weibo. IEEE Trans. Comput. Soc. Syst. 2020, 7, 556–562. [Google Scholar] [CrossRef]
- Rufai, S.R.; Bunce, C. World leaders’ usage of Twitter in response to the COVID-19 pandemic: A content analysis. J. Public Health 2020, 42, 510–516. [Google Scholar] [CrossRef] [PubMed]
- Wang, Y.; Hao, H.; Platt, L.S. Examining risk and crisis communications of government agencies and stakeholders during early-stages of COVID-19 on Twitter. Comput. Hum. Behav. 2021, 114, 106568. [Google Scholar] [CrossRef] [PubMed]
- Lin, C.-Y.; Broström, A.; Griffiths, M.; Pakpour, A. Investigating mediated effects of fear of COVID-19 and COVID-19 misunderstanding in the association between problematic social media use, psychological distress, and insomnia. Internet Interv. 2020, 21, 100345. [Google Scholar] [CrossRef] [PubMed]
- Hayes, M. Social media and inspiring physical activity during COVID-19 and beyond. Manag. Sport Leis. 2022, 27, 14–21. [Google Scholar] [CrossRef]
- Sobaih, A.E.E.; Hasanein, A.M.; Abu Elnasr, A.E. Responses to COVID-19 in Higher Education: Social Media Usage for Sustaining Formal Academic Communication in Developing Countries. Sustainability 2020, 12, 6520. [Google Scholar] [CrossRef]
- Chew, C.; Eysenbach, G. Pandemics in the Age of Twitter: Content Analysis of Tweets during the 2009 H1N1 Outbreak. PLoS ONE 2010, 5, e14118. [Google Scholar] [CrossRef]
- Abd-Alrazaq, A.; Alhuwail, D.; Househ, M.; Hamdi, M.; Shah, Z. Top Concerns of Tweeters During the COVID-19 Pandemic: Infoveillance Study. J. Med. Internet Res. 2020, 22, e19016. [Google Scholar] [CrossRef] [PubMed] [Green Version]
- Chen, E.; Lerman, K.; Ferrara, E. Tracking Social Media Discourse About the COVID-19 Pandemic: Development of a Public Coronavirus Twitter Data Set. JMIR Public Health Surveill. 2020, 6, e19273. [Google Scholar] [CrossRef] [PubMed]
- Depoux, A.; Martin, S.; Karafillakis, E.; Preet, R.; Wilder-Smith, A.; Larson, H. The pandemic of social media panic travels faster than the COVID-19 outbreak. J. Travel Med. 2020, 27, taaa031. [Google Scholar] [CrossRef] [PubMed] [Green Version]
- Ahmad, A.; Murad, H. The Impact of Social Media on Panic During the COVID-19 Pandemic in Iraqi Kurdistan: Online Questionnaire Study. J. Med. Internet Res. 2020, 22, e19556. [Google Scholar] [CrossRef]
- Web of Science Core Collection Database. Available online: https://www.webofscience.com/ (accessed on 11 June 2022).


| Description | Results |
|---|---|
| Timespan | 2020–2022 |
| Sources (Journals, Books, etc.) | 680 |
| Documents | 1427 |
| Average years from publication | 0.923 |
| Average citations per document | 9.601 |
| Average citations per year per document | 3.844 |
| References | 50,970 |
| Document Types | |
| Article | 1396 |
| Proceedings papers | 4 |
| Review | 27 |
| Document Contents | |
| Keywords Plus (ID) | 1470 |
| Author’s Keywords (DE) | 3297 |
| Authors | |
| Authors | 4969 |
| Author Appearances | 5791 |
| Authors of single-authored documents | 113 |
| Authors of multi-authored documents | 4856 |
| Authors Collaboration | |
| Single-authored documents | 117 |
| Documents per Author | 0.287 |
| Authors per Document | 3.48 |
| Co-Authors per Documents | 4.06 |
| Collaboration Index | 3.71 |
| Year | N | TC |
|---|---|---|
| 2020 | 260 | 9105 |
| 2021 | 797 | 4288 |
| 2022 | 370 | 307 |
| Source Title | Documents | JIF * |
|---|---|---|
| Journal of Medical Internet Research | 92 | 7.093 |
| International Journal of Environmental Research and Public Health | 75 | 4.614 |
| Sustainability | 31 | 3.889 |
| PLOS One | 29 | 3.752 |
| JMIR Public Health and Surveillance | 23 | 14.557 |
| Frontiers in Psychology | 22 | 4.232 |
| BMC Public Health | 15 | 4.135 |
| IEEE Access | 14 | 3.476 |
| Vaccines | 14 | 4.961 |
| Computers in Human Behavior | 13 | 8.957 |
| Source Title | Citations |
|---|---|
| Journal of Medical Internet Research | 1492 |
| Computers in Human Behavior | 1081 |
| PLOS One | 1072 |
| International Journal of Environmental Research and Public Health | 673 |
| Lancet | 563 |
| The Journal of the American Medical Association | 348 |
| Health Communication | 340 |
| Public Relations Review | 312 |
| The New England Journal of Medicine | 305 |
| Science | 300 |
| Source Title | h-Index | Total Papers | Total Citations | JIF * |
|---|---|---|---|---|
| Journal of Medical Internet Research | 24 | 79 | 1906 | 7.093 |
| PLOS One | 10 | 26 | 1279 | 3.752 |
| International Journal of Environmental Research and Public Health | 13 | 44 | 566 | 4.614 |
| Phychological Science | 1 | 1 | 392 | - |
| Computers in Human Behavior | 5 | 11 | 336 | 8.957 |
| Scientific Reports | 4 | 10 | 326 | 4.996 |
| Cureus | 3 | 4 | 316 | - |
| Sustainability | 8 | 25 | 309 | 3.889 |
| Human Vaccines and Immunotherapeutics | 4 | 5 | 287 | 4.526 |
| Phychological Medicine | 2 | 2 | 255 | - |
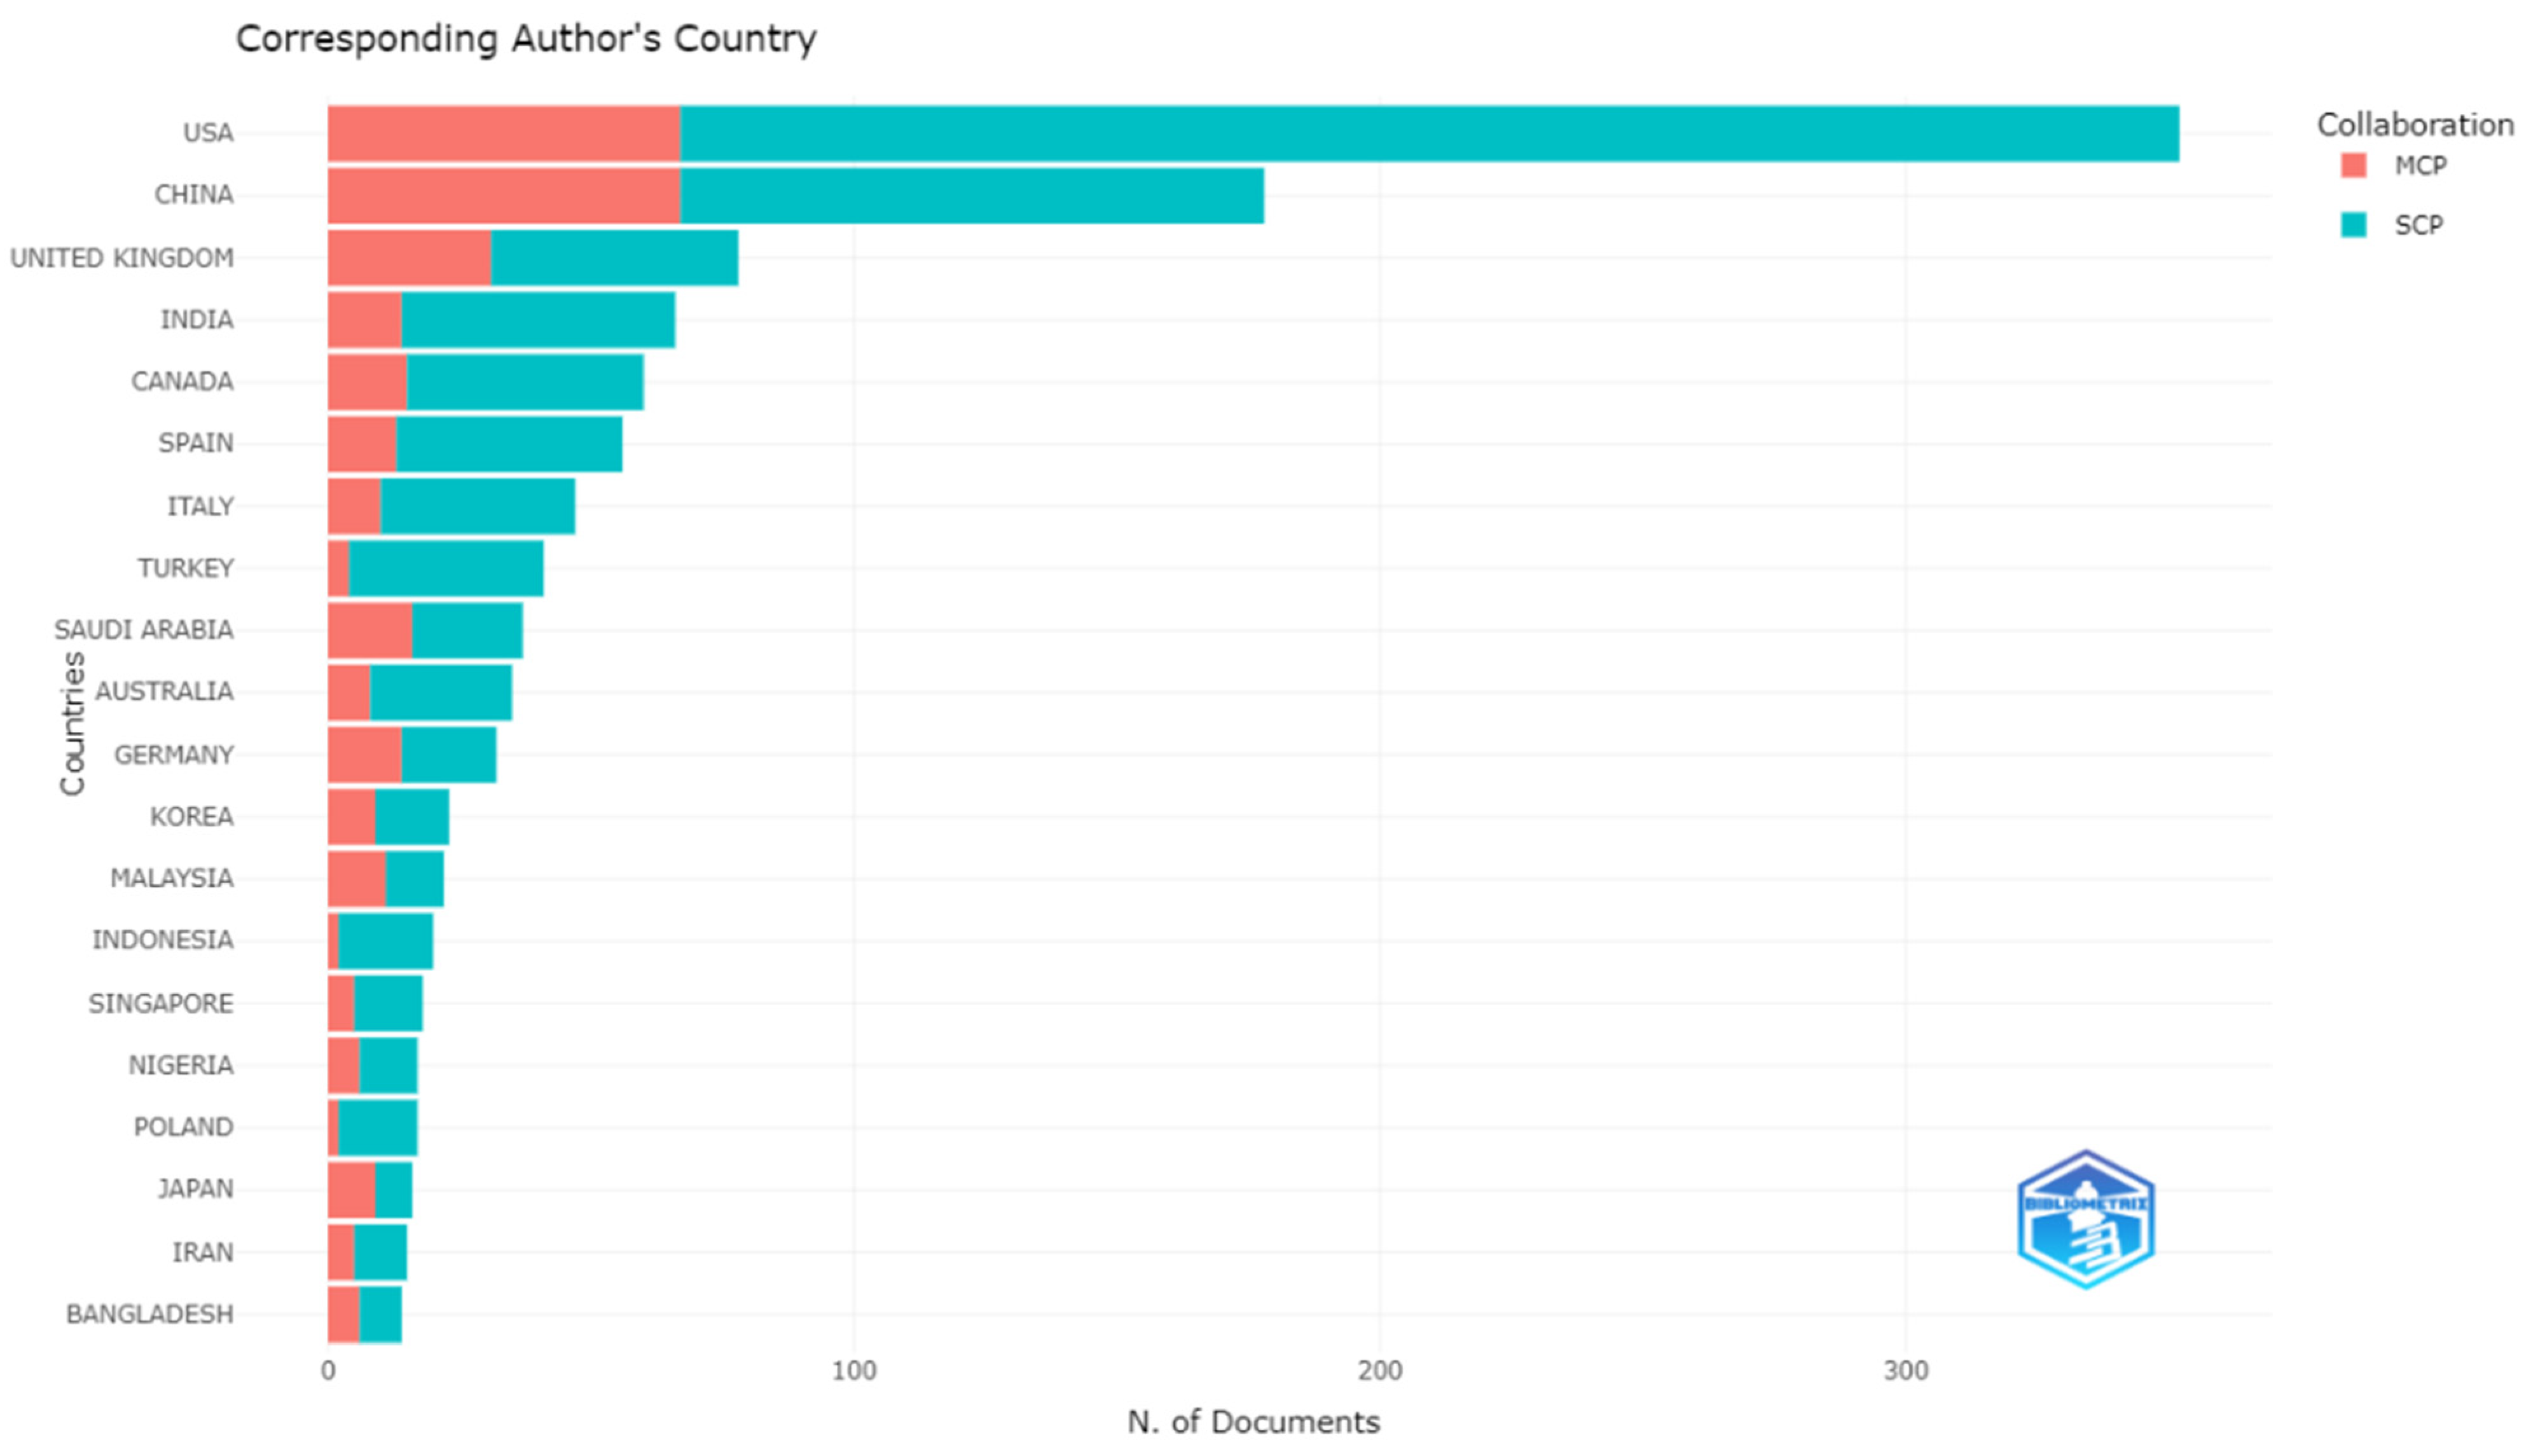
| Country | Documents | SCP | MCP | MCP Ratio |
|---|---|---|---|---|
| USA | 352 | 285 | 67 | 0.1903 |
| China | 178 | 111 | 67 | 0.3764 |
| UK | 78 | 47 | 31 | 0.3974 |
| India | 66 | 52 | 14 | 0.2121 |
| Canada | 60 | 45 | 15 | 0.25 |
| Spain | 56 | 54 | 13 | 0.2321 |
| Italy | 47 | 37 | 10 | 0.2128 |
| Turkey | 41 | 37 | 4 | 0.0976 |
| Saudi Arabia | 37 | 21 | 16 | 0.4324 |
| Australia | 35 | 27 | 8 | 0.2286 |
| Germany | 32 | 18 | 14 | 0.4375 |
| Korea | 23 | 14 | 9 | 0.3913 |
| Malaysia | 22 | 11 | 11 | 0.50 |
| Indonesia | 20 | 18 | 2 | 0.10 |
| Singapore | 18 | 13 | 5 | 0.2778 |
| Nigeria | 17 | 11 | 6 | 0.3529 |
| Poland | 17 | 15 | 2 | 0.1176 |
| Japan | 16 | 7 | 9 | 0.5625 |
| Iran | 15 | 10 | 5 | 0.3333 |
| Bangladesh | 14 | 8 | 6 | 0.4286 |
Publisher’s Note: MDPI stays neutral with regard to jurisdictional claims in published maps and institutional affiliations. |
© 2022 by the author. Licensee MDPI, Basel, Switzerland. This article is an open access article distributed under the terms and conditions of the Creative Commons Attribution (CC BY) license (https://creativecommons.org/licenses/by/4.0/).
Share and Cite
Michailidis, P.D. Visualizing Social Media Research in the Age of COVID-19. Information 2022, 13, 372. https://doi.org/10.3390/info13080372
Michailidis PD. Visualizing Social Media Research in the Age of COVID-19. Information. 2022; 13(8):372. https://doi.org/10.3390/info13080372
Chicago/Turabian StyleMichailidis, Panagiotis D. 2022. "Visualizing Social Media Research in the Age of COVID-19" Information 13, no. 8: 372. https://doi.org/10.3390/info13080372
APA StyleMichailidis, P. D. (2022). Visualizing Social Media Research in the Age of COVID-19. Information, 13(8), 372. https://doi.org/10.3390/info13080372