Abstract
Tax fraud is a common problem for many tax administrations, costing billions of dollars. Different tax administrations have considered several options to optimize revenue; among them, there is the so-called electronic billing machine (EBM), which aims to monitor all business transactions and, as a result, boost value added tax (VAT) revenue and compliance. Most of the current research has focused on the impact of EBMs on VAT revenue collection and compliance rather than understanding how EBM reporting behavior influences future compliance. The essential contribution of this study is that it leverages both EBM’s historical reporting behavior and actual business characteristics to understand and predict the future reporting behavior of EBMs. Herein, tree-based machine learning algorithms such as decision trees, random forest, gradient boost, and XGBoost are utilized, tested, and compared for better performance. The results exhibit the robustness of the random forest model, among others, with an accuracy of 92.3%. This paper clearly presents our approach contribution with respect to existing approaches through well-defined research questions, analysis mechanisms, and constructive discussions. Once applied, we believe that our approach could ultimately help the tax-collecting agency conduct timely interventions on EBM compliance, which will help achieve the EBM objective of improving VAT compliance.
1. Introduction
Taxes are contributions made by citizens to the government to finance government expenditures such as infrastructure, education, health, and justice. Taxation is universally acknowledged as essential to advancing social, political, and economic systems. A robust tax system plays three essential roles in the country’s development: revenue production, reduction of inequality, and promotion of good governance [1]). However, some taxpayers dodge taxes and do not comply properly, making it difficult for any tax administration to maintain and achieve a high level of voluntary compliance. Consequently, there are two ways of cheating taxes: (i) tax avoidance, which is defined as the act of minimizing taxes; and (ii) tax evasion, which is the illegal practice of defrauding the government by failing to report income, reporting more expenses than you can, or simply failing to pay taxes owed [2].
To limit such malpractice, different tax administrations have introduced the electronic billing machine (EBM) to control real-time taxpayer transactions. The EBM is a technological device that monitors business-to-business and business-to-consumer activities to avoid non-compliance with the value added tax (VAT) [3]. These devices are used to process and record transactions electronically, typically in retail environments. These can print receipts and track sales data, and may also include features such as credit card processing, inventory management, and customer loyalty programs. They typically connect to a computer or a network, allowing for the transfer of data and the centralized management of transactions. In a typical EBM, a sales data controller (SDC) component captures and reports every transaction from a certified invoicing system (CIS) and ensures that an electronic signature is printed on the receipt. Tax administration officials may verify the signature using a particular decryption tool unique to each SDC device; hence, any signature fraud can be detected immediately [4].
The generation of that electronic billing device directly sends any transaction data from SDC to the server of the revenue authority. Furthermore, this allows tax administrators to access and remotely update daily transactions without the need to be physically present. In 1983, the Italian government initially started using the electronic fiscal device (EFD) [3]. Five years later, in 1988, the Greek tax authority followed. Kenya was the first country in Sub-Saharan Africa to implement the EFD in 2005. Consequently, several other African countries followed, and Rwanda introduced the EBM in August 2013. A new law was passed requiring all VAT-registered businesses to provide a certified VAT receipt created by an EBM system that includes SDC with general packet radio system (GPRS) and CIS [3].
Rwanda has made significant investments to improve VAT, which is the first source of revenue compared to other tax types such as income taxes, withholding taxes, pay as you earn, and others. According to [5], the VAT amounted to approximately 32.9 percent of the overall revenue in the fiscal year 2019–2020, while EBMs were used by 84.5 percent of VAT-registered taxpayers. It was widely anticipated that the use of EBMs would lead to an increase in tax compliance and VAT tax revenues. According to the findings of the research conducted by the Internal Growth Center (IGC), the adoption of EBMs resulted in a 5.4 percent increase in VAT revenue during the period from 2012 to 2014. This was a small amount, considerably less than the Rwandan Revenue Authority (RRA) had expected [3].
The influence of EBM on Rwandan VAT compliance is shown in the table below Table 1. This shows how it reduced non- and late filing, increased VAT payments, collections, sales, and increased taxpayer registration for VAT.

Table 1.
Impact of EBM on VAT compliance.
This research aims to predict the potential future reporting behavior of EBMs using tree-based machine learning approaches. This can be achieved by considering the historical behavior of EBMs and their related actual business characteristics. Current research will potentially help revenue authorities maximize the number of reporting EBMs by relying on a live model prediction. Tree-based machine learning algorithms are commonly used for predicting the reporting behavior of electronic billing machines. Some popular tree-based machine learning algorithms such as decision trees, random forest, gradient boost, and XGBoost were employed and accordingly compared against various evaluation metrics to obtain the most robust model.
There have been a number of initiatives that have attempted to address this issue by comparing different models, including [6,7,8], to mention a few; however, none of them explicitly focused on predicting the potential future reporting behavior of EBMs. For instance, in [9], a random forest model was employed, among others, to detect and predict invoices with late payments and difficult clients. Other works such as [7,10] explicitly focused on the use of AI models to help tax administrations identify tax fraud through the deep analysis of invoice data while [7,8] suggested the use of multi-layer perceptron (MLP) by relying on historical invoice data. However, from all of the above research, their approaches did not explicitly focus on EBM data or even on understanding the future behaviors of EBM machines.
To evaluate the effectiveness of the proposed approach, the methodology was implemented and tested on anonymized EBM data from the RRA database. No personal information of the taxpayers was given and remains strictly confidential. Out of the available data, our approach was tested on 852,239 anonymized reporting records, which is approximately 10 percent of all the EBM records until May 2018. In addition to that, the information related to the number of receipts issued by each EBM on a daily basis, as well as the information related to the scale of the business, the geographical location, and the type of the business, was also used.
From our experiment, the random forest model was revealed to be the most robust and effective for this study, in which the EBM activation period proved to be a critical determining factor of the future reporting behavior of an EBM. We clearly demonstrated what our proposed approach could potentially offer in comparison to existing approaches. We highlighted various crucial elements influencing the reporting behavior and how our method can help. Finally, we believe that our approach can assist RRA in recovering the money lost due to EBM non-reporting issues, which might potentially increase tax compliance, particularly VAT tax compliance.
The rest of the paper is organized as follows. Section 2 discusses the literature review and motivating examples. Section 3 contains information on the proposed approach, EBM features, machine learning algorithms used in this study, and the evaluation metrics. Section 4 focuses on presenting the study design methodology and data processing. Section 5 presents the evaluation research question and the analysis results. Section 6 discusses the findings by answering the research questions. Lastly, Section 7 concludes the paper by making some recommendations for further research.
2. Motivating Example and Related Work
2.1. Motivating Example
Currently, in RRA, detecting EBM non-compliance is manually performed by reading over each EBM datum and deciding whether such an EBM is still compliant. To put that into perspective, once the EBM is connected to the Internet, all of the information on the receipt, machine information, and connection time are instantly transferred to the EBM back office system by the time the EBM produces the receipt. When the officer wants to examine the data related to a specific EBM, they can use the portal to do so. The officer usually extracts data from a certain period on a particular EBM and analyses its reporting behavior based on its connection time.
When a machine is disconnected for an extended period and no longer transmits any messages, the system can recover all actions once it is reconnected to the system. As a result, the officer can see when a machine connects and when it last did so. The new version of EBM allows the device to be blocked by the tax administration if it is not connected for at least three consecutive days. As a result, the machine will not generate a receipt before submitting what has already been covered.
After identifying the non-reporting machines, they send SMS to those individuals informing them of their EBMs’ reporting behaviors, but this is on a random basis and is not a regular SMS. However, due to the officer’s limited time and the large amount of the dataset of information provided by EBMs, they can only work on one month’s data, export the data in Excel, and manually sort them based on their last connection to discover delays and non-compliance.
Our primary motivation is to examine how we could automate both the identification and communication processes by employing a more robust decision mechanism. Furthermore, we are more concerned with establishing transparency around the decision to block the EBM based on their non-reporting activity. For example, it would not be fair to block an EBM for a client who has been reporting perfectly for the last five years, and for a simple miss in reporting due to a simple unforeseeable circumstance; it had to be blocked. We believe this is potentially unfair, and in our approach, such historical compliance will be automatically considered in the decision-making process.
2.2. Related Work
As technology progresses, the tax base grows, and many governments attempt to improve tax compliance. The degree to which taxpayers comply (or do not comply) with their country’s tax regulations is known as tax compliance [11]. Most developing countries, in particular, need to improve VAT compliance since it dominates other tax revenues. The slight rise in VAT has a significant influence on most developing nations. It helps them mobilize domestic revenues, which is why governments have invested in VAT to boost their return [3].
Many developing countries focus on taxation to reduce their reliance on aid or a single source of income for growth. The government’s efforts to increase tax revenue are hampered by rampant tax fraud among citizens. According to the analysis, tax evasion costs the world economy approximately USD 3.1 trillion, or nearly 5.1 percent of the global gross domestic product (GPD), according to the conducted survey. The total healthcare spending in the states surveyed amounted to USD 5.7 trillion. Thus, tax evasion costs approximately 54.9 percent of healthcare spending in the state’s survey. In African and South American countries, for example, the percentages of the health care spending lost to tax evasion are 97.7 percent and 138.5 percent, respectively, [12].
The review of 46 tax compliance publications found eleven key aspects that researchers have investigated that affect compliance. These factors are the complexity of the tax system, the amount of tax information services, withholding and information reporting, the duties and penalties of tax return preparation, the likelihood of an audit, the progressive and actual level of tax rates, fines for noncompliance, age, gender, education, and income [13]. Additional research has been conducted, revealing a multitude of factors that are more or less comparable to the findings of Jackson and Milliron, such as psychological factors such as ethics, tax morale, the taxpayer’s view, and others [14,15,16].
In recent years, researchers have concentrated on analyzing VAT compliance following the implementation of the electronic billing machine (EBM). The initial studies on EBMs thus give a sobering result. Even though many governments have great hopes for EBMs to increase their tax revenues, the study revealed that these devices should not be considered a “silver bullet” for tax management [2]. The results of an IMF study on trends in VAT revenue collection as a proportion of GDP following the implementation of EFDs for nine countries indicated that EFDs are not often connected with any noteworthy increase in VAT revenue. As a result, implementing fiscal devices on their own cannot provide significant benefits in terms of increased revenue or improved long-term compliance [3]. The exception is Chile, where implementing EFDs was associated with a considerable drop in tax revenues. Still, the country regained its original VAT-to-GDP ratio after an additional three years of tax collection [3].
The findings of a study on the impact of extract–transform–load (ETRs) on tax compliance for various tax authorities revealed that using ETRs significantly reduces the VAT audit time in the studied population in Kenya, as well as positively and significantly improves compliance attitudes and effective tax administration in the study area. It also discovered a significant increase in VAT compliance among classified hotels by raising the amount of declared VAT liability [17,18]. Some challenges associated with using EFDs include recurrent breakdowns, the fairness of tax estimates from taxpayers, a lack of instruction on the usage of EFDs devices, machine maintenance, and under-pricing of tax from traders [19].
The studies performed in Rwanda over the last five years revealed that sending a reminder of a firm’s future tax requirements through a letter, email, or text message substantially impacts enterprises’ payment of corporate income tax. Applying such a method to EBM receipt issuance might be a powerful tool to improve compliance. Revenue authorities may request a voluntary quarterly VAT adjustment based on questionable tax filings (false receipts) or suspicious pricing patterns. If something goes wrong with their EBM device, it may send businesses automated text messages to notify them of problematic behavior and request an explanation [20].
According to the “small-scale mystery shopper” study, researchers randomly visited a shop and discovered that just 21 percent of clients were given EBM receipts without asking for them. They also found that asking for a receipt increased the rate of EBM receipt issues to 63 percent of visits and that when tax authority officers sit beside the shop, the percentage increases to 94 percent [3].
In recent years, there has been a remarkable increase in the application of artificial intelligence and machine learning algorithms to address very complex and emergent challenges as well as tax fraud [21,22]. Researchers have applied ML models in different domains depending on the problem they wanted to handle. For instance, Botchey et al. [6] compared support vector machines (SVMs), gradient boosted decision trees, and naïve Bayes algorithms in predicting mobile money transaction fraud. The findings revealed that the gradient boost decision tree was the best model. Another study in [23], examined how well sentiment analysis identifies letters from businesses that have engaged in financial misconduct or fraud. The findings indicated that SVM was 81% accurate at providing information about the positive or negative tones and word combinations typical of texts written by fraudsters.
In [9], the authors compared different supervised machine learning models to detect and predict invoices that have delayed payments and difficult clients, which helps companies take collection measures. Their results revealed that random forest is the most robust and accurate model in identifying whether an invoice would be paid on time, how much of a delay it would cause, and to segment taxpayers.
In the study on financial fraud detection [7], four different machine learning models were tested for categorizing companies that are more likely to be involved in tax fraud, including k-nearest neighbors, random forest, support vector machine (SVM), and a neural network. The results demonstrated that random forest, with an F1 score of 92%, was a good model for classifying organizations.
As shown in [24], EBMs are associated with many advantages such as flexibility, easy storage, easy inspection, and quick reimbursement. However, these machines can also present strange electronic-related behaviors, such as the repeated reimbursement of electronic invoices, reimbursement of fake invoices, as well as the frequent replacement of electronic credential status. To identify, evaluate, and deal with the unusual behaviors of EBMs, researchers have suggested a multi-layer perceptron (MLP) model, which they trained using historical invoice data. These were tested using the real-time input of new data for which the model was 95% accurate.
Furthermore, the authors in [10] suggested the use of artificial intelligence (AI) to combine the data available in the tax administration with digital invoices as a solution. This study emphasizes that in order for a tax administration to identify any type of tax fraud, data from many sources must be combined, necessitating the use of advanced algorithms for data analysis over billions of data points. A different approach to reduce VAT fraud detection is a multi-signature that involves multistage authorizations that help to establish online control was also proposed to be applied to detect VAT fraud as suggested by the authors
In [8], a different study that uses machine learning techniques was used to focus on anomaly identification in electronic invoice systems. Multi-layer perceptron (MLP) and k-means were employed in this work, and the findings demonstrated that the proposed approach was both capable of effectively detecting malicious attacks and of mining the potential risks in the electronic invoice systems. Finally, this study [25] was implemented in Tanzania, and the authors suggested the use of electronic fiscal devices (EFDs) in identifying tax fraud. Even though using EFDs boosts revenue, these are also linked to problems with tax fraud, such as under-declaration, failure to use EFDs, and others. As a result, the suggested upgraded EFD includes the ability to recognize under-pricing, failure to use EFD machines, as well as the detection of fake EFD machines.
Despite the fact that the above literature shows that most research has focused on examining EBM’s importance in increasing taxpayer compliance as well as contribution to the economy. Additionally, several approaches have attempted to employ machine learning techniques to cope with various economic aspects. Moreover, none of the approaches focused on enhancing taxpayer compliance through research and the prediction of EBM behavior. Our proposed contributes to filling this gap.
3. Proposed Approach
Electronic billing machines can produce reports based on the data they collect during transactions. These reports can provide insights into sales patterns, inventory levels, customer behavior, and other important business metrics. These reports can be generated on a regular basis or on demand, and can be exported for future business analytics.
For tax administrators, having an idea beforehand of when or how a given taxpayer could fail to comply and act accordingly could potentially limit mutual complications. In this section, we will mainly present a general overview of the proposed approach by emphasizing the proposed analysis process as well as the different machine learning methods we seek to compare in tackling the problem at hand.
3.1. High-Level Study Pipeline
In order to tackle such a problem, we propose a comparative tree-based machine learning analysis approach for analyzing historical EBM information as well as business characteristics to support predicting their future performance. Figure 1 presents a high-level overview of the entire development pipeline which clearly shows the study design from beginning to end.
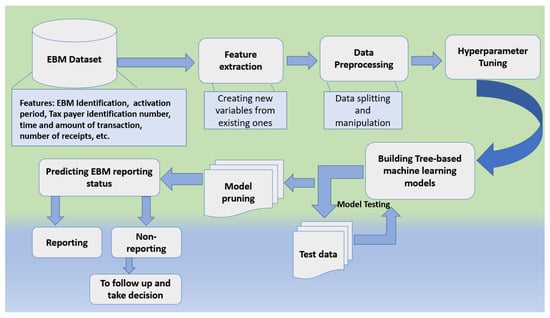
Figure 1.
Pipeline of the study.
From the above figure, a high-level approach for predicting the reporting behavior of electronic billing machines using tree-based machine learning algorithms would follow the following steps.
- EBM data collection: this stage involves data gathering from various data sources which include information on the historical performance of the electronic billing machines, such as the EBM ID, activation period, taxpayer information, receipts, and so on.
- Data pre-processing: clean and pre-process the data to remove missing values, outliers, and irrelevant features. This process also involves feature extraction, data splitting, and so on.
- Model training/selection: choose an appropriate machine learning algorithm based on the nature of the problem and the type of data. In our case, we have considered four main tree-based algorithms: decision trees, random forest, gradient boost, and XGBoost. Train the selected algorithm on the pre-processed data, optimizing its parameters to improve its performance.
- Model evaluation: we evaluate the performance of each trained model using various metrics such as accuracy, precision, recall, F1-score, Log-loss, and AUC-ROC.
- Model pruning/feature selection: select the most relevant features that have a strong influence on the reporting behavior of the machines.
- Prediction: use the model in a real-world/brand new setting to make predictions about the reporting behavior of each available electronic billing machine’s EBM scenario.
3.2. Machine Learning Algorithms
This paper compares tree-based machine learning algorithms such as decision trees, random forest, gradient boosting, and XGBoost to choose the most robust model that can help us solve the problem. This section explains the different models that were considered in our case.
3.2.1. Decision Trees
Decision trees are among the strongest machine-learning algorithms capable of fitting complex datasets and one of the most powerful algorithms available today. They require little preparation time, and they do not even need feature scaling or centering. They make intuitive conclusions that are simple to interpret. White box models are a common term for such models. They produce excellent predictions, and you can verify the calculations they used to create these predictions. However, it is sometimes difficult to explain why the predictions were made in simple words. Despite being easy to comprehend and interpret, they have a tendency to overfit training data [26].
In general, the decision tree algorithm will calculate a metric for each feature in the dataset, and choose the feature that results in the greatest improvement in the metric as the feature to split on at that node. The process is then repeated on each resulting subset until a stopping criterion is reached, such as a minimum number of samples in a leaf or a maximum tree depth [27].
A decision tree can also be used to estimate the likelihood that an instance belongs to a specific class k. It explores the tree to discover this instance’s leaf node, then returns the ratio of training examples of class k in this node. Decision trees make only a few assumptions about the training data (as opposed to linear models, which assume that the data are linear, for example). If the tree structure is left uncontrolled, it will adapt to the training data, fitting it extremely closely, and most likely overfitting it [26].
When using a decision tree, no assumptions are made about the underlying distribution of the data. The shape of the model is not predefined; the model fits in the best possible classification based on the data instead. When the variables are categorical in nature, they provide the best results. In the case of outliers and missing data, the decision tree deals with them with grace [28].
3.2.2. Random Forest
Random forest is a collection of decision trees that are normally trained using the bagging technique, with the maximum sample size set to the size of the training set. Instead of looking for the greatest feature when splitting a node, the random forest method seeks the best feature from a random group of features [29]. The method produces more tree diversity, which (again) pays a stronger bias for a lower variance, resulting in a better overall model. When you develop a tree in a random forest, only a random subset of the features are examined for splitting at each node [26].
It is a powerful model increasingly used in many industries and competitions. In the random forest, a few variables are selected instead of taking all variables, and significant variables always come first in the top layer. The random forest has both low bias and variance errors [28].
In practice, the algorithm for a random forest can be expressed as follows:
For each tree in the forest:
- A subset of the training data, known as a bootstrap sample, is randomly selected to build the tree. A subset of features is also randomly selected.
- A decision tree is grown from the bootstrapped sample by recursively splitting the data into subsets based on the features that result in the largest reduction in impurity.
- Steps one, two, and three are repeated for each tree in the forest.
For prediction, use majority voting (in classification) or averaging (in regression) of the predictions from each tree in the forest to produce the final prediction [29].
Note: The randomness in the random forest algorithm comes from the bootstrapping of the training data and the random selection of features for each split. This results in a diverse set of decision trees that can capture different patterns in the data and reduce the over-fitting that can occur in a single decision tree and improve the overall accuracy of the model.
3.2.3. Gradient Boost
Gradient Boosting is an ensemble learning method for classification and regression problems in machine learning. It combines multiple weak models (often decision trees) to form a strong model that can make accurate predictions [30]. It builds trees one at a time, with each tree trying to correct the mistakes of the previous tree. This results in a model that can capture complex relationships between the features and the target variable. It is a common boosting approach that works by adding predictors to an ensemble in a sequential manner, each one correcting the one before it. Instead of modifying the instance weights at each iteration such as AdaBoost, this technique seeks to adapt the new predictor to the prior predictor’s residual errors. Gradient boost can identify difficult observations and dissect error components to bring in more explanation [30].
The formula for the prediction of a gradient boost model can be written as:
where:
- F(x) is the final prediction for a given input x.
- is the first weak model, which is usually a simple constant or mean value.
- is the mth weak model, for m = 1, 2,…, M.
- ∑ is the summation symbol.
- M is the total number of weak models used in the gradient boost model.
Each weak model is trained to correct the errors made by the previous models. This is performed by computing the gradient of the loss function (such as the mean squared error or cross-entropy) with respect to the predictions of the previous models and adjusting the weak models in the direction of the gradient. The final prediction F(x) is a weighted sum of all the weak models, with the weights being learned during the training process.
3.2.4. Extreme Gradient Boosting (XGBoost)
Extreme gradient boosting (XGBoost) is an open source machine-learning library for gradient-boosting trees. It uses gradient boosting to construct an ensemble of decision trees to make the predictions. It is frequently used to tackle data mining problems [31]. XGBoost uses a more efficient data structure for storing trees, optimized for both memory usage and computation speed [26]. XGBoost was utilized in 17 of the 29 winnings Kaggle projects because it is faster and performs better than other machine learning algorithms. Gradient boosting is used to develop machine learning algorithms in XGBoost. It has great scalability and execution speed, which makes it classically outperform other algorithms. Hyper-parameter tuning, which includes automatically modifying hundreds of “learnable” parameters, can increase the performance of the XGBoost model [28].
The basic algorithm for a single tree in XGBoost is as follows:
where:
- f(x) is the predicted value for input x;
- is the weight assigned to the i-th decision tree;
- is the prediction of the i-th decision tree for input x.
The final prediction is made by combining the predictions of all the decision trees in the ensemble. In XGBoost, the gradient boosting process involves iteratively adding decision trees to the model and adjusting the weights assigned to each tree to minimize the loss function. The optimization algorithm used by XGBoost is known as “regularized gradient boosting [32]”, which helps prevent overfitting and improve model generalization.
3.3. Evaluation Metrics
Various measures were employed to assess a model’s performance and the trained classifier’s generalization capacity. The evaluation metrics are crucial for obtaining the best classifier during classification training.
3.3.1. Confusion Matrix
The confusion matrix is a term used to describe how the optimal solution is predicted in binary classification problems. It is a table containing a column for the actual class and a row for the projected class. Table 2 provides a confusion matrix with total test entries as N. True positive (TP) and true negative (TN) refer to values that have been correctly classified, while false positive (FP) and false negative (FN) refer to the number of values that have been misclassified.
Table 2.
Confusion matrix [33].
- True positive (TP) in the confusion matrix denotes those results in which the expected positive outcomes are the same as the actual positive values [34,35].
- False positive (FP) in the confusion matrix denotes findings in which the projected outcome is negative while the actual values are negative. This is also referred to as a Type 1 Error [34].
- False negative (FN) indicates findings in which a negative outcome is predicted, but the actual values are positive. This is classified as a Type 2 Error and just as harmful as a Type 1 Error [34].
- True negative (TN) results are those in which a negative outcome is predicted, and the actual values are also negative [33].
3.3.2. Precision
This is one of the evaluation measures defining the rate of positive outcomes that were successfully predicted compared to all predicted positive values. This can alternatively be defined as a metric to determine how many positive patterns in a positive class are accurately predicted out of the total predicted patterns [33].
3.3.3. Recall
This indicator represents the proportion of accurately reported positive results compared to all actual positive values. This can alternatively be defined as the number of correct positive results divided by the number of expected positive results [33].
3.3.4. F1 Score
The F-score metric, also known as the F-measure, combines the precision and recall of the model to assess the model’s performance on the dataset on a binary classification problem. An F-score can have a maximum value of 1.0, signifying perfect precision and recall, and a minimum value of 0 when either precision or recall might be zero [34,35].
3.3.5. Accuracy
This metric assesses the overall model performance by estimating the ratio of properly predicted positive and negative values with respect to total of assessed cases [33].
3.3.6. Binary Cross-Entropy (Logarithmic Loss)
A classification model’s performance is measured by cross-entropy loss, also known as log loss, whose output is a probability value between 0 and 1. As the predicted probability varies from the actual label, cross-entropy loss grows. In machine learning, when calculating error rates between 0 and 1, cross-entropy and log loss resolve to the same thing, even if they differ slightly depending on the context [35].
3.3.7. Area under Receiver Characteristic Curve (AUC-ROC)
The AUC-ROC is one of the most extensively used ranking metrics for comparing learning algorithms. In contrast to the threshold and probability metrics, the AUC-ROC value represents a classifier’s overall ranking performance. The AUC-ROC was proved to be conceptually and empirically superior to the accuracy measure for monitoring classifier performance and selecting an optimal solution during classification training. Although AUC-ROC performed well in evaluation and discrimination processes, it had a high computational cost, especially when discriminating a large number of generated solutions in multi-class circumstances [34].
4. Data Processing
In this subsection, we describe the data we used in this study, and we will highlight how features were extracted to generate more variables. This section is broken into the following subsections: Section 4.1 describes the data used. Section 4.2 explains the data cleaning process. Feature extraction and data splitting procedures that were employed on the data are highlighted in Section 4.3 and Section 4.4, respectively.
4.1. Data Description
Normally, each active EBM is supposed to send to the RRA database all sales information updates anytime it performs a transaction. This information includes the information related to its identification (ID), taxpayer identification number (TIN) involved, the time of the transaction, goods purchased, amount, etc. In this study, we used anonymized EBM data from the RRA database. No personal information of the taxpayers was published and remains strictly confidential. Out of the available EBM data, we were given 852,239 anonymized records which were approximately 10 percent of all EBMs records until May 2018. Aside from that, we were also given information related to the number of receipts issued by each EBM on a daily basis. Finally, we also used the information related to the scale of the business (either small, medium, or large), the geographical location of the business, and the type of the business (either individual or not).
Typically, every EBM should indicate the activation date or period and have an SDC that helps report every transaction. The EBM should have a CIS that sends all receipt-related information to SDC. The receipt information to be sent by CIS should include the taxpayer’s name and identification number, the address at which the sale takes place, the identification number of the client if any, the receipt and transaction type, the item name, type and quantity, and the price and the sales amount. The receipt should also clearly show the tax rate, the tax added to the sale amount, and the means of payment. The other important information that has to be made available is the date and time stamped by SDC, the sequential receipt type number, SDC identification number, date and time stamped by CIS, and machine registration code (MRC).
4.2. Data Cleaning
It is evident that an EBM can send as many updates as possible during the day depending on their daily transactions. In case there is a problem limiting it to pushing the data, such as network or power issues, the EBM will send all the sales records the next time it goes online. At this stage, the repeating information “just for the purpose of this study” needs to be aggregated to fulfill the reporting requirements.
A tax period: This is a period of 30 days which accounts from the 16th of a month to the 15th of the next month. According to the data we have from January 2013 to May 2018, there are 65 periods. The following rules were followed and carried out on the data during the data cleaning process:
- An EBM is said to have reported if it has sent its updates at least once during a certain period.
- The aggregated data were then labeled with Boolean values, namely "1” meaning that the EBM reported or a “0” in case there was a missing reporting period after the time of activation.
- In order to facilitate the analysis, the time of activation was also converted into the period of activation following the algorithm shown in Listing 1.
- The labeling mechanism was also applied to the receipt information and total sales to avoid bias in the data and uniformity. This means that an EBM which issued a receipt at least once during a certain period was labeled with a Boolean value “1” and “0” in case it did not.
- In order to balance the data (for instance, an EBM might have been activated in period “40” but it is analyzed with an EBM that has been activated in the second period), the periods in which a given EBM was not yet activated were labeled with a half chance, i.e., “0.5” for the entire periods before the activation. This also applies to receipts and total sales data.
- The data regarding the characteristics of the business were later merged with the entire cleaned dataset.
| Listing 1. Period assignment pseudocode. |
 |
4.3. Feature Extraction
EBM historical data: Following all three categories, namely monthly reporting, receipts, and total sales, where each period among 64 is considered as a feature, we can automatically have 192 features. In this case, the column of interest is the reporting information for the 65th period. In addition to that, we also considered the EBM activation periods and the business characteristics as among the features. Moreover, we have also extracted different aggregation features from the existing features in order to have more quantifiable features. For instance, for each EBM, we calculated the aggregation on reporting variation from one, two, four, six, twelve, and twenty-four periods back from the maximum period. For each of the variations, the aggregation results were used to extract and label the levels of reporting with respect to the maximum reporting variation.
Listing 2 shows an example in which we aggregated features from six periods back. In this example, the maximum reporting amount in six periods is equal to six; four different reporting levels were labeled:
- data[’repo_6back_all?’]: reported fully (6 over 6);
- data[’repo_6back_70%_up?’]: reported 4 to 5 inclusive;
- data[’repo_6back_50%_down?’]: reported 2 to 3 inclusive;
- data[’repo_6back_17%_down?’]: reported only once or less.
This new feature’s names change according to the variation, and it was completely arbitrary to reflect the nearest level. It is also worth noting that the different number of levels was derived arbitrarily depending on the variation. The whole process of the feature extraction mechanism on the reporting data was also performed on the other feature columns, such as receipts and sales.
Business characteristics: The data on business characteristics contain anonymized information such as the scale of the business (small, medium, or large), the region of the business (Kigali City, east, west, north, and south), and finally the type of business (individual or not). Because most of the business characteristics data were in textual form, we reassigned them with Boolean values to meet the category criteria. For each business characteristic, the considered class was translated into a feature which was assigned a value of 1 in the column if it only satisfied such a characteristic condition, and a value of 0 if it was not. For instance, a feature entry that describes whether the business is individual will be assigned 1 or 0 accordingly. Different combinations were also defined, such as an EBM developed from a small firm in Kigali on an individual scale. This means that a new column feature would be added that displays a 1 when all three conditions are met and a 0 otherwise.
| Listing 2. Six-month reporting example. |
 |
4.4. Data Splitting
After all, the training dataset resulted in 236 features on 2136 EBMs. At this stage, there were no missing values, no duplicates, and no outliers in the data because all variables were between 0 and 1 except for the EBM activation period. The dataset was split into training (80%), test (10%), and validation (10%).
5. Study Evaluation and Analysis
In this section, we present the evaluation research question that we aimed to answer. We will present experimental results from our study by focusing on answering one of the questions of interest. This section is structured as follows. First, we will present the research question in Section 5.1, Section 5.2 presents the model performance results by focusing on answering the first research questions.
5.1. Research Questions
To evaluate the performance of the proposed approach, we choose to focus on answering the following research questions:
- ▪
- RQ1:What is the best model among those proposed, and how effective is it in tackling the problem at hand?
- ▪
- RQ2:To what extent does our proposed approach could potentially assist tax administrators in increasing taxpayer compliance?
- ▪
- RQ3:To what extent does our proposed approach advance the state of research in comparison to the existing approach?
5.2. Model Performance: Answer to RQ1
To better answer the research question “What is the best model among those proposed, and how effective is it in tackling the problem at hand?”, we compared four models based on the evaluation metrics, such as the precision score, recall score, F1 score, accuracy, log-loss, and the AUC-ROC. The revealed best model is effective since it has the highest predictive accuracy compared to others. This model also has a high recall score, which is an important metric for predicting the EBM’s future reporting behavior. Four tree-based machine learning algorithms were taken into account during the analysis: gradient boost, random forest, decision trees, and XGBoost. Table 3 displays the results of how the chosen methods performed in relation to the metrics considered.
Table 3.
Performance of models before pruning.
According to the above Table 3, the performance of the different models based on log loss is as follows: XGBoost (0.271), random forest (0.334), gradient boosting (0.367), and decision tree (5.227). The accuracy results are as follows: random forest (0.903), XGBoost (0.897), gradient boosting (0.889), and decision tree (0.847). The precision scores for the evaluated classifiers are random forest (0.904), XGBoost (0.897), gradient boosting (0.891), and decision tree (0.845). Considering the recall score, random forest (0.900), XGBoost (0.894), gradient boosting (0.885), and decision tree (0.846) and the F1 score for each model was as follows, random forest (0.902), XGBoost (0.895), gradient boosting (0.887), and decision tree (0.846).
5.2.1. Feature Importance
The random forest model was used as the base model to determine the importance of different dependent variables based on the results of the model performances. The top five important features, in this case, were discovered to be: EBM activation period with an overall importance of 8.13 percent, EBM receipt issuing status of the 56th, 62nd, 63rd and receipt issuing status of 64th month with an importance of 7.56 percent, 5.26 percent, 4.18 percent, and 3.98 percent, respectively. Figure 2 below depicts the top 10 features most associated with EBM non-reporting, whereas Table A1 in Appendix A in the appendix displays all 41 features that were considered as optimal features for pruning, as well as their relative importance to the response variable.
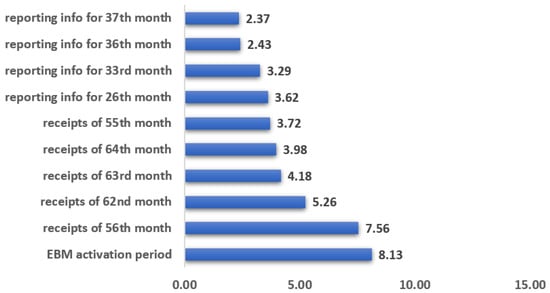
Figure 2.
Relative importance of the top 10 features.
5.2.2. Model Pruning
The model was pruned based on the most important features identified previously. Only 41 of the 236 features deemed optimal were selected. We used the random forest for this because of its robustness and high performance in our study. We also ran a 10-fold cross-validation on the chosen features to see how well they avoided over-fitting. At this point, we run the pruned training data through all of the models to see how they perform. The random forest performed admirably in comparison to the others, as expected. Figure 3 and Figure 4 shows a quick overview of the chosen performance before and after pruning.
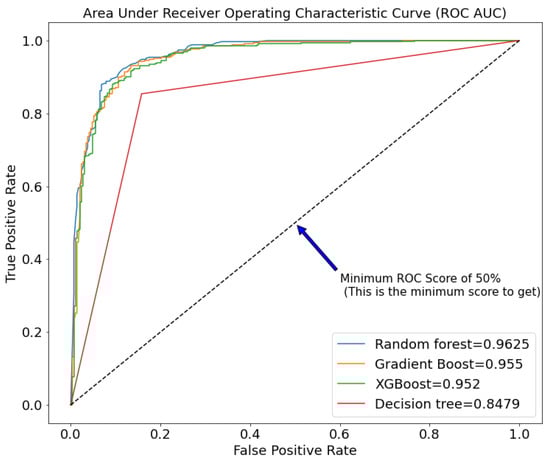
Figure 3.
ROC AUC of different tree-based machine learning models before pruning.
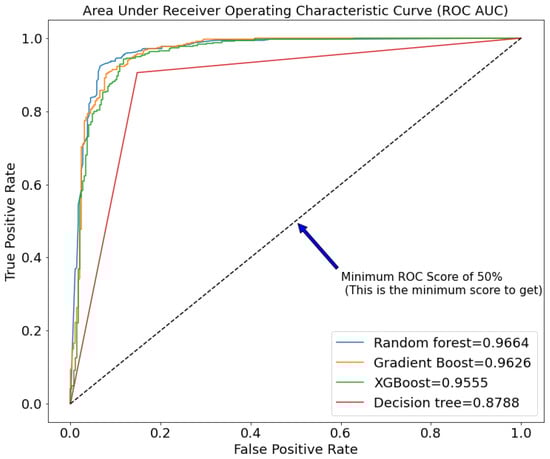
Figure 4.
ROC AUC of different tree-based machine learning models after pruning.
According to Table 4, the log loss of the models improved for all of them, with gradient boosting performing significantly better than others, (gradient boosting (0.230), XGBoost (0.311), random forest (0.409), and decision tree (4.096)). In terms of actual prediction accuracy, random forest (0.923) outperformed XGBoost (0.912), gradient boosting (0.909), and decision tree (0.879)). The random forest outperformed the others in terms of other evaluation metrics such as precision, recall, and F1 score.
Table 4.
Performance of models after pruning.
Figure 3 and Figure 4 compare the performance of the chosen models before and after pruning. Random forest (0.9625 and 0.9664), gradient boost (0.955 and 0.9626), XGBoost (0.952 and 0.9555), and decision trees have the highest ROC AUC in both Figures (0.8479 and 0.8788). This clearly shows a very close race between random forest and gradient boost, but due to random forest’s robustness, we decided to stick with it.
6. Discussion
This study used four models such as the decision tree, random forest, gradient boosting, and XGBoost. Their performance in terms of ROC AUC, accuracy, log loss, recall score, precision score, and F1 score was compared to choosing the good models among them. The most robust model is the one with the highest precision score, high recall score, high ROC AUC, high F1 score, high accuracy, and the lowest log loss. In this section, we will discuss our approach by focusing on answering two of the research questions, namely those mentioned in Section 6.1 and Section 6.2, as well as the limitations we faced during our development in Section 6.3.
Considering the precision scores for all models highlighted in Table 3 of the values of the evaluation metrics before pruning and Table 4 after the pruning, the random forest was found to be the best-performing model. The gradient boost model comes second, XGBoost is the third one, and the last model based on precision is the decision tree. Based on the recall score, the first model with the highest recall score among the others is the random forest, then the gradient boosting, XGBoost, and the last one is the decision tree. The model with the highest accuracy is the random forest, while the one with the lowest compared to others is the decision tree. When the F1 score is evaluated, the random forest scores higher than the others, while the decision tree scores lower. The log loss of the four models was also evaluated. The model with the lowest log loss is the gradient boosting, while the one with the highest log loss is the decision tree.
As previously stated, the model pruning process was based on the best-performing model, in this case, the random forest. Figure 3 and Figure 4 display the model’s performance following the pruning procedure. Based on the aforementioned findings from the study’s various evaluation metrics, we draw the conclusion that random forest was the best-performing model for our case study. This is further reinforced by its outcomes when compared to other classifiers before and after pruning in terms of random forest precision, recall, F1 score, accuracy, and ROC AUC. The importance of each feature was also measured using this model, revealing all the variables that are more related to the EBMs reporting.
6.1. Approach Benefits: Answer to RQ2
This part answers the second research question “To what extent could our proposed approach potentially assist tax administrators in increasing taxpayer compliance?”
This work presented using a tree-based model to identify and predict the potential future reporting behavior of EBMs. The primary purpose of the proposed approach was to assist tax administrators in preventing tax fraud as they receive massive amounts of data that may be difficult to interpret. We are proposing an approach to automatically identify as well as predict defaulting EBM through the use of a machine learning analysis approach. This could potentially help the tax admins gain insight into EBM user misbehavior and act accordingly in advance.
That will potentially ease the work of the EBM back officer by providing them with a robust model to tackle the non-reporting of EBMs by even confidently knowing the machines that are more likely to stop to report based on their historical behavior. It will also help predict a machine’s behavior based on its historical information of it so that the owner of the machine will obtain the notification related to its EBM ahead of time. Regular analysis, follow-up, and monitoring will increase the number of receipts and the reporting rate of EBMs, which will increase the VAT revenues and boost compliance in general, which is the primary goal of EBM.
According to the findings of this study, it is apparent that once this work is integrated into the standard working stack, it will significantly affect the work performance. Because most tax administrators are not programmers, it will be extremely beneficial to establish a robust platform that will assist in automatically reporting the predictions made by the developed model. This can also be used to showcase the live performance of EBMs. This platform can also assist in bridging the communication gap between EBM practitioners and anyone who needs to access or comment on forecasted data. Furthermore, developing such a platform can aid in querying specific and forecasting results based on specific SDC or TIN in a very quick and straightforward manner.
6.2. Research Contribution: Answer to RQ3
This part answers the third research question “To what extent does our proposed approach advance the state of research in comparison to the existing approach?”
There have been a number of initiatives that have attempted to address tax-fraud issues, with the majority of them focused on EBM data. For instance, in [9], a random forest model was employed to detect and predict invoices with late payments and difficult clients. We regard this as a small aspect of our work because our approach took into account not only the receipt information but also additional aspects such as the reporting behavior and business characteristics. Despite employing the same model, we achieved a higher accuracy of 92.3% compared to their 89%.
Although the works such as [7,10] explicitly focused on the use of AI models to help tax administration identify tax fraud through the deep analysis of invoice data, their approaches do not focus on EBM data and their goal was not on understanding the future EBM behaviors. Ultimately, other works such as [7,8] suggested the use of multi-layer perceptron (MLP) by relying on historical invoice data, however, their focus was not on EBM reporting behavior, but rather on detecting anomaly identification, fake invoices, and malicious attacks—which we consider to be beyond our scope.
We agree and recognize what research articles concluded regarding the impact of EBMs on tax compliance, stating that “EBM machines alone cannot guarantee the expected compliance” [2]. They must be accompanied by additional significant effort, spending money on both the administration’s and taxpayer’s sides, and putting in place some EBM installation, support, and maintenance plan. Despite the tax administration’s best efforts, some taxpayers continue to provide receipts incorrectly, preventing the EBM from achieving its goal. Most recent research has concentrated on the impact of EBM on VAT revenues and compliance rather than on EBM reporting behavior by itself. Despite the fact that this is also critical for assessing the impact of EMBs.
As a result, we can confidently conclude that it is possible to automate the EBM compliance monitoring process and anticipate its future behavior, thereby improving tax compliance and limiting tax fraud. We clearly demonstrated how our proposed approach could potentially offer significant assistance much more than the existing approaches. We highlighted various crucial elements influencing reporting behavior and how our method can help. Finally, we believe that our approach can assist RRA in recovering money lost due to EBM non-reporting issues, which might potentially increase tax compliance, particularly VAT tax compliance.
6.3. Study Limitations
As stated in our research, we utilized a dataset that contained 10% of all available data. Although we are confident in the study and the model’s durability, having access to the entire dataset can improve the model’s robustness while limiting the possibility of model over-fitting. Furthermore, querying the complete dataset can be problematic due to RRA’s data policy and the volume of the EBM data. As a result, we were granted SDC data from 2013 to 2018 for experiment purposes only, which is no longer current at the time of writing of this article. Although this may not appear to be a very big issue, integrating current data may boost the model’s reliability in the case of live data forecasts. From this, we can draw a recommendation to the institutions that own the data to make the data available to researchers so that they can be used. This will help the institutions in return to design some policies and take some measures based on the facts from the data.
7. Conclusions and Future Work
In this paper, we investigated tree-based machine learning models to conduct an extensive tree-based machine learning analysis on 10% of the Rwanda Revenue Authority Electronic Billing Machine data (RRA). Several methods were compared, and the random forest was determined to be the most robust and effective for this study. With an overall importance of 8.13 percent, this study demonstrated that the EBM activation period was found to be one of the critical factors determining whether the EBM will report. Through well-defined research questions, the analysis of results, and constructive discussions, this paper presented how our approach could potentially provide RRA staff with a significant boost in their efforts to achieve the goal of EBMs’ timely monitoring to increase VAT compliance. This will also assist RRA in anticipating EBMs that are likely to stop reporting so that a follow-up can be conducted beforehand or taxpayers can be notified about the behavior of their EBMs. It will also provide a robust model to predict EBM non-reporting.
In the future, we plan to focus on implementing an automated dashboard to aid in fast, easy, and timely intervention while dealing with EBM reporting issues. It will also be beneficial to apply other machine learning models, not only tree-based but artificial neural networks, as well as deep learning techniques to the current data, to see whether the results can be improved by extracting the machine receipts data, such as goods that are being sold, to have an even more robust predicting ground model. It is also better to consider predicting EBM behavior change, such as from reporting to non-report and vice versa. Finally, it would be even better to deeply assess the specific problems of the EBM devices that affect their reporting and include such constraints in the model to increase the transparency in the process between the tax administration and the taxpayers.
Author Contributions
Conceptualization, B.F.M., J.F.I., I.K., J.N., and D.H.; methodology, B.F.M.; software, J.F.I. and B.F.M.; validation, D.H., I.K., and J.N.; formal analysis, B.F.M.; data curation, J.F.I. and B.F.M.; writing—original draft preparation, B.F.M. and J.F.I.; writing—review and editing, B.F.M., I.K., J.N. and D.H.; supervision, D.H. and J.N. All authors have read and agreed to the published version of the manuscript.
Funding
This work was supported by the World Bank funding (ID: ESC 91) through African Centre of Excellence in Data Science, University of Rwanda.
Data Availability Statement
Not applicable.
Acknowledgments
We would like to acknowledge Felix Uwizeye for his contribution toward the initial development of the approach. We would also want to thank the Rwanda Revenue Authority for providing anonymized data to help us test and validate our approach.
Conflicts of Interest
The authors declare no conflict of interest.
Appendix A
Table A1.
Relative importance of the features and their description.
Table A1.
Relative importance of the features and their description.
| Feature Description | Feature Name | Importance (%) | |
|---|---|---|---|
| 1 | EBM activation period | period_act | 8.13 |
| 2 | Receipts of 56th month | rec_56 | 7.56 |
| 3 | Receipts of 62nd month | rec_62 | 5.26 |
| 4 | Receipts of 63rd month | rec_63 | 4.18 |
| 5 | Receipts of 64th month | rec_64 | 3.98 |
| 6 | Receipts of 55th month | rec_55 | 3.72 |
| 7 | Reporting info for 26th month | repo_26 | 3.62 |
| 8 | Reporting info for 33rd month | repo_33 | 3.29 |
| 9 | Reporting info for 36th month | repo_36 | 2.43 |
| 10 | Reporting info for 37th month | repo_37 | 2.37 |
| 11 | Reporting info for 44th month | repo_44 | 2.32 |
| 12 | Reporting info for 45th month | repo_45 | 2.23 |
| 13 | Reporting info for 47th month | repo_47 | 2.20 |
| 14 | Reporting info for 49th month | repo_49 | 2.02 |
| 15 | Reporting info for 52nd month | repo_52 | 2.00 |
| 16 | Reporting info for 54th month | repo_54 | 1.97 |
| 17 | Reporting info for 55th month | repo_55 | 1.79 |
| 18 | Reporting info for 56th month | repo_56 | 1.73 |
| 19 | Reporting info for 57th month | repo_57 | 1.60 |
| 20 | Reporting info for 58th month | repo_58 | 1.54 |
| 21 | Reporting info for 59th month | repo_59 | 1.32 |
| 22 | Reporting info for 60th month | repo_60 | 1.29 |
| 23 | Reporting info for 61st month | repo_61 | 1.26 |
| 24 | Reporting info for 62nd month | repo_62 | 0.93 |
| 25 | Reporting info for 63rd month | repo_63 | 0.92 |
| 26 | Reporting info for 64th month | repo_64 | 0.80 |
| 27 | Total sales info for 60th month | totSales_60 | 0.74 |
| 28 | Total sales info for 61st month | totSales_61 | 0.73 |
| 29 | Total sales info for 64th month | totSales_64 | 0.73 |
| 30 | Total sales info for 56th month | totSales_56 | 0.71 |
| 31 | Reported one month back?(ref: 65th month) | 1back_? | 0.70 |
| 32 | Reported two months back?(ref: 65th month) | repo_2back_all? | 0.63 |
| 33 | Reported 50% of the two months back?(ref: 65th month) | repo_2back_50%? | 0.61 |
| 34 | Did not report in the last 2 months back?(ref: 65th month) | repo_2back_none? | 0.60 |
| 35 | Reported all last 4 months back?(ref: 65th month) | repo_4back_all? | 0.50 |
| 36 | Did it report 50% or less for the last 4 months back?(ref: 65th month) | repo_4back_50%_up? | 0.49 |
| 37 | Did it report 25% or less for the last 4 months back?(ref: 65th month) | repo_4back_25%_down? | 0.48 |
| 38 | Did it report 17% or less for the last 4 months back?(ref: 65th month) | repo_4back_17%_down? | 0.45 |
| 39 | Is the business not individual? | NON INDIVIDUAL | 0.45 |
| 40 | The business is located in Kigali city | KIGALI CITY | 0.45 |
| 41 | Is the business of type: small and it is not individual | Small_nonIndie | 0.44 |
References
- Cobham, A. Taxation Policy and Development. Available online: https://www.files.ethz.ch/isn/110040 (accessed on 1 April 2022).
- Casey, P.; Castro, P. Electronic Fiscal Devices (EFDs) An Empirical Study of their Impact on Taxpayer Compliance and Administrative Efficiency. IMF Work. Pap. 2015, 15, 56. [Google Scholar] [CrossRef]
- Steenbergen, V. Reaping the Benefits of Electronic Billing Machines Using Data-Driven Tools to Improve VAT Compliance; Working Paper; International Growth Centre: London, UK, 2017. [Google Scholar]
- Eissa, N.; Zeitlin, A.; Using mobile technologies to increase VAT compliance in Rwanda. Unpublished Working Paper. 2014. Available online: https://scholar.google.com/scholar?hl=en&as_sdt=0%2C5&q=Using+mobile+technologies+to+increase+VAT+compliance+in+Rwanda&btnG= (accessed on 1 February 2023).
- Rwanda Revenue Authority. Tax Statistics Publication in Rwanda. Available online: https://www.rra.gov.rw/Publication/ (accessed on 1 July 2022).
- Botchey, F.E.; Qin, Z.; Hughes-Lartey, K. Mobile Money Fraud Prediction—A Cross-Case Analysis on the Efficiency of Support Vector Machines, Gradient Boosted Decision Trees, and Naïve Bayes Algorithms. Information 2020, 11, 383. [Google Scholar] [CrossRef]
- Andrade, J.P.A.; Paulucio, L.S.; Paixao, T.M.; Berriel, R.F.; Carneiro, T.C.J.; Carneiro, R.V.; De Souza, A.F.; Badue, C.; Oliveira-Santos, T. A machine learning-based system for financial fraud detection. In Proceedings of the Anais do XVIII Encontro Nacional de Inteligência Artificial e Computacional, SBC, online, 29 November 2021; pp. 165–176. [Google Scholar]
- Tang, P.; Qiu, W.; Huang, Z.; Chen, S.; Yan, M.; Lian, H.; Li, Z. Anomaly detection in electronic invoice systems based on machine learning. Inf. Sci. 2020, 535, 172–186. [Google Scholar] [CrossRef]
- Hu, P. Predicting and Improving Invoice-to-Cash Collection through Machine Learning. Ph.D. Thesis, Massachusetts Institute of Technology, Cambridge, MA, USA, 2015. [Google Scholar]
- Siarka, P.; Chojnacka-Komorowska, A. Modern technologies for VAT fraud detection. In Fraud in Accounting and Taxation and Its Detection; Publishing House of Wroclaw University of Economics and Busine: Wrocław, Poland, 2022; p. 95. [Google Scholar]
- Khurana, P.; Diwan, U. A comparison of psychological factors for tax compliance: Self employed versus salaried people. Int. J. Manag. Soc. Sci. 2014, 2, 107–115. [Google Scholar]
- Murphy, R. The Cost of Tax Abuse. A Briefing Paper on the Cost of Tax Evasion Worldwide. Available online: https://openaccess.city.ac.uk/id/eprint/16561/1/cost_of_tax_ (accessed on 1 February 2022).
- Jackson, B.; Milliron, V. Tax compliance research: Findings, problems and prospects. Int. J. Account. Lit. 1986, 5, 125–165. [Google Scholar]
- Riahi-Belkaoui, A. Relationship between tax compliance internationally and selected determinants of tax morale. J. Int. Account. Audit. Tax. 2004, 13, 135–143. [Google Scholar] [CrossRef]
- Trivedi, V.; Shehata, M.; Mestelman, S. Attitudes, Incentives and Tax Compliance; Department of Economics Working Papers; McMaster University: Hamilton, ON, USA, 2004. [Google Scholar]
- Saad, N. Tax Knowledge, Tax Complexity and Tax Compliance: Taxpayers’ View. Procedia-Soc. Behav. Sci. 2014, 109, 1069–1075. [Google Scholar] [CrossRef]
- Ngigi, E.W. The Effect of Electronic Tax Register System on the Duration of Value Added tax Audit in Kenya. Doctoral Dissertation, University of Nairobi, Nairobi, Kenya, 2011. [Google Scholar]
- Chege, J.M. The Impact of Using Electronic tax Register on Value Added Tax Compliance in Kenya: A case Study of Classified Hotels in Nairobi. Doctoral Dissertation, University of Nairobi, Nairobi, Kenya, 2010. [Google Scholar]
- Ikasu, E. Assessment of Challenges Facing the Implementation of Electronic Fiscal Devices (EFDs) in Revenue Collection in Tanzania. Int. J. Res. Bus. Technol. 2014, 5, 349. [Google Scholar] [CrossRef]
- Mascagni, G.; Monkam, N.; Nell, C. Unlocking the Potential of Administrative Data in Africa: Tax Compliance and Progressivity in Rwanda; International Centre for Tax & Development, Working Paper; International Centre for Tax & Development: Brighton, UK, 2016; Volume 56. [Google Scholar]
- Ranaldi, L.; Pucci, G. Knowing Knowledge: Epistemological Study of Knowledge in Transformers. Appl. Sci. 2023, 13, 677. [Google Scholar] [CrossRef]
- Murorunkwere, B.F.; Tuyishimire, O.; Haughton, D.; Nzabanita, J. Fraud detection using neural networks: A case study of income tax. Future Internet 2022, 14, 168. [Google Scholar] [CrossRef]
- Bel, N.; Bracons, G.; Anderberg, S. Finding Evidence of Fraudster Companies in the CEO’s Letter to Shareholders with Sentiment Analysis. Information 2021, 12, 307. [Google Scholar] [CrossRef]
- Humski, L.; Vrdoljak, B.; Skocir, Z. Concept, development and implementation of FER e-invoice system. In Proceedings of the SoftCOM 2012, 20th International Conference on Software, Telecommunications and Computer Networks, Split-Primosten, Croatia, 18–20 September 2012; pp. 1–5. [Google Scholar]
- Shao, P.E.; Dida, M. The Implementation of an Enhanced EFD System with an Embedded Tax Evasion Detection Features: A Case of Tanzania. J. Inf. Syst. Eng. Manag. 2020, 5. [Google Scholar] [CrossRef] [PubMed]
- Geron, A. Hands-On Machine Learning with Scikit-Learn, Keras, and TensorFlow: Concepts, Tools, and Techniques to Build Intelligent Systems, 2nd ed.; O’Reilly Media, Inc.: Sebastopol, CA, USA, 2019. [Google Scholar]
- Rokach, L.; Maimon, O. Decision Trees. In Data Mining and Knowledge Discovery Handbook; Maimon, O., Rokach, L., Eds.; Springer: Boston, MA, USA, 2005; pp. 165–192. [Google Scholar] [CrossRef]
- Dangeti, P. Statistics for Machine Learning, 1st ed.; Packt Publishing, Limited: Birmingham, AL, USA, 2017. [Google Scholar]
- Liu, Y.; Wang, Y.; Zhang, J. New Machine Learning Algorithm: Random Forest. In Proceedings of the Information Computing and Applications, Chengde, China, 14–16 September 2012; Liu, B., Ma, M., Chang, J., Eds.; Springer: Berlin/Heidelberg, Germany, 2012; pp. 246–252. [Google Scholar] [CrossRef]
- Natekin, A.; Knoll, A. Gradient boosting machines, a tutorial. Front. Neurorobot. 2013, 7, 21. [Google Scholar] [CrossRef] [PubMed]
- Dhieb, N.; Ghazzai, H.; Besbes, H.; Massoud, Y. Extreme Gradient Boosting Machine Learning Algorithm For Safe Auto Insurance Operations. In Proceedings of the 2019 IEEE International Conference on Vehicular Electronics and Safety (ICVES), Cairo, Egypt, 4 September 2019; pp. 1–5. [Google Scholar] [CrossRef]
- Cortes, C.; Mohri, M.; Storcheus, D. Regularized Gradient Boosting. In Proceedings of the Advances in Neural Information Processing Systems, Vancouver, BC, Canada, 8–14 December 21019; Wallach, H., Larochelle, H., Beygelzimer, A., d’Alché-Buc, F., Fox, E., Garnett, R., Eds.; Curran Associates, Inc.: Red Hook, NY, USA, 2019; Volume 32. [Google Scholar]
- Hossin, M.; Sulaiman, M.N. A Review on Evaluation Metrics for Data Classification Evaluations. Int. J. Data Min. Knowl. Manag. Process 2015, 5, 1–11. [Google Scholar] [CrossRef]
- Vujovic, Ž.D. Classification Model Evaluation Metrics. Int. J. Adv. Comput. Sci. Appl. 2021, 12, 120670. [Google Scholar] [CrossRef]
- Kull, M.; Filho, T.S.; Flach, P. Beta calibration: A well-founded and easily implemented improvement on logistic calibration for binary classifiers. In Proceedings of the 20th International Conference on Artificial Intelligence and Statistics, Ft. Lauderdale, FL, USA, 20–22 April 2017; Singh, A., Zhu, J., Eds.; Volume 54, pp. 623–631. [Google Scholar]


Disclaimer/Publisher’s Note: The statements, opinions and data contained in all publications are solely those of the individual author(s) and contributor(s) and not of MDPI and/or the editor(s). MDPI and/or the editor(s) disclaim responsibility for any injury to people or property resulting from any ideas, methods, instructions or products referred to in the content. |
© 2023 by the authors. Licensee MDPI, Basel, Switzerland. This article is an open access article distributed under the terms and conditions of the Creative Commons Attribution (CC BY) license (https://creativecommons.org/licenses/by/4.0/).