
A Study on Influential Features for Predicting Best Answers in Community Question-Answering Forums


Abstract
:1. Introduction
2. Related Works
2.1. User Behavior and Roles
2.2. Quality of CQA Sites
2.3. Quality of Questions and Answers
2.4. Contributions
3. Features for Predicting Best Answers
3.1. Content Similarity
3.2. Linguistic Features
- : The post length measured in characters, excluding characters in source code when it is present as part of an answer.
- : The number of words in the longest sentence from the text of an answer. It is assumed that long sentences are harder to read and understand than shorter ones, thus affecting the quick understanding of an answer.
- : The average number of words per sentence. This is also an indication of the presence of long and possibly difficult to understand sentences.
- : The average number of characters for words. This feature is related to the use of long words, which are assumed to also be more difficult to read than shorter ones.
- : The number of complex words in the post. Based on the criteria used in [30], a word is considered complex if it has three or more syllables.
- : The number of misspelled words. Some posts contain numerous misspelled words, which is related to informality and may affect the clarity of an answer’s writing. A dictionary was used to check for misspelled words (http://jazzy.sourceforge.net/). The final number of misspelled words is estimated by looking up the detected words in a dictionary to confirm they are English words and that they are not a stop-word in the Onix (https://www.lextek.com/manuals/onix/stopwords1.html) corpus nor a contraction or a digit.
- : The number of source code lines. Since the collected dataset contains a set of threads with the tag java, the number of source code lines is computed as the number of times the semicolon symbol “;” appears among open brackets. For every for sentence appearing in the code, 2 is subtracted from the number of lines due to its formal syntax. The semicolon in the heading of a for sentence separates the variable initialization, the condition and the increment of the control variable.
- : The number of links existing in the answer, which indicates references to external material to support an answer. This features counts the number of times the HTML tag “<a href =” appears in the response.
3.3. Readability Features
- ARI (Automated Readability Index) [38]: This metric outputs a number which approximates the grade level needed to comprehend a given text. Higher scores indicate that the text requires a higher level of education to be understood than those with lower scores. ARI is measured by
- GFI (Gunning Fog Index) [39]: The Gunning Fog index of a post is calculated using the average sentence length and the percentage of complex words. A higher score indicates easier-to-understand content, and it is calculated as
- FRES (Flesch Reading Ease Formula) [40]: The FRES formula is used to assess the difficulty of a reading passage. It is based on the number of syllables within a word. Higher FRES scores indicate the text is easier to understand.
3.4. Additional Content Elements
- : It is determined by the existence of the HTML tag in the response.
- : To determine the existence of an example within an answer, we search for the words , or , in the text.
- : It is determined by the existence of the HTML tag “<a href =” in the response.
3.5. Interaction Features
- : The time span between the moment the question was posted in the forum and the moment which it was answered. It can be presumed that quick responses can be rapidly adopted as the best answer if they satisfy the formulated information need. This feature is defined as the difference in days between question and answer, as indicated in Equation (5).
- : The time span between the moment the question was posted in the forum and the moment the answer was deemed the best answer by the user who posted the question. It is calculated in the same way as .
3.6. Post History
- : The age in days of the answer from the moment it was published.
- : The number of answers in the thread.
- : The number of comments received by the answer.
4. Materials and Methods
4.1. Data Description
4.2. Methodology
5. Experimental Evaluation
6. Conclusions
Author Contributions
Funding
Data Availability Statement
Conflicts of Interest
References
- Srba, I.; Bielikova, M. A comprehensive survey and classification of approaches for community question answering. ACM Trans. Web TWEB 2016, 10, 1–63. [Google Scholar] [CrossRef]
- Neshati, M. On early detection of high voted Q&A on Stack Overflow. Inf. Process. Manag. 2017, 53, 780–798. [Google Scholar]
- Shah, C.; Pomerantz, J. Evaluating and predicting answer quality in community QA. In Proceedings of the 33rd International ACM SIGIR Conference on Research and Development in Information Retrieval, Geneva, Switzerland, 19–23 July 2010; ACM: Frisco, TX, USA, 2010; pp. 411–418. [Google Scholar]
- Burel, G.; Mulholland, P.; Alani, H. Structural normalisation methods for improving best answer identification in question answering communities. In Proceedings of the 25th International Conference Companion on World Wide Web, Montreal, QC, Canada, 11–15 April 2016; International World Wide Web Conferences Steering Committee: Geneva, Switzerland, 2016; pp. 673–678. [Google Scholar]
- Niemann, M.M. The Duality of Expertise: Identifying Expertise Claims and Community Opinions within Online Forum Dialogue. Ph.D. Thesis, Monash University, Melbourne, Australia, 2015. [Google Scholar]
- Gkotsis, G.; Stepanyan, K.; Pedrinaci, C.; Domingue, J.; Liakata, M. It’s all in the content: State of the art best answer prediction based on discretisation of shallow linguistic features. In Proceedings of the 2014 ACM Conference on Web Science, Bloomington, IN, USA, 23–26 June 2014; ACM: Frisco, TX, USA, 2014; pp. 202–210. [Google Scholar]
- Surowiecki, J. The Wisdom of Crowds: Why the Many are Smarter than the Few and How Collective Wisdom Shapes Business, Economies, Societies and Nations, 1st ed.; Time Warner Books UK: London UK, 2004; p. 320. [Google Scholar]
- Roy, P.K.; Saumya, S.; Singh, J.P.; Banerjee, S.; Gutub, A. Analysis of Community Question-Answering issues via machine learning and deep learning: State-of-the-art review. CAAI Trans. Intell. Technol. 2023, 8, 95–117. [Google Scholar] [CrossRef]
- Adamic, L.A.; Zhang, J.; Bakshy, E.; Ackerman, M.S. Knowledge sharing and Yahoo Answers: Everyone knows something. In Proceedings of the 17th International Conference on World Wide Web, Beijing, China, 21–25 April 2008; pp. 665–674. [Google Scholar]
- Preece, J.; Nonnecke, B.; Andrews, D. The top five reasons for lurking: Improving community experiences for everyone. Comput. Hum. Behav. 2004, 20, 201–223. [Google Scholar] [CrossRef]
- Yang, Z.; Liu, Q.; Sun, B.; Zhao, X. Expert recommendation in community question answering: A review and future direction. Int. J. Crowd Sci. 2019, 3, 348–372. [Google Scholar] [CrossRef]
- Li, X.; Liu, Y.; Zhang, M.; Ma, S. Early detection of promotion campaigns in community question answering. In Proceedings of the Chinese National Conference on Social Media Processing, Nanchang, China, 29–30 October 2016; Springer: Berlin/Heidelberg, Germany, 2016; pp. 172–185. [Google Scholar]
- Riahi, F.; Zolaktaf, Z.; Shafiei, M.; Milios, E. Finding expert users in community question answering. In Proceedings of the 21st International Conference on World Wide Web (WWW ’12 Companion), Lyon, France, 16–20 April 2012; pp. 791–798. [Google Scholar]
- Le, L.T.; Shah, C. Retrieving rising stars in focused Community Question-Answering. In Proceedings of the Intelligent Information and Database Systems, Da Nang, Vietnam, 14–16 March 2016; Nguyen, N.T., Trawiński, B., Fujita, H., Hong, T.P., Eds.; Springer: Berlin/Heidelberg, Germany, 2016; pp. 25–36. [Google Scholar]
- Li, X.; Liu, Y.; Zhang, M.; Ma, S.; Zhu, X.; Sun, J. Detecting promotion campaigns in community question answering. In Proceedings of the 24th International Conference on Artificial Intelligence (IJCAI’15), Buenos Aires, Argentina, 25–31 July 2015; pp. 2348–2354. [Google Scholar]
- Movshovitz-Attias, D.; Movshovitz-Attias, Y.; Steenkiste, P.; Faloutsos, C. Analysis of the reputation system and user contributions on a question answering website: StackOverflow. In Proceedings of the 2013 IEEE/ACM International Conference on Advances in Social Networks Analysis and Mining (ASONAM 2013), Niagara Falls, ON, Canada, 25–28 August 2013; pp. 886–893. [Google Scholar] [CrossRef]
- Bhatia, S.; Mitra, P. Adopting inference networks for online thread retrieval. In Proceedings of the AAAI Conference on Artificial Intelligence, Atlanta, GA, USA, 11–15 July 2010; Volume 24, pp. 1300–1305. [Google Scholar] [CrossRef]
- Bonifazi, G.; Cauteruccio, F.; Corradini, E.; Marchetti, M.; Sciarretta, L.; Ursino, D.; Virgili, L. A space-time framework for sentiment scope analysis in social media. Big Data Cogn. Comput. 2022, 6, 130. [Google Scholar] [CrossRef]
- Ursino, D.; Virgili, L. An approach to evaluate trust and reputation of things in a Multi-IoTs scenario. Computing 2020, 102, 2257–2298. [Google Scholar] [CrossRef]
- Shah, C.; Kitzie, V. Social Q&A and virtual reference comparing apples and oranges with the help of experts and users. J. Am. Soc. Inf. Sci. Technol. 2012, 63, 2020–2036. [Google Scholar]
- Li, M.; Li, Y.; Peng, Q.; Wang, J.; Yu, C. Evaluating Community Question-Answering websites using interval-valued intuitionistic fuzzy DANP and TODIM methods. Appl. Soft Comput. 2021, 99, 106918. [Google Scholar] [CrossRef]
- Baltadzhieva, A.; Chrupała, G. Question quality in community question answering forums: A survey. ACM SIGKDD Explor. Newsl. 2015, 17, 8–13. [Google Scholar] [CrossRef]
- Ravi, S.; Pang, B.; Rastogi, V.; Kumar, R. Great question! Question quality in community Q&A. In Proceedings of the International AAAI Conference on Web and Social Media, Ann Arbor, MI, USA, 1–4 June 2014; Volume 8, pp. 426–435. [Google Scholar]
- Le, L.T.; Shah, C.; Choi, E. Evaluating the quality of educational answers in community question-answering. In Proceedings of the 16th ACM/IEEE-CS on Joint Conference on Digital Libraries, Newark, NJ, USA, 19–23 June 2016; ACM: Frisco, TX, USA, 2016; pp. 129–138. [Google Scholar]
- Jeon, J.; Croft, W.B.; Lee, J.H.; Park, S. A framework to predict the quality of answers with non-textual features. In Proceedings of the 29th Annual International ACM SIGIR Conference on Research and Development in Information Retrieval, Seattle, WA, USA, 11–15 July 2006; ACM: Frisco, TX, USA, 2006; pp. 228–235. [Google Scholar]
- Toba, H.; Ming, Z.Y.; Adriani, M.; Chua, T.S. Discovering high quality answers in community question answering archives using a hierarchy of classifiers. Inf. Sci. 2014, 261, 101–115. [Google Scholar] [CrossRef]
- Elalfy, D.; Gad, W.; Ismail, R. A hybrid model to predict best answers in question answering communities. Egypt. Inform. J. 2018, 19, 21–31. [Google Scholar] [CrossRef]
- Suryanto, M.A.; Lim, E.P.; Sun, A.; Chiang, R.H. Quality-aware collaborative question answering: Methods and evaluation. In Proceedings of the Second ACM International Conference on Web Search and Data Mining, Melbourne, Australia, 9–12 February 2009; ACM: Frisco, TX, USA, 2009; pp. 142–151. [Google Scholar]
- Figueroa, A. Refining fine-tuned transformers with hand-crafted features for gender screening on question-answering communities. Inf. Fusion 2023, 92, 256–267. [Google Scholar] [CrossRef]
- Shah, C. Building a parsimonious model for identifying best answers using interaction history in community Q&A. In Proceedings of the 78th ASIS&T Annual Meeting: Information Science with Impact: Research in and for the Community, St. Louis, MI, USA, 6–10 November 2015; p. 51. [Google Scholar]
- Xie, Z.; Nie, Y.; Jin, S.; Li, S.; Li, A. Answer quality assessment in CQA based on similar support sets. In Chinese Computational Linguistics and Natural Language Processing Based on Naturally Annotated Big Data; Springer: Berlin/Heidelberg, Germany, 2015; pp. 309–325. [Google Scholar]
- Castro, J.; Yera Toledo, R.; Alzahrani, A.A.; Sánchez, P.J.; Barranco, M.J.; Martínez, L. A big data semantic driven context aware recommendation method for question-answer items. IEEE Access 2019, 7, 182664–182678. [Google Scholar] [CrossRef]
- Costa, G.; Ortale, R. Ask and Ye shall be Answered: Bayesian tag-based collaborative recommendation of trustworthy experts over time in community question answering. Inf. Fusion 2023, 99, 101856. [Google Scholar] [CrossRef]
- Costa, G.; Ortale, R. Here are the answers. What is your question? Bayesian collaborative tag-based recommendation of time-sensitive expertise in question-answering communities. Expert Syst. Appl. 2023, 225, 120042. [Google Scholar] [CrossRef]
- Qu, C.; Yang, L.; Qiu, M.; Croft, W.B.; Zhang, Y.; Iyyer, M. BERT with history answer embedding for conversational question answering. In Proceedings of the 42nd International ACM SIGIR Conference on Research and Development in Information Retrieval (SIGIR’19), Paris, France, 21–25 July 2019; pp. 1133–1136. [Google Scholar] [CrossRef]
- Agichtein, E.; Castillo, C.; Donato, D.; Gionis, A.; Mishne, G. Finding high-quality content in social media. In Proceedings of the 2008 International Conference on Web Search and Data Mining, Alto, CA, USA, 11–12 February 2008; pp. 183–194. [Google Scholar]
- Burel, G.; He, Y.; Alani, H. Automatic identification of best answers in online enquiry communities. In Proceedings of the Extended Semantic Web Conference, Heraklion, Greece, 27–31 May 2012; Springer: Berlin/Heidelberg, Germany, 2012; pp. 514–529. [Google Scholar]
- Senter, R.; Smith, E.A. Automated Readability Index; Technical Report; Cincinnati University: Cincinnati, OH, USA, 1967. [Google Scholar]
- Gunning, R. Technique of Clear Writing; McGraw-Hill: New York, NY, USA, 1952. [Google Scholar]
- Kincaid, J.P.; Fishburne, R.P., Jr.; Rogers, R.L.; Chissom, B.S. Derivation of New Readability Formulas (Automated Readability Index, Fog Count and Flesch Reading Ease Formula) for Navy Enlisted Personnel; Technical Report; Naval Technical Training Command Millington TN Research Branch: Millington, TN, USA, 1975. [Google Scholar]
- Posnett, D.; Warburg, E.; Devanbu, P.; Filkov, V. Mining stack exchange: Expertise is evident from initial contributions. In Proceedings of the 2012 International Conference on Social Informatics, Alexandria, VA, USA, 14–16 December 2012; IEEE: New York, NY, USA, 2012; pp. 199–204. [Google Scholar]
- Barua, A.; Thomas, S.W.; Hassan, A.E. What are developers talking about? An analysis of topics and trends in stack overflow. Empir. Softw. Eng. 2014, 19, 619–654. [Google Scholar] [CrossRef]


| Feature Name | Feature Description | Ref. |
|---|---|---|
| Content Similarity | ||
| cosineSimilarity | Measure of similarity between question and answer | [5,24] |
| Linguistic features | ||
| postLength | Post length, measured in characters | [6,24,25,30] |
| #MaxWordsInSentence | Number of words in the longest sentence | [6] |
| avgWordsInSentence | Average number of words per sentence | [6] |
| avgCharactersInWords | Average number of character for words | [6] |
| #ComplexWords | Number of complex words in the answer | [30] |
| #MisspelledWords | Number of misspelled words | [24,30] |
| #CodeLines | Number of lines of source code | |
| #Links | Number of links | |
| Readability features | ||
| ARI | Automated Readability Index (ARI) | [24] |
| GFI | The Gunning Fog Index (GFI) | [36,37] |
| FRES | Flesch Reading Ease Formula (FRES) | [24] |
| Additional content elements | ||
| hasExample | Include examples in the answer | |
| hasCodeSelection | Include source code in the answer | |
| hasLinks | Include references to external material | [3] |
| Interaction features | ||
| velAccepted | Difference between the timestamp of when the question was chosen as the best answer by the author and the timestamp of when the question was posted | [30] |
| velAnsw | Difference between the date and time the answer was posted and when the question was posted | [24,30] |
| Post history features | ||
| ageAnsw | Age in days of the answer from when it was published until the day it was retrieved | [4,6] |
| #Answers | Number of answers to a question in a thread | [3,4,6,25] |
| #AnswComments | Number of comments received by an answer | [3,4] |
| Discussion Threads | |
|---|---|
| Site | StackOverflow |
| Language | English |
| URL | http://stackoverflow.com/ |
| Date | June 2019 |
| selection criteria | 2 years (2017–2018) |
| # initial_threads | 4020 |
| # final_threads | 3435 |
| # total_posts | 9428 |
| # best_scores | 4714 |
| # worst_scores | 4714 |
| Classifier/Feature Set | NB | LR | RF | ||||||||||||
|---|---|---|---|---|---|---|---|---|---|---|---|---|---|---|---|
| TPR | Prec | Recall | F1 | ROC | TPR | Prec | Recall | F1 | ROC | TPR | Prec | Recall | F1 | ROC | |
| Content similarity () | 0.541 | 0.549 | 0.541 | 0.545 | 0.564 | 0.507 | 0.553 | 0.507 | 0.529 | 0.564 | 0.512 | 0.515 | 0.512 | 0.514 | 0.524 |
| Linguistic () | 0.306 | 0.599 | 0.306 | 0.405 | 0.583 | 0.471 | 0.599 | 0.471 | 0.527 | 0.602 | 0.57 | 0.554 | 0.57 | 0.562 | 0.577 |
| Readability () | 0.767 | 0.52 | 0.767 | 0.620 | 0.546 | 0.585 | 0.517 | 0.585 | 0.549 | 0.514 | 0.513 | 0.517 | 0.513 | 0.515 | 0.524 |
| Content elements () | 0.312 | 0.589 | 0.312 | 0.408 | 0.563 | 0.304 | 0.596 | 0.304 | 0.403 | 0.567 | 0.288 | 0.6 | 0.288 | 0.39 | 0.566 |
| Interaction () | 0.332 | 0.92 | 0.332 | 0.487 | 0.665 | 0.333 | 0.92 | 0.333 | 0.489 | 0.669 | 0.346 | 0.859 | 0.346 | 0.493 | 0.657 |
| Post history () | 0.06 | 0.537 | 0.06 | 0.109 | 0.536 | 0.547 | 0.524 | 0.547 | 0.535 | 0.54 | 0.453 | 0.465 | 0.453 | 0.459 | 0.453 |
| Number of Combined Sets | TPR | Prec | Recall | F1 | ROC |
|---|---|---|---|---|---|
| 1st set | |||||
| Rea | 0.767 | 0.52 | 0.767 | 0.62 | 0.546 |
| 2-sets combination | |||||
| Rea-Lng | 0.386 | 0.589 | 0.386 | 0.467 | 0.583 |
| Rea-Con | 0.687 | 0.552 | 0.687 | 0.612 | 0.59 |
| Rea-Int | 0.626 | 0.622 | 0.626 | 0.624 | 0.69 |
| Rea-His | 0.542 | 0.547 | 0.542 | 0.545 | 0.56 |
| Rea-Csim | 0.741 | 0.531 | 0.741 | 0.619 | 0.575 |
| 3-sets combination | |||||
| Rea-Csim-Lng | 0.413 | 0.594 | 0.413 | 0.488 | 0.592 |
| Rea-Csim-Con | 0.676 | 0.561 | 0.676 | 0.613 | 0.601 |
| Rea-Csim-Int | 0.591 | 0.644 | 0.591 | 0.616 | 0.698 |
| Rea-Csim-His | 0.535 | 0.563 | 0.535 | 0.549 | 0.581 |
| 4-sets combination | |||||
| Rea-Csim-Con-Lng | 0.405 | 0.596 | 0.405 | 0.483 | 0.601 |
| Rea-Csim-Con-Int | 0.591 | 0.662 | 0.591 | 0.625 | 0.711 |
| Rea-Csim-Con-His | 0.512 | 0.581 | 0.512 | 0.545 | 0.601 |
| 5-sets combination | |||||
| Rea-Csim-Con-Int-Lng | 0.522 | 0.702 | 0.522 | 0.599 | 0.712 |
| Rea-Csim-Con-Int-His | 0.51 | 0.716 | 0.51 | 0.596 | 0.71 |
| 6-sets combination | |||||
| Rea-Csim-Con-Int-Lng-His | 0.51 | 0.714 | 0.51 | 0.595 | 0.71 |
| Number of Combined Sets | TPR | Prec | Recall | F1 | ROC |
|---|---|---|---|---|---|
| 1st set | |||||
| Rea | 0.585 | 0.517 | 0.585 | 0.549 | 0.514 |
| 2-sets combination | |||||
| Rea-Lng | 0.493 | 0.591 | 0.493 | 0.538 | 0.606 |
| Rea-Con | 0.481 | 0.564 | 0.481 | 0.519 | 0.586 |
| Rea-Int | 0.333 | 0.92 | 0.333 | 0.489 | 0.671 |
| Rea-His | 0.557 | 0.53 | 0.557 | 0.543 | 0.544 |
| Rea-Csim | 0.525 | 0.551 | 0.525 | 0.538 | 0.566 |
| 3-sets combination | |||||
| Rea-His-Lng | 0.517 | 0.584 | 0.517 | 0.548 | 0.609 |
| Rea-His-Con | 0.559 | 0.561 | 0.559 | 0.56 | 0.593 |
| Rea-His-Int | 0.333 | 0.92 | 0.333 | 0.489 | 0.68 |
| Rea-His-CSim | 0.549 | 0.554 | 0.549 | 0.551 | 0.577 |
| 4-sets combination | |||||
| Rea-His-Con-Lng | 0.551 | 0.595 | 0.551 | 0.572 | 0.622 |
| Rea-His-Con-Int | 0.44 | 0.782 | 0.44 | 0.563 | 0.709 |
| Rea-His-Con-Csim | 0.56 | 0.57 | 0.56 | 0.565 | 0.604 |
| 5-sets combination | |||||
| Rea-His-Con-Csim-Lng | 0.56 | 0.592 | 0.56 | 0.576 | 0.627 |
| Rea-His-Con-Csim-Int | 0.44 | 0.783 | 0.44 | 0.563 | 0.71 |
| 6-sets combination | |||||
| Rea-His-Con-Csim-Lng-Int | 0.471 | 0.764 | 0.471 | 0.583 | 0.725 |
| Number of Combined Sets | TPR | Prec | Recall | FM | ROC |
|---|---|---|---|---|---|
| (a) | |||||
| 1st set | |||||
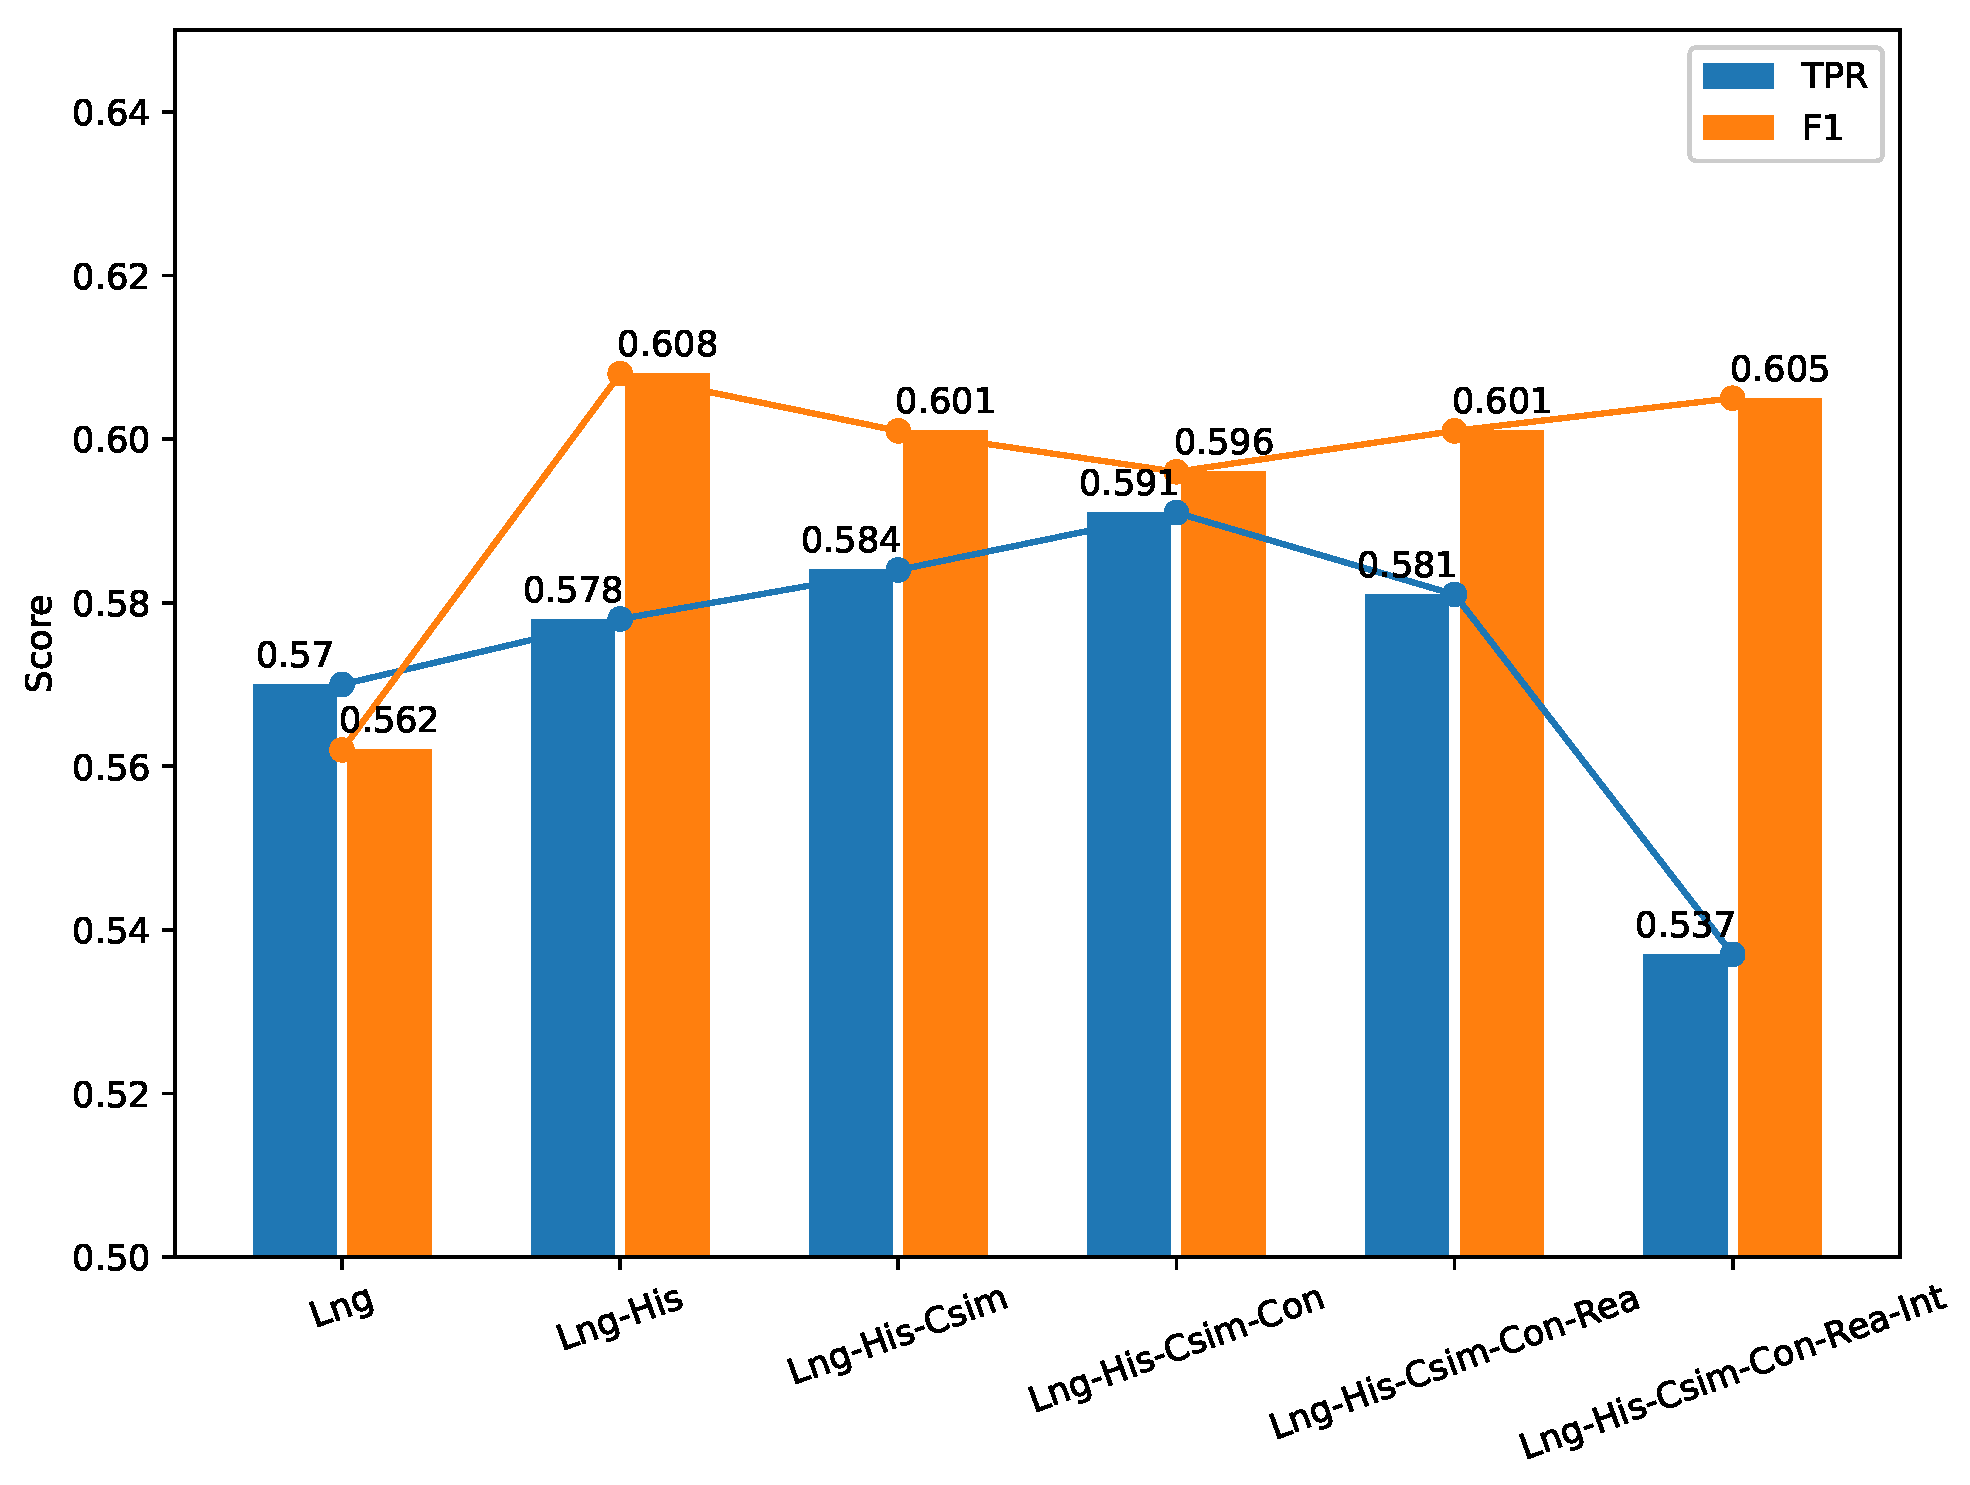
| Lng | 0.57 | 0.554 | 0.57 | 0.562 | 0.577 |
| 2-sets combination | |||||
| Lng-Rea | 0.566 | 0.554 | 0.566 | 0.56 | 0.581 |
| Lng-Con | 0.567 | 0.552 | 0.567 | 0.56 | 0.577 |
| Lng-Int | 0.561 | 0.664 | 0.561 | 0.608 | 0.698 |
| Lng-His | 0.578 | 0.565 | 0.578 | 0.572 | 0.593 |
| Lng-Csim | 0.575 | 0.561 | 0.575 | 0.568 | 0.59 |
| 3-sets combination | |||||
| Lng-His-Rea | 0.578 | 0.562 | 0.578 | 0.57 | 0.596 |
| Lng-His-Con | 0.574 | 0.563 | 0.574 | 0.569 | 0.595 |
| Lng-His-Int | 0.54 | 0.676 | 0.54 | 0.601 | 0.702 |
| Lng-His-Csim | 0.584 | 0.578 | 0.584 | 0.581 | 0.607 |
| 4-sets combination | |||||
| Lng-His-Con-Rea | 0.571 | 0.566 | 0.571 | 0.569 | 0.593 |
| Lng-His-Con-Int | 0.554 | 0.654 | 0.554 | 0.6 | 0.69 |
| Lng-His-Con-Csim | 0.569 | 0.554 | 0.569 | 0.562 | 0.584 |
| 5-sets combination | |||||
| Lng-His-Con-Int-Rea | 0.549 | 0.684 | 0.549 | 0.609 | 0.71 |
| Lng-His-Con-Int-Csim | 0.533 | 0.679 | 0.533 | 0.597 | 0.703 |
| 6-sets combination | |||||
| Lng-His-Con-Int-Rea-Csim | 0.537 | 0.693 | 0.537 | 0.605 | 0.708 |
| (b) | |||||
| 1st set | |||||
| Rea | 0.513 | 0.517 | 0.513 | 0.515 | 0.524 |
| 2-sets combination | |||||
| Rea-Lng | 0.566 | 0.554 | 0.566 | 0.56 | 0.581 |
| Rea-Con | 0.533 | 0.534 | 0.533 | 0.533 | 0.547 |
| Rea-Int | 0.548 | 0.637 | 0.548 | 0.589 | 0.671 |
| Rea-His | 0.536 | 0.522 | 0.536 | 0.529 | 0.537 |
| Rea-Csim | 0.544 | 0.532 | 0.544 | 0.538 | 0.549 |
| 3-sets combination | |||||
| Rea-Lng-Con | 0.574 | 0.558 | 0.574 | 0.566 | 0.581 |
| Rea-Lng-Int | 0.555 | 0.676 | 0.555 | 0.609 | 0.704 |
| Rea-Lng-His | 0.578 | 0.562 | 0.578 | 0.57 | 0.596 |
| Rea-Lng-Csim | 0.576 | 0.568 | 0.576 | 0.572 | 0.593 |
| 4-sets combination | |||||
| Rea-Lng-His-Con | 0.582 | 0.566 | 0.582 | 0.574 | 0.595 |
| Rea-Lng-His-Int | 0.547 | 0.685 | 0.547 | 0.608 | 0.704 |
| Rea-Lng-His-Csim | 0.579 | 0.577 | 0.579 | 0.578 | 0.608 |
| 5-sets combination | |||||
| Rea-Lng-His-Con-Int | 0.548 | 0.687 | 0.548 | 0.61 | 0.704 |
| Rea-Lng-His-Con-Csim | 0.581 | 0.575 | 0.581 | 0.578 | 0.608 |
| 6-sets combination | |||||
| Rea-Lng-His-Con-Csim-Int | 0.537 | 0.693 | 0.537 | 0.605 | 0.708 |
Disclaimer/Publisher’s Note: The statements, opinions and data contained in all publications are solely those of the individual author(s) and contributor(s) and not of MDPI and/or the editor(s). MDPI and/or the editor(s) disclaim responsibility for any injury to people or property resulting from any ideas, methods, instructions or products referred to in the content. |
© 2023 by the authors. Licensee MDPI, Basel, Switzerland. This article is an open access article distributed under the terms and conditions of the Creative Commons Attribution (CC BY) license (https://creativecommons.org/licenses/by/4.0/).
Share and Cite
Zoratto, V.; Godoy, D.; Aranda, G.N. A Study on Influential Features for Predicting Best Answers in Community Question-Answering Forums. Information 2023, 14, 496. https://doi.org/10.3390/info14090496
Zoratto V, Godoy D, Aranda GN. A Study on Influential Features for Predicting Best Answers in Community Question-Answering Forums. Information. 2023; 14(9):496. https://doi.org/10.3390/info14090496
Chicago/Turabian StyleZoratto, Valeria, Daniela Godoy, and Gabriela N. Aranda. 2023. "A Study on Influential Features for Predicting Best Answers in Community Question-Answering Forums" Information 14, no. 9: 496. https://doi.org/10.3390/info14090496