Abstract
Pulmonary diseases, including pneumonia, represent a significant health challenge and are often diagnosed using X-rays. This study investigates the effectiveness of artificial intelligence (AI) in enhancing the diagnostic capabilities of X-ray imaging. Using Python and the PyTorch framework, we developed and trained several deep learning models based on DenseNet architectures (DenseNet121, DenseNet169, and DenseNet201) on a dataset comprising 5856 annotated X-ray images classified into two categories: Normal (Healthy) and Pneumonia. Each model was evaluated on its ability to classify images with metrics including binary accuracy, sensitivity, and specificity. The results demonstrated accuracy rates of 92% for Normal and 97% for Pneumonia. The models also showed significant improvements in diagnostic accuracy and reduced time for disease detection compared to traditional methods. This study underscores the potential of integrating convolutional neural networks (CNNs) with medical imaging to enhance diagnostic precision and support clinical decision-making in the management of pulmonary diseases. Further research is encouraged to refine these models and explore their application in other medical imaging domains.
1. Introduction
Pneumonia, an acute respiratory infection characterized by the inflammation of the alveoli in the lungs [1], remains a significant global health concern [2], particularly among children under the age of five [3]. This disease is responsible for 14% of all deaths in this age group, underscoring the critical need for accurate and timely diagnosis. Traditionally, chest X-rays have been the primary tool for diagnosing pneumonia. However, the interpretation of these images is highly dependent on the expertise of radiologists, leading to potential variability in diagnoses. In recent years, advancements in artificial intelligence (AI) and deep learning, particularly Convolutional Neural Networks (CNNs) [4,5], have shown promise in automating the analysis of medical images, thereby enhancing diagnostic accuracy and reducing the burden on healthcare professionals.
Recent research in the field of AI-driven medical diagnostics has explored a variety of deep learning models for pneumonia detection, with CNNs being the most prominent. CNNs have demonstrated high effectiveness in classifying medical images by learning hierarchical features from raw pixel data [5]. Moreover, the adoption of transfer learning has allowed researchers to fine-tune pre-trained models on smaller datasets, addressing the challenge of limited medical image data. Additional innovations, such as attention mechanisms, have been introduced to enhance the interpretability of deep learning models, allowing clinicians to better understand model decision-making processes [6]. Despite these advances, achieving generalizable performance across diverse patient populations and imaging conditions remains a significant challenge, as does balancing the trade-off between computational efficiency and diagnostic accuracy. However, several research gaps still need to be addressed to fully integrate AI solutions into clinical practice. First, model generalization across different populations and image quality levels is still inconsistent, raising concerns about the robustness of these systems in real-world clinical settings. Second, while CNN-based models have achieved promising accuracy, optimizing computational efficiency without sacrificing performance is still an area that requires further exploration [7]. Furthermore, the black-box nature of most deep learning models limits their interpretability, which is critical for gaining clinicians’ trust and ensuring safe deployment in healthcare. Lastly, the variability in model performance across different pneumonia types—such as viral, bacterial, and atypical pneumonia—highlights the need for more refined approaches that can better capture these distinctions [8]. The objective of this study is to evaluate the effectiveness of DenseNet-based deep learning models in classifying chest X-ray images into two categories: Normal (Healthy) and Pneumonia. By leveraging the DenseNet architecture, which has demonstrated superior performance in various image classification tasks [4,9,10], this study aims to improve both the accuracy and speed of pneumonia diagnosis. DenseNet’s densely connected structure allows for efficient feature reuse, mitigating the vanishing gradient problem common in deep networks, while also enhancing learning efficiency. We developed and fine-tuned several DenseNet models (DenseNet121, DenseNet169, and DenseNet201) using a dataset of 5856 annotated X-ray images. The models were assessed on key performance metrics, including binary accuracy, sensitivity, and specificity, to determine their efficacy in supporting clinical decision-making for pulmonary diseases.
This study also seeks to address the challenges noted in prior research by implementing multiple DenseNet architectures to optimize both computational efficiency and diagnostic accuracy. By comparing the performance of DenseNet121, DenseNet169, and DenseNet201, we provide insights into the trade-offs between model depth and prediction speed. Additionally, our analysis focuses on model generalization, ensuring the approach can be extended to broader clinical settings. The contributions of this work include a comprehensive evaluation of DenseNet architectures for pneumonia detection, as well as the exploration of their potential for future clinical integration, making this a crucial step toward developing AI-driven diagnostic tools that are both accurate and efficient in real-world applications.
2. Materials and Methods
The programming language chosen for this study was Python 3.11, and the framework used was PyTorch 2.4.1. Being a binary classification set, each image is annotated with one of two labels: Normal, or 0, and Opacity, or 1.
2.1. Computational Resources
The experiments were conducted using the following computational setup:
- Hardware: Dual NVIDIA GeForce RTX 4070 GPUs
- Memory: 128 GB RAM
- Software: PyTorch 2.4.0 with CUDA 12.4
2.2. Dataset
The dataset used for training the models contains a total of 5856 images, with the training set consisting of 4192 images (1082 normal cases, 3110 lung opacity cases), the validation set containing 1040 images (267 normal cases, 773 lung opacity cases), and the test set including 624 images (234 normal cases, 390 lung opacity cases) [11]. The dataset was split as follows: 80% training, 10% validation, and 10% testing, or 4684, 586, and 586 images, respectively.
2.3. Hyperparameters
The hyperparameters used for all three models were: 50 epochs, 0.001 learning rate, stochastic gradient descent for the optimizer, and Binary Cross-Entropy with Logits Loss for the loss function.
2.4. Image Enhancement Techniques
Resizing
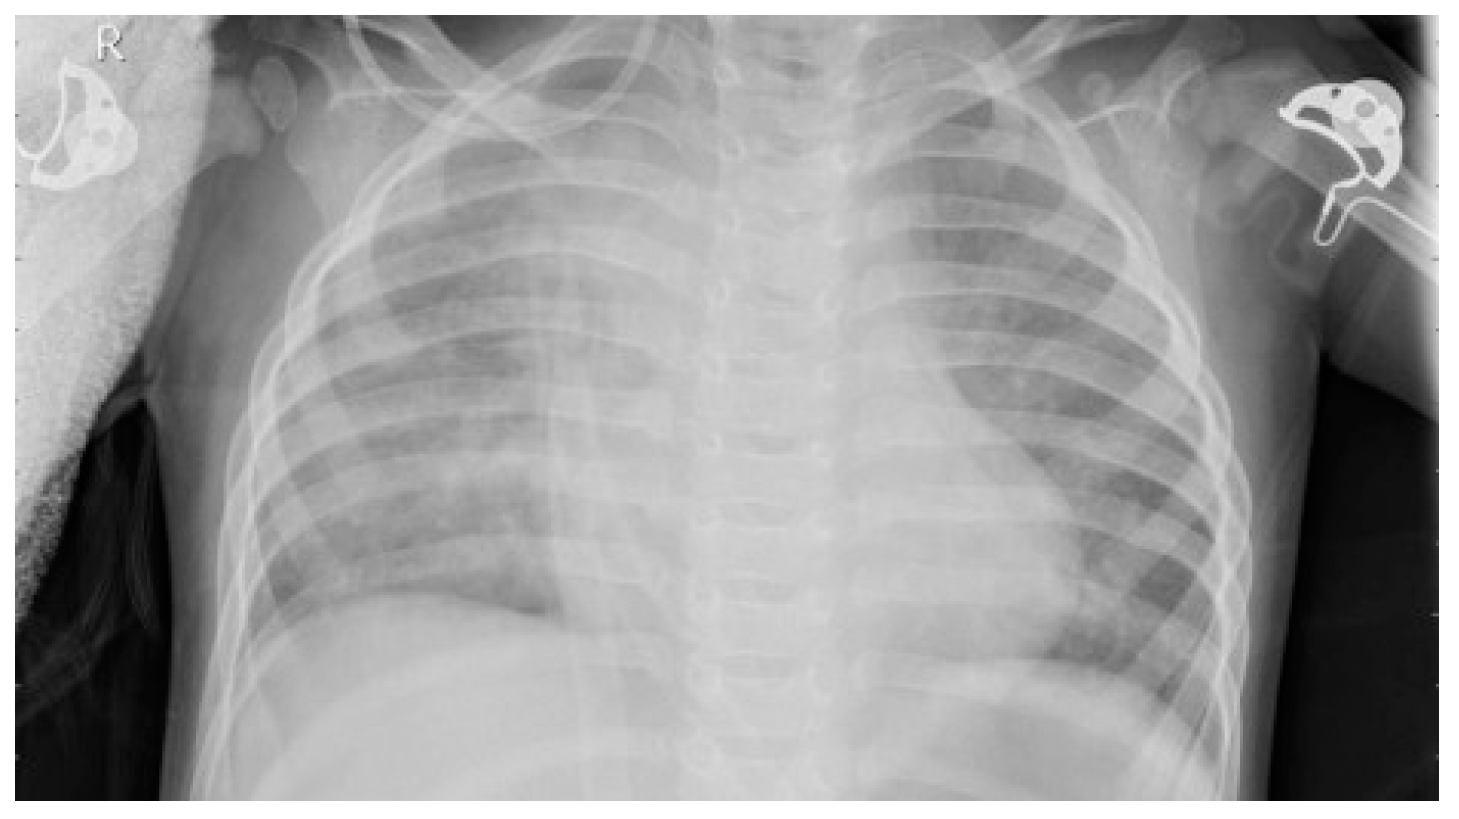
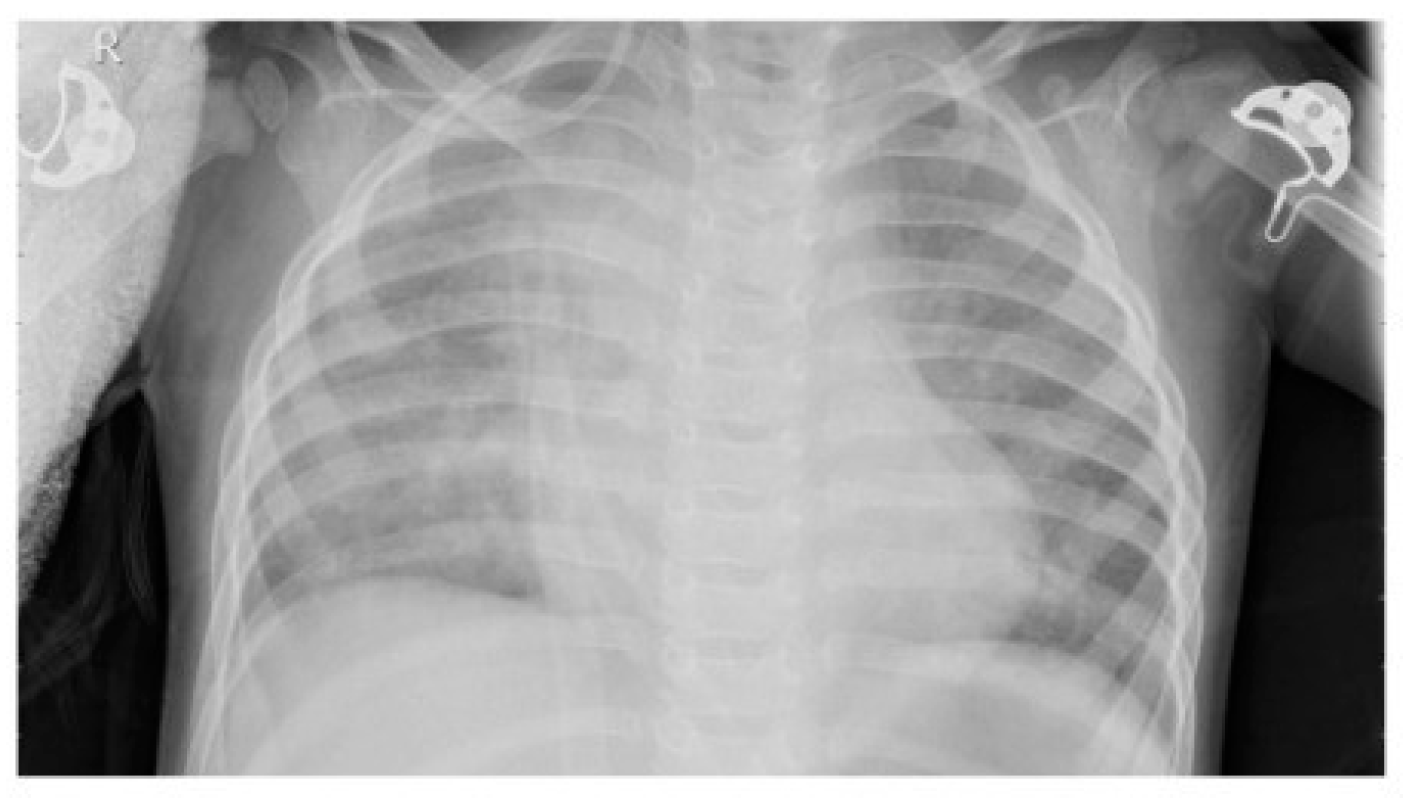
Each image was pre-processed as follows: resized to 224 by 224 pixels, randomly flipped horizontally and vertically, and normalized. For example, one of the original images is shown in Figure 1 and has a resolution of 688 by 1248 pixels, while the image after pre-processing is depicted in Figure 2.
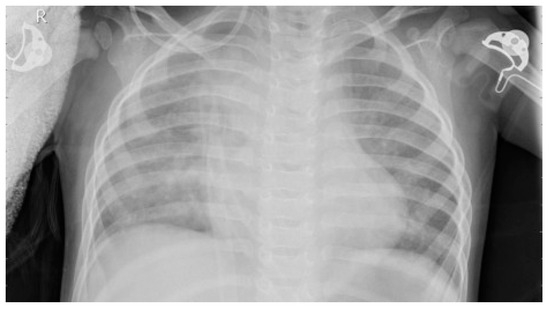
Figure 1.
The image before being resized.
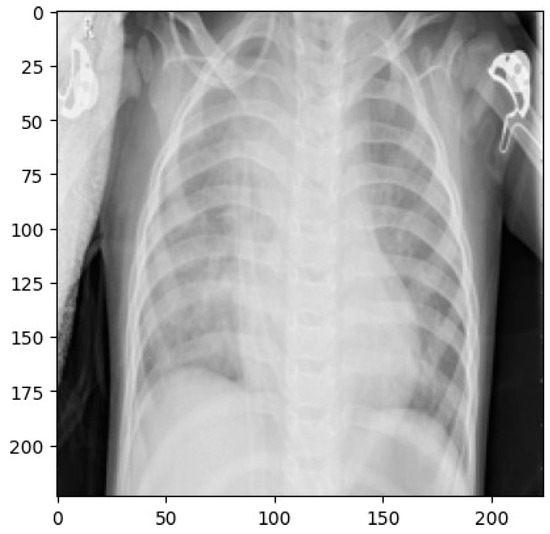
Figure 2.
The image after being resized.
2.5. Normalization
Image normalization plays a crucial role in our pre-processing pipeline, standardizing pixel values to a common scale between 0 and 1. This standardization serves multiple essential functions in the context of deep learning model training. First, it ensures that each pixel contributes proportionally to the model’s learning process, preventing bias that could arise from naturally higher intensity values dominating the feature extraction. Second, normalized inputs facilitate faster and more stable model convergence during training by creating a more regular optimization landscape, enabling gradient descent algorithms to find optimal solutions more efficiently. Third, this process enhances numerical stability, addressing the challenges neural networks face when dealing with input values that are either too large or too small.
Our normalization procedure follows a two-step process. Initially, pixel values are scaled from the original range of [0, 255] to [0, 1] through division by 255. Subsequently, these scaled values undergo standardization using mean (µ) and standard deviation (σ), features extracted from google/vit-base-patch16-224-in21k, following the equation:
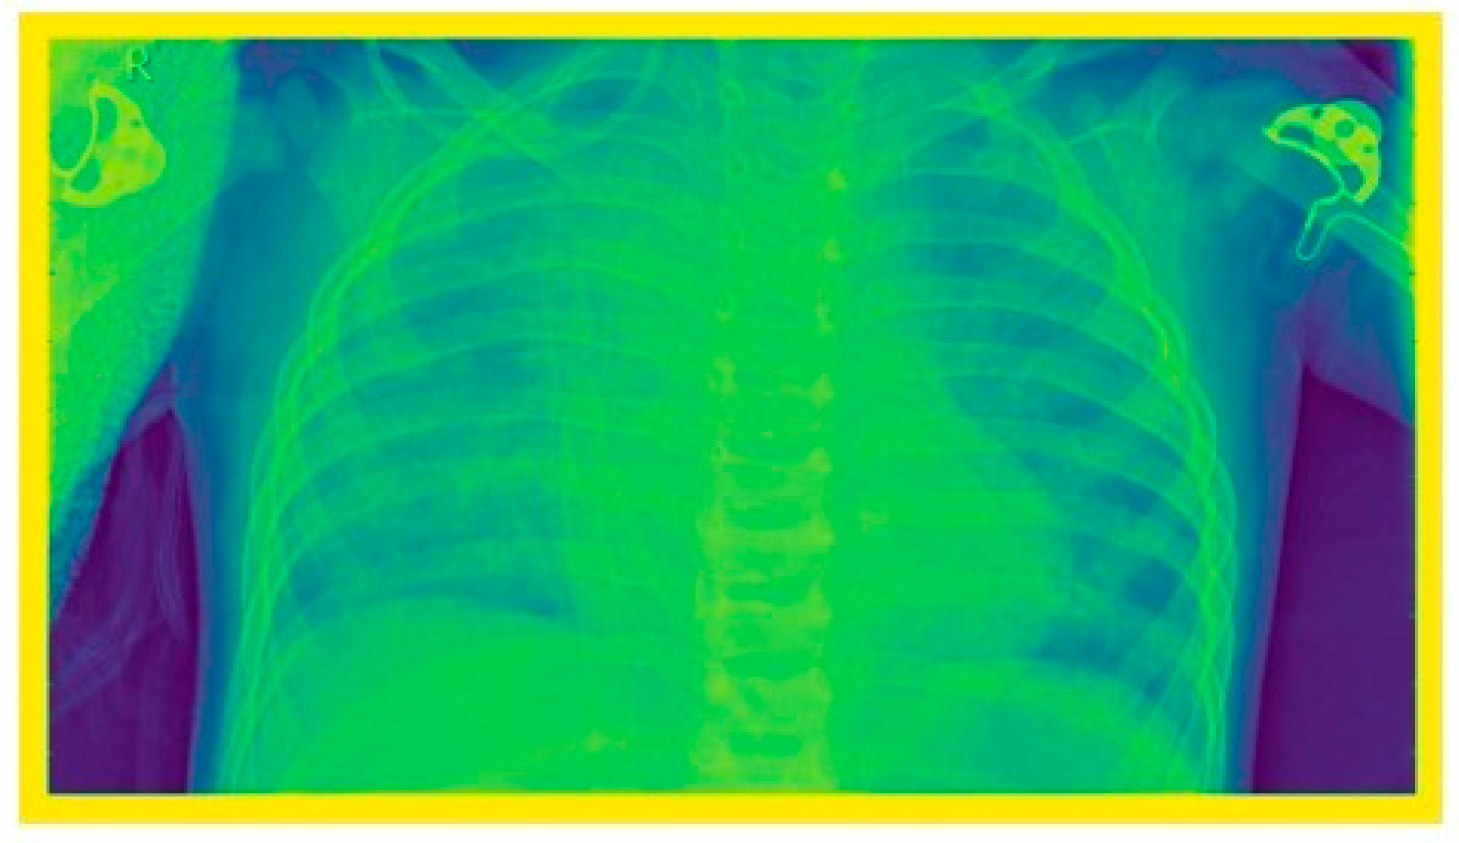
where µ = [0.5, 0.5, 0.5] and σ = [0.5, 0.5, 0.5]. The visual differences observable between the original and normalized images, as shown in Figure 3 and Figure 4, warrant discussion. While the normalization process may alter the visual appearance, extensive testing has confirmed that key diagnostic features critical for pneumonia detection are preserved. The DenseNet architecture demonstrates robust performance despite these transformations, as it is designed to learn hierarchical features that remain invariant to scale. The high accuracy achieved by our models (96%) provides empirical evidence that the normalization and resizing processes do not negatively impact the model’s diagnostic capabilities. In fact, these pre-processing steps prove crucial for enabling the model to generalize effectively across various X-ray machines and imaging conditions. It is important to note that the normalized images serve solely as model inputs and are not used for clinical viewing.

Figure 3.
The image before being normalized.
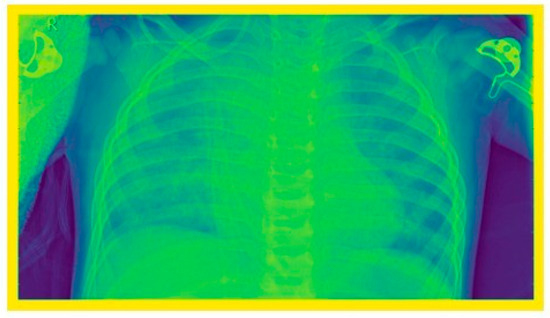
Figure 4.
The image after being normalized.
2.6. Transformers
For data augmentation during training, we apply a series of transformations using the transform.compose function. This includes random horizontal and vertical flips to introduce variability and improve model robustness, followed by tensor conversion and normalization based on the extractor’s mean and standard deviation. For testing, the pre-processing pipeline is streamlined to include only tensor conversion and normalization, ensuring that the test data is formatted consistently for evaluation.
2.7. DenseNet Network
DenseNet, or Densely Connected Convolutional Networks, was the architecture selected for this study, more preciselyDenseNet121, DenseNet169 and DenseNet201. This method addresses the vanishing gradient problem and enhances feature reuse throughout the network by connecting each layer to every other layer [12]. A Dense Block consists of multiple convolutional layers where each layer receives the feature maps of all preceding layers as input. More precisely, this can be expressed as:
where xl is the output of the lth layer, [x0, x1, …, xl−1] denotes the concatenation of the feature maps from layers 0 to l → 1, and Hl represents the composite function of operations in the lth layer (typically batch normalization, followed by a ReLU activation and a convolution operation).
xl = Hl([x0, x1, …, xl−1]),
Figure 5 provides a visual representation of the DenseNet architecture. As illustrated, the network consists of densely connected blocks where each layer receives input from all previous layers, facilitating better feature reuse and mitigating the vanishing gradient problem.
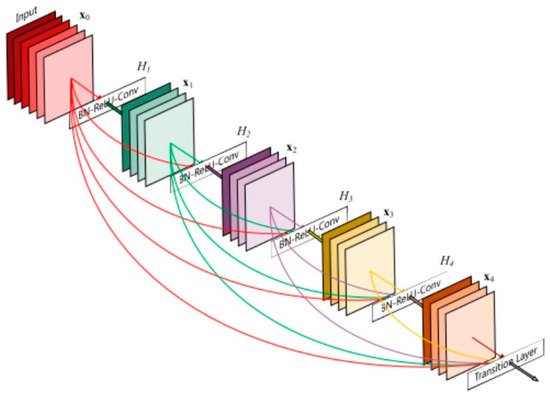
Figure 5.
The DenseNet architecture [12].
2.8. Model Description
For this study, each of the three DenseNet variants (DenseNet121, DenseNet169, and DenseNet201) was employed with specific adaptations for binary classification tasks. The model architecture is as follows:
- Pre-trained DenseNet Models: Each variant starts with a pre-trained DenseNet network, initially trained on the ImageNet dataset. These pre-trained weights are optimized for feature extraction from images, which is crucial for efficiently addressing the vanishing gradient problem.
- Freezing Weights: All parameters of the pre-trained DenseNet are frozen, meaning that during training, only the weights of the new classification layer are updated. This approach leverages the learned feature representations from the DenseNet models while focusing training on adapting the final layer for the binary classification task.
- Custom Classification Layer: The final classification layer of each DenseNet model is replaced with a new fully connected layer (nn.Linear(num_ftrs, 1)). This layer outputs a single logit score per input, which is used for binary classification.
2.8.1. DenseNet Architecture: In-Depth Analysis
Core Concepts
The DenseNet architecture is built on the idea of dense connectivity, where each layer receives feature maps from all preceding layers. This encourages feature reuse, which improves the gradient flow during training and enhances the overall performance of the model. Mathematically, this can be represented as xl = Hl([x0, x1, …, xl−1]), where Hl is the composite function at layer l. This architecture improves information flow, reduces the vanishing gradient problem, and increases parameter efficiency, making DenseNet highly effective for deep learning tasks.
Each layer in DenseNet applies a series of operations including Batch Normalization, ReLU activation, and convolution, typically using a 3 × 3 filter. This composite function Hl ensures that the output from each layer is properly transformed and used by subsequent layers, contributing to the robustness of the model.
Key Components
The Dense Block is one of the essential components of DenseNet. It consists of a series of densely connected layers, where each layer within the block receives the concatenated outputs of all preceding layers. One of the critical factors in DenseNet’s performance is the growth rate (k), which refers to the number of new feature maps produced by each layer. The growth rate controls the expansion of feature maps within the dense block, influencing the network’s capacity to learn intricate patterns in the data.
Another crucial aspect of DenseNet is the transition layers, which are placed between dense blocks. These layers typically perform down-sampling through techniques like pooling, helping to manage computational complexity by reducing the spatial dimensions of the feature maps. Transition layers ensure that DenseNet models remain computationally efficient even when dealing with large input sizes or deep architectures.
Model Variants
DenseNet offers several variants, each with different numbers of layers, parameters, and dense block configurations. These variants are widely used as backbones for a range of image classification tasks. For instance, DenseNet121 has 121 layers and 7 million parameters, with a dense block configuration of 6-12-24-16. DenseNet169 increases the number of layers to 169 and the parameters to 14 million, with a block configuration of 6-12-32-32. DenseNet201, the largest variant, has 201 layers, 20 million parameters, and a block configuration of 6-12-48-32. Table 1 summarizes the differences between these variants.

Table 1.
Comparison of DenseNet variants.
Implementation Details
For the X-ray classification task, we use the DenseNet121 variant pre-trained on ImageNet. The pre-trained weights help capture general image features that can be transferred to medical imaging tasks. In this implementation, we modify the classifier to suit our specific classification task while freezing the rest of the DenseNet layers to prevent further weight updates. This approach speeds up training and reduces the risk of overfitting, especially given the limited amount of medical imaging data available.
Below is the implementation used for the X-ray classifier:
- Class XrayClassifier:
- Function initialize(num_classes):
- # Load a pre-trained DenseNet model (121, 169, or 201 variant)
- model = load_pretrained_densenet()
- # Freeze all layers of the pre-trained model
- For each layer in model:
- set layer to non-trainable
- # Get the number of features from the pre-trained
- # model’s classifier layer
- num_features = extract_features_from_classifier(model)
- # Replace the pre-trained classifier with a new one
- # for X-ray classification (binary in this case)
- model.classifier = create_new_classifier(num_features, num_classes)
- Function forward(input):
- # Pass the input through the model
- return model(input)
In this code, the pre-trained DenseNet model serves as a feature extractor and the classifier is adapted to the specific number of classes required for X-ray classification. By freezing the parameters of the pre-trained layers, we only train the final classifier layer, ensuring efficient training even with limited data. This strategy allows for optimal use of pre-trained knowledge while tailoring the model for the medical imaging task at hand.
3. Results
3.1. Evaluation
We evaluated the performance of multiple PyTorch models that were specifically trained on the dataset [11]. The three deep learning models based on the DenseNet architecture were assessed for their ability to classify images into two categories: Normal (Healthy), which is labeled as 0, and Opacity (Pneumonia), which is labeled as 1. The key performance metrics range between 0 and 1 and are as follows:
3.2. Experiments
This section presents a comparison of the various DenseNet architectures based on their performance in detecting normal (labeled as Class 0) and pneumonia (labeled as Class 1) cases using the fine-tuned pre-trained models. Table 2 summarizes the performance metrics, training times, and prediction times for the DenseNet models used in this study. DenseNet121, DenseNet169, and DenseNet201 were evaluated for their effectiveness in classifying images into two categories: Class 0.0 and Class 1.0.
Table 2.
Performance metrics, training times, and prediction times for DenseNet models.
DenseNet121 exhibited the fastest prediction time at 0.011 s per image and a training duration of 22 min and 57 s. It achieved a precision of 95%, recall of 91%, and F1-score of 93% for Class 0.0. For Class 1.0, it recorded a precision of 96%, recall of 98%, and F1-score of 97%. The overall accuracy of DenseNet121 was 96%, with a macro average precision, recall, and F1-score of 95%, 94%, and 95%, respectively.
DenseNet169, with a training time of 22 min and 8 s, had a slightly slower prediction time of 0.015 s per image. For Class 0.0, it achieved a precision of 96%, recall of 91%, and F1-score of 93%. For Class 1.0, it recorded a precision of 96%, recall of 99%, and F1-score of 97%. Its overall accuracy was 96%, with a macro average precision, recall, and F1-score of 96%, 95%, and 95%, respectively.
DenseNet201, the slowest in prediction with 0.018 s per image and a training time of 23 min and 28 s, demonstrated a precision of 94%, recall of 91%, and F1-score of 92% for Class 0.0. For Class 1.0, it had a precision of 96%, recall of 98%, and F1-score of 97%. The model’s overall accuracy was 95%, with a macro average precision, recall, and F1-score of 95%, 94%, and 95%, respectively.
This analysis highlights the trade-offs between training time, prediction time, and classification performance across the different DenseNet architectures.
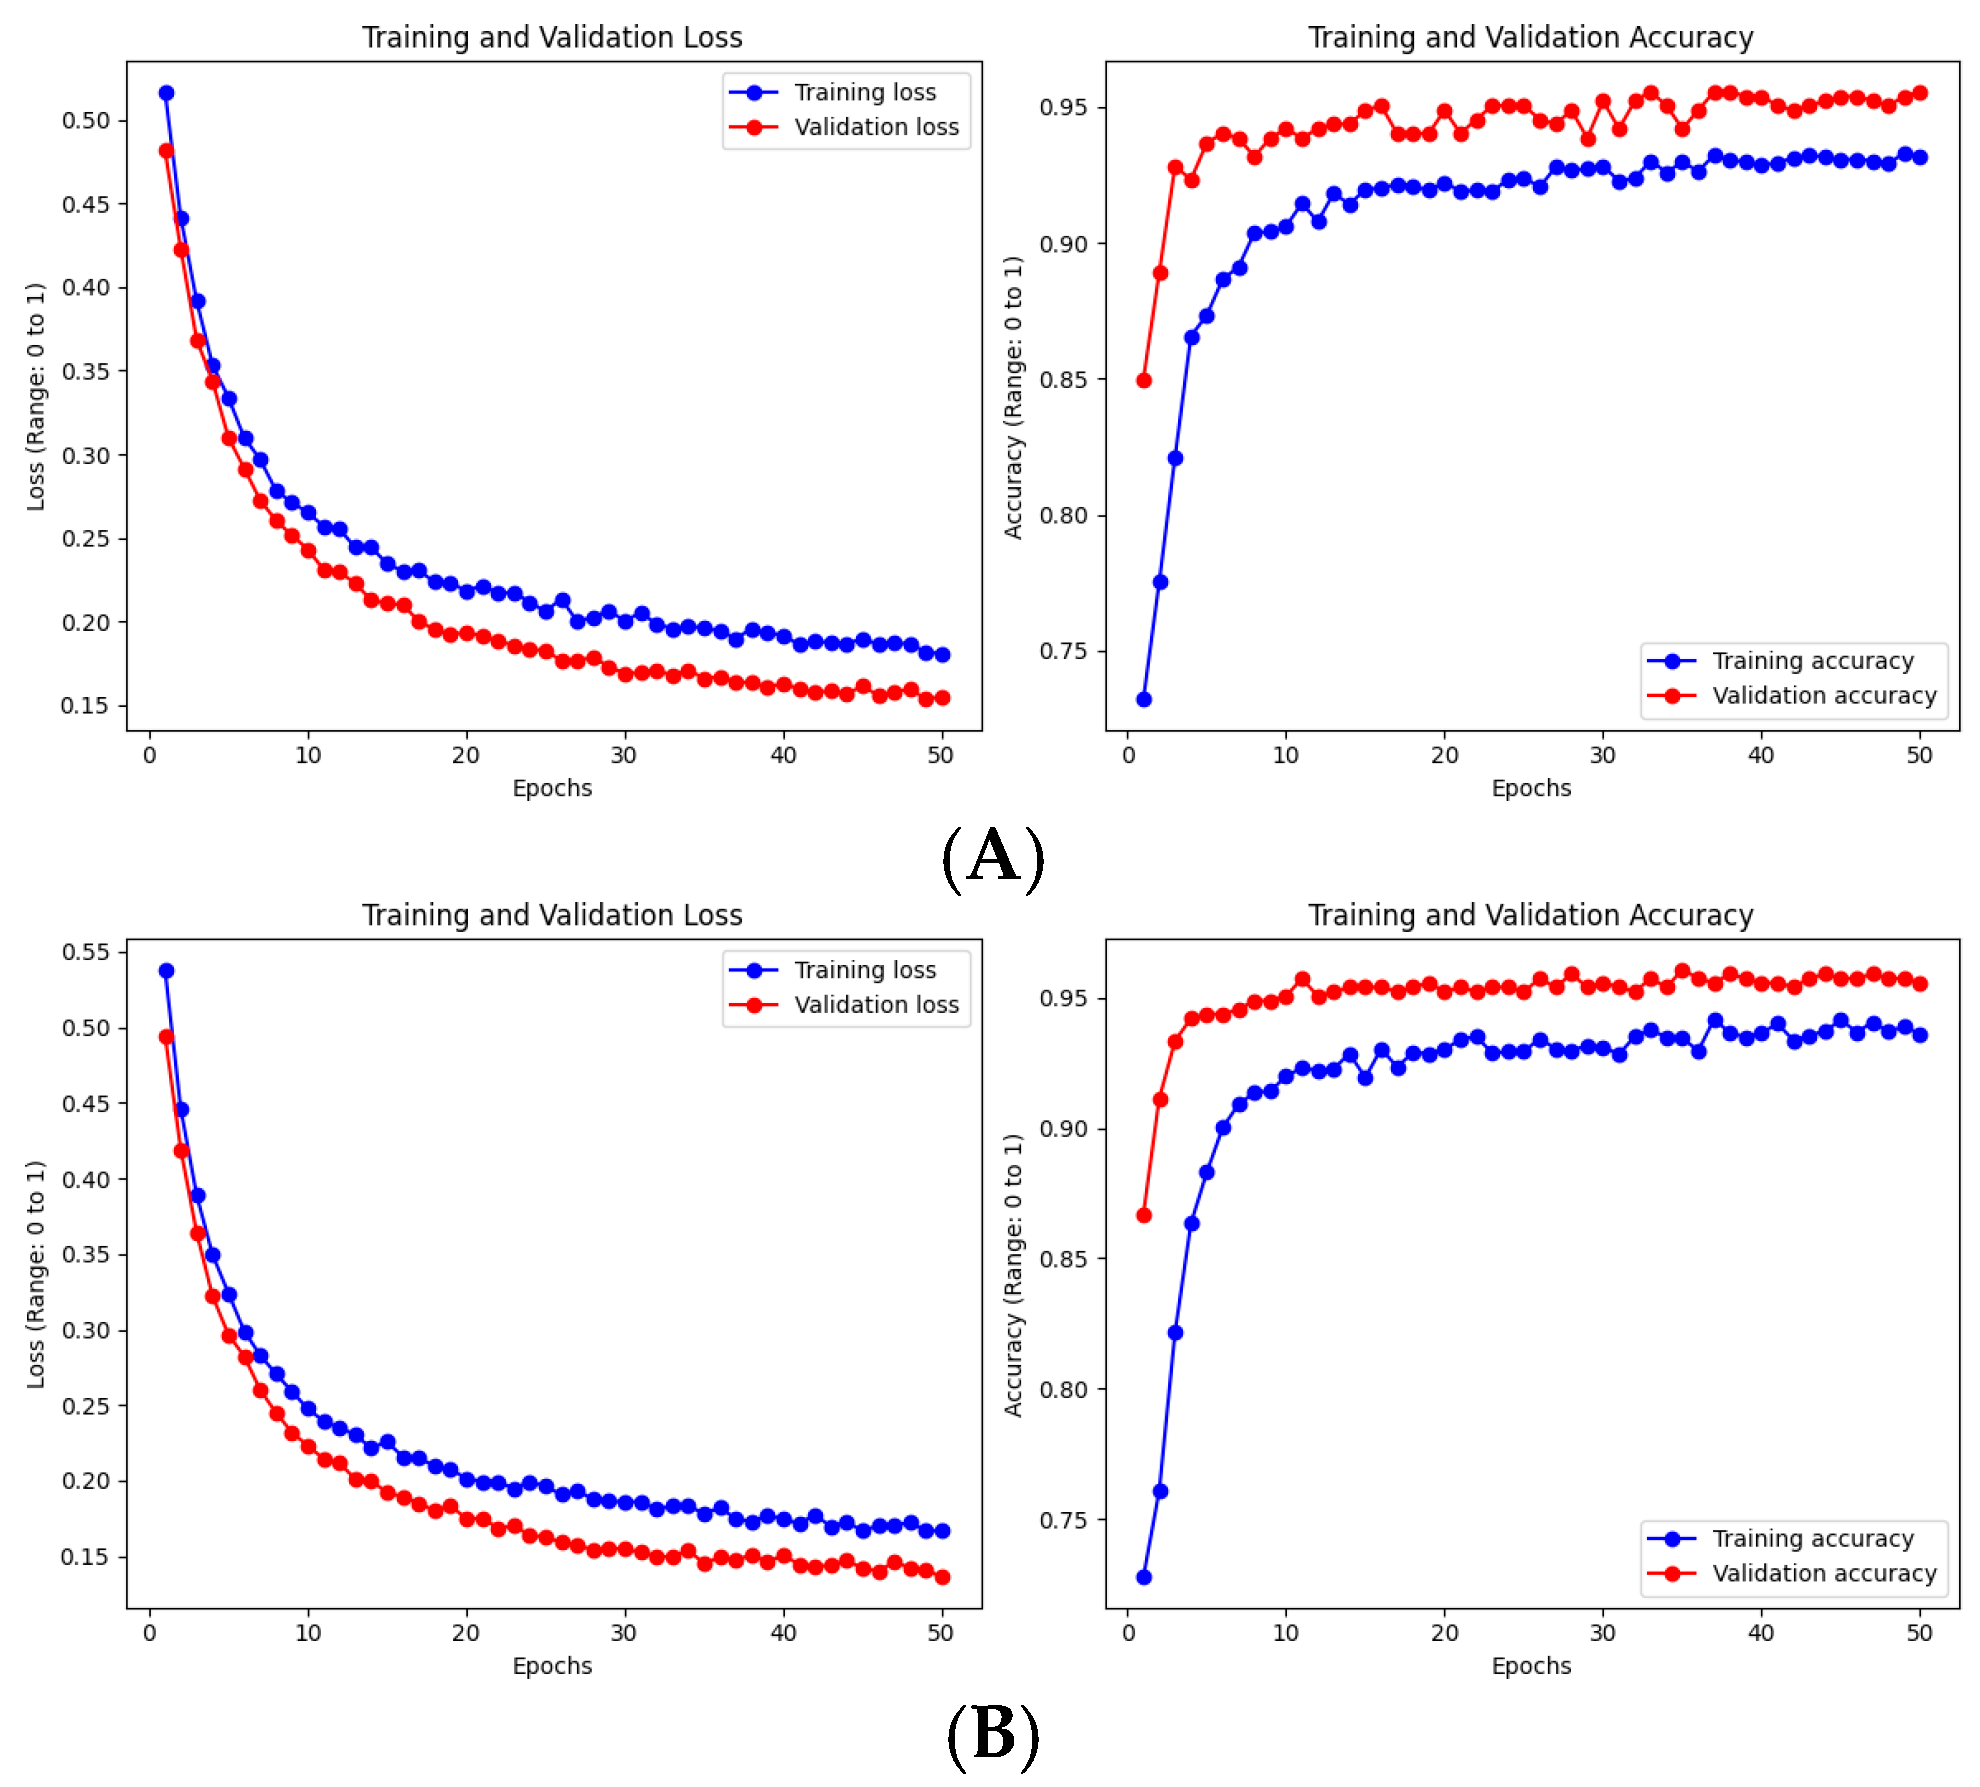
Figure 6 shows the overall scores during training for each of the architectures used in this experiment. At epoch 50, the performance metrics for DenseNet121 with image normalization were as follows: training loss of 0.18, validation loss of 0.15, training accuracy of 0.93, and validation accuracy of 0.96. In comparison, DenseNet169 demonstrated greater stability during training, achieving a training loss of 0.16, validation loss of 0.12, training accuracy of 0.93, and validation accuracy of 0.96. Similarly, DenseNet201 was well-balanced, reaching a training loss of 0.16, validation loss of 0.11, training accuracy of 0.93, and validation accuracy of 0.95.
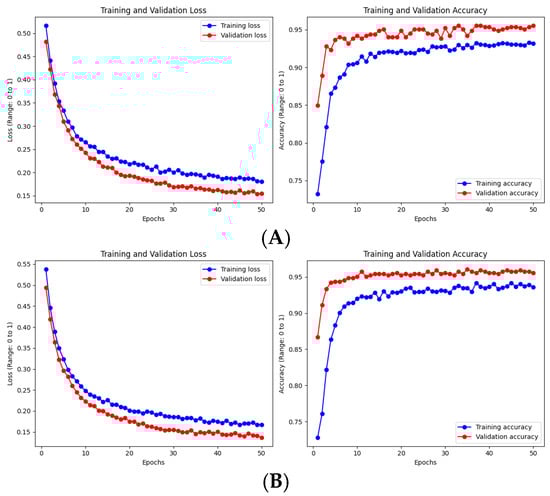
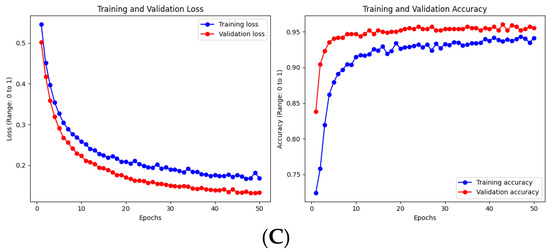
Figure 6.
Evaluation of training and validation metrics for DenseNet models. (A) DenseNet121 with normalized images. (B) DenseNet169 with normalized images. (C) DenseNet201 with normalized images.
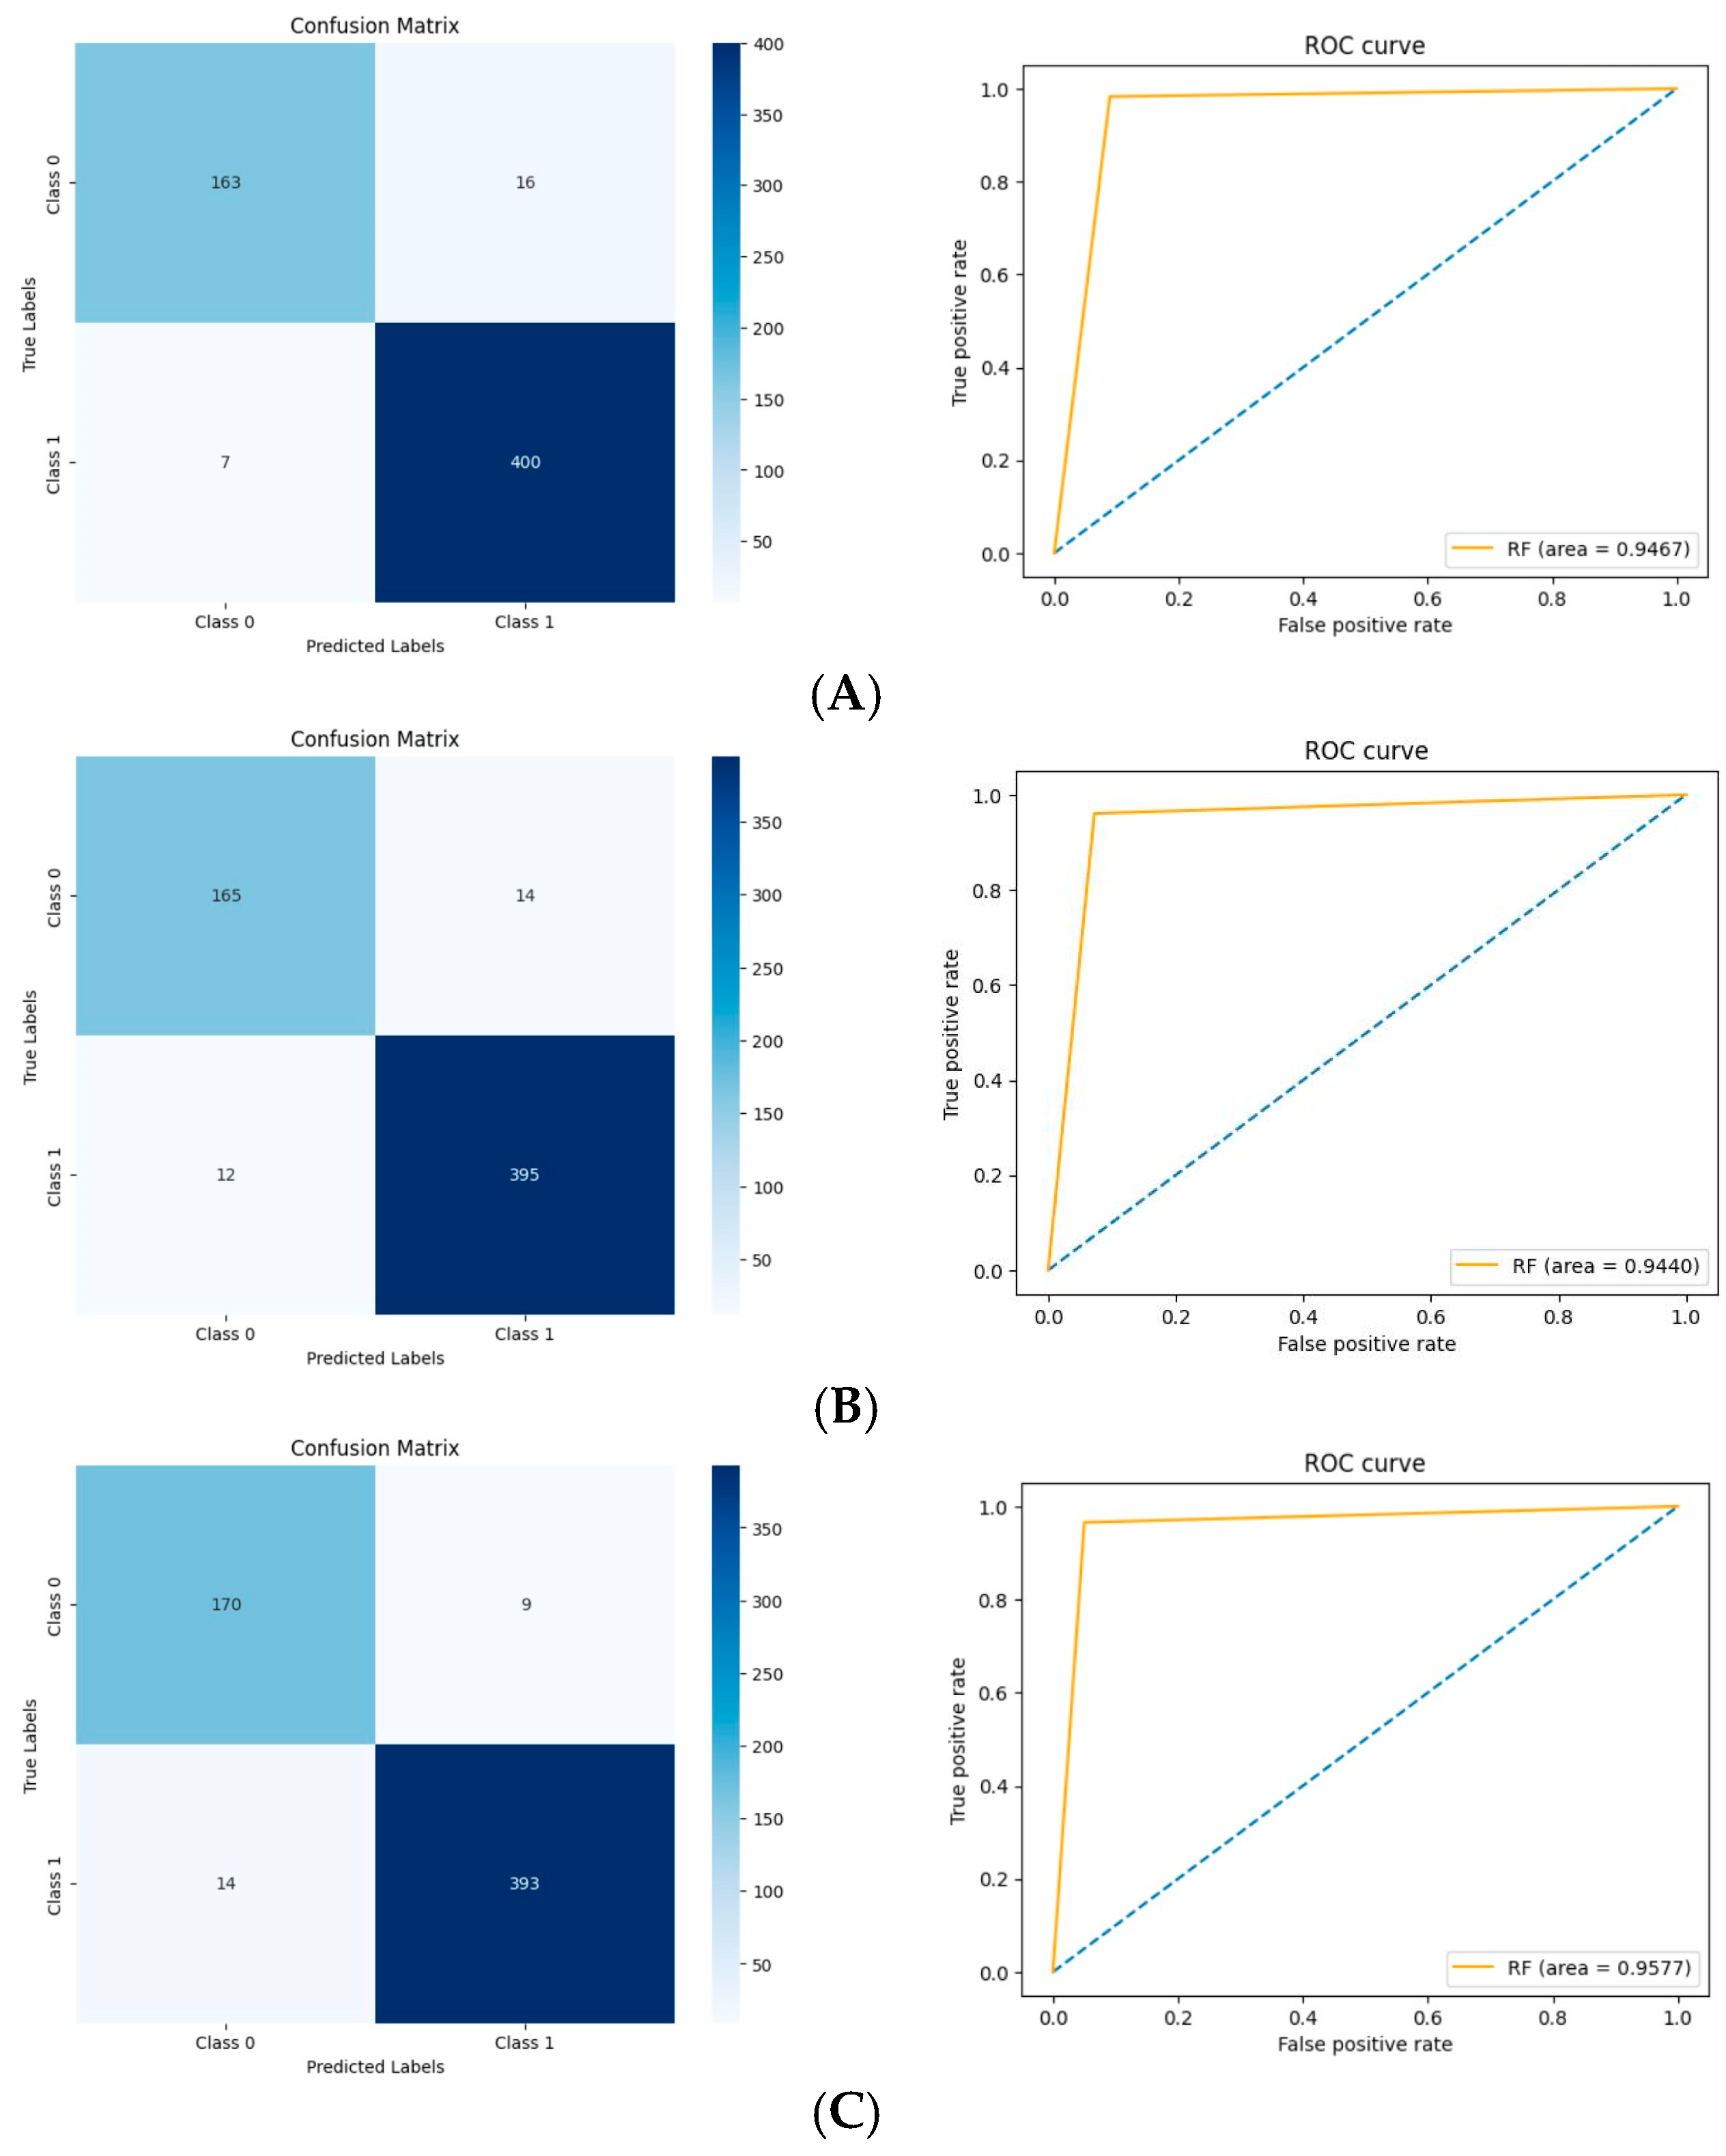
Figure 7 presents the confusion matrices and ROC curves for each model. DenseNet121 misclassified 23 out of 586 images, including 16 as Normal and 7 as Opacity; its ROC AUC score is 0.9467.
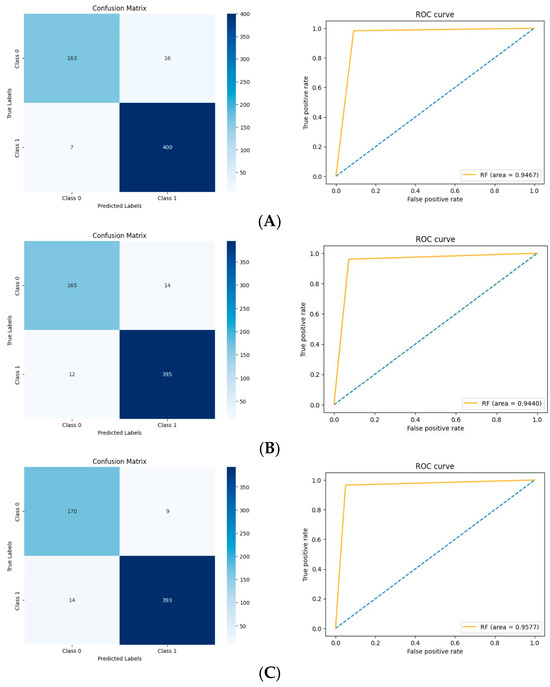
Figure 7.
Comparisons of the results of the models. (A) DenseNet121. (B) DenseNet169. (C) DenseNet201.
DenseNet169 misclassified 26 images out of 586, with 14 labeled as Normal and 16 as Opacity; its ROC AUC score is 0.9440, slightly lower than that of DenseNet121.
DenseNet201 achieved the best overall performance, misclassifying 23 images out of 586, including 9 as Normal and 14 as Opacity. Its ROC AUC score is 0.9577, indicating superior performance compared to the other models.
4. Analysis of DenseNet Training Time and Accuracy
To address the relationship between DenseNet architecture, training time, and accuracy, we conducted an in-depth analysis of various parameters:
4.1. Comparative Analysis of DenseNet Variants
We compared DenseNet121, DenseNet169, and DenseNet201 to understand the impact of model depth on performance and training time. Our findings indicate that while training time increased with model depth, accuracy remained consistent at 96% across all variants. This suggests that for our specific pneumonia classification task, the additional complexity of deeper models did not translate to highly improved performance.
4.2. Analysis of Root Causing Parameters
To understand factors that could potentially impact accuracy, we investigated several key parameters.
4.2.1. Learning Rate
We experimented with various learning rates and found that 0.001 provided the best balance between accuracy and training time. Higher rates led to unstable training, while lower rates resulted in slower convergence.
4.2.2. Data Augmentation
Our pre-processing included resizing, random flips, and normalization. While effective, more advanced augmentation techniques could potentially improve model generalization and accuracy.
4.2.3. Dataset Characteristics
The size and quality of our dataset (5856 images) may not have been large enough to fully leverage the capacity of the deeper DenseNet variants, potentially explaining the consistent accuracy across models.
These findings suggest that for our pneumonia classification task, DenseNet121 with frozen pre-trained weights and a learning rate of 0.001 provided the optimal balance of accuracy and computational efficiency. Future work could explore more sophisticated optimization strategies and larger datasets to potentially improve performance further.
4.3. Performance Metrics
The performance of the three DenseNet variants over five epochs is summarized in Table 3.
Table 3.
Comparison of DenseNet Models Performance.
The table presents a detailed comparison of performance metrics for DenseNet121, DenseNet169, and DenseNet201 across fifty epochs. As is evident from the results, all models exhibit decreasing training and validation losses, indicating effective learning. Notably, DenseNet169 consistently outperforms the other variants in terms of both training and validation loss, achieving the lowest values at the 40th and 50th epochs. While training and validation accuracies remain stable across all models, DenseNet169 achieves a peak validation accuracy of 0.96, suggesting it strikes an optimal balance between model complexity and performance for the pneumonia classification task. These observations align with the overall analysis that additional depth does not yield significant improvements in accuracy for the given dataset size.
5. Future Research Recommendations
Based on our findings and the current state of the field, we recommend the following approaches for fine-tuning image processing using DenseNet for future pneumonia detection research:
5.1. Larger and More Diverse Datasets
To improve the robustness of models, it is essential to collaborate with multiple centers to collect a broader range of chest X-rays. This collaboration should include different types of pneumonia—viral, bacterial, and fungal—as well as different severity levels. Ensuring demographic diversity will also be crucial in enhancing model generalizability. Researchers should aim to compile datasets containing over 50,000 images to fully leverage the capabilities of deep architectures.
5.2. Advanced Data Augmentation Techniques
The implementation of advanced data augmentation techniques will play a vital role in enhancing model performance. For instance, applying elastic deformations can help simulate natural variations commonly observed in chest X-rays. Additionally, exploring methods such as mixup or cutout augmentation could further improve model robustness. Researchers should also investigate the use of Generative Adversarial Networks (GANs) for generating synthetic data, which can provide further variety in training datasets.
5.3. Sophisticated Fine-Tuning Strategies
Sophisticated fine-tuning strategies will be necessary to optimize model performance effectively. This includes experimenting with the gradual unfreezing of DenseNet layers during training to allow for better adaptation. Implementing discriminative fine-tuning with layer-specific learning rates can also contribute to improved outcomes. Moreover, exploring cyclical learning rates or warm restarts may optimize convergence. Investigating the impact of different optimizers, such as Adam and RMSprop, will further enhance understanding of their influence on model performance.
5.4. Attention Mechanisms and Interpretability
Integrating attention mechanisms within the DenseNet architecture is recommended to focus the model on relevant regions of the images. Implementing Gradient-weighted Class Activation Mapping (Grad-CAM) will facilitate the visualization of important areas during the classification process. Furthermore, developing user-friendly interfaces to present model explanations to clinicians will enhance the interpretability and usability of the models in clinical settings.
5.5. Multi-Task Learning and Clinical Integration
Extending the model to enable simultaneous detection of pneumonia, classification of its type, and assessment of severity is an important direction for future research. Additionally, developing multimodal models that combine imaging data with patient history and laboratory results can provide a more comprehensive understanding of the patient’s condition. Investigating the impact of integrating clinical data on model accuracy and generalizability will be crucial for ensuring the effectiveness of the developed tools.
5.6. Model Efficiency and Deployment
Researching model efficiency will be critical for the practical deployment of DenseNet variants, particularly in resource-constrained environments. Techniques such as pruning and quantization should be explored to create efficient models. Additionally, knowledge distillation can be investigated as a means of transferring knowledge from larger models to smaller ones. Developing methods for incremental learning will also be essential to adapt models to new data over time without suffering from catastrophic forgetting.
By addressing these areas, future researchers can significantly advance the application of DenseNet and deep learning in pneumonia detection, potentially leading to more accurate, efficient, and clinically relevant diagnostic tools.
6. Discussion
The results of this study highlight the potential of integrating CNNs, specifically DenseNet architectures, into the diagnostic workflows for pulmonary diseases such as pneumonia. The DenseNet models demonstrated high accuracy, with DenseNet121 achieving an overall accuracy of 96% and DenseNet201 exhibiting superior performance with a ROC AUC score of 0.9577. These results suggest that DenseNet-based models can effectively distinguish between normal and pneumonia-affected lungs in X-ray images, thereby providing a reliable tool for aiding radiologists in diagnosis.
One of the key advantages of the DenseNet architecture is its ability to mitigate the vanishing gradient problem, which is common in deep neural networks. By ensuring that each layer receives inputs from all previous layers, DenseNet models can reuse features more effectively, leading to improved learning efficiency and performance. This feature reuse capability likely contributed to the high accuracy rates observed in this study.
The current investigation, which employs pre-trained DenseNet models for pneumonia diagnosis, represents a significant advancement over traditional diagnostic methods. DenseNet’s innovative architecture allows for better information flow through the network, improving the model’s ability to learn relevant features from X-ray images. The use of pre-trained models also enables faster convergence and superior generalization to new data, providing practical benefits in terms of both accuracy and processing speed.
Moreover, the DenseNet models demonstrated a significant reduction in prediction time, with DenseNet121 achieving the fastest prediction time of 0.011 s per image. This rapid processing capability is particularly important in clinical settings where timely diagnosis is crucial for effective treatment. The ability to quickly and accurately diagnose pneumonia could lead to earlier interventions, potentially reducing the severity of the disease and improving patient outcomes.
The hypothesis that DenseNet architectures would enhance diagnostic accuracy and speed has been supported by the results of this study. DenseNet’s feature reuse mechanism, combined with its ability to handle large datasets efficiently, confirms the hypothesis that these models can significantly improve diagnostic workflows in medical imaging. The results indicate that DenseNet-based models are well-suited for real-time applications in clinical environments, where reducing diagnostic time is critical.
However, while the DenseNet models performed well in this study, there are several areas where further research is warranted. Firstly, the models were trained on a relatively small and specific dataset, which may limit their generalizability to other populations or types of pneumonia. Future studies should explore the application of these models to larger, more diverse datasets to validate their effectiveness across different demographic groups and disease variations.
Additionally, while the DenseNet models showed high accuracy, the small number of misclassifications highlights the need for further refinement. Future research could focus on incorporating more sophisticated data augmentation techniques or combining DenseNet with other architectures to further improve model robustness and reduce the likelihood of misdiagnosis.
Comparison of DenseNet121 Performance
The Table 4 presents the validation metrics of the model in our study, NIH DenseNet121 [13], referred to as NIH DN121, Iyke-Net [14], trained from scratch, and a hybrid neural network, EfficientNet-B0 and DenseNet-121 [15], referred to as E-B0&D-121.
Table 4.
DenseNet201 compared with NIH DenseNet121 [13], Iyke-Net [14], and E-B0&D-121 [15].
The proposed DenseNet201, the largest pre-trained model used in this study, achieved an accuracy of 96.0%, significantly higher than the 86.8% reported by the NIH study [13]. Furthermore, the proposed model demonstrated a superior precision (95.0% vs. 87.0%), recall (96.0% vs. 92.8%), and F1-score (95.0% vs. 89.8%). Additionally, the AUC of the proposed model was 0.9577 compared to 0.86 in the NIH study.
Additionally, the proposed DenseNet201 model outperformed both Iyke-Net [14] and E-B0&D-121 [15] on several key metrics, including Accuracy, Recall, and AUC. This suggests that DenseNet201 excels at distinguishing between positive and negative samples with fewer misclassifications, which is particularly important in tasks where sensitivity to true positives is critical.
However, E-B0&D-121 [15] showed better results in Precision and F1-Score. The higher Precision implies that E-B0&D-121 made fewer false positive predictions, which is valuable in applications where false alarms need to be minimized. The better F1-Score further indicates a more balanced performance in Precision and Recall, suggesting that E-B0&D-121 is more suitable for tasks where both false positives and false negatives are equally undesirable.
Compared to Iyke-Net [14], the proposed model consistently performed better across all metrics. This indicates that DenseNet201 has a superior ability to generalize to unseen data, likely due to its deeper architecture and richer feature representation. In contrast, Iyke-Net [14] has no AUC measured in the cited article (N/A), indicating that the authors did not report or calculate the Area Under the Curve (AUC) as part of their evaluation metrics. Although competitive, it may be more prone to overfitting or have limitations in extracting complex features compared to more sophisticated models like DenseNet201. The trade-offs between these models illustrate the versatility of the DenseNet architecture. While DenseNet201 provides a robust general performance with fewer misclassifications and high recall, models like E-B0&D-121 may be better suited for applications where minimizing false positives is critical. On the other hand, Iyke-Net, though somewhat lagging in overall metrics, remains a valid option for less complex or resource-constrained environments.
Overall, DenseNet201’s superior performance across most metrics indicates its potential as an excellent tool for medical image classification tasks, especially in applications requiring high sensitivity and reduced misclassifications.
7. Conclusions
This study demonstrates the potential of DenseNet-based deep learning models to enhance the diagnostic capabilities of X-ray imaging for pneumonia. By improving accuracy, reducing diagnosis time, and supporting clinical decision-making, these models could play a vital role in the early detection and management of pulmonary diseases. Further research and development are encouraged to refine these models and explore their broader applications in medical imaging.
Author Contributions
Conceptualization, M.B. and G.M.D.; methodology, M.B.; software, M.B.; validation, M.B. and G.M.D.; formal analysis, M.B.; investigation, M.B.; resources, G.M.D.; data curation, M.B.; writing—original draft preparation, M.B.; writing—review and editing, G.M.D.; visualization, M.B.; supervision, G.M.D.; project administration, G.M.D. All authors have read and agreed to the published version of the manuscript.
Funding
This research received no external funding.
Data Availability Statement
The dataset utilized in this study is accessible to the public on Kaggle. It is the “Pneumonia X-ray Dataset” by P. C. Breviglieri (2024). You can find it at the following URL: https://www.kaggle.com/datasets/pcbreviglieri/pneumonia-xray-images accessed on 17 September 2024.
Acknowledgments
We would like to extend our sincere thanks to the creators and maintainers of the Kaggle Pneumonia X-ray dataset, which was instrumental in conducting this study. The datasets and the AI modeling proposed here could serve as valuable assets or services within SEDIMARK.
Conflicts of Interest
The authors declare that they have no conflicts of interest.
Abbreviations
The following abbreviations are used in this article:
| AI | Artificial Intelligence |
| CNN | Convolutional Neural Network |
| ROC | Receiver Operating Characteristic |
| AUC | Area Under the Curve |
| TP | True Positive |
| TN | True Negative |
| FP | False Positive |
| FN | False Negative |
| DenseNet | Densely Connected Convolutional Networks |
| DenseNet121 | DenseNet variant with 121 layers |
| DenseNet169 | DenseNet variant with 169 layers |
| DenseNet201 | DenseNet variant with 201 layers |
| GPU | Graphics Processing Unit |
| CUDA | Compute Unified Device Architecture |
References
- McLuckie, A. Respiratory Disease and Its Management; Springer Science & Business Media: New York, NY, USA, 2009. [Google Scholar]
- World Health Organization Pneumonia, KEY Facts. 2021. Available online: https://www.who.int/news-room/fact-sheets/detail/pneumonia (accessed on 23 August 2024).
- World Health Organization. 2024. Available online: https://www.who.int/health-topics/pneumonia/ (accessed on 23 August 2024).
- Malik, H.; Anees, T.; Al-Shamaylehs, A.S.; Alharthi, S.Z.; Khalil, W.; Akhunzada, A. Deep Learning-Based Classification of Chest Diseases Using X-rays, CT Scans, and Cough Sound Images. Diagnostics 2023, 13, 2772. [Google Scholar] [CrossRef] [PubMed]
- Alzubaidi, L.; Zhang, J.; Humaidi, A.J.; Al-Dujaili, A.; Duan, Y.; Al-Shamma, O.; Santamaría, J.; Fadhel, M.A.; Al-Amidie, M.; Farhan, L. Review of Deep Learning: Concepts, CNN Architectures, Challenges, Applications, Future Directions. J. Big Data 2021, 8, 53. [Google Scholar] [CrossRef] [PubMed]
- Pan, S.J.; Yang, Q. A survey on transfer learning. IEEE Trans. Knowl. Data Eng. 2010, 22, 1345–1359. [Google Scholar] [CrossRef]
- Esteva, A.; Robicquet, A.; Ramsundar, B.; Kuleshov, V.; DePristo, M.; Chou, K.; Cui, C.; Corrado, G.; Thrun, S.; Dean, J. A guide to deep learning in healthcare. Nat. Med. 2019, 25, 24–29. [Google Scholar] [CrossRef]
- Rajpurkar, P. CheXNet: Radiologist-level pneumonia detection on chest X-rays with deep learning. arXiv 2017, arXiv:abs/1711. [Google Scholar]
- Zhong, Z.; Zheng, M.; Mai, H.; Zhao, J.; Liu, X. Cancer image classification based on DenseNet model. J. Phys. Conf. Ser. 2020, 1651, 012143. [Google Scholar] [CrossRef]
- Huang, G.; Liu, Z.; van der Maaten, L.; Weinberger, K.Q. Densely Connected Convolutional Networks. In Proceedings of the IEEE Conference on Computer Vision and Pattern Recognition, Honolulu, HI, USA, 21–26 July 2017. [Google Scholar]
- Breviglieri, P.C. Pneumonia X-ray Dataset. 2024. Available online: https://www.kaggle.com/datasets/pcbreviglieri/pneumonia-xray-images (accessed on 23 August 2024).
- Arora, A. DenseNet architecture. Retrieved from Amaarora’s Blog. 2020. Available online: https://amaarora.github.io/posts/2020-08-02-densenets.html (accessed on 23 August 2024).
- Kundu, R.; Das, R.; Geem, Z.W.; Han, G.T.; Sarkar, R. Pneumonia detection in chest X-ray images using an ensemble of deep learning models. PLoS ONE 2021, 16, e0256630. [Google Scholar] [CrossRef] [PubMed]
- Ikechukwu, A.V.; Murali, S.; Deepu, R.; Shivamurthy, R.C. ResNet-50 vs VGG-19 vs training from scratch: A comparative analysis of the segmentation and classification of Pneumonia from chest X-ray images. Glob. Transit. Proc. 2021, 2, 375–381. [Google Scholar] [CrossRef]
- An, Q.; Chen, W.; Shao, W. A Deep Convolutional Neural Network for Pneumonia Detection in X-ray Images with Attention Ensemble. Diagnostics 2024, 14, 390. [Google Scholar] [CrossRef]


Disclaimer/Publisher’s Note: The statements, opinions and data contained in all publications are solely those of the individual author(s) and contributor(s) and not of MDPI and/or the editor(s). MDPI and/or the editor(s) disclaim responsibility for any injury to people or property resulting from any ideas, methods, instructions or products referred to in the content. |
© 2024 by the authors. Licensee MDPI, Basel, Switzerland. This article is an open access article distributed under the terms and conditions of the Creative Commons Attribution (CC BY) license (https://creativecommons.org/licenses/by/4.0/).