Abstract
Object detection often struggles with accurately identifying visually similar parts, a challenge commonly faced in industrial applications. To address this issue, we propose a clustering methodology based on the visual similarity of 3D object models. This approach is particularly effective when integrated with synthetic image generation, as both processes rely on 3D models. In this case study, we observed more than a 20% increase in classification performance on two different object detector architectures on a validation dataset when training an object detector on visually similar groups rather than on all classes, suggesting the potential of our method as a baseline for a multi-stage classification scheme.
1. Introduction
In recent years, advances in machine learning algorithms used for object detection have increased significantly [1]. Therefore, potential industrial use cases for this technology have been identified and tested [1,2,3]. Even though the quality of these models has improved steadily, they still require a large amount of training data before they can be used in the field [4]. Although some zero-shot object detection models have recently been published, that are designed to work without further training, they usually cannot be used for object identification in an industrial environment without adaptation due to the uniqueness of the objects [5,6]. Because collecting and annotating image data for object detection involves a great amount of manual effort, concepts for using synthetic data have been investigated [7]. Synthetic data for object detection can be generated by rendering 3D-CAD models in a virtual environment. This kind of data collection can be fully automated and is also error free, but it suffers from the Sim2Real gap, which describes the difference between real and synthetic data [8]. Furthermore, groups of industrial parts in a particular application are often visually similar, which makes a distinction quite difficult. When dealing with these two problems at the same time, the use of synthetic data can be unfeasible. In this paper, we propose a concept to measure the visual similarity of 3D models to identify subsets of similar parts using the object’s 3D models. Thus, the concept can be directly combined with a synthetic image generator and is also generally applicable if the object’s 3D models are available. The concept is validated, and the potential benefits are discussed. The paper starts with related work on synthetic data used for object detection and similarity analysis of 3D objects. Afterwards, the concept for clustering visually similar objects based on their 3D models is presented. The Outcomes section describes the effectiveness of the proposed approach by comparing the validation classification loss of multiple object detectors. Finally, a conclusion is given and potential future research aspects are outlined.
2. Related Work
An overview of related works in the field of industrial object detection, the use of synthetic data for object detection, and the analysis of object similarity are presented in this section.
2.1. Industrial Object Detection
In manufacturing, object detection is already widely used across various applications. In particular, during assembly and disassembly processes, accurately identifying and locating components is crucial for automating tasks. For instance, in the removal of screws with a robotic arm, object detection helps identify different screw heads, enabling the selection of the appropriate tool for each screw type [9,10]. This step is essential for automating recycling processes with robotics [11]. Additionally, object detection plays a critical role in quality control. Basmakis et al. successfully identified missing, correctly, or incorrectly assembled rivets, achieving an overall accuracy of 83% [12]. Similarly, Kuo et al. used object detection to spot foreign objects on an assembly line, helping to prevent errors [13].
2.2. Synthetic Data for Object Detection
In contrast to traditional image processing methods, modern methods based on machine learning (ML) do not require an algorithmic description of the procedure, but they require a large amount of data to carry out a learning process. The collection, annotation and labeling of the data required for training an ML model for object detection is problematic and time-consuming. Depending on the complexity of the use case, several thousand images of the objects are required [4]. This process is associated with a high manual workload and is also prone to errors. Therefore, the use of synthetic data offers a promising alternative to the manual collection of ML training data. This type of data can be generated automatically by rendering the corresponding 3D models, which can be labeled automatically without errors [14,15]. The use of specifically tailored synthetic data for certain use cases to train object detectors has already been applied successfully [15,16]. To simplify the generation of synthetic data, Greff et al. published Kubric, which is a framework specialized for synthetic image data generation [17]. Automated access to image databases for backgrounds and interfaces for importing 3D objects allows a large amount of randomized synthetic data to be generated in a short time. Frameworks of this type also offer the potential to be connected to existing and established software systems for product lifecycle management (PLM) in order to create consistent, automated processes [18].
2.3. Object Similarity Analysis
Concepts of similarity analysis for 3D models are based on encoding the 3D model into a comparable representation, often referred to as a signature, descriptor, or embedding. Obuchi et al. applied two-dimensional Fourier transforms to render depth images of an object from multiple perspectives to create descriptors for each of the selected perspectives [19]. These can be analyzed using metrics such as cosine distance or similar evaluations. While this approach only encodes the visual properties of the 3D models, other approaches focus on encoding volumetric features [20] or using rule-based models in order to achieve accurate representations [21]. In recent years, contrastive models have gained much attention for creating meaningful representations for various kinds of inputs. These models try to learn similarities or dissimilarities from the training data. Known contrastive models are CLIP [22] or DINOv2 [23]. These models differ in their training routines, but both result in a meaningful embedding space for the model. Due to the vast amount of data, these models can be used in a zero-shot manner, meaning additional fine-tuning is not mandatory. Nguyen et al. use the DINOv2 model to generate descriptors based on RGB renderings of 3D models [24]. The authors used the cosine distance to classify image patches of real objects by comparing an embedding of the image patch and the 3D models. Li et al. used the CLIP model for remote sensing scene classification, achieving approximately 85% to 95% accuracy depending on the dataset [25].
The utilization of descriptors for machine learning models as an input for clustering algorithms for object classification is proposed by Xie et al. as deep embedded clustering, which can lead to impressive results without any prior knowledge of the object classes [26]. Nevertheless, fine-tuning a contrastive model like CLIP for a specified use case can still result in a boost in performance and should be considered if an adequate amount of training data is available [27].
3. Materials and Methods
In this section, the concept of clustering visually similar objects is presented. An overview of the concept is depicted in Figure 1. The algorithms used for the proposed process are presented and alternatives are discussed to allow future research to be carried out. Subsequently, experiments designed to verify the proposed concept are described.
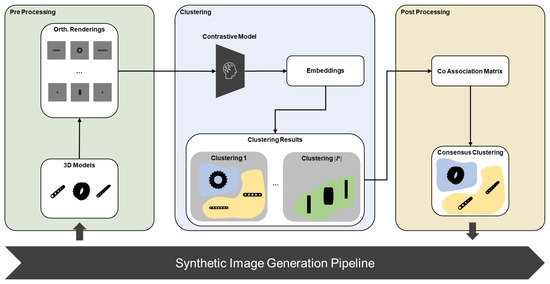
Figure 1.
Overview of the proposed concept separated into 3 stages with the 3D models as the input and the final consensus clustering as the result.
3.1. Similarity Analysis
The concept of similarity analysis is divided into three stages: a pre-processing stage, a main clustering procedure, and a post-processing stage. Furthermore, a procedure for fine-tuning the involved contrastive machine learning model for the intended use case is presented.
3.1.1. Pre-Processing
In the first stage, the 3D models are rendered from different views V (e.g., front, back, upper, lower, left, and right). Depending on the visual complexity of the objects, the amount of views can be adjusted, respectively. All components are analyzed to find the largest object in the set. Its maximum dimension is then scaled to the size of a unit cube. This scaling factor is then applied to all other components to guarantee a complete capture of the objects. The objects are placed at the origin of the environment. To avoid shadows being cast, lights are placed at each of the selected views facing the object. The cameras are placed at a distance of one unit away from the objects. The renderings are made from an orthogonal view in order to map the object without any perspective distortion. Each rendering has a resolution of 224 × 224 pixels, matching the input size of the latter used DINOv2 model. Each image includes three color channels and an alpha channel. The alpha values of the background are set to zero, and its corresponding RGB values are later replaced by a white and black checkerboard pattern. Performing this process guarantees a sharp contrast between the object and the background, even if some of the objects have a dark or white surface color. The rendering procedure is carried out for every view and every object in the set, resulting in images, with N being the total number of 3D models.
3.1.2. Clustering
Afterwards, each image is fed into the contrastive machine learning model DINOv2. This results in a high-dimensional numerical vector representation (embedding) for each image. These Vectors will be used to compare the similarities of the captured objects using a clustering algorithm. In theory, clustering algorithms can be directly applied to high-dimensional vectors. However, reducing the dimension of the data points can help to reveal the intrinsic structure of the data, leading to a better separation of clusters [28], while also reducing the noise of the higher dimensions [29,30]. Furthermore, it can also improve the performance of the clustering algorithm, depending on the algorithm being used. Additionally, lower dimensional data points can easily be visualized. Therefore, the t-distributed stochastic neighbor embedding (t-SNE) algorithm is applied to reduce the dimension of the data points to two dimensions. Alternatively, the use of the uniform manifold approximation and projection technique (UMAP) can be considered.
With the dimension of the data points reduced to two dimensions, the clustering algorithm mean shift is applied. This density-based clustering algorithm has the advantage of being almost non-parametric. It only relies on the bandwidth parameter, which can be estimated using the data points to be clustered. Another required property of this clustering algorithm is that it does not require any prior knowledge of the number of existing clusters, like k-means, as the goal is to identify similar objects by clustering their descriptors. An alternative clustering algorithm with similar properties is the HDBSCAN algorithm. In contrast to the mean shift, HDBSCAN provides more flexibility with different parameters that can be configured and, therefore, requires more specific tailoring for the corresponding use case. The clustering algorithm is applied to each view individually, resulting in an ensemble of different clustering results.
3.1.3. Post-Processing
In the post-processing stage, the different clustering results are analyzed to generate a single, consensus clustering. This is carried out by creating an association matrix, representing how often objects and are in the same cluster, normalized by the total number of different clustering results in the ensemble . By exceeding a predefined threshold, the objects are considered similar and are placed in the same final cluster.
3.2. Fine-Tuning
While this concept can be applied without any adjustments to a pre-trained contrastive model, fine-tuning to a specialized use case may result in a better performance [27]. Therefore, this subsection presents a concept of fine-tuning the contrastive model, aiming for a better clustering performance.
As the ML model is used to analyze the similarity of industrial components, a large and comprehensive set of 3D models of industrial components is required for fine-tuning. Following the rendering procedure in Section 3.1, the 3D models can be rendered from the predefined views. The triplet loss proposed by Chechik et al. [31] is applied to guide the learning process. It consists of three components, an anchor, and a positive and a negative input. The anchor is a randomly selected sample of the training dataset. The triplet loss aims at minimizing the distance between the anchor and the positive input while maximizing the distance between the anchor and the negative input in the embedded space. For a given anchor a positive sample is an image of a similar object, or an image of the same object rendered from a different view. A negative sample is an image of an object of a different category or type of anchor to ensure a dissimilarity between the anchor and the negative. Therefore, it is necessary to group the objects in the dataset based on their similarity. In addition, the data set should include a sufficient number of 3D models so that the zero-shot capability of the contrastive model is preserved.
3.3. Experimental Procedure
To evaluate the effectiveness of the approach, a set of object detectors were trained. All models used the same training and validation images but differed in the class assignment of the objects. For each experiment, a total of three detectors were trained. While the data set for the first detector has exactly one class for each object, the computed clustering is used as the basis for the class assignment of the second data set. A third detector was trained to identify clusters based on a fine-tuned version of the contrastive model. The experiment is carried out twice, using two different object detector architectures, resulting in a total of six trained models. The architectures used are the YOLOv8 model in its small version and the DETR model with a ResNet-50 backbone [32]. In total, 20 LEGO pieces, with different colors and shapes, were selected. Some of the objects have strong visual similarities to each other, while others are deliberately different. This guarantees difficulties in the classification task for an object detector.
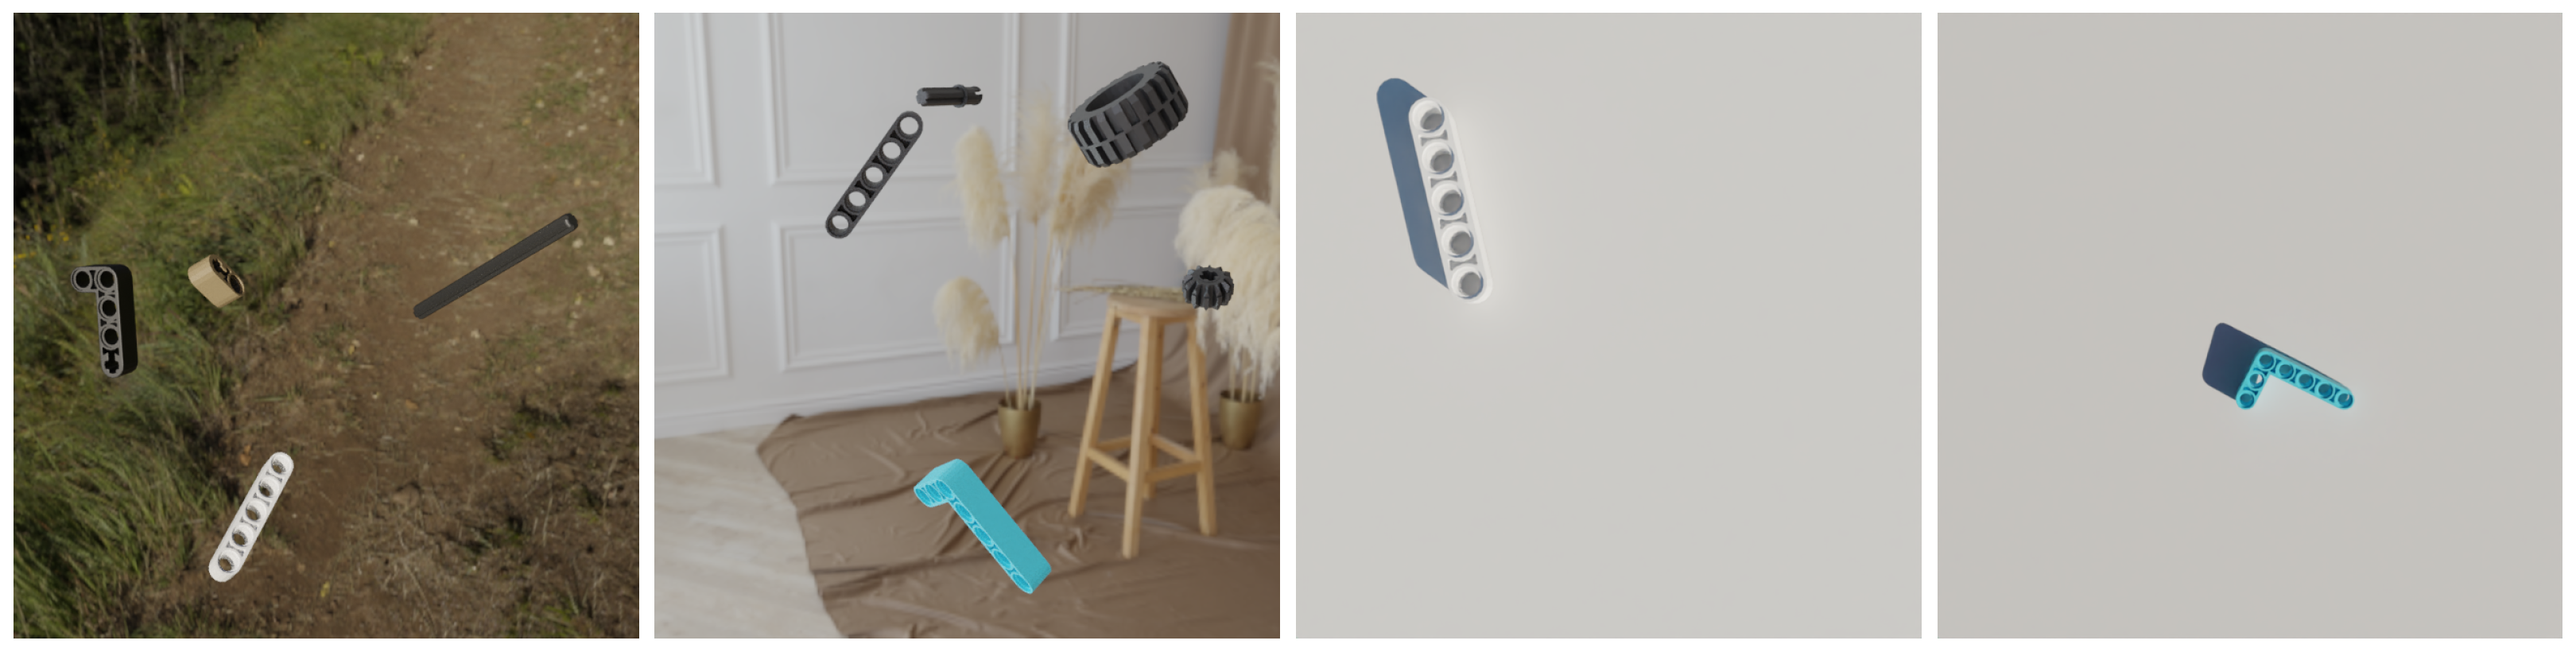
A data generation pipeline was implemented to create the required amount of images synthetically. During the synthetic data generation, one to five objects were placed inside a virtual environment with random orientation. The camera was placed at a random point on a half sphere around the origin, within a variable radius. Given the camera’s distance to the origin and its FOV, a view plane could be calculated. The objects were placed randomly on that plane to ensure visibility to the camera. To differ background and lighting conditions, an HDRI texture was randomly sampled for each image. In total, 1000 images were created this way and used entirely for training.
For the validation images, a more realistic data generation pipeline was implemented. Objects were randomly placed on a flat surface, and a physics simulation was used to calculate physically accurate orientations by simply dropping them from a specified height. The camera was positioned at varying heights above the surface, facing downward. The minimum and maximum camera heights were set to correspond to the radius of the hemisphere used during training data generation. Lighting conditions were randomized by sampling a different HDRI texture for each image. A total of 400 images were generated, with 200 used as validation data and the remaining 200 added to the training dataset. These samples were included in the training set to mitigate the high number of false positives caused by object shadows on the flat surface. The synthetic images are shown in Figure 2.

Figure 2.
Highly randomized synthetic images (left) and physical accurate images (right) are both used for training, while only the physical accurate images are used for validation.
The 3D models of the LEGO parts were rendered from the front, back, upper, lower, right, and left views. The background was set to a checkerboard pattern in order to maintain the contours of the objects. Afterward, the embeddings obtained from inferencing the contrastive model DINOv2 using the ViTs-14 checkpoint were reduced in dimension to 2D using the TSNE algorithm and then grouped using the Mean-Shift algorithm. A threshold of 0.5 was set for the consensus clustering.
For fine-tuning the contrastive model, the training procedure described in the concept section was carried out. As for the dataset used to fine-tune the contrastive model, the DMU-Net dataset was chosen [33]. It consists of 2000 CAD models, grouped into 34 categories. Rendering each CAD model from six views results in a total of 12,000 training images. For the triplet loss, a positive sample was defined as an image of the same object as the anchor, but from a different view. A negative sample was defined as a random image of an object from a different category as the anchor. Additionally, the images were augmented by applying a random rotation and a random horizontal or vertical flip during training. The batch size was set to 16, and the learning rate was set to , using the ADAM optimizer. The training was conducted for 10 epochs. Afterward, the clustering procedure was reapplied, resulting in a new set of clusters, and a third object detector was trained.
4. Results
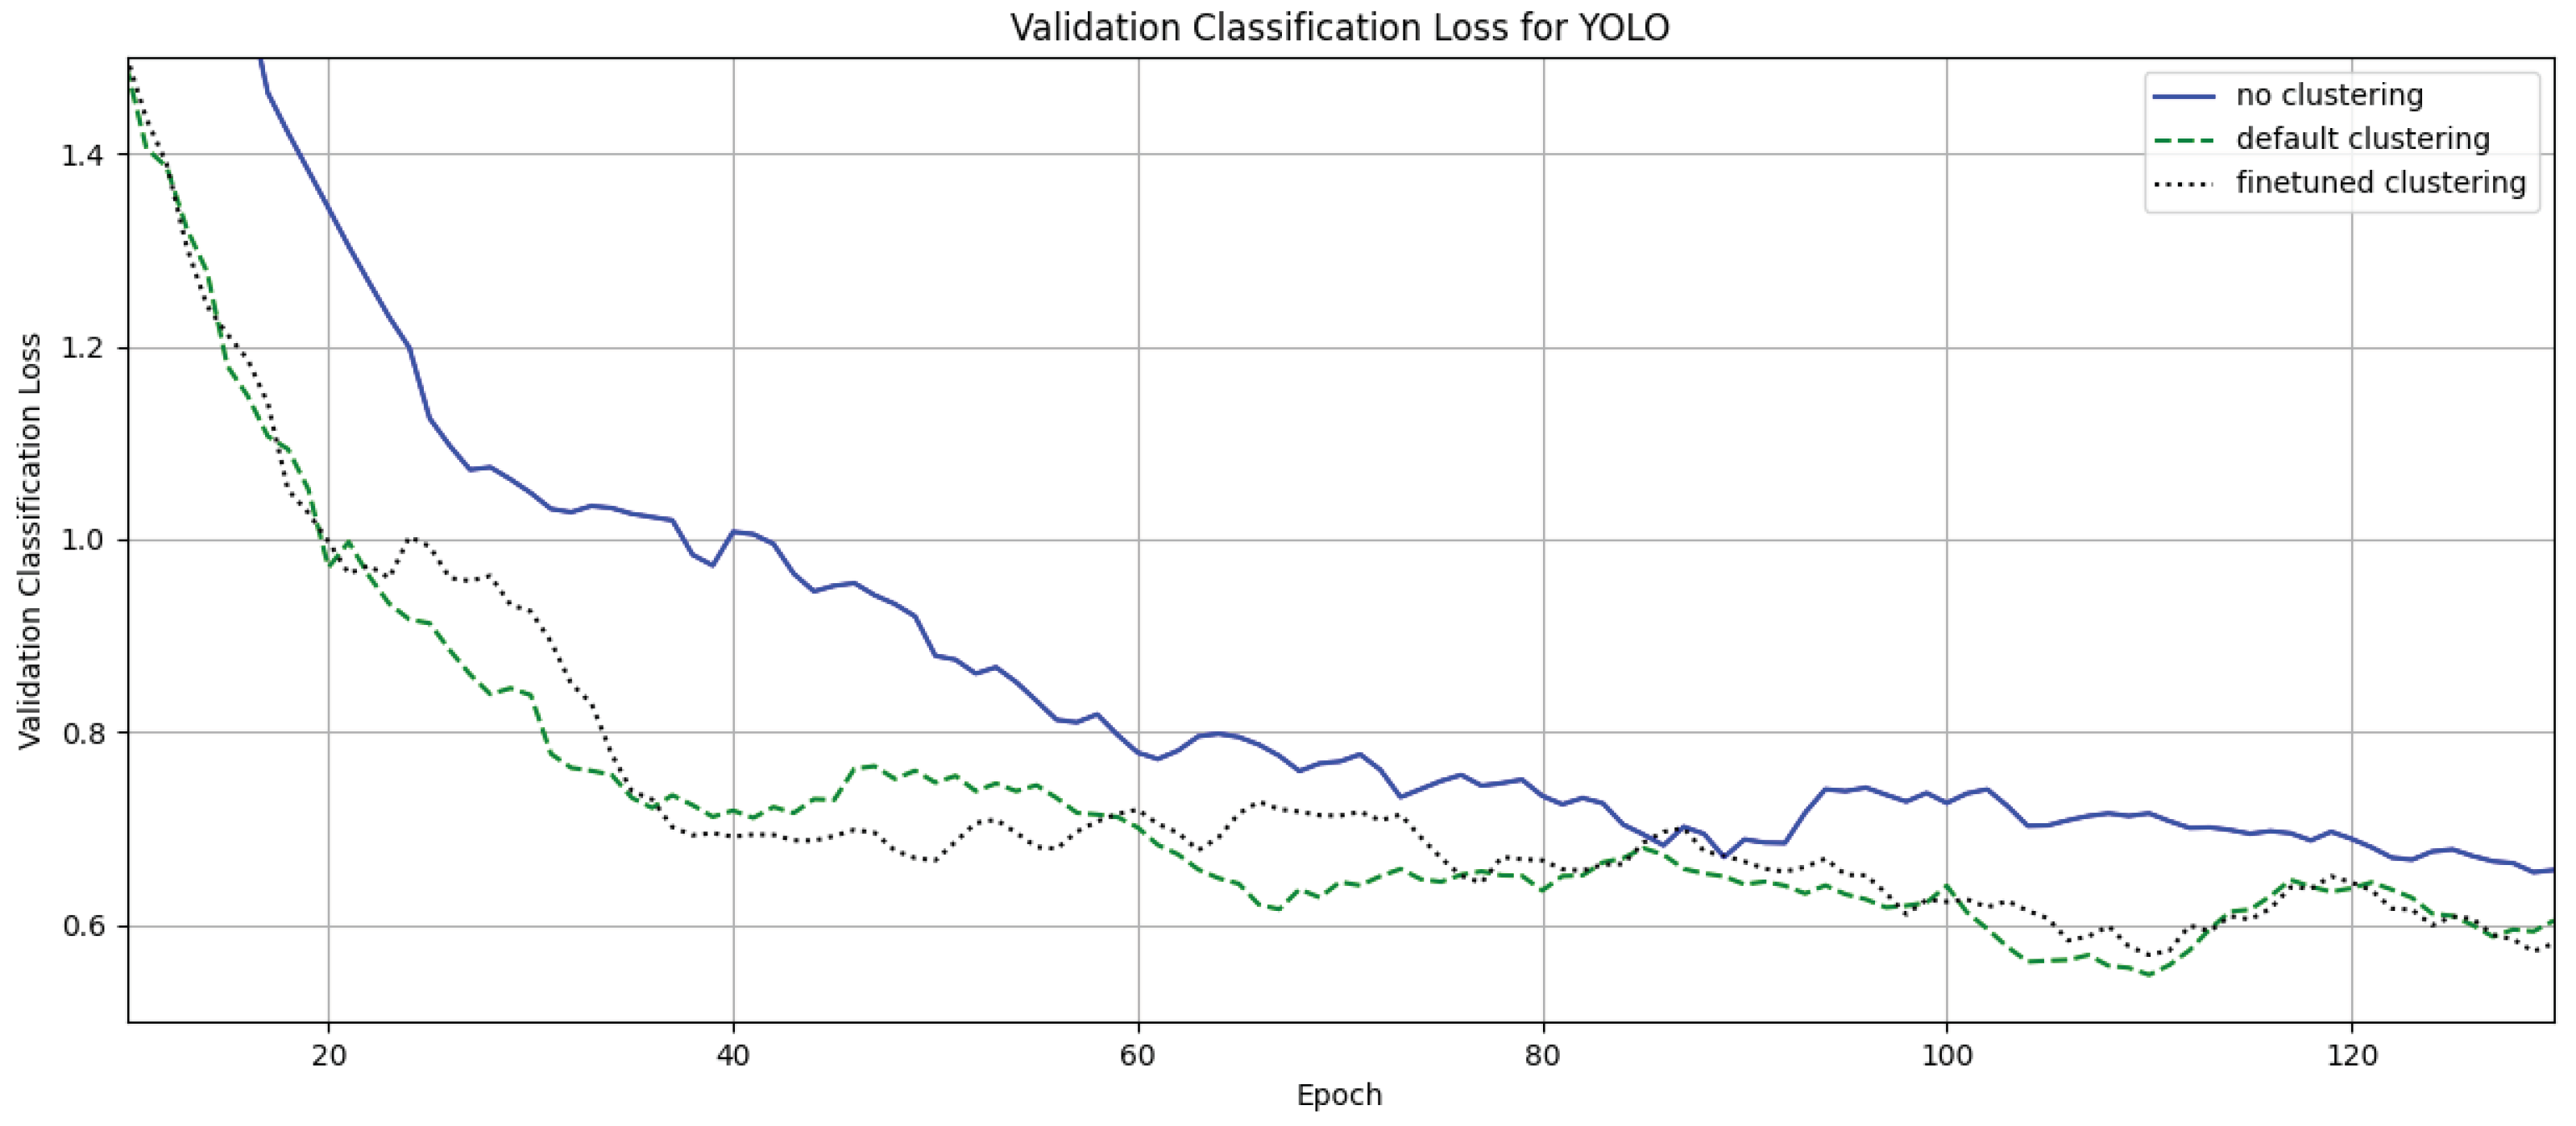
This chapter presents the results of the conducted experiments. The concept was applied to a set of LEGO pieces in order to match visually similar parts. Afterwards, a synthetic image dataset was created and used to train a set of object detectors. The first detector had to identify each part individually, while the second detector had to identify the groups of similar objects based on the similarity matching. The third detector also had to identify groups of similar objects, which were created using a fine-tuned version of the contrastive model. This procedure is carried out for two types of object detector architectures, resulting in a total of six trained models. Finally, the detectors are compared by their classification loss on the validation data. The training of the object detectors was run for 130 epochs, or if no further improvement on the validation data was achieved for 50 epochs, measured by the mean average precision of the model. For the YOLO model, stochastic gradient descent with an initial learning rate of 0.01 was used, in addition to the default augmentation and learning configuration of the ultralytics Python module using version 8.0.186. A learning rate of was used for the DETR model. Figure 3 and Figure 4 are showing a plot of the validation classification error during training for the different object detectors. The numerical results can be found in Table 1 and Table 2 including the improvement in the loss compared to the model trained on the default classes.
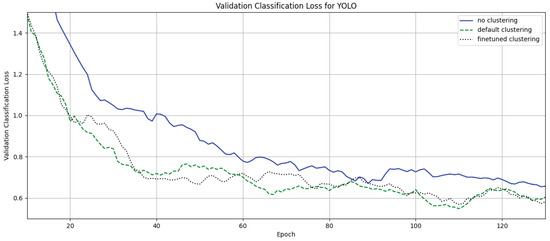
Figure 3.
Classification error during training on the validation data for the yolo model.
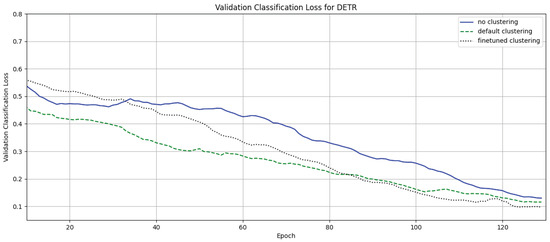
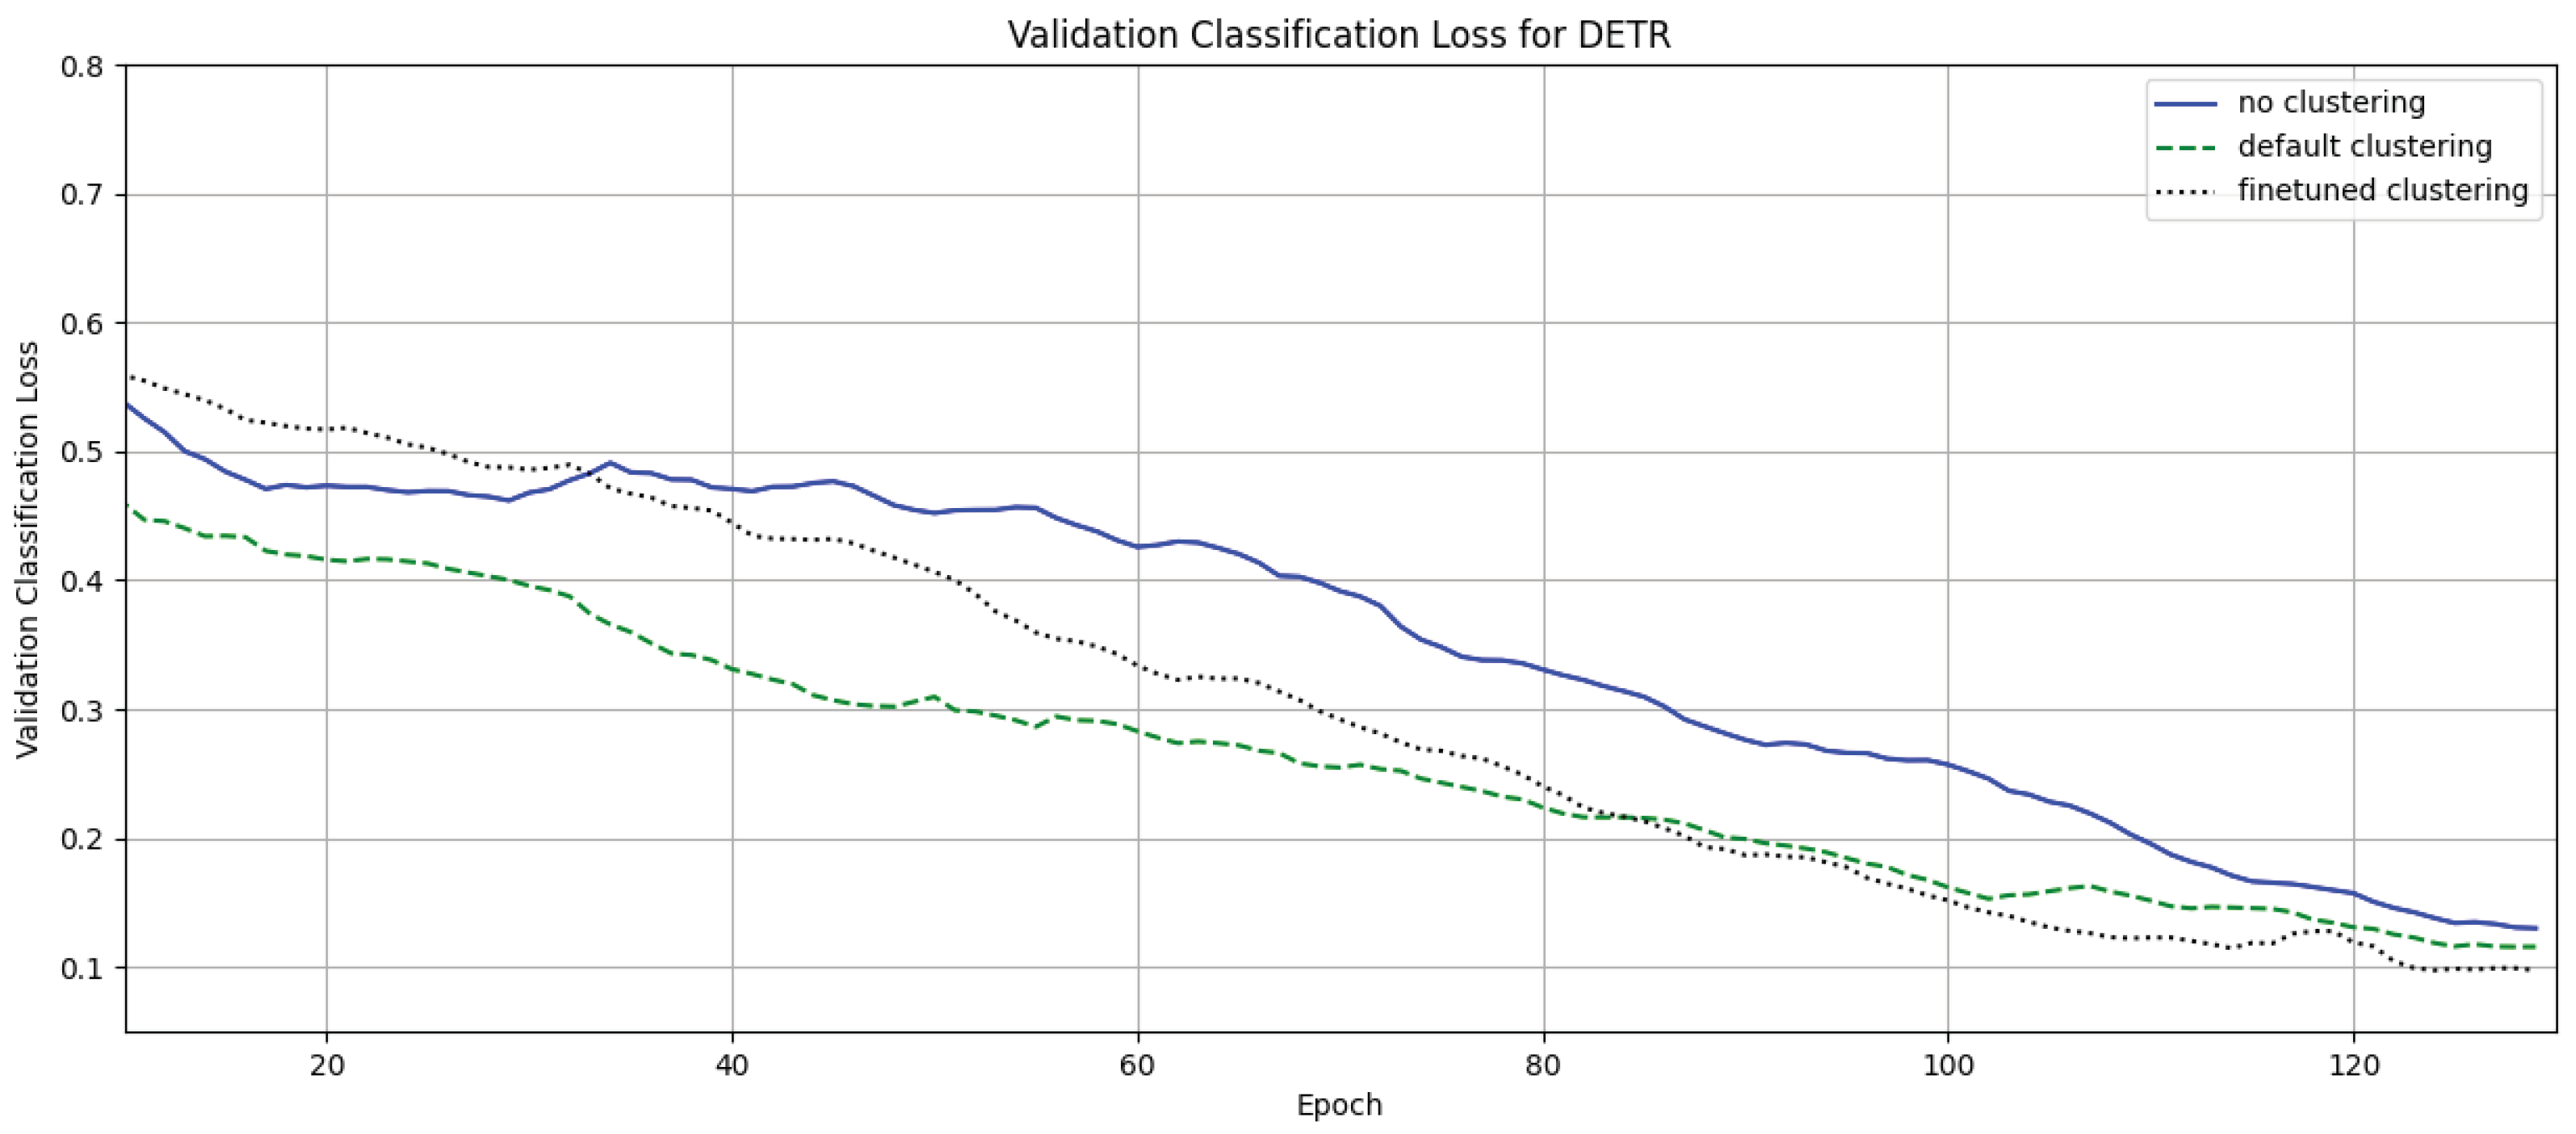
Figure 4.
Classification error during training on the validation data for the detr model.

Table 1.
Validation classification error for the YOLO model.
Table 2.
Validation classification error for the DETR model.
4.1. Clustering Without Fine Tuning
In contrast to an object detection model without any clustering of similar objects, a detector trained to recognize the resulting clusters demonstrates a notable improvement in performance, as measured by the classification error on the validation dataset, for both model architectures. The reduction in classification error during training exceeds 20% for both models when comparing the average error rates. Additionally, an analysis of the minimum classification error during training reveals an improvement of over 20% for the YOLO model and approximately 13% for the DETR model. It is important to highlight that the DETR model, due to its higher number of parameters, generally achieves a lower error rate overall.
4.2. Clustering with Fine-Tuning
The improvement in the classification error for the YOLO model is nearly identical to that of the YOLO model trained on clusters derived from the standard DINOv2 model, falling within a range that lacks statistical significance. However, the DETR model shows a more pronounced improvement, with a reduction of 26.93% in the minimum classification loss and an 11.94% improvement in the average loss during training when compared to the DETR model trained on the default classes. Furthermore, an additional cluster was identified, enhancing the interpretability of the detector’s results. Notably, this outcome was achieved by training the contrastive model for only 10 epochs and using just 12,000 images.
5. Discussion
This section discusses the proposed methodology and the results of the conducted experiments, highlighting both the advantages and limitations of the concept. It also outlines potential areas for future research. Currently, the authors are unaware of any existing research on automated similarity analysis aimed at supporting object detection applications.
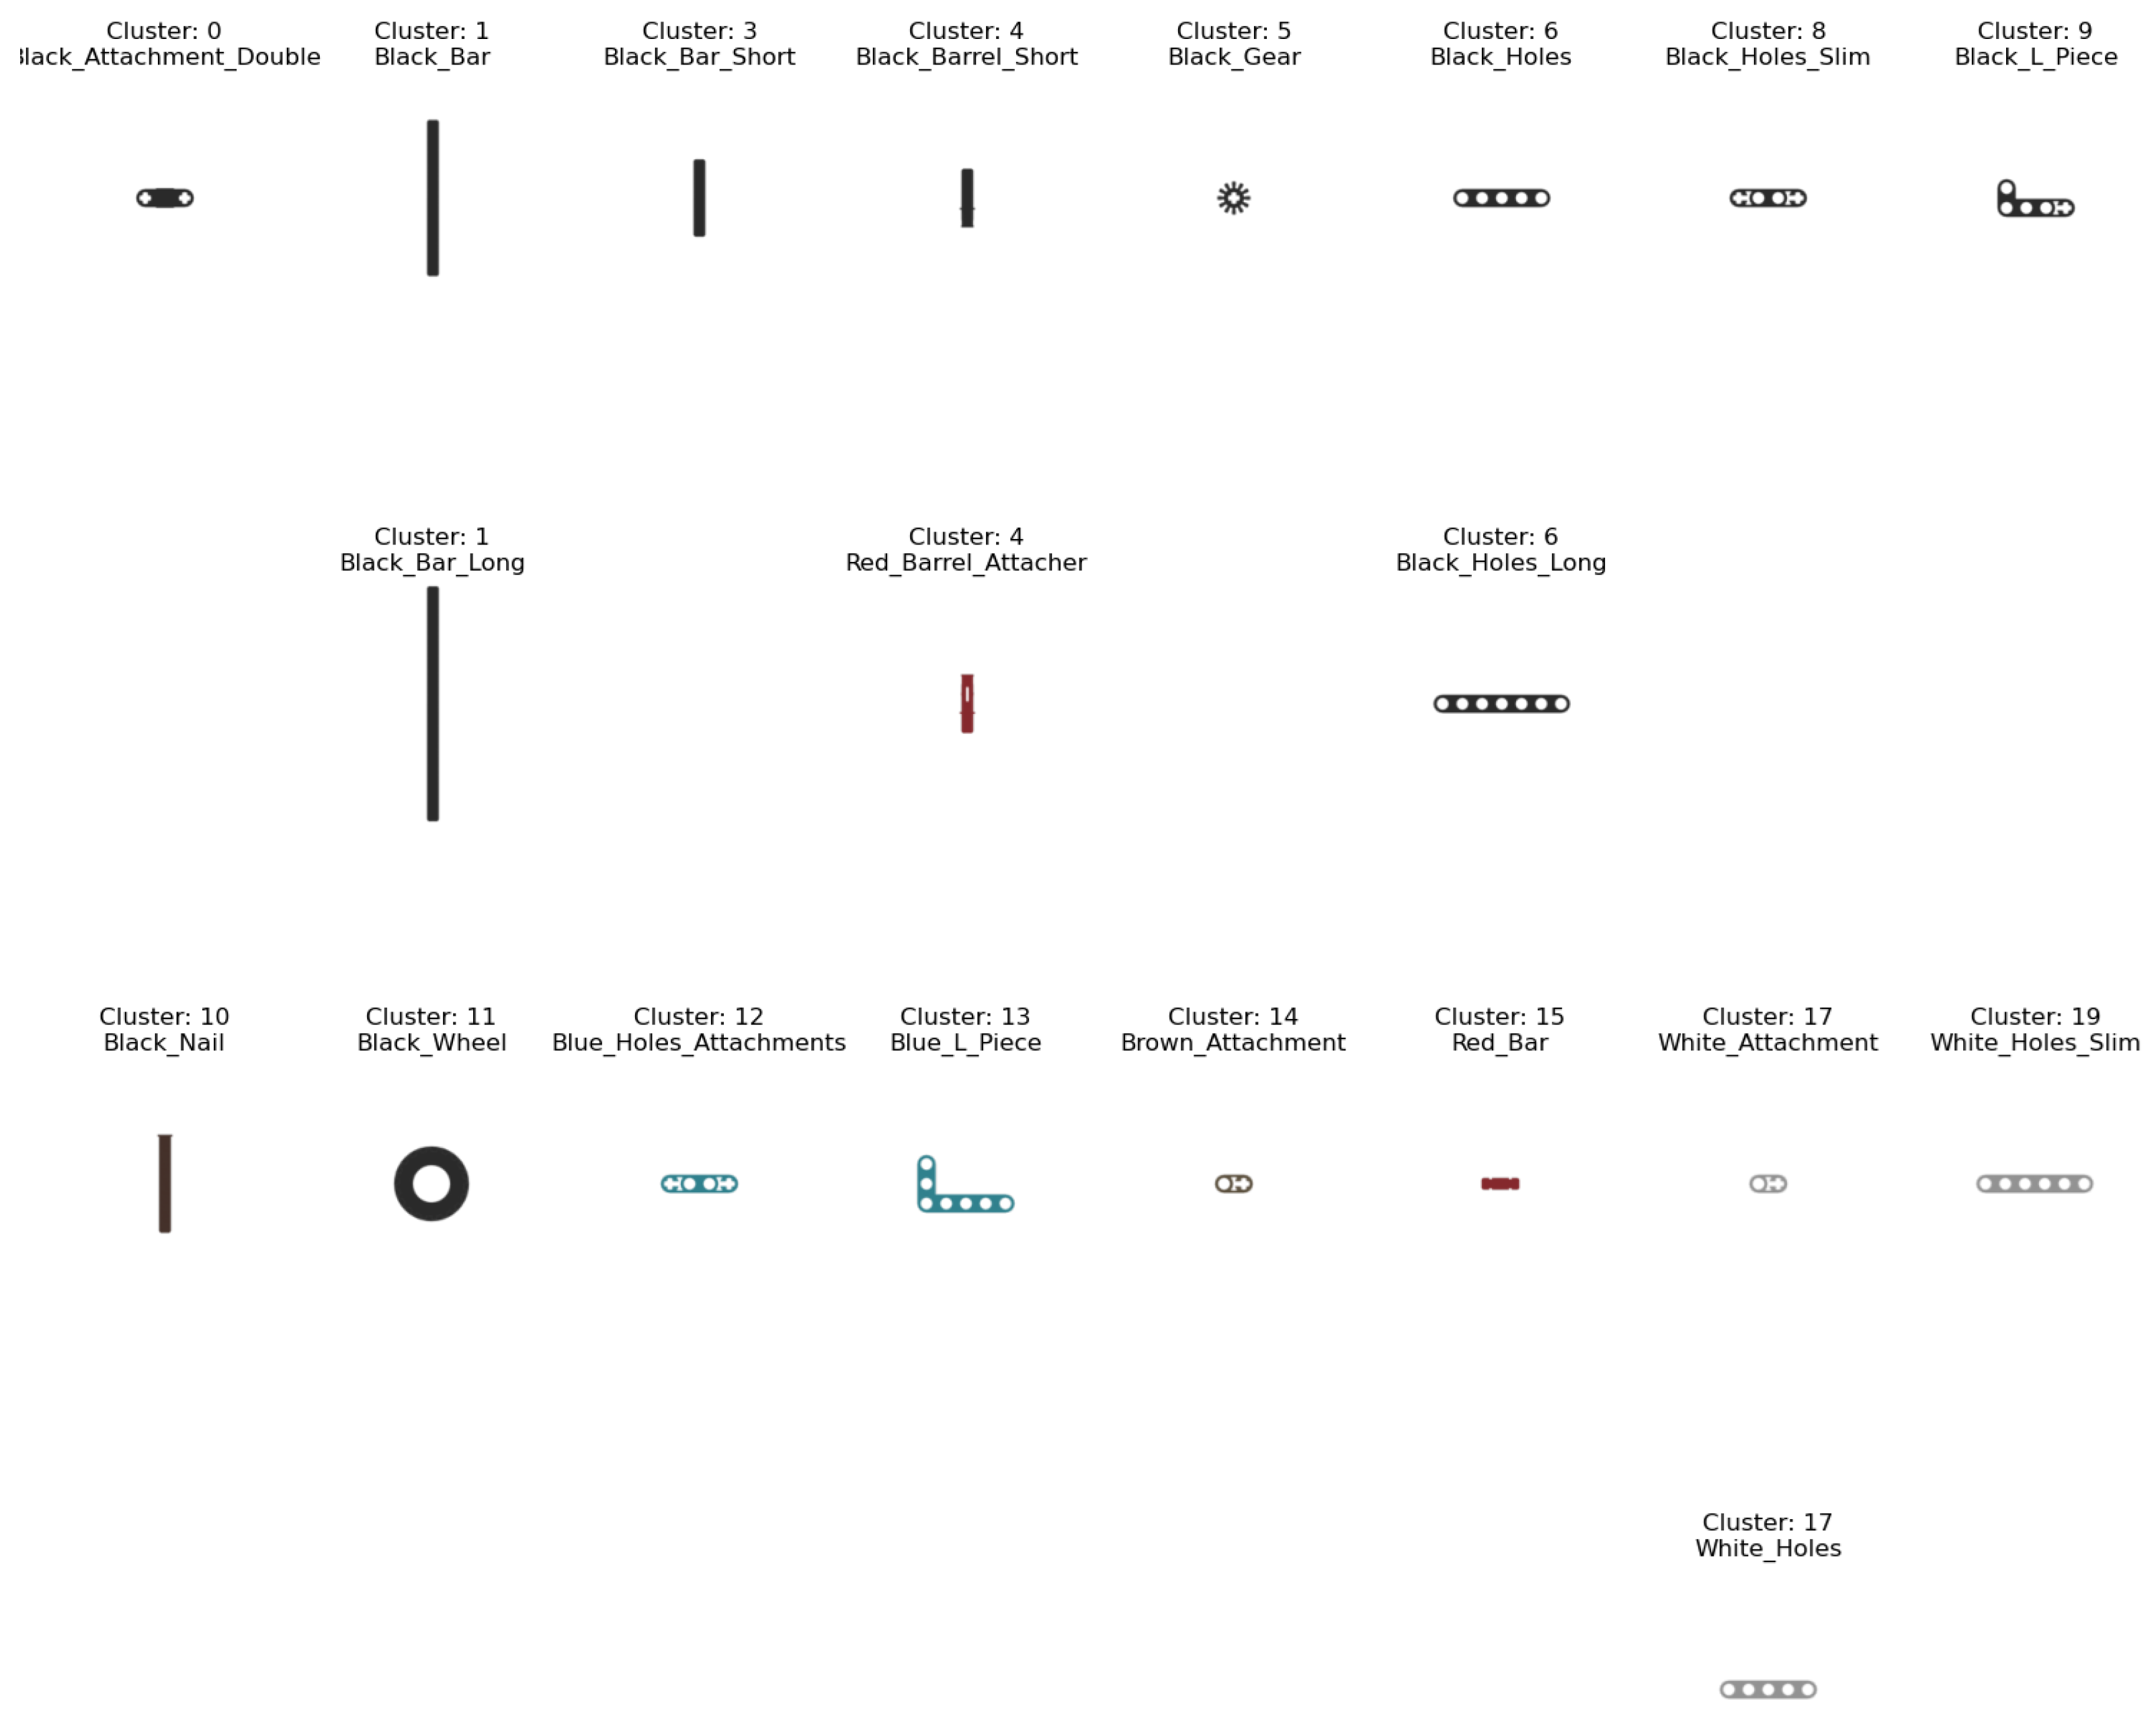
The primary goal of the proposed approach is to group visually similar objects to assess the feasibility of object detection in the desired use case by relying on the availability of 3D models of the objects to be detected. The experiments demonstrate that the identified object groups are intuitive, clustering objects when strong similarities exist. The results of the similarity analysis are shown in Figure 5 and Figure 6. A similarity analysis like this helps to estimate the feasibility and potential problems of applying deep learning models for object recognition in the corresponding use case. The experiments further confirm this statement, as adapting the baseline classes led to a significant reduction in classification error. When revealing strong visual resemblances, countermeasures can be discussed early in the application process. One such strategy could involve hierarchical classification methods, which have been proposed in previous research [34,35,36], most notably in the work of YOLO9000 [37].
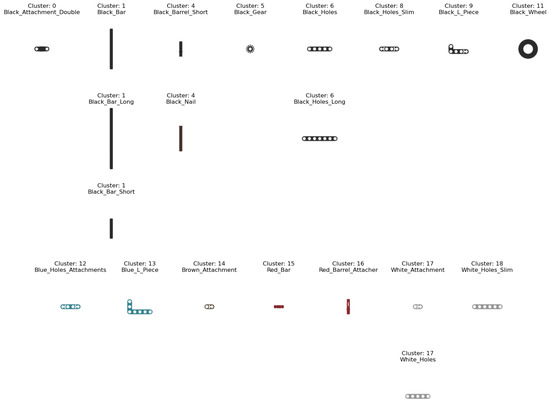
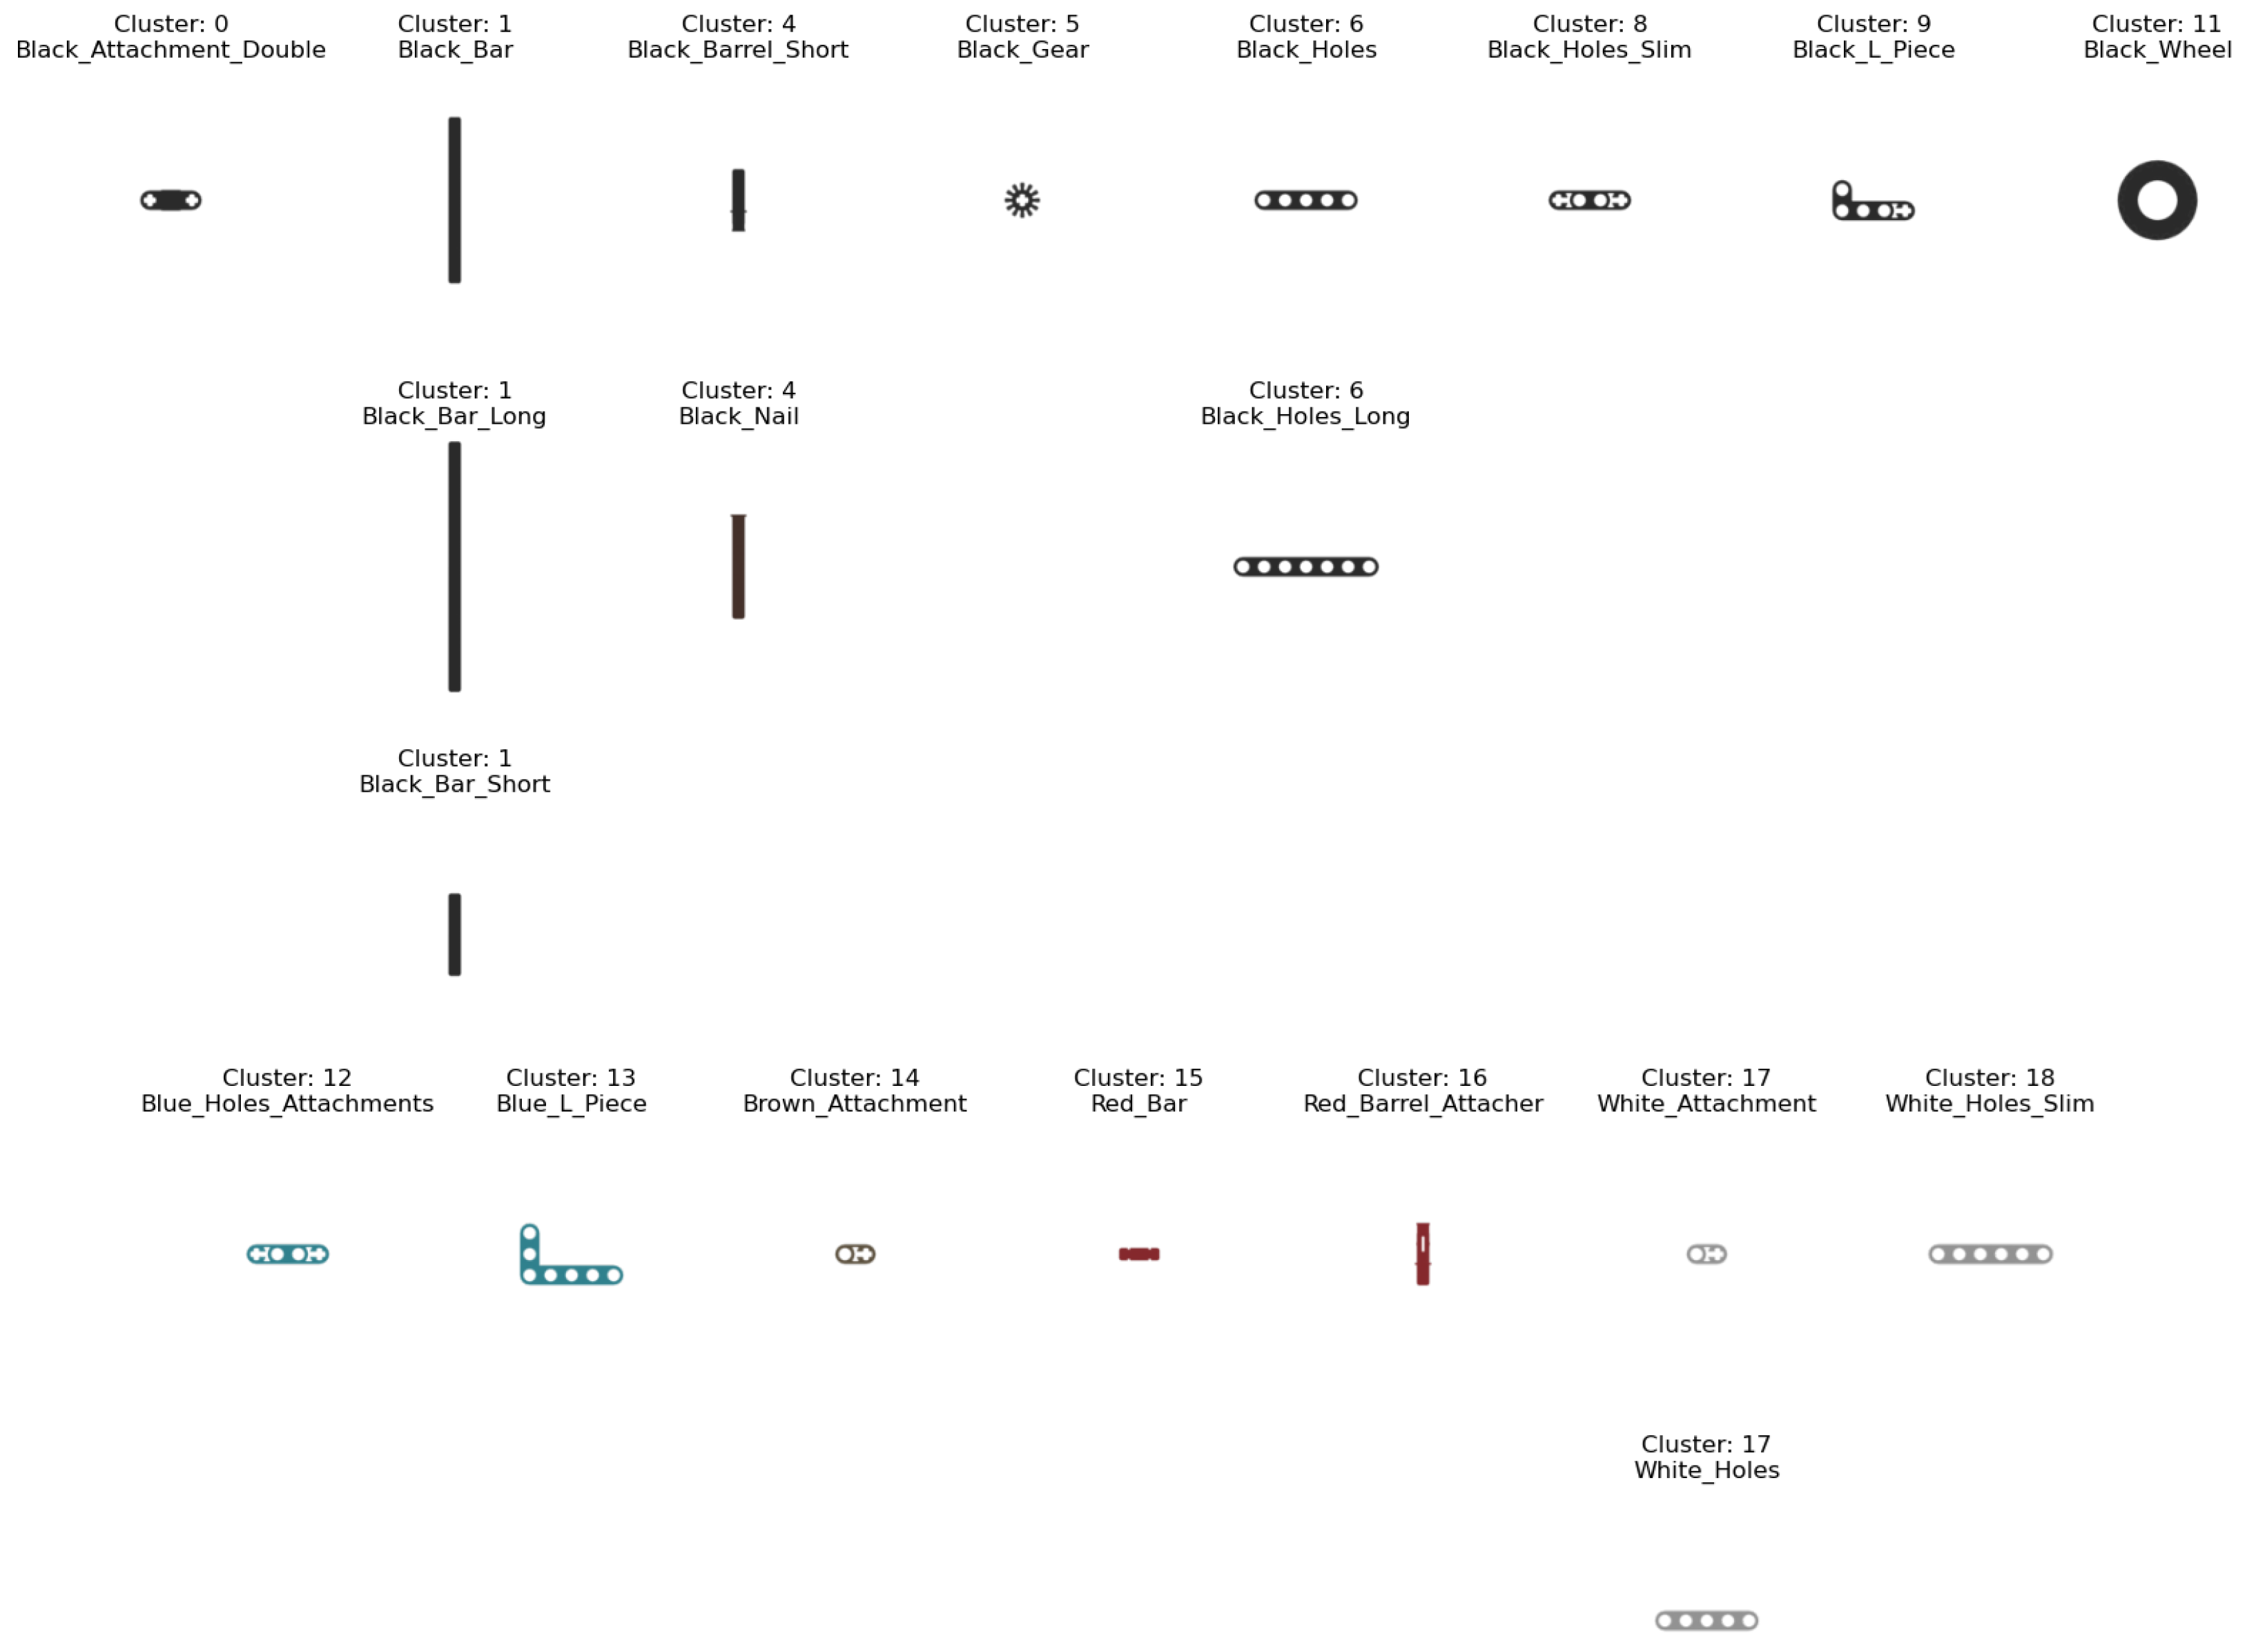
Figure 5.
Embedded clustering of the selected LEGO parts.

Figure 6.
Embedded clustering of the selected LEGO parts using a fine-tuned contrastive model.
A potential challenge when applying the proposed similarity analysis arises if a wide range of object sizes is included in the analysis. The methodology selects a scaling factor based on the largest object in the set and applies it uniformly. This can result in small objects being inadequately visualized in the generated renderings, affecting the grouping accuracy. Alternatively, each object could be scaled to a standard size (e.g., a unit cube). However, with this approach, two similarly shaped objects of different sizes would produce almost identical renderings and embeddings (e.g., as illustrated by the black bars in Figure 6), leading to their incorrect grouping despite their obvious size difference. Therefore, the first approach was chosen in the proposed concept.
Additionally, the accuracy of the 3D models is critical, not only in terms of geometry but also in visual representation. Deviations between the 3D models and the real products could lead to a corresponding misinterpretation of the similarity analysis. Accordingly, a small Sim2Real gap is necessary to obtain high-quality results.
For the 20 LEGO pieces used in the experiments, the overall classification of the objects is both meaningful and comprehensible. Nevertheless, it can be assumed that incorrect clustering behavior can occur, especially when analyzing numerous objects. Since the concept relies on zero-shot contrastive models, accurate classification in the embedding space for the desired application is not guaranteed, meaning that two visually dissimilar objects could be mistakenly grouped together, or two very similar objects are not grouped together (e.g., White_Holes and White_Holes_Slim in Figure 5). To address this issue, the contrastive model was fine-tuned for the use case of analyzing the similarity of single objects. Due to hardware limitations, the training was limited to 10 epochs using 12,000 training images, using a Nvidia RTX 2070 graphic card with 8 GB of video memory and an AMD Ryzen 7 3700X with 32 GB of memory as CPU. While this resulted in a slight change in the clustering result (as seen in the comparison between Figure 5 and Figure 6), it did not lead to any reduction in the average classification error of the object detector model. Only the DETR model achieves a significant improvement for the minimum loss, with consideration that the metric of the smallest error is more prone to outliers during training. It can be assumed that fine-tuning the contrastive model with a larger dataset, such as the ABC dataset [38], over more epochs could potentially enhance the performance further, particularly when clustering a larger set of objects. This should be examined in future research, while also considering a larger amount of objects with more subtle visual differences to be clustered in order to spotlight potential misjudgments of the analysis.
6. Conclusions
In this work, we introduced a methodology for grouping visually similar objects using their 3D models for an embedded clustering technique to address challenges in object detection. This approach not only helps assess the applicability of an object detector in specific use cases but also establishes a baseline for implementing a multi-stage classification strategy. Although designed to integrate seamlessly with synthetic data generation pipelines, our method can also be applied in scenarios with real data if the corresponding 3D models are available.
Our experimental results validate the effectiveness of this approach in the given use case, demonstrating its potential for broader application. For future research, we plan to evaluate the concept with a larger set of objects to confirm its general applicability. Additionally, expanding the dataset and extending the fine-tuning process of the contrastive model are anticipated to further enhance the robustness and accuracy of the proposed method.
Author Contributions
The article is written by J.R. and supervised by D.G. Acquiring the data used for training and implementing the source code was conducted by J.R. and P.K. All authors have read and agreed to the published version of the manuscript.
Funding
This research received no external funding.
Institutional Review Board Statement
Not applicable.
Informed Consent Statement
Not applicable.
Data Availability Statement
The code is made publicly available under https://gitlab.ruhr-uni-bochum.de/lde/machine-learning/similarity-evaluation (accessed on 29 November 2024).
Conflicts of Interest
The authors declare no conflicts of interest.
References
- Hussain, M. YOLO-v1 to YOLO-v8, the Rise of YOLO and Its Complementary Nature toward Digital Manufacturing and Industrial Defect Detection. Machines 2023, 11, 677. [Google Scholar] [CrossRef]
- Yun, H.; Kim, E.; Kim, D.M.; Park, H.W.; Jun, M.B.G. Machine Learning for Object Recognition in Manufacturing Applications. Int. J. Precis. Eng. Manuf. 2023, 24, 683–712. [Google Scholar] [CrossRef]
- Ahmad, H.M.; Rahimi, A. Deep learning methods for object detection in smart manufacturing: A survey. J. Manuf. Syst. 2022, 64, 181–196. [Google Scholar] [CrossRef]
- Riedel, A.; Gerlach, J.; Dietsch, M.; Herbst, S.; Engelmann, F.; Brehm, N.; Pfeifroth, T. A deep learning-based worker assistance system for error prevention: Case study in a real-world manual assembly. Adv. Prod. Eng. Manag. 2021, 16, 393–404. [Google Scholar] [CrossRef]
- Cheng, T.; Song, L.; Ge, Y.; Liu, W.; Wang, X.; Shan, Y. YOLO-World: Real-Time Open-Vocabulary Object Detection. arXiv 2024, arXiv:2401.17270. [Google Scholar]
- Kirillov, A.; Mintun, E.; Ravi, N.; Mao, H.; Rolland, C.; Gustafson, L.; Xiao, T.; Whitehead, S.; Berg, A.C.; Wan-Yen, L.; et al. Segment Anything. In Proceedings of the IEEE/CVF International Conference on Computer Vision (ICCV), Paris, France, 1–6 October 2023. [Google Scholar]
- Baumgart, N.; Lange-Hegermann, M.; Mücke, M. Investigation of the Impact of Synthetic Training Data in the Industrial Application of Terminal Strip Object Detection. arXiv 2024, arXiv:2403.04809. [Google Scholar]
- Trentsios, P.; Wolf, M.; Gerhard, D. Overcoming the Sim-to-Real Gap in Autonomous Robots. Procedia CIRP 2022, 109, 287–292. [Google Scholar] [CrossRef]
- Mangold, S.; Steiner, C.; Friedmann, M.; Fleischer, J. Vision-Based Screw Head Detection for Automated Disassembly for Remanufacturing. Procedia CIRP 2022, 105, 1–6. [Google Scholar] [CrossRef]
- Brogan, D.P.; DiFilippo, N.M.; Jouaneh, M.K. Deep learning computer vision for robotic disassembly and servicing applications. Array 2021, 12, 100094. [Google Scholar] [CrossRef]
- Yildiz, E.; Brinker, T.; Renaudo, E.; Hollenstein, J.; Haller-Seeber, S.; Piater, J.; Wörgötter, F. A Visual Intelligence Scheme for Hard Drive Disassembly in Automated Recycling Routines. In Proceedings of the International Conference on Robotics, Computer Vision and Intelligent Systems, Online, 4–6 November 2020; SCITEPRESS—Science and Technology Publications. pp. 17–27. [Google Scholar] [CrossRef]
- Basamakis, F.P.; Bavelos, A.C.; Dimosthenopoulos, D.; Papavasileiou, A.; Makris, S. Deep object detection framework for automated quality inspection in assembly operations. Procedia CIRP 2022, 115, 166–171. [Google Scholar] [CrossRef]
- Kuo, R.J.; Nursyahid, F.F. Foreign objects detection using deep learning techniques for graphic card assembly line. J. Intell. Manuf. 2023, 34, 2989–3000. [Google Scholar] [CrossRef] [PubMed]
- Židek, K.; Lazorík, P.; Piteľ, J.; Pavlenko, I.; Hošovský, A. Automated Training of Convolutional Networks by Virtual 3D Models for Parts Recognition in Assembly Process. In Advances in Manufacturing II; Trojanowska, J., Ciszak, O., Machado, J.M., Pavlenko, I., Eds.; Springer International Publishing: Berlin/Heidelberg, Germany, 2019; pp. 287–297. [Google Scholar]
- Tao, W.; Lai, Z.H.; Leu, M.C.; Yin, Z.; Qin, R. A self-aware and active-guiding training & assistant system for worker-centered intelligent manufacturing. Manuf. Lett. 2019, 21, 45–49. [Google Scholar] [CrossRef]
- Lai, Z.H.; Tao, W.; Leu, M.C.; Yin, Z. Smart augmented reality instructional system for mechanical assembly towards worker-centered intelligent manufacturing. J. Manuf. Syst. 2020, 55, 69–81. [Google Scholar] [CrossRef]
- Greff, K.; Belletti, F.; Beyer, L.; Doersch, C.; Du, Y.; Duckworth, D.; Fleet, D.J.; Gnanapragasam, D.; Golemo, F.; Herrmann, C.; et al. Kubric: A scalable dataset generator. In Proceedings of the IEEE/CVF Conference on Computer Vision and Pattern Recognition (CVPR), New Orleans, LA, USA, 18–24 June 2022. [Google Scholar]
- Rolf, J.; Wolf, M.; Gerhard, D. Investigation of an Integrated Synthetic Dataset Generation Workflow for Computer Vision Applications. In Product Lifecycle Management. Leveraging Digital Twins, Circular Economy, and Knowledge Management for Sustainable Innovation; IFIP Advances in Information and Communication Technology; Danjou, C., Harik, R., Nyffenegger, F., Rivest, L., Bouras, A., Eds.; Springer Nature: Berlin/Heidelberg, Germany, 2024; Volume 702, pp. 187–196. [Google Scholar] [CrossRef]
- Ohbuchi, R.; Nakazawa, M.; Takei, T. Retrieving 3D shapes based on their appearance. In Proceedings of the 5th ACM SIGMM International Workshop on Multimedia Information Retrieval—MIR ’03, Berkeley, CA, USA, 7 November 2003; Sebe, N., Lew, M.S., Djeraba, C., Eds.; Association for Computing Machinery: New York, NY, USA, 2003; p. 39. [Google Scholar] [CrossRef]
- Kaku, K.; Okada, Y.; Niijima, K. Similarity measure based on OBBTree for 3D model search. In Proceedings of the Proceedings. International Conference on Computer Graphics, Imaging and Visualization, Penang, Malaysia, 26–29 July 2004; pp. 46–51. [Google Scholar] [CrossRef]
- Zehtaban, L.; Elazhary, O.; Roller, D. A framework for similarity recognition of CAD models. J. Comput. Des. Eng. 2016, 3, 274–285. [Google Scholar] [CrossRef]
- Ma, Y.; Xu, G.; Sun, X.; Yan, M.; Zhang, J.; Ji, R. X-CLIP: End-to-End Multi-grained Contrastive Learning for Video-Text Retrieval. In MM ’22: Proceedings of the 30th ACM International Conference on Multimedia, Lisboa, Portugal, 10–14 October 2022; Magalhães, J., Del Bimbo, A., Satoh, S., Sebe, N.T., Alameda-Pineda, X., Jin, Q., Oria, V., Toni, L., Eds.; Association for Computing Machinery: New York, NY, USA, 2022; pp. 638–647. [Google Scholar] [CrossRef]
- Oquab, M.; Darcet, T.; Moutakanni, T.; Vo, H.; Szafraniec, M.; Khalidov, V.; Fernandez, P.; Haziza, D.; Massa, F.; El-Nouby, A.; et al. DINOv2: Learning Robust Visual Features without Supervision. arXiv 2024, arXiv:2304.07193. [Google Scholar] [CrossRef]
- Nguyen, V.N.; Groueix, T.; Ponimatkin, G.; Lepetit, V.; Hodan, T. CNOS: A Strong Baseline for CAD-based Novel Object Segmentation. arXiv 2023, arXiv:2307.11067. [Google Scholar] [CrossRef]
- Li, X.; Wen, C.; Hu, Y.; Zhou, N. RS-CLIP: Zero shot remote sensing scene classification via contrastive vision-language supervision. Int. J. Appl. Earth Obs. Geoinf. 2023, 124, 103497. [Google Scholar] [CrossRef]
- Xie, J.; Girshick, R.; Farhadi, A. Unsupervised Deep Embedding for Clustering Analysis. In Proceedings of the 33rd International Conference on Machine Learning, New York, NY, USA, 19–24 June 2016. [Google Scholar]
- Arutiunian, A.; Vidhani, D.; Venkatesh, G.; Bhaskar, M.; Ghosh, R.; Pal, S. Fine Tuning CLIP with Remote Sensing (Satellite) Images and Captions. 2021. Available online: https://huggingface.co/blog/fine-tune-clip-rsicd (accessed on 22 August 2024).
- Becht, E.; McInnes, L.; Healy, J.; Dutertre, C.A.; Kwok, I.W.H.; Ng, L.G.; Ginhoux, F.; Newell, E.W. Dimensionality reduction for visualizing single-cell data using UMAP. Nat. Biotechnol. 2018, 37, 38–44. [Google Scholar] [CrossRef]
- van der Maaten, L.; Hinton, G. Visualizing Data using t-SNE. J. Mach. Learn. Res. 2008, 9, 2579–2605. [Google Scholar]
- Radford, A.; Kim, J.W.; Hallacy, C.; Ramesh, A.; Goh, G.; Agarwal, S.; Sastry, G.; Askell, A.; Mishkin, P.; Clark, J.; et al. Learning Transferable Visual Models From Natural Language Supervision. In Proceedings of the 38th International Conference on Machine Learning, Virtual, 18–24 July 2021. [Google Scholar]
- Chechik, G.; Sharma, V.; Shalit, U.; Bengio, S. Large Scale Online Learning of Image Similarity Through Ranking. J. Mach. Learn. Res. 2010, 11, 1109–1135. [Google Scholar]
- Carion, N.; Massa, F.; Synnaeve, G.; Usunier, N.; Kirillov, A.; Zagoruyko, S. End-to-End Object Detection with Transformers. arXiv 2020, arXiv:2005.12872. [Google Scholar] [CrossRef]
- Dekhtiar, J.; Durupt, A.; Bricogne, M.; Eynard, B.; Rowson, H.; Kiritsis, D. Deep learning for big data applications in CAD and PLM—Research review, opportunities and case study. Comput. Ind. 2018, 100, 227–243. [Google Scholar] [CrossRef]
- Tresson, P.; Carval, D.; Tixier, P.; Puech, W. Hierarchical Classification of Very Small Objects: Application to the Detection of Arthropod Species. IEEE Access 2021, 9, 63925–63932. [Google Scholar] [CrossRef]
- Gupta, A.; Kalhagen, E.S.; Olsen, Ø.L.; Goodwin, M. Hierarchical Object Detection applied to Fish Species. Nord. Mach. Intell. 2022, 2, 1–15. [Google Scholar] [CrossRef]
- Zwemer, M.H.; Wijnhoven, R.G.J.; de With, P.H.N. Hierarchical Object Detection and Classification Using SSD Multi-Loss. In Computer Vision, Imaging and Computer Graphics Theory and Applications; Communications in Computer and Information Science; Bouatouch, K., de Sousa, A.A., Chessa, M., Paljic, A., Kerren, A., Hurter, C., Farinella, G.M., Radeva, P., Braz, J., Eds.; Springer International Publishing and Imprint Springer: Berlin/Heidelberg, Germany, 2022; Volume 1474, pp. 268–296. [Google Scholar] [CrossRef]
- Redmon, J.; Farhadi, A. YOLO9000: Better, Faster, Stronger. In Proceedings of the IEEE Conference on Computer Vision and Pattern Recognition (CVPR), Honolulu, HI, USA, 21–26 July 2017. [Google Scholar]
- Koch, S.; Matveev, A.; Jiang, Z.; Williams, F.; Artemov, A.; Burnaev, E.; Alexa, M.; Zorin, D.; Panozzo, D. ABC: A Big CAD Model Dataset For Geometric Deep Learning. In Proceedings of the IEEE/CVF Conference on Computer Vision and Pattern Recognition (CVPR), Long Beach, CA, USA, 15–20 June 2019. [Google Scholar]

Disclaimer/Publisher’s Note: The statements, opinions and data contained in all publications are solely those of the individual author(s) and contributor(s) and not of MDPI and/or the editor(s). MDPI and/or the editor(s) disclaim responsibility for any injury to people or property resulting from any ideas, methods, instructions or products referred to in the content. |
© 2024 by the authors. Licensee MDPI, Basel, Switzerland. This article is an open access article distributed under the terms and conditions of the Creative Commons Attribution (CC BY) license (https://creativecommons.org/licenses/by/4.0/).