


A Human-Centered Approach to Academic Performance Prediction Using Personality Factors in Educational AI

 and
and 
Abstract

1. Introduction
- How do personality traits influence academic performance?
- What is the impact of incorporating personality traits into predictive models for student performance?
- Integration of Personality Traits with Traditional Factors: Unlike prior studies that predominantly focus on academic and demographic data, we incorporate personality traits (based on the Big Five model) alongside personal, family, and academic factors. This integration allows for a more holistic analysis of the determinants of student performance, enabling personalized and actionable recommendations.
- Development of a Robust Predictive Framework: Our proposed framework uniquely combines regression and classification tasks, achieving an enhanced predictive accuracy for both continuous (CGPA) and categorical (letter grades) performance metrics. This dual capability fills a gap in prior studies that typically focus on a single predictive objective.
- Comprehensive Comparative Analysis of Predictive Models: We evaluate and compare a range of machine learning models tailored to the SAPEx-D dataset, including traditional and ensemble approaches. This analysis identifies the most effective methods for student performance prediction, offering valuable guidance for researchers and practitioners in selecting appropriate techniques.
- Utilization of Explainable AI (XAI) for Causal Analysis: By applying SHAPs (Shapley Additive explanations) to our predictive models, we provide interpretable insights into the causal relationships among factors influencing student performance. This interpretability not only enhances our trust in the predictions but also informs educators about the most impactful areas for intervention, advancing the practical application of machine learning in education.
- Advancing Tailored Educational Strategies: By integrating advanced predictive techniques and explainable AI, this study provides actionable insights to help educators and policymakers design targeted interventions, particularly for underperforming students. These contributions address limitations in prior work, which often lacked interpretability, holistic analysis, or actionable outcomes.
2. Related Work
2.1. Evolution of Algorithms for Student Performance Prediction
2.2. Hybrid and Ensemble Methods for Student Performance Analysis
2.3. Context-Specific Models and Pedagogical Applications for Student Performance
2.4. Data-Driven Insights and Implications from Traditional and Baseline Models for Student Performance
3. Proposed Methodology
3.1. Dataset
- Openness: A student’s level of creativity and curiosity. Students high in Openness are often more imaginative and willing to explore new ideas.
- Conscientiousness: This entails a student’s level of organization, dependability, and discipline. The highly conscientious student tends to be more responsible and goal-oriented.
- Extraversion: Measures a student’s sociability and assertiveness. Extraverted students are generally more outgoing and energetic.
- Agreeableness: Reflects a student’s tendency towards compassion and cooperation. A high Agreeableness will, therefore, mean more sensitive and cooperative students.
- Neuroticism: This refers to the emotional stability of a student and a person’s tendency to experience negative emotions. High Neuroticism would thus relate to high stress and anxiety levels.
3.2. Data Preprocessing
3.2.1. Removal of Duplication and Missing Values
3.2.2. Data Encoding
3.2.3. Feature Scaling
- X represents the original value of the variable.
- represents the normalized value of variable.
- Min (X) represents the minimum value of the variable across all instances.
- Max(X) represents the maximum value of the variable across all instances.
3.2.4. Output (CGPA) Distribution
3.2.5. Evaluation Measures
4. Experimental Results
4.1. Analysis of Student Performance Based on CGPA Using Machine Learning Techniques
4.1.1. CGPA Prediction Exclusion of Personality Factors
4.1.2. CGPA Prediction Including Personality Factors
4.2. Analysis of Student Performance Based on Letter Grade Using Machine Learning Technqiues
4.2.1. Letter Grade Classification with Exclusion of Personality Factors
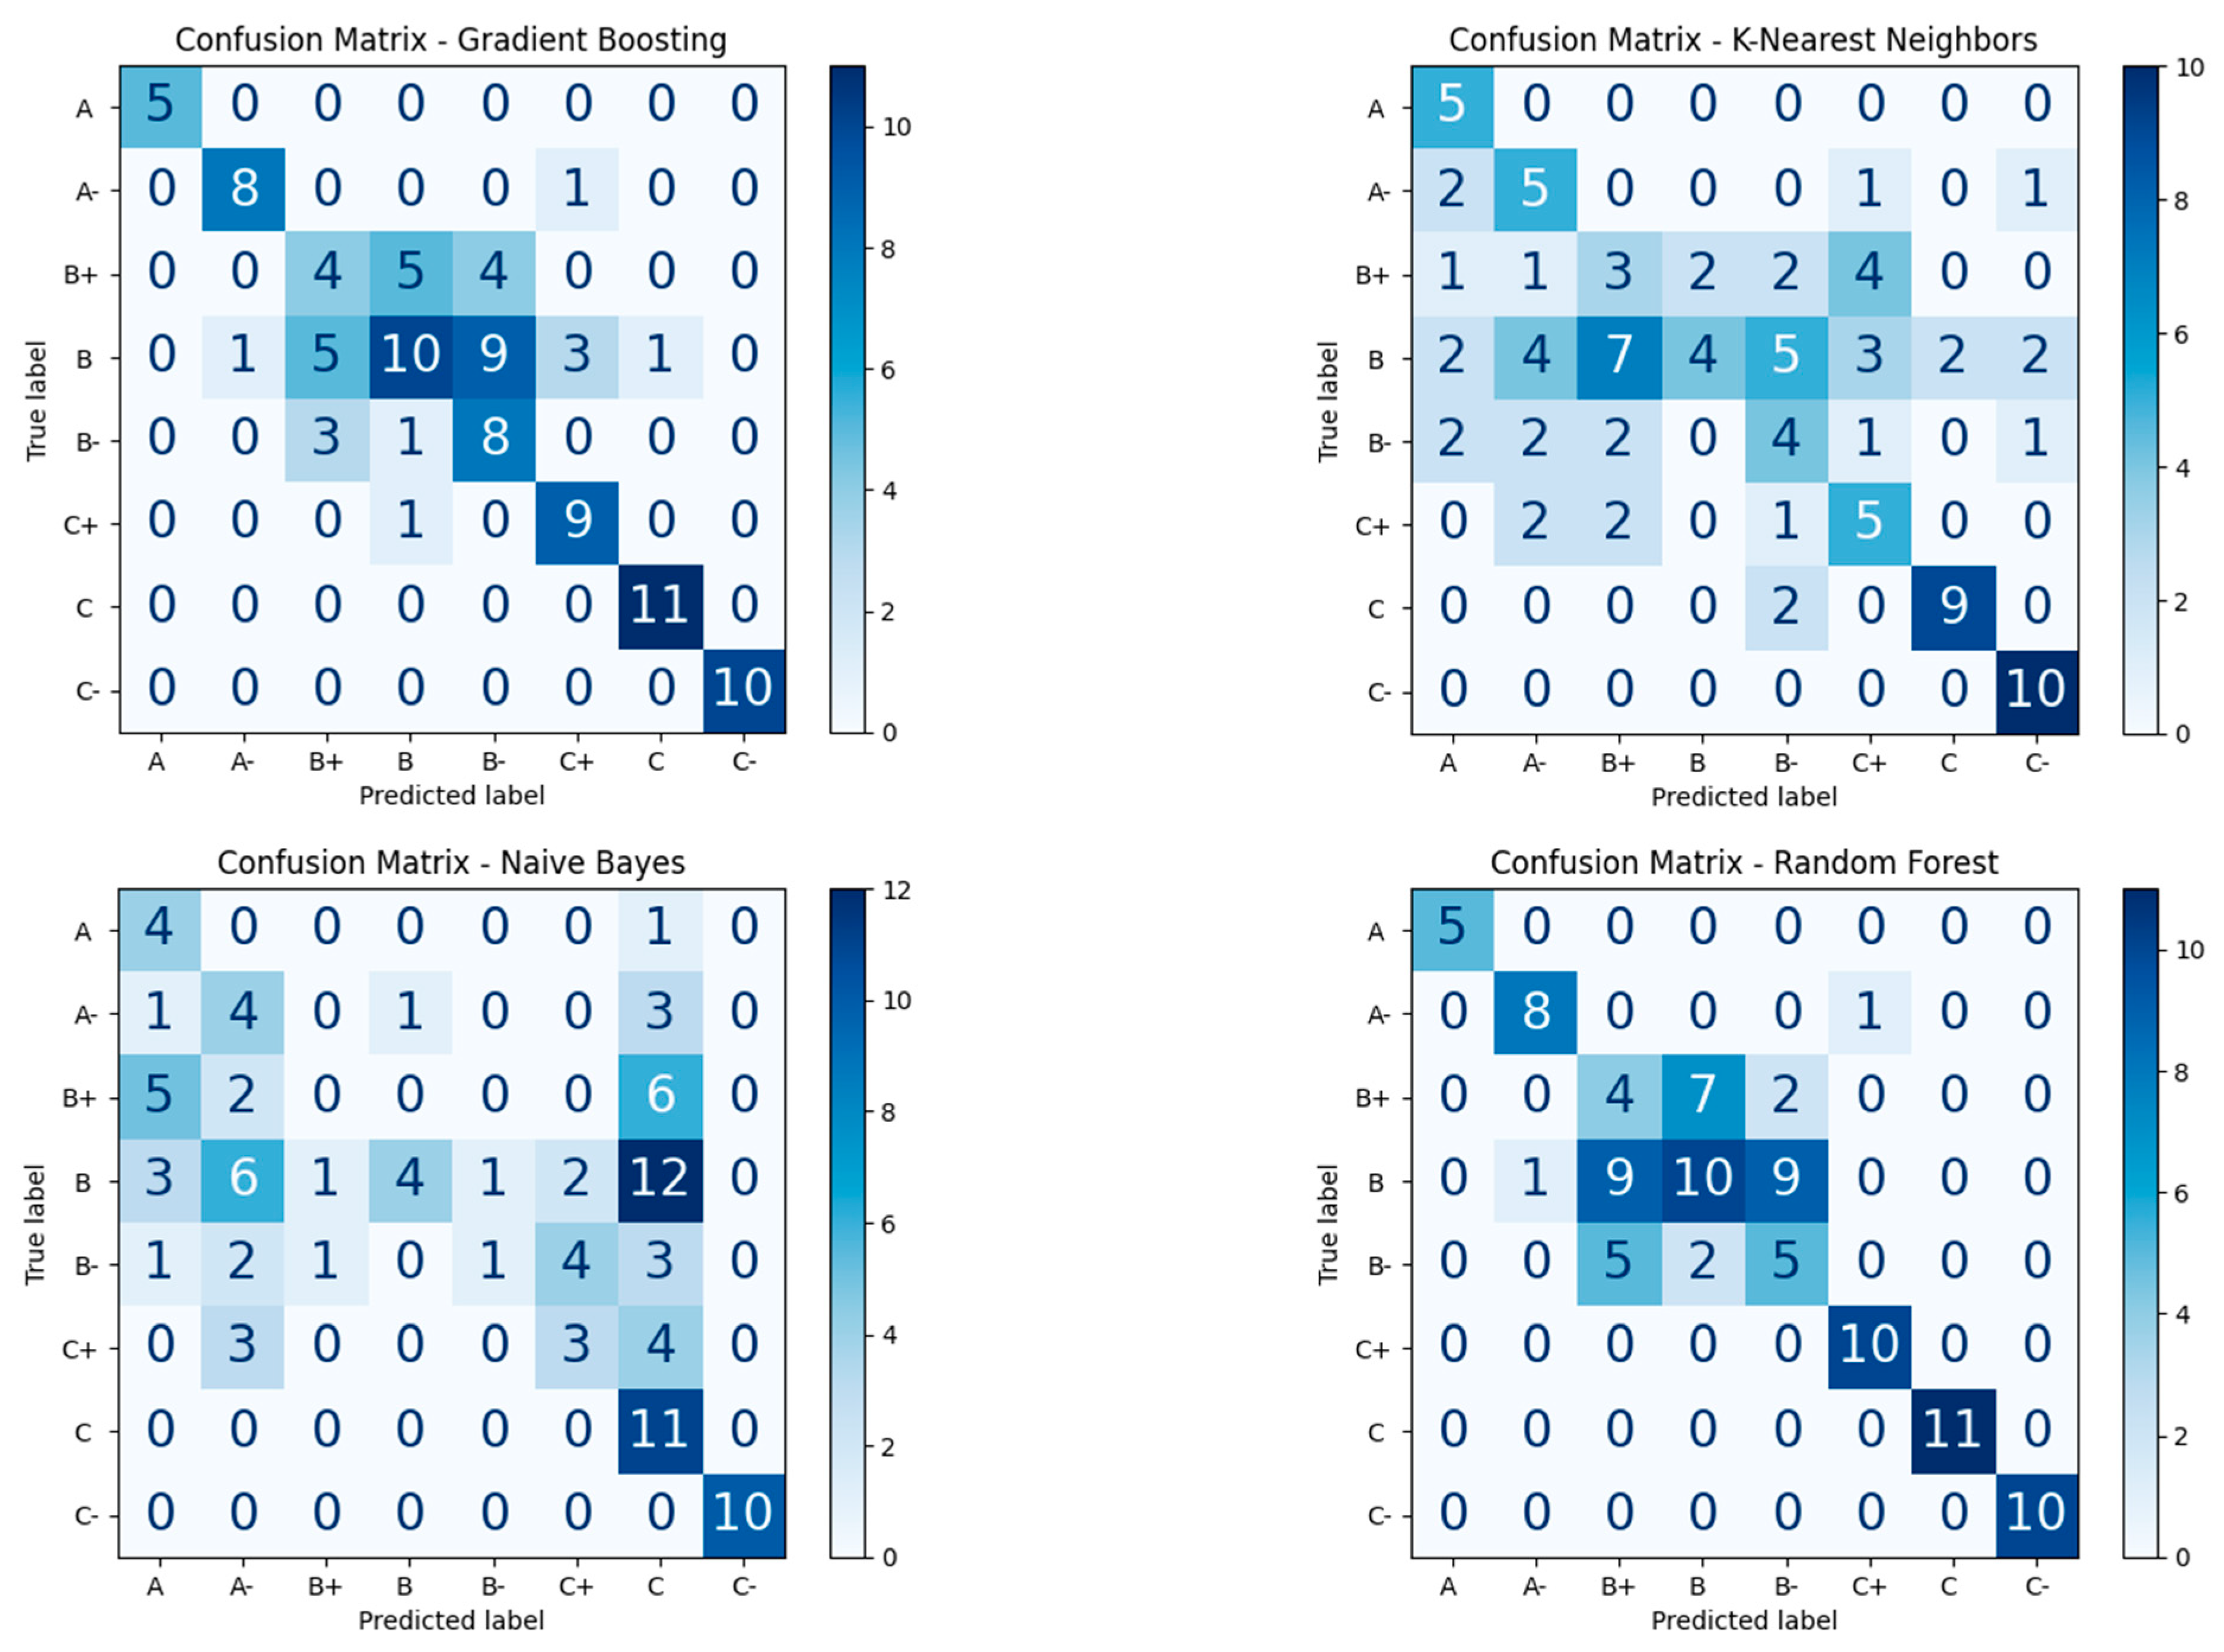
Letter Grade Classification with Eight Distinct Classes
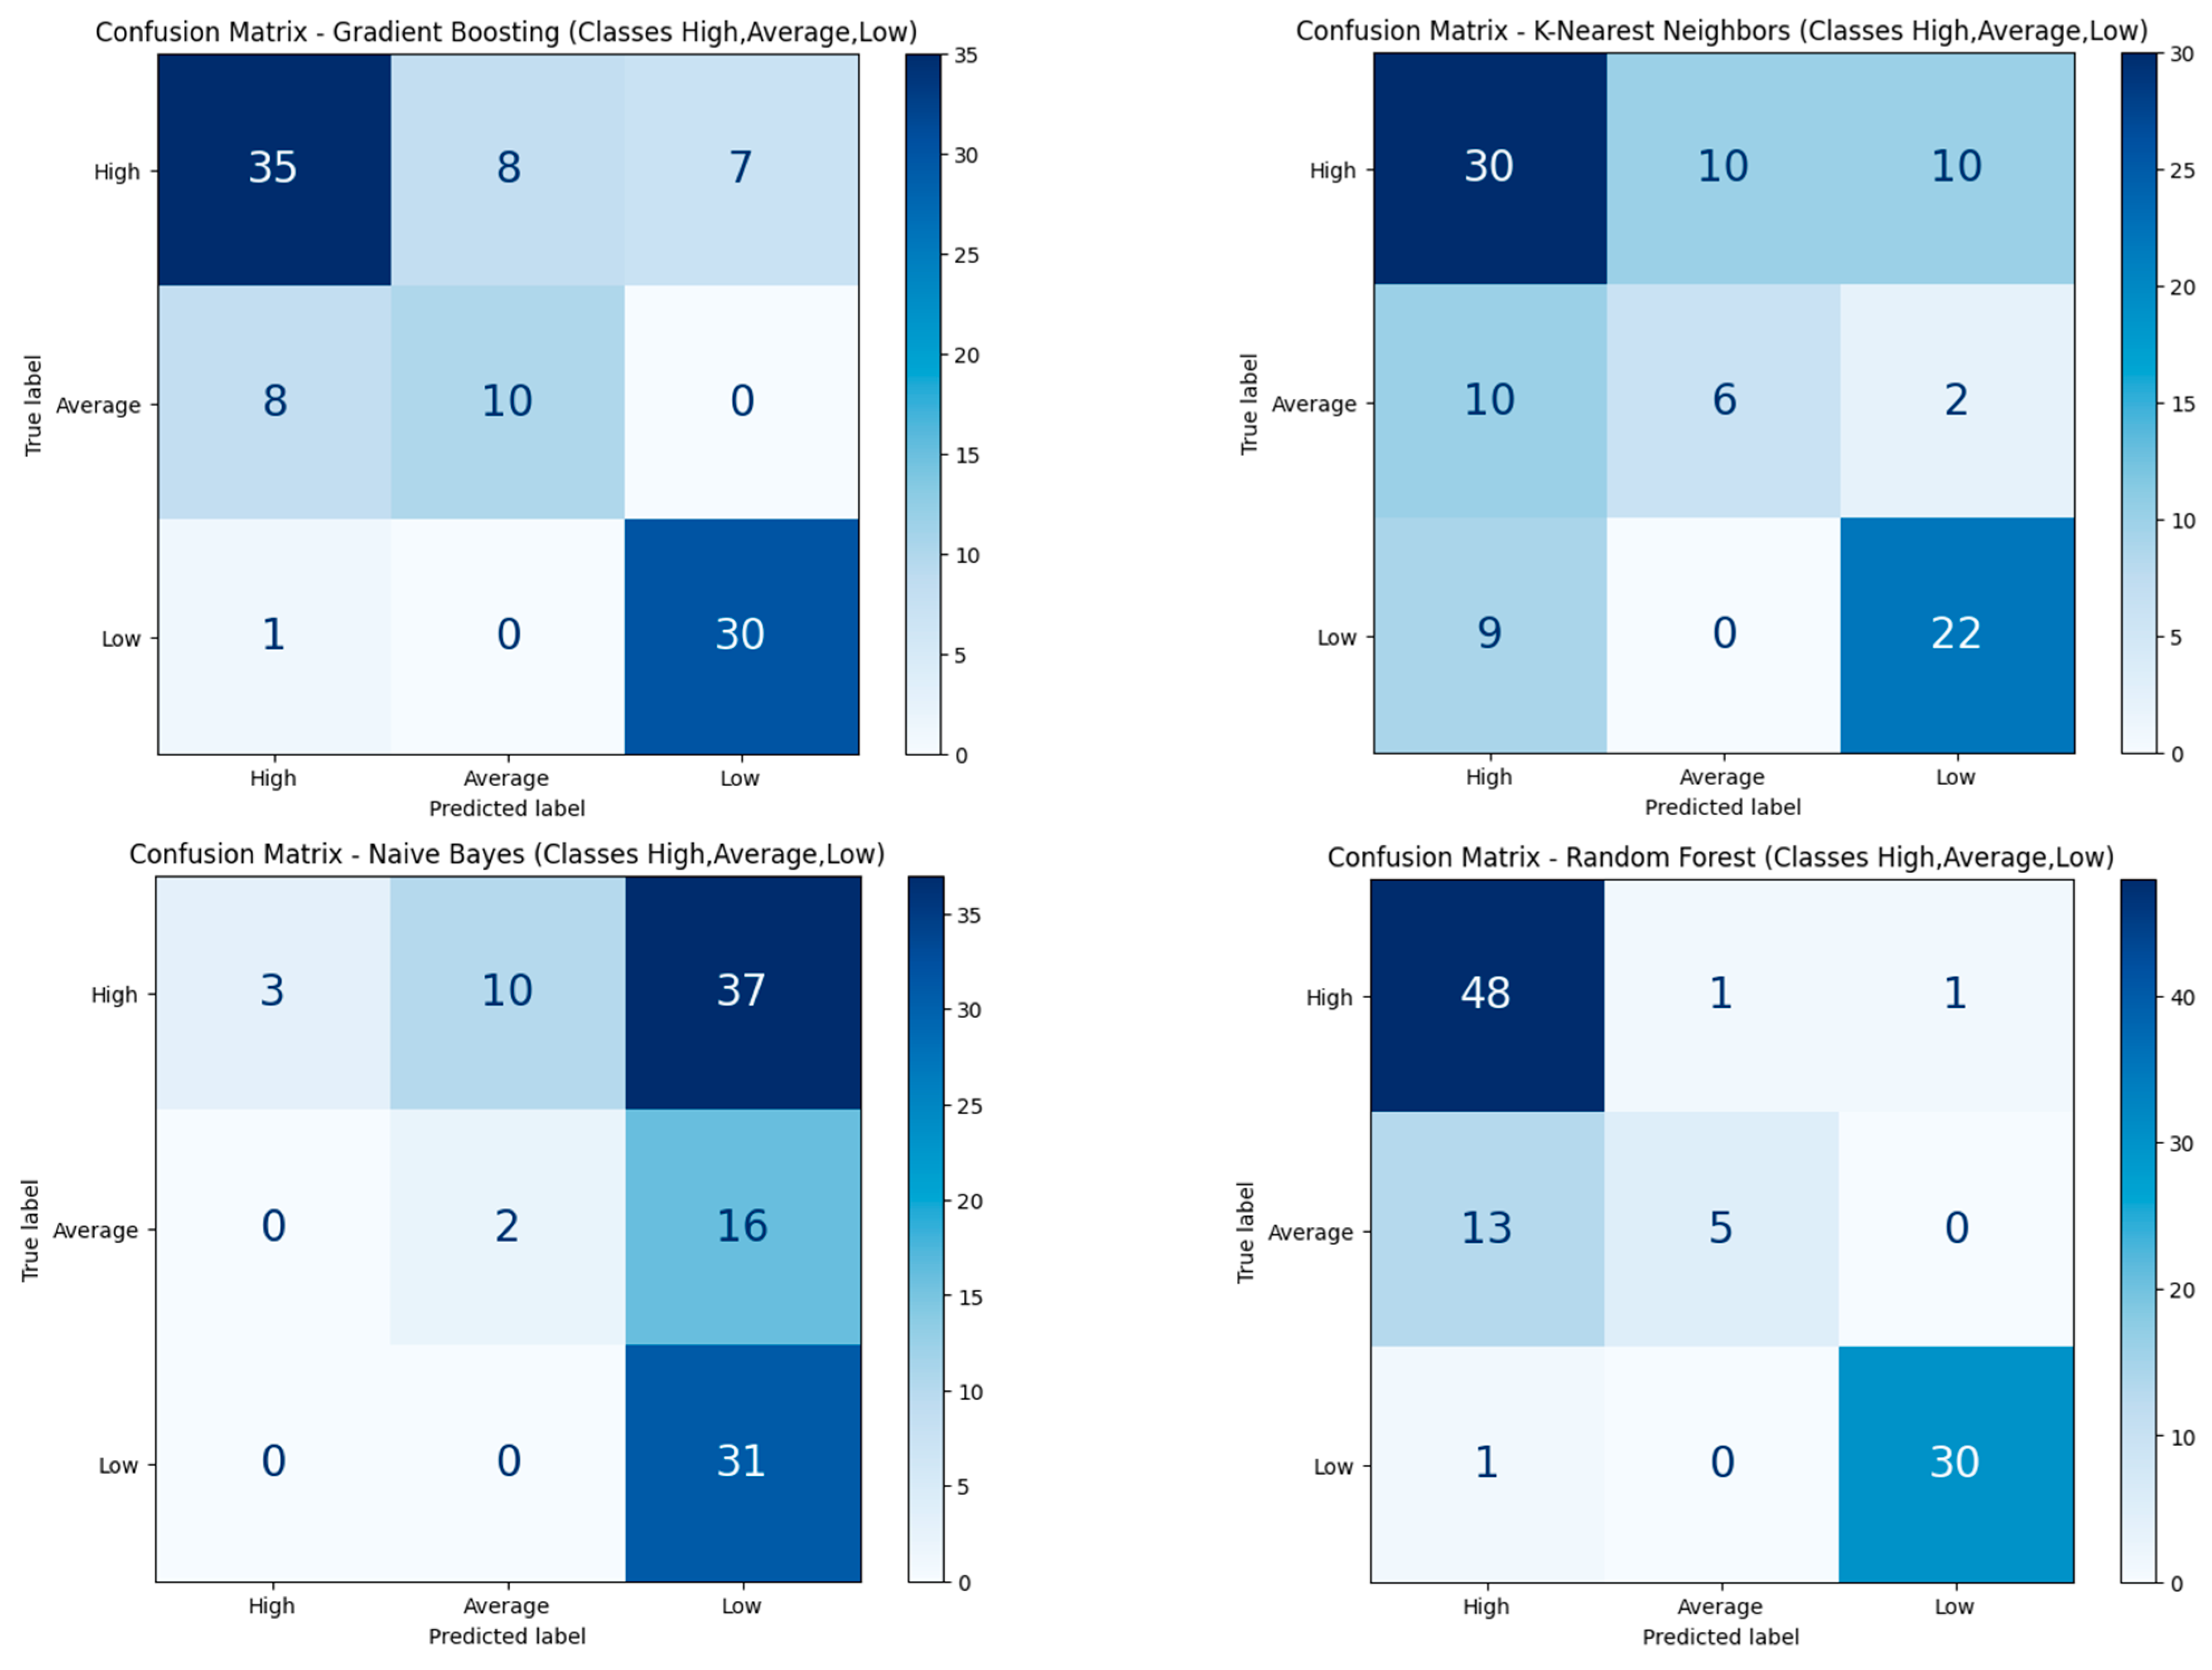
Letter Grade Classification with Three Distinct Classes
4.2.2. Letter Grades Classification with Inclusion of Personality Factors
Letter Grade Classification with Eight Distinct Classes
Letter Grade Classification with Three Distinct Classes
4.3. Comparison of Prediction Models Effect on Students’ Academic Performance with and Without Personality Factors
4.3.1. Regression-Based Performance Analysis with and Without Personality Factors
4.3.2. Classification-Based Performance Analysis with and Without Personality Factors
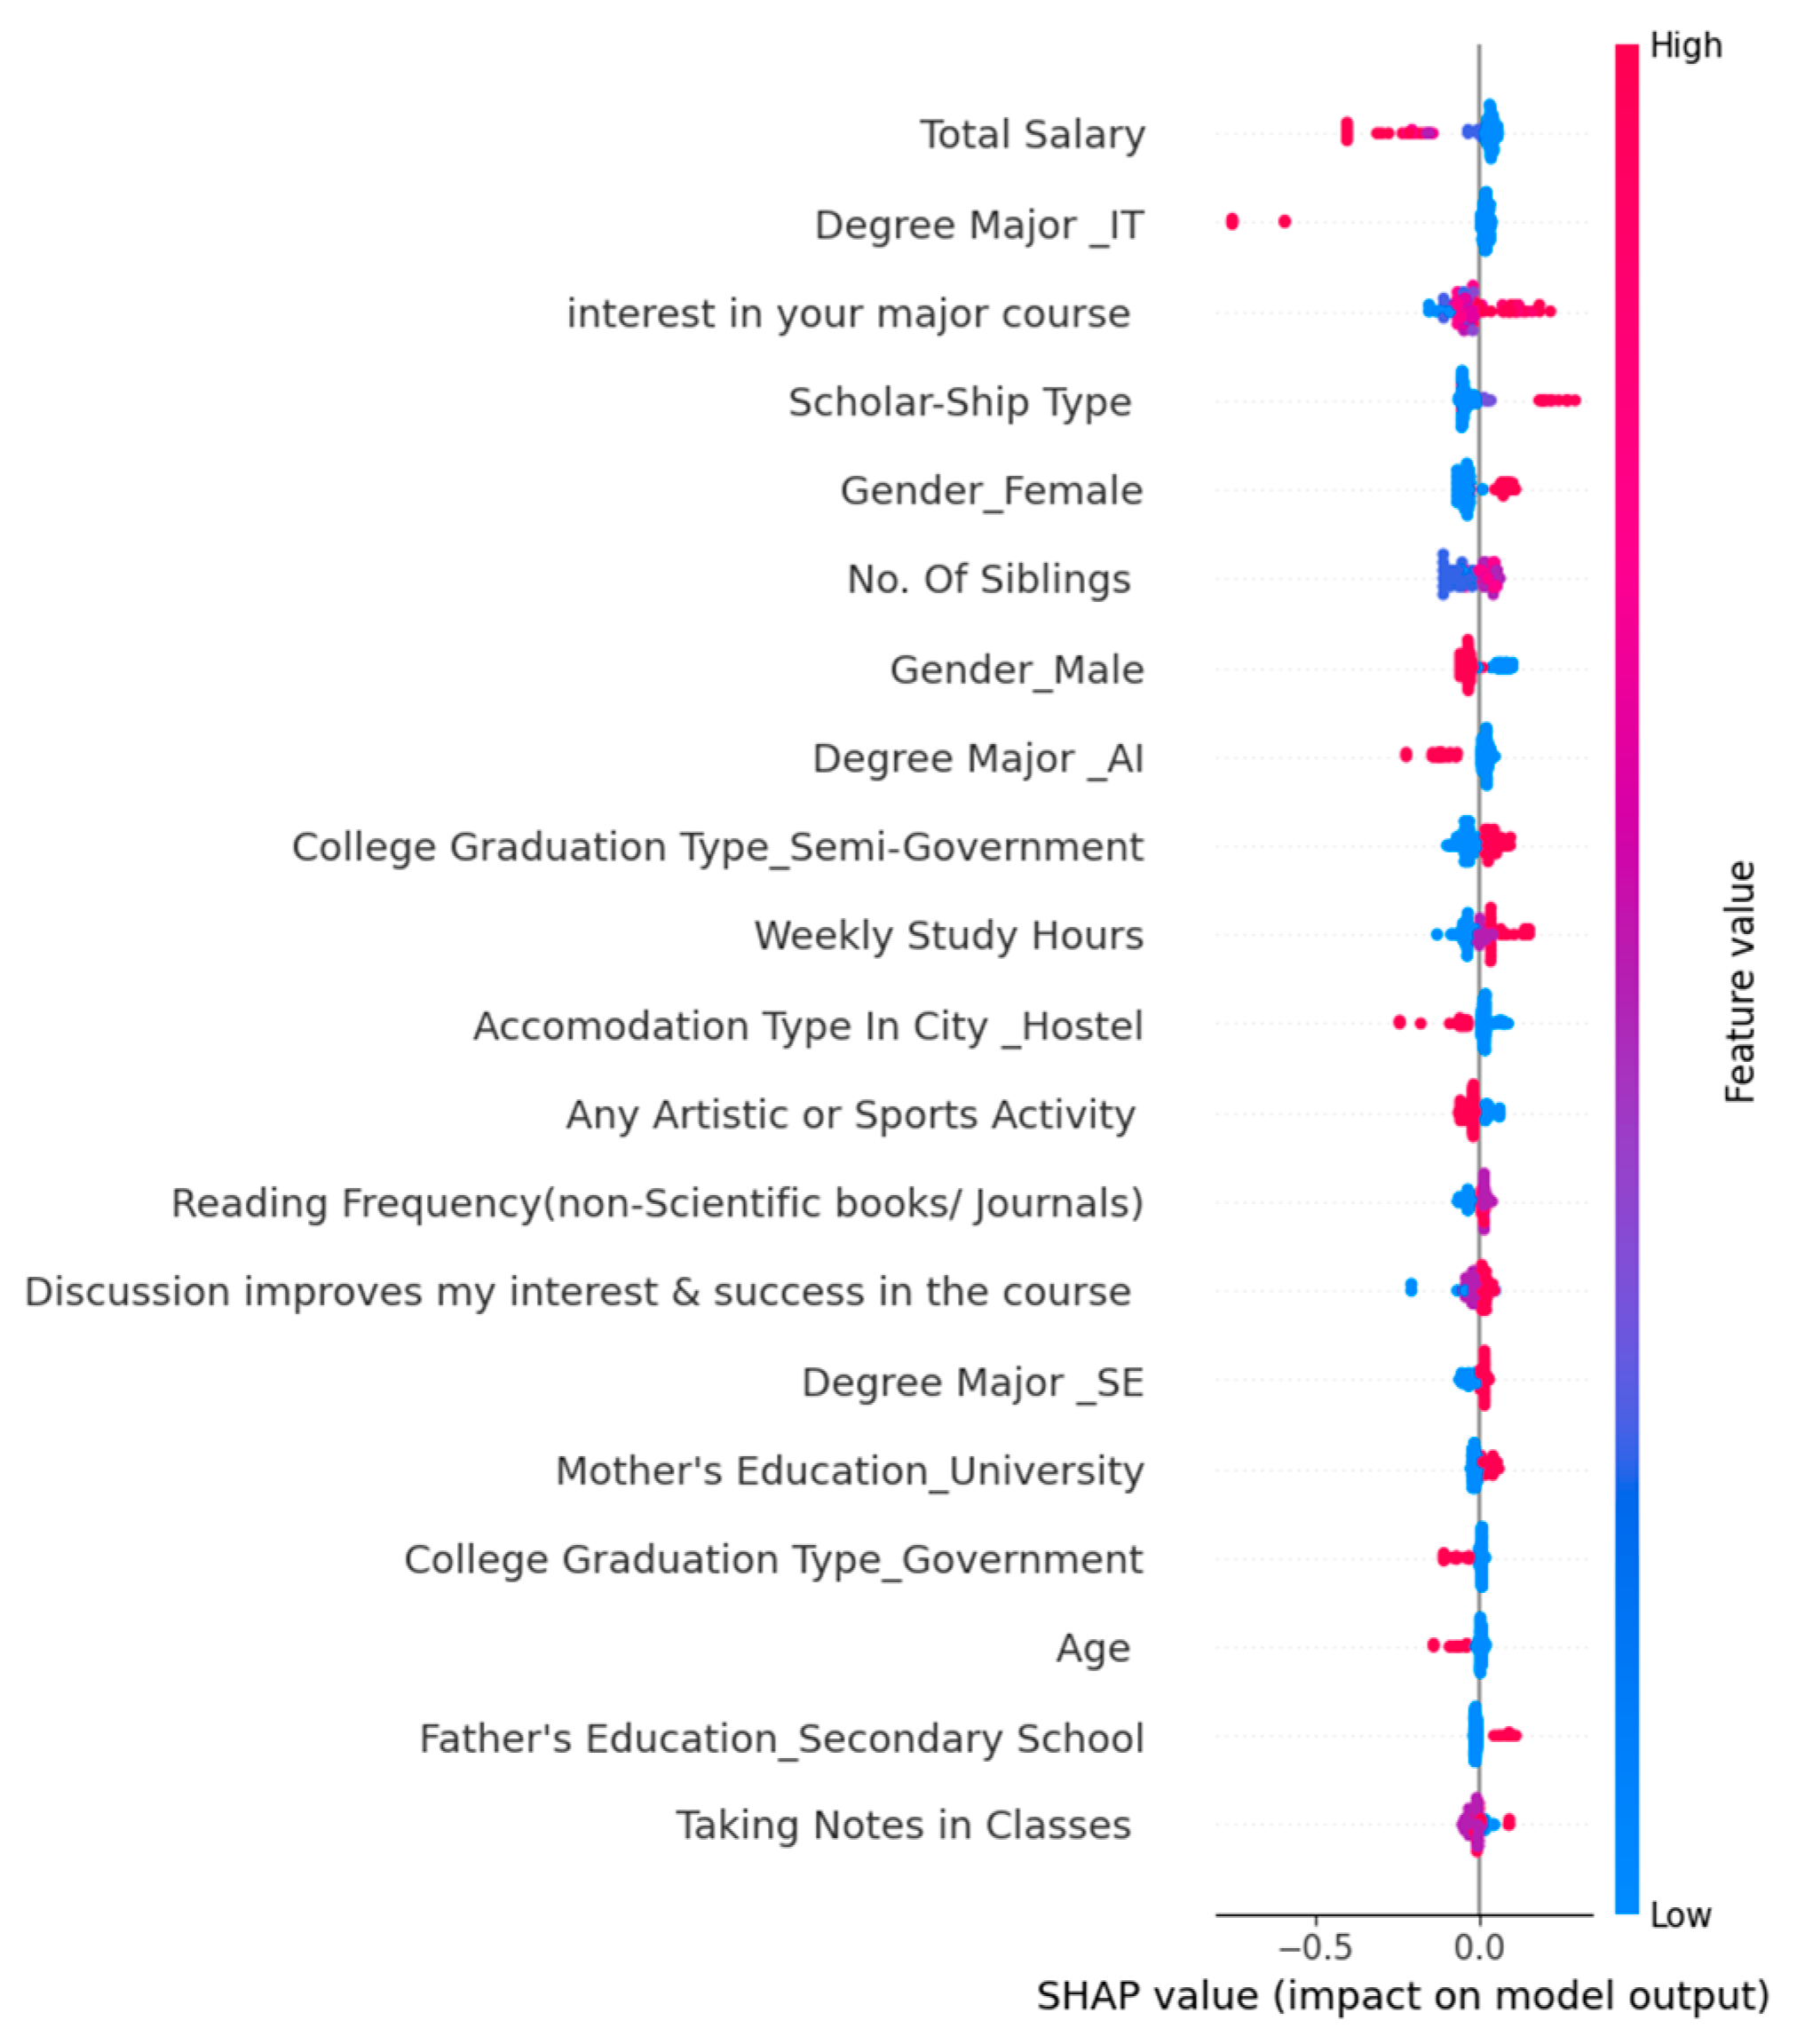
4.4. Interpreting Model Causality Through Explainable AI (XAI) in Student Performance Prediction
4.4.1. Regression-Based Causality Through Explainable AI (SHAPs) with and Without Personality Factors
4.4.2. Classification-Based Performance Analysis with and Without Personality Factors
Eight Distinct Classes Causality Using SHAP
Three Distinct Classes Causality Using SHAPs
4.5. Discussion and Comparative Analysis
5. Conclusions
Author Contributions
Funding
Institutional Review Board Statement
Informed Consent Statement
Data Availability Statement
Acknowledgments
Conflicts of Interest
References
- Albreiki, B.; Zaki, N.; Alashwal, H. A Systematic Literature Review of Student’ Performance Prediction Using Machine Learning Techniques. Educ. Sci. 2021, 11, 552. [Google Scholar] [CrossRef]
- Kumar, M.; Singh, A.J.; Handa, D. Literature Survey on Student’s Performance Prediction in Education using Data Mining Techniques. Int. J. Educ. Manag. Eng. 2017, 7, 40–49. [Google Scholar] [CrossRef]
- Smith, C. A Holistic Approach to Assessment for Students with Severe Learning Difficulties. EdD Thesis, The Open University, Milton Keynes, UK, 2023. [Google Scholar] [CrossRef]
- Hijazi, S.T.; Naqvi, S.M.M.R. Factors affecting students’ performance. Bangladesh E-J. Sociol. 2006, 3, 1–10. [Google Scholar]
- Zhang, Y.; Yun, Y.; An, R.; Cui, J.; Dai, H.; Shang, X. Educational Data Mining Techniques for Student Performance Prediction: Method Review and Comparison Analysis. Front. Psychol. 2021, 12, 698490. [Google Scholar] [CrossRef]
- Misopoulos, F.; Argyropoulou, M.; Tzavara, D. Exploring the Factors Affecting Student Academic Performance in Online Programs: A Literature Review. In On the Line; Springer International Publishing: Cham, Switzerland, 2018; pp. 235–250. [Google Scholar] [CrossRef]
- Shahiri, A.M.; Husain, W.; Rashid, N.A. A Review on Predicting Student’s Performance Using Data Mining Techniques. Procedia Comput. Sci. 2015, 72, 414–422. [Google Scholar] [CrossRef]
- Ren, Y.; Yu, X. Long-term student performance prediction using learning ability self-adaptive algorithm. Complex Intell. Syst. 2024, 10, 6379–6408. [Google Scholar] [CrossRef]
- Fazil, M.; Rísquez, A.; Halpin, C. A Novel Deep Learning Model for Student Performance Prediction Using Engagement Data. J. Learn. Anal. 2024, 11, 23–41. [Google Scholar] [CrossRef]
- Anisa, Y.; Erika, W.; Azmi, F. Enhancing Student Performance Prediction Using a Combined SVM-Radial Basis Function Approach. Int. J. Innov. Res. Comput. Sci. Technol. 2024, 12, 1–5. [Google Scholar] [CrossRef]
- Sawalkar, P.M.S.; Bhore, S.; Doiphode, S.; Sonawane, N.; Sunkewar, V. Student Performance Prediction. Int. J. Res. Appl. Sci. Eng. Technol. 2024, 12, 3855–3862. [Google Scholar] [CrossRef]
- Bonar Sirait, J.C.; Togatorop, P.R.; Tambunan, P.M.L.; Yanti Marpaung, Y.F.; Situmeang, S.I.; Simanjuntak, H.T. Predicting Students Performance Using Data Mining Approach (Case Study: IT Del). In Proceedings of the 2023 IEEE International Conference on Data and Software Engineering (ICoDSE), Toba, Indonesia, 7–8 September 2023; IEEE: Piscataway, NJ, USA, 2023; pp. 202–207. [Google Scholar] [CrossRef]
- Manzali, Y.; Akhiat, Y.; Abdoulaye Barry, K.; Akachar, E.; El Far, M. Prediction of Student Performance Using Random Forest Combined With Naïve Bayes. Comput. J. 2024, 67, 2677–2689. [Google Scholar] [CrossRef]
- Khan, I.; Zabil, M.H.M.; Ahmad, A.R.; Jabeur, N. Selecting Machine Learning Models for Student Performance Prediction Aligned with Pedagogical Objectives. In Proceedings of the 2023 IEEE International Conference on Computing (ICOCO), Langkawi, Malaysia, 9–12 October 2023; IEEE: Piscataway, NJ, USA, 2023; pp. 402–407. [Google Scholar] [CrossRef]
- Abuchar, V.J.; Arteta, C.A.; De La Hoz, J.L.; Vieira, C. Risk-based student performance prediction model for engineering courses. Comput. Appl. Eng. Educ. 2024, 32, e22757. [Google Scholar] [CrossRef]
- Firdaus Mustapha, M.; Izzah Zulkifli, A.N.; Kairan, O.; Sofea Mat Zizi, N.N.; Naim Yahya, N.; Maisarah Mohamad, N. The prediction of student’s academic performance using RapidMiner. Indones. J. Electr. Eng. Comput. Sci. 2023, 32, 363. [Google Scholar] [CrossRef]
- Ahmed, E. Student Performance Prediction Using Machine Learning Algorithms. Appl. Comput. Intell. Soft Comput. 2024, 2024, 4067721. [Google Scholar] [CrossRef]
- Tao, H. Educational data mining for student performance prediction: Feature selection and model evaluation. J. Electr. Syst. 2024, 20, 1063–1074. [Google Scholar] [CrossRef]
- Li, Y. Data Analysis of Student Academic Performance and Prediction of Student Academic Performance Based on Machine Learning Algorithms. Commun. Humanit. Res. 2024, 32, 65–71. [Google Scholar] [CrossRef]
- Khairy, D.; Alharbi, N.; Amasha, M.A.; Areed, M.F.; Alkhalaf, S.; Abougalala, R.A. Prediction of student exam performance using data mining classification algorithms. Educ. Inf. Technol. 2024, 29, 21621–21645. [Google Scholar] [CrossRef]
- Zhang, T.; Yao, H.; Duan, Y.; Zhang, S.; Xie, Y.; An, X. Research on Student Performance Prediction Model Based on Blended Learning Data. In Proceedings of the 2023 4th International Conference on Big Data, Artificial Intelligence and Internet of Things Engineering (ICBAIE), Hangzhou, China, 25–27 August 2023; IEEE: Piscataway, NJ, USA, 2023; pp. 98–101. [Google Scholar] [CrossRef]
- Dagdagui, R.T. Predicting Students’ Academic Performance Using Regression Analysis. Am. J. Educ. Res. 2022, 10, 640–646. [Google Scholar] [CrossRef]
- Ardiyansyah, A.M.M. Covariance Structure Analysis of Academic Performance Indicators in Relation to Family, Peer Influence, and Financial Factors. In StatPearls [Internet]; StatPearls Publishing: Treasure Island, FL, USA, 2023; Volume 15, pp. 1–14. [Google Scholar]
- Ni, L.; Wang, S.; Zhang, Z.; Li, X.; Zheng, X.; Denny, P.; Liu, J. Enhancing Student Performance Prediction on Learnersourced Questions with SGNN-LLM Synergy. arXiv 2024, arXiv:2309.13500. [Google Scholar] [CrossRef]
- Shou, Z.; Xie, M.; Mo, J.; Zhang, H. Predicting Student Performance in Online Learning: A Multidimensional Time-Series Data Analysis Approach. Appl. Sci. 2024, 14, 2522. [Google Scholar] [CrossRef]
- Wang, J.; Tang, G.; Wang, Y. Application in Student Performance Prediction Using Graph Regularization Nonnegative Matrix Factorization. In Proceedings of the 2023 10th International Conference on Dependable Systems and Their Applications (DSA), Tokyo, Japan, 10–11 August 2023; IEEE: Piscataway, NJ, USA, 2023; pp. 816–820. [Google Scholar] [CrossRef]
- Oppong, S.O. Predicting Students’ Performance Using Machine Learning Algorithms: A Review. Asian J. Res. Comput. Sci. 2023, 16, 128–148. [Google Scholar] [CrossRef]
- Alamgir, Z.; Akram, H.; Karim, S.; Wali, A. Enhancing Student Performance Prediction via Educational Data Mining on Academic data. Inform. Educ. 2023, 23, 1–24. [Google Scholar] [CrossRef]
- Resmi, T.J.; Mathews, M.K.; Padmanabhan, S. Statistical Analysis of Student Data and Machine Learning Models for Performance Prediction. In Proceedings of the 2024 4th International Conference on Data Engineering and Communication Systems (ICDECS), Bangalore, India, 22–23 March 2024; IEEE: Piscataway, NJ, USA, 2024; pp. 1–5. [Google Scholar] [CrossRef]
- Mammadov, S. Big Five personality traits and academic performance: A meta-analysis. J. Pers. 2022, 90, 222–255. [Google Scholar] [CrossRef] [PubMed]
- Birba, D.E. A Comparative Study of Data Splitting Algorithms for Machine Learning Model Selection. Ph.D. Thesis, KTH, School of Electrical Engineering and Computer Science (EECS), Stockholm, Sweden, 2020. Available online: https://kth.diva-portal.org/smash/record.jsf?pid=diva2%3A1506870&dswid=2578 (accessed on 12 April 2024).
- Obaid, H.S.; Dheyab, S.A.; Sabry, S.S. The Impact of Data Pre-Processing Techniques and Dimensionality Reduction on the Accuracy of Machine Learning. In Proceedings of the 2019 9th Annual Information Technology, Electromechanical Engineering and Microelectronics Conference (IEMECON), Jaipur, India, 13–15 March 2019; IEEE: Piscataway, NJ, USA, 2019; pp. 279–283. [Google Scholar] [CrossRef]
- Hedeker, D. Multilevel Models for Ordinal and Nominal Variables. In Handbook of Multilevel Analysis; Springer: New York, NY, USA, 2008; pp. 237–274. [Google Scholar] [CrossRef]
- Zhang, Y.; Cheung, Y. Learnable Weighting of Intra-attribute Distances for Categorical Data Clustering with Nominal and Ordinal Attributes. IEEE Trans. Pattern Anal. Mach. Intell. 2021, 44, 3560–3576. [Google Scholar] [CrossRef] [PubMed]
- Zhang, Y.; Cheung, Y.-M. A New Distance Metric Exploiting Heterogeneous Interattribute Relationship for Ordinal-and-Nominal-Attribute Data Clustering. IEEE Trans. Cybern. 2022, 52, 758–771. [Google Scholar] [CrossRef]
- Jia, B.B.; Zhang, M.L. Multi-Dimensional Classification via Sparse Label Encoding. Proc. Mach. Learn. Res. 2021, 139, 4917–4926. [Google Scholar]
- Yu, L.; Zhou, R.; Chen, R.; Lai, K.K. Missing Data Preprocessing in Credit Classification: One-Hot Encoding or Imputation? Emerg. Mark. Financ. Trade 2022, 58, 472–482. [Google Scholar] [CrossRef]
- Singh, D.; Singh, B. Investigating the impact of data normalization on classification performance. Appl. Soft Comput. 2020, 97, 105524. [Google Scholar] [CrossRef]
- Plevris, V.; Solorzano, G.; Bakas, N.; Ben Seghier, M. Investigation of performance metrics in regression analysis and machine learning-based prediction models. In Proceedings of the 8th European Congress on Computational Methods in Applied Sciences and Engineering, Oslo, Norway, 5–9 June 2022; CIMNE: Barcelona, Spain, 2022. [Google Scholar] [CrossRef]
- Chicco, D.; Warrens, M.J.; Jurman, G. The coefficient of determination R-squared is more informative than SMAPE, MAE, MAPE, MSE and RMSE in regression analysis evaluation. PeerJ Comput. Sci. 2021, 7, e623. [Google Scholar] [CrossRef]
- Yağcı, M. Educational data mining: Prediction of students’ academic performance using machine learning algorithms. Smart Learn. Environ. 2022, 9, 11. [Google Scholar] [CrossRef]
- Tomasevic, N.; Gvozdenovic, N.; Vranes, S. An overview and comparison of supervised data mining techniques for student exam performance prediction. Comput. Educ. 2020, 143, 103676. [Google Scholar] [CrossRef]
- Naidu, G.; Zuva, T.; Sibanda, E.M. A Review of Evaluation Metrics in Machine Learning Algorithms. In Artificial Intelligence Application in Networks and Systems; Springer: Cham, Switzerland, 2023; pp. 15–25. [Google Scholar] [CrossRef]
- Hossin, M.; Sulaiman, M.N. A Review on Evaluation Metrics for Data Classification Evaluations. Int. J. Data Min. Knowl. Manag. Process 2015, 5, 1. [Google Scholar] [CrossRef]
- Vujovic, Ž.Ð. Classification Model Evaluation Metrics. Int. J. Adv. Comput. Sci. Appl. 2021, 12, 599–606. [Google Scholar] [CrossRef]


| Category | Attribute Name | Attribute Type | Values |
|---|---|---|---|
| Personal Factors | Age | Categorical (Ordinal) | (18–21), (22–25) |
| Gender | Categorical (Nominal) | Male, Female | |
| Additional work | Categorical (Ordinal) | Yes, No | |
| Sports/Activities | Categorical (Ordinal) | Yes, No | |
| Compensation | Categorical (Ordinal) | None, USD 135–200, USD 201–270, USD 271–340, USD 341–410, above 410 | |
| Means of transportation | Categorical (Nominal) | Bus, Private car/taxi, bicycle, Other | |
| Lodging | Categorical (Nominal) | Rental, Dormitory, With family, Other | |
| Family Factors | Marital Status | Categorical (Nominal) | Yes, No |
| Mother’s education | Categorical (Ordinal) | Primary School, Secondary School, High School, Bachelor, MSc., Ph.D. | |
| Father’s education | Categorical (Ordinal) | Primary School, Secondary School, High School, Bachelor, MSc., Ph.D. | |
| Siblings | Numeric (Discrete) | 0,1,2,3,4,5 or above | |
| Mother’s occupation | Categorical (Nominal) | Retired, Housewife, Government Officer, Private Sector Employee, Self-Employment, Other | |
| Father’s occupation | Categorical (Nominal) | Retired, Housewife, Government Officer, Private Sector Employee, Self-Employment, Other | |
| Parental status | Categorical (Nominal) | Married, Divorced, Died—one of them or both | |
| Academic Factors | College graduation type | Categorical (Nominal) | Private, State, Other |
| Scholarship | Categorical (Ordinal) | None, 25%, 50%, 75%, Full | |
| Weekly study hours | Categorical (Ordinal) | None, <5 h, 6–10 h, 11–20 h, More than 20 h | |
| Reading/non-scientific | Categorical (Nominal) | None, Sometimes, Often | |
| Reading/scientific | Categorical (Nominal) | None, Sometimes, Often | |
| Attendance seminars | Categorical (Ordinal) | 1: Yes, 2: No | |
| Impact of your projects | Categorical (Nominal) | Positive, Negative, Neutral | |
| Attendance | Categorical (Nominal) | Always, Sometimes, Never | |
| Preparation to Mid-term/group | Categorical (Nominal) | Alone, With friends, Not applicable | |
| Preparation to Mid-term/time before | Categorical (Nominal) | Closest Date To The Exam, Regularly During The Semester, Never | |
| Taking notes | Categorical (Nominal) | Never, Sometimes, Always | |
| Listening in class | Categorical (Nominal) | Never, Sometimes, Always | |
| Improvement by discussion | Categorical (Nominal) | Never, Sometimes, Always | |
| Flip classroom | Categorical (Nominal) | Not Useful, Useful, Not applicable | |
| Cumulative GPA | Numeric (Continuous) | 1:<2.00, 2: 2.00–2.49, 3: 2.50–2.99, 4: 3.00–3.49, 5: above 3.49 | |
| Expected GPA | Numeric (Continuous) | 1:<2.00, 2: 2.00–2.49, 3: 2.50–2.99, 4: 3.00–3.49, 5: above 3.49 | |
| Rate your Interest in Major Degree | Categorical (Ordinal) | Scale 1–10 1 refers low, 10 refers to high | |
| Output grade | Categorical (Ordinal) | A, A−, B+, B, B−, C+, C, C− | |
| Degree Major | Categorical (Nominal) | Electrical Engineering, Business Administration, Accounting and Islamic Finance, Bachelor of Medicine and Bachelor of Surgery, Psychology, Software Engineering, Computer Science, Cyber Security, Data Science, Computer Game Development, Information Technology, Bachelor of Science in Pharmacy, Artificial Intelligence | |
| Personality Factors | Openness to Experience (O) (Creativity) | Numeric (Continuous) | 0–1 (Continuous values) |
| Conscientiousness (C) (Organization) | Numeric (Continuous) | 0–1 (Continuous values) | |
| Extraversion (E) (Sociability) | Numeric (Continuous) | 0–1 (Continuous values) | |
| Agreeableness (A) (Compassion) | Numeric (Continuous) | 0–1 (Continuous values) | |
| Neuroticism (N) (Emotional stability) | Numeric (Continuous) | 0–1 (Continuous values) |
| Models | Mean Squared Error (MSE) | R-Squared (R2) |
|---|---|---|
| Gradient Boosting Regressor | 0.1162 | 0.6905 |
| K-Nearest Neighbors Regressor | 0.1465 | 0.6096 |
| Linear Regression | 0.2111 | 0.4376 |
| Support Vector Regression | 0.3037 | 0.1907 |
| Models | Mean Squared Error (MSE) | R-Squared (R2) |
|---|---|---|
| Gradient Boosting Regressor | 0.0618 | 0.8352 |
| K-Nearest Neighbors Regressor | 0.1434 | 0.6179 |
| Linear Regression | 0.1907 | 0.4919 |
| Support Vector Regression | 0.3035 | 0.1914 |
| Models | Accuracy | Precision | Recall | F1-Score |
|---|---|---|---|---|
| Gradient Boosting | 0.686869 | 0.703067 | 0.686869 | 0.678227 |
| Random Forest | 0.626263 | 0.679717 | 0.626263 | 0.638761 |
| Naive Bayes | 0.373737 | 0.496006 | 0.373737 | 0.316316 |
| KNN | 0.424242 | 0.413786 | 0.424242 | 0.40681 |
| Models | Accuracy | Precision | Recall | F1-Score |
|---|---|---|---|---|
| Gradient Boosting | 0.737374 | 0.730782 | 0.737374 | 0.731799 |
| Random Forest | 0.808081 | 0.799743 | 0.808081 | 0.783302 |
| Naive Bayes | 0.363636 | 0.650914 | 0.363636 | 0.250237 |
| KNN | 0.585859 | 0.580011 | 0.585859 | 0.582228 |
| Models | Accuracy | Precision | Recall | F1-Score |
|---|---|---|---|---|
| Gradient Boosting | 0.666667 | 0.690326 | 0.666667 | 0.663416 |
| Random Forest | 0.676768 | 0.689742 | 0.676768 | 0.674057 |
| Naive Bayes | 0.373737 | 0.496006 | 0.373737 | 0.316316 |
| K-Nearest Neighbors | 0.454545 | 0.510702 | 0.454545 | 0.419838 |
| Models | Accuracy | Precision | Recall | F1-Score |
|---|---|---|---|---|
| Gradient Boosting | 0.777778 | 0.767169 | 0.777778 | 0.766878 |
| Random Forest | 0.858586 | 0.884001 | 0.858586 | 0.835859 |
| Naive Bayes | 0.363636 | 0.650914 | 0.363636 | 0.250237 |
| K-Nearest Neighbors | 0.636364 | 0.632117 | 0.636364 | 0.632793 |
| Models | Without Personality Factors | With Personality Factors | ||
|---|---|---|---|---|
| Mean Squared Error (MSE) | R-Squared (R2) | Mean Squared Error (MSE) | R-Squared (R2) | |
| Gradient Boosting Regressor | 0.1162 | 0.6905 | 0.0618 | 0.8352 |
| K-Nearest Neighbors Regressor | 0.1465 | 0.6096 | 0.1434 | 0.6179 |
| Linear Regression | 0.2111 | 0.4376 | 0.1907 | 0.4919 |
| Support Vector Regression | 0.3037 | 0.1907 | 0.3035 | 0.1914 |
| Models | Without Personality Factors | With Personality Factors | |||||||
|---|---|---|---|---|---|---|---|---|---|
| Classes | Accuracy | Precision | Recall | F1-Score | Accuracy | Precision | Recall | F1-Score | |
| GB | Eight | 0.686869 | 0.703067 | 0.686869 | 0.678227 | 0.666667 | 0.690326 | 0.666667 | 0.663416 |
| Three | 0.737374 | 0.730782 | 0.737374 | 0.731799 | 0.777778 | 0.767169 | 0.777778 | 0.766878 | |
| RF | Eight | 0.626263 | 0.679717 | 0.626263 | 0.638761 | 0.676768 | 0.689742 | 0.676768 | 0.674057 |
| Three | 0.808081 | 0.799743 | 0.808081 | 0.783302 | 0.858586 | 0.884001 | 0.858586 | 0.835859 | |
| NB | Eight | 0.373737 | 0.496006 | 0.373737 | 0.316316 | 0.373737 | 0.496006 | 0.373737 | 0.316316 |
| Three | 0.363636 | 0.650914 | 0.363636 | 0.250237 | 0.363636 | 0.650914 | 0.363636 | 0.250237 | |
| KNN | Eight | 0.424242 | 0.413786 | 0.424242 | 0.40681 | 0.454545 | 0.510702 | 0.454545 | 0.419838 |
| Three | 0.585859 | 0.580011 | 0.585859 | 0.582228 | 0.636364 | 0.632117 | 0.636364 | 0.632793 | |
Disclaimer/Publisher’s Note: The statements, opinions and data contained in all publications are solely those of the individual author(s) and contributor(s) and not of MDPI and/or the editor(s). MDPI and/or the editor(s) disclaim responsibility for any injury to people or property resulting from any ideas, methods, instructions or products referred to in the content. |
© 2024 by the authors. Licensee MDPI, Basel, Switzerland. This article is an open access article distributed under the terms and conditions of the Creative Commons Attribution (CC BY) license (https://creativecommons.org/licenses/by/4.0/).
Share and Cite
Aslam, M.A.; Murtaza, F.; Haq, M.E.U.; Yasin, A.; Azam, M.A. A Human-Centered Approach to Academic Performance Prediction Using Personality Factors in Educational AI. Information 2024, 15, 777. https://doi.org/10.3390/info15120777
Aslam MA, Murtaza F, Haq MEU, Yasin A, Azam MA. A Human-Centered Approach to Academic Performance Prediction Using Personality Factors in Educational AI. Information. 2024; 15(12):777. https://doi.org/10.3390/info15120777
Chicago/Turabian StyleAslam, Muhammad Adnan, Fiza Murtaza, Muhammad Ehatisham Ul Haq, Amanullah Yasin, and Muhammad Awais Azam. 2024. "A Human-Centered Approach to Academic Performance Prediction Using Personality Factors in Educational AI" Information 15, no. 12: 777. https://doi.org/10.3390/info15120777
APA StyleAslam, M. A., Murtaza, F., Haq, M. E. U., Yasin, A., & Azam, M. A. (2024). A Human-Centered Approach to Academic Performance Prediction Using Personality Factors in Educational AI. Information, 15(12), 777. https://doi.org/10.3390/info15120777