Article

A Study of Futures Price Forecasting with a Focus on the Role of Different Economic Markets

1
College of Mathematics and Computer Science, Zhejiang A & F University, Hangzhou 311300, China
2
Institute of Informatics, University of Göttingen, 37073 Göttingen, Germany
*
Authors to whom correspondence should be addressed.
These authors contributed equally to this work.
Information 2024, 15(12), 817; https://doi.org/10.3390/info15120817
Submission received: 4 November 2024 / Revised: 13 December 2024 / Accepted: 16 December 2024 / Published: 19 December 2024

Abstract

:
Current research on futures price prediction focuses on the autocorrelation of historical prices, yet the resulting predictions often suffer from issues of inaccuracy and lag. This paper uses Chinese corn futures as the subject of study. First, we identify key influencing factors, such as Chinese soybean futures, U.S. soybean futures, and the U.S.-China exchange rate, that exhibit ‘predictive causality’ with corn futures prices through the Granger causality test. We then apply the sample convolution and interaction network (SCINet) to perform both single-step and multi-step predictions of futures prices. The experimental results show that incorporating key influencing factors significantly improves prediction accuracy. For instance, in the single-step prediction, combining historical prices with Chinese soybean futures prices reduces the MAE and RMSE values by 5.12% and 3.45%, respectively, compared to using historical prices alone. Furthermore, the SCINet model outperforms traditional models such as temporal convolutional networks (TCN), gated recurrent units (GRU), and long short-term memory (LSTM) networks when based solely on historical prices. This study validates the effectiveness of key influencing factors in forecasting Chinese corn futures prices and demonstrates the advantages of the SCINet model in futures price prediction. The findings provide valuable insights for optimising the agricultural futures market and enhancing the ability to predict price risks.

1. Introduction

Corn plays an increasingly prominent and diverse role in global agriculture and food systems. In terms of production, corn exceeds most cereals and will continue to be one of the most widely grown and traded agricultural products in the future [1]. Corn is an essential raw material in many industries, including the biofuel industry, chemical industry and textile industry, and plays an important role in the market. Corn has been introduced to China for more than 400 years. As of 2022, the area under corn cultivation in China has reached approximately 43.1 million hectares, and its planting area and output accounted for more than 40% of all grains. China ranks second in the world in terms of total corn production and total corn consumption and is also a major importer of corn. Therefore, corn plays an important role in China’s agricultural production and economic development. Because corn is also a high-yield but underutilized raw material for bioethanol, it will help China achieve its ambitious goal of carbon neutrality [2]. Therefore, it is of great practical significance to accurately predict the fluctuation of corn futures prices.
Predicting the price of financial time series can help investors avoid risks and achieve higher returns. This is a prominent and challenging topic in the financial field [3]. In previous research on futures price prediction, traditional statistical and econometric methods were first used, which combine economics, mathematics, and statistical methods [4]. There are traditional statistical methods such as autoregressive integrated moving average model (ARIMA) [5], which is commonly used to predict prices, as well as vector autoregression model (VAR) and autoregressive conditional heteroscedasticity model (ARCH). However, traditional time series forecasting does not take into account the impact of external factors on the forecast and has the drawback of forecast errors. When significant external changes occur, there are often substantial deviations [6]. With the rapid development of artificial intelligence, neural networks have become more suitable for forecasting future prices and other types of time series [7]. This is because deep learning models can better account for the non-linear and complex interactions between input data than traditional methods and are particularly suitable for solving many practical and theoretical problems in the financial sector [8]. Artificial neural networks (ANN) and backpropagation (BP) neural networks have both been used in price forecasting with favourable results [9,10]. In recent years, the LSTM model, which has gained widespread use in time series prediction, has been used to predict temperature [11], wind speed [12], and traffic flow [13]. Since a single model is often limited in some ways, experiments have found that hybrid models are superior to single models in terms of generalisation ability and accuracy [14]. In the prediction of different futures prices, hybrid models are significantly better than single model predictions [15,16].
In the current context of economic globalisation, changes in ethanol production, oil prices, population, and exchange rates all affect corn prices to varying degrees [17]. In addition, feed, grain demand, and livestock supply are influenced by changes in corn prices [18]. According to research, the correlation coefficient between corn and crude oil prices in the United States from 1980 to 2004 was 0.35, while the correlation coefficient between corn and crude oil from 2005 to 2013 reached 0.87 [19]. Some studies have shown that the correlation between daily corn and ethanol price changes is about 50%, and the two markets are highly correlated [20]. Fluctuations in corn prices are influenced by various factors, including supply and demand and connections to industries such as agriculture, food, energy, and international trade. Therefore, some scholars have also included factors related to futures in the research on futures and spot price forecasting, such as futures markets, exchange rates, and stock markets, which can improve forecasting performance to varying degrees [19,21,22]. However, in the research on price forecasting in the agricultural futures market, most only consider the historical data of the target futures, with only a few studies considering the impact of different markets.
Therefore, based on the above analysis, this study focuses on Chinese corn futures as the research object. Drawing on previous research, it selects three distinct economic markets—futures, stocks, and exchange rates—and incorporates a total of eight groups of influencing factors. Granger causality tests [23] are applied to Chinese corn futures to analyse these influencing factors, aiming to identify the factors that contribute to the price prediction of Chinese corn futures. Among these, the futures markets include Chinese soybean and wheat futures, US corn and soybean futures, and WTI crude oil futures. The stock market factors include Muyuan and COFCO stocks, while the exchange rate data pertains to the exchange rate between China and the United States. Through testing and analysis, it was found that Chinese soybean futures, US corn futures, US soybean futures, COFCO stock, and the China-US exchange rate exhibit predictive causal relationships with the Chinese corn futures market. Subsequently, a more advanced network model, SCINet (Sample Convolution and Interaction Network) [24], was employed to extract features and make predictions. Its performance was compared with that of LSTM, GRU, and TCN, which are currently widely used models for futures price prediction. However, the empirical results of one-step time series prediction alone are insufficient to ensure reliability and controllability for investors and decision-makers [25]. Therefore, this study not only performs single-step predictions of corn futures prices but also conducts multi-step predictions, which provide practitioners with better tools for making early judgments and avoiding risks.
Therefore, it is evident that existing research on futures price prediction primarily focuses on enhancing model accuracy. In the context of agricultural futures price prediction, studies addressing futures associated with the target futures and different economic markets are even rarer. Accordingly, the research presented in this paper offers a more comprehensive analytical perspective and provides greater interpretability. The main contributions of this paper are as follows:
(1)
Through Granger causality tests, it was identified that factors such as Chinese soybean futures and US corn futures have Granger causality relationships with Chinese corn futures prices. Accordingly, this study combines factors such as Chinese soybean prices and US corn prices separately with the historical prices of Chinese corn futures and incorporates them as input variables into the SCINet network model. Through this approach, a novel framework for predicting corn futures prices is proposed. Compared with traditional methods that use only single corn futures prices as inputs, the proposed framework provides a more comprehensive consideration of the multiple factors influencing corn futures price fluctuations, thereby significantly improving prediction accuracy.
(2)
Through Granger causality tests on Chinese corn, soybean, and US corn futures prices, this study analyses the interdependent relationships among these factors. This not only enhances the predictive performance of the model but also advances interdisciplinary research at the intersection of economics, agriculture, and deep learning. The findings successfully apply the theory to the practical prediction of Chinese agricultural futures prices, while also providing valuable insights for other researchers studying markets such as futures and stocks.
(3)
This study employs the SCINet deep learning model, which is relatively uncommon in financial time series research, and differs from most previous studies on futures price prediction in terms of forecasting horizons. Most prior research focuses on predicting the price for the following day, whereas the model presented here is capable of directly providing multi-step forecasts, that is, forecasts for multiple days. Compared to the rolling multi-step prediction method used in previous studies, the model in this paper effectively reduces the adverse impact of error accumulation, leading to improved prediction accuracy. Moreover, in contrast to single-day forecasts, the five-day and ten-day predictions in this study offer greater utility for helping investors make decisions in advance. Empirical results demonstrate that the SCINet model outperforms others in the comparative experiments.
The structure of the remainder of this paper is as follows: Section 2 reviews the relevant literature on futures price prediction; Section 3 introduces the Granger causality test method and the SCINet model framework; Section 4 validates the effectiveness of the proposed method and analyses the experimental results; Section 5 provides a discussion of the findings, examining their significance and practical applications; finally, Section 6 concludes the paper and outlines potential directions for future research.

2. Literature Review

2.1. Futures Price Forecasting Models

With the rapid economic development in the past few decades, people have paid as much attention to futures as to stocks, and many scholars have conducted a lot of research using various econometric models and mechanical learning methods. Sorting through the research literature, the existing research methods can be roughly divided into the following three categories: econometric models, artificial intelligence, and combinatorial optimization models. In the research on econometric methods, Contreras et al. [26] successfully predicted the next day’s electricity price using an ARIMA model, the same researchers predicted the short-term fluctuation of crude oil price based on ARIMA and ECM [27,28], and Yi et al. analysed the macroeconomic uncertainty and combined with the GARCH model to study the price volatility of the crude oil futures market in China in a more comprehensive manner. Yi et al. [29] studied the price volatility of the crude oil futures market more comprehensively by analysing macroeconomic uncertainty and combining it with a GARCH model.
Since time series are often nonlinear and complex, traditional econometric methods are difficult to capture complex data patterns and nonlinear relationships and to handle large-scale data. Therefore, artificial intelligence methods that can accurately reflect nonlinear features have become a new research focus in dealing with complex time series tasks. In the study of futures price fluctuations using machine learning methods, Xu et al. [19] studied daily corn spot prices in nearly 500 markets in 16 states in the U.S. and predicted the price for the coming day with high accuracy by using univariate neural networks. Zou et al. [30] used ARIMA and ANN for predicting wheat prices, and obtained that the prediction accuracy of the artificial neural network model was significantly higher than that of the traditional ARIMA model. F. Sánchez et al. [31] tested that both multilayer perceptron machine (MLP) and ELMAN outperform ARIMA model in terms of prediction ability by predicting copper price. Convolutional neural networks (CNN) are widely used not only in the field of image processing due to their excellent ability to extract features. Hoseinzade et al. [32] verified the ability of deep CNN models to extract time series features and pointed out the limited ability of shallow artificial neural networks in feature extraction and prediction. LSTM models, which are widely used in the field of time series, are likewise more popular in futures price forecasting. For example, Cen et al. [33] in crude oil futures price prediction.
Due to the limitation of CNN convolutional kernel size and thus cannot extract long time-dependent information well, RNN often suffers from the problems of gradient vanishing and explosion, etc. Therefore, Bai et al. [34] proposed the TCN, which utilises causal and dilated convolutions to flexibly expand the receptive field while incorporating residual connections to address gradient issues. This architecture enables efficient parallel processing of long-term dependencies in time series tasks, thereby achieving a longer effective memory and enhanced modelling performance. Li et al. [35], in the carbon price prediction, verified that TCN outperforms models such as LSTM and GRU. Whereas causal convolution in TCNs is not necessary for time series forecasting tasks and may even degrade the forecasting accuracy, the SCINet model, due to its unique downsampling-convolution-interaction architecture to expand the sensory field, performs multiresolution analysis for more accurate forecasting and addresses the necessity of equal length of the TCN inputs and outputs and the causal convolution used in TCNs for time series forecasting, as well as reducing the time cost [24]. Duan et al. [36] used the SCINet model to predict the number of construction accidents in China and the U.S. under the influence of the epidemic and the model performance outperformed ARIMA and LSTM, among others. On the other hand, Song et al. [37] compared SCINet with models such as TCN and LSTM, and validated the accuracy and stability of SCINet in one-step and multi-step forecasting of aircraft engine intake parameters. Ding et al. [38] also verified that SCINet prediction outperforms recurrent neural networks in time series tasks. All of the above scholars’ studies further validate the effectiveness of SCINet model in time series prediction.
However, all of the above-mentioned are single econometric models or deep learning models, which often have different advantages, while integrated methods are usually different combinations of econometric models, optimization algorithms, and deep learning methods, which combine the characteristics of the original single model or method, and solve the deficiencies of the single method to obtain superior performance. Guo et al. combined two econometric models into a GARCH-MIDAs model for forecasting natural gas futures prices, which better captures both high and low-frequency data [39]. In predicting wheat prices as mentioned earlier, the authors also compared the model prediction accuracy of the combination of ARIMA and ANN equal weights to that of a single artificial neural network [30]. Deng et al. [40] used a modified particle swarm optimization algorithm (RegPSO) in combination with extreme gradient boosting (XGBoost) for predicting and modelling the direction of the high-frequency price of apple futures, and the results were better than those of XGBoost and support vector machine (SVM). In addition, Lu et al. [41] used an improved genetic algorithm (GA) to optimize the parameters combined with LSTM in order to obtain better predictions of futures prices for chemical materials. Lin et al. [42] constructed BiLSTM-Attention-CNN, a new crude oil futures price prediction model, by using an attention mechanism in order to enhance the temporal features. The majority of previous studies have focused on the autocorrelation of historical futures prices, as well as the use of various optimization methods, models, and their combinations to achieve better prediction results. In recent years, however, an increasing number of researchers have shifted their focus towards the processing of input data for models, aiming to improve predictive performance.

2.2. Model Input Feature Processing and Selection

Cavalcante et al. [43] mentioned that data preparation is the first step of a good model and selecting which input variables are more representative and useful for effective prediction. The futures market is usually affected by factors such as supply and demand, seasonality, and market sentiment that lead to asymmetric price distribution and large price fluctuations due to unforeseen events and political uncertainty that generate outliers, so there is some research that has combined different data processing methods with various models in order to obtain better forecasting results. Many researchers have used decomposition methods such as VMD and EEMD to obtain the trend of the time series and the information closely related to the market volatility and decompose it into a group of smoother and more regular components to forecast different futures prices by combining machine learning models [4,35,44,45]. Li et al. [46] proposed to combine VMD with Iterative Cumulative Sum of Squares (ICSS) based on the decomposition method to obtain a more complete feature sequence, which is then inputted into a bi-directional GRU network (BIGRU) to forecast the price of gold futures. Meanwhile, some researchers have also studied the relevant influencing factors of the futures market more directly, Hua et al. [47] analysed the impact of natural disasters on the futures prices of agricultural products. Liang et al. [48] constructed the internet effective consumer price index (ICPI) by combining the relevant search data of the target futures, such as google trends (Gt) and baidu index (BDI), and inputted it into the integrated model GWO-CNN-LSTM to predict the prices of futures such as corn and soybean, respectively. Li et al. [49] demonstrated the effectiveness of incorporating weather and policy factors, identified and quantified from news headlines, in enhancing the forecasting performance of soybean futures prices.
In addition to the above decomposition methods and the comprehensive consideration of influencing factors such as news and weather, in recent years, a number of researchers have also shifted their research direction to the correlation between different futures before, and analysed whether the interactions between different futures are helpful for forecasting. Dahl et al. [50] examined the spillover effects between crude oil and ten major agricultural markets and obtained that under the situation of limited planting area in a certain period of time, the increase in the price of crude oil will lead to an increase in the price of soybeans and corn, which will eventually lead to an increase in the price of other agricultural commodities. Ahumada et al. [51] analysed the cross-dependence between soybeans, corn, and wheat and tested it using a price interaction model and got that cross-dependence between multiple commodities helps to improve the forecasting accuracy of the price model for individual commodities. Hanif et al. [52] analysed the dependence structure of industrial metal futures (gold, aluminium, zinc, etc.) and agricultural futures (wheat, corn, soybeans, etc.) and obtained a superior portfolio. Lu et al. [53] on the other hand, conducted a study on crude oil futures and exchange rates of 11 countries and obtained that crude oil futures prices are susceptible to volatility in foreign exchange markets. Kristiansen [21] used futures prices as target spot price forecasting characteristics. In the studies mentioned above, relevant factors such as spot prices, futures prices, and exchange rates are often used as model inputs without prior justification or theoretical foundation. Granger test is a time series analysis method [23], which is used to test whether one time series can contribute to the prediction of another time series. Čermák et al. [54] focus on the causal relationship between spot and futures prices of major agricultural commodities (wheat, corn, sugar, coffee, cocoa, and soybeans), revealing the presence of Granger causality between the spot and futures prices of wheat and cocoa. Xu [55] analysed the cointegration relationship and price discovery between corn futures and spot prices, suggesting that incorporating additional local cash price series into time series models can enhance the role of the futures market in price discovery, thereby improving the forecasting performance of models that use futures prices to predict spot prices. In summary, Xu [56,57] studies not only explored the causal relationships between multiple corn markets, but also introduced a more complex causal structure model, offering new perspectives for futures market forecasting and hedging strategies.
As outlined above, most existing financial time series forecasting studies focus on high-profile commodities such as stocks and crude oil, while research on agricultural futures, particularly corn futures, remains relatively sparse. Furthermore, most of these studies rely on univariate historical data for single-step predictions, which presents limitations. The patterns learned from historical data may not generalize well to future market conditions, and single-step predictions are not effective in anticipating potential risks. Nonetheless, the SCINet model has demonstrated strong performance in various time series forecasting tasks, which is why it is chosen for forecasting Chinese corn futures prices in this study. Firstly, this study employs Granger causality tests to identify several market factors that exhibit causal relationships with Chinese corn futures prices. These factors are then combined with historical corn futures price data, and the SCINet model is applied for both single-step and multi-step forecasts to evaluate the impact of each factor on price prediction. To further assess the model’s performance, the SCINet model is compared with commonly used deep learning models for futures price forecasting, including LSTM, GRU, and TCN. Using only historical corn futures prices as a baseline, the models’ predictive performance is evaluated based on metrics such as Mean Absolute Error (MAE) and Root Mean Squared Error (RMSE), in order to validate the effectiveness of the proposed methodology.

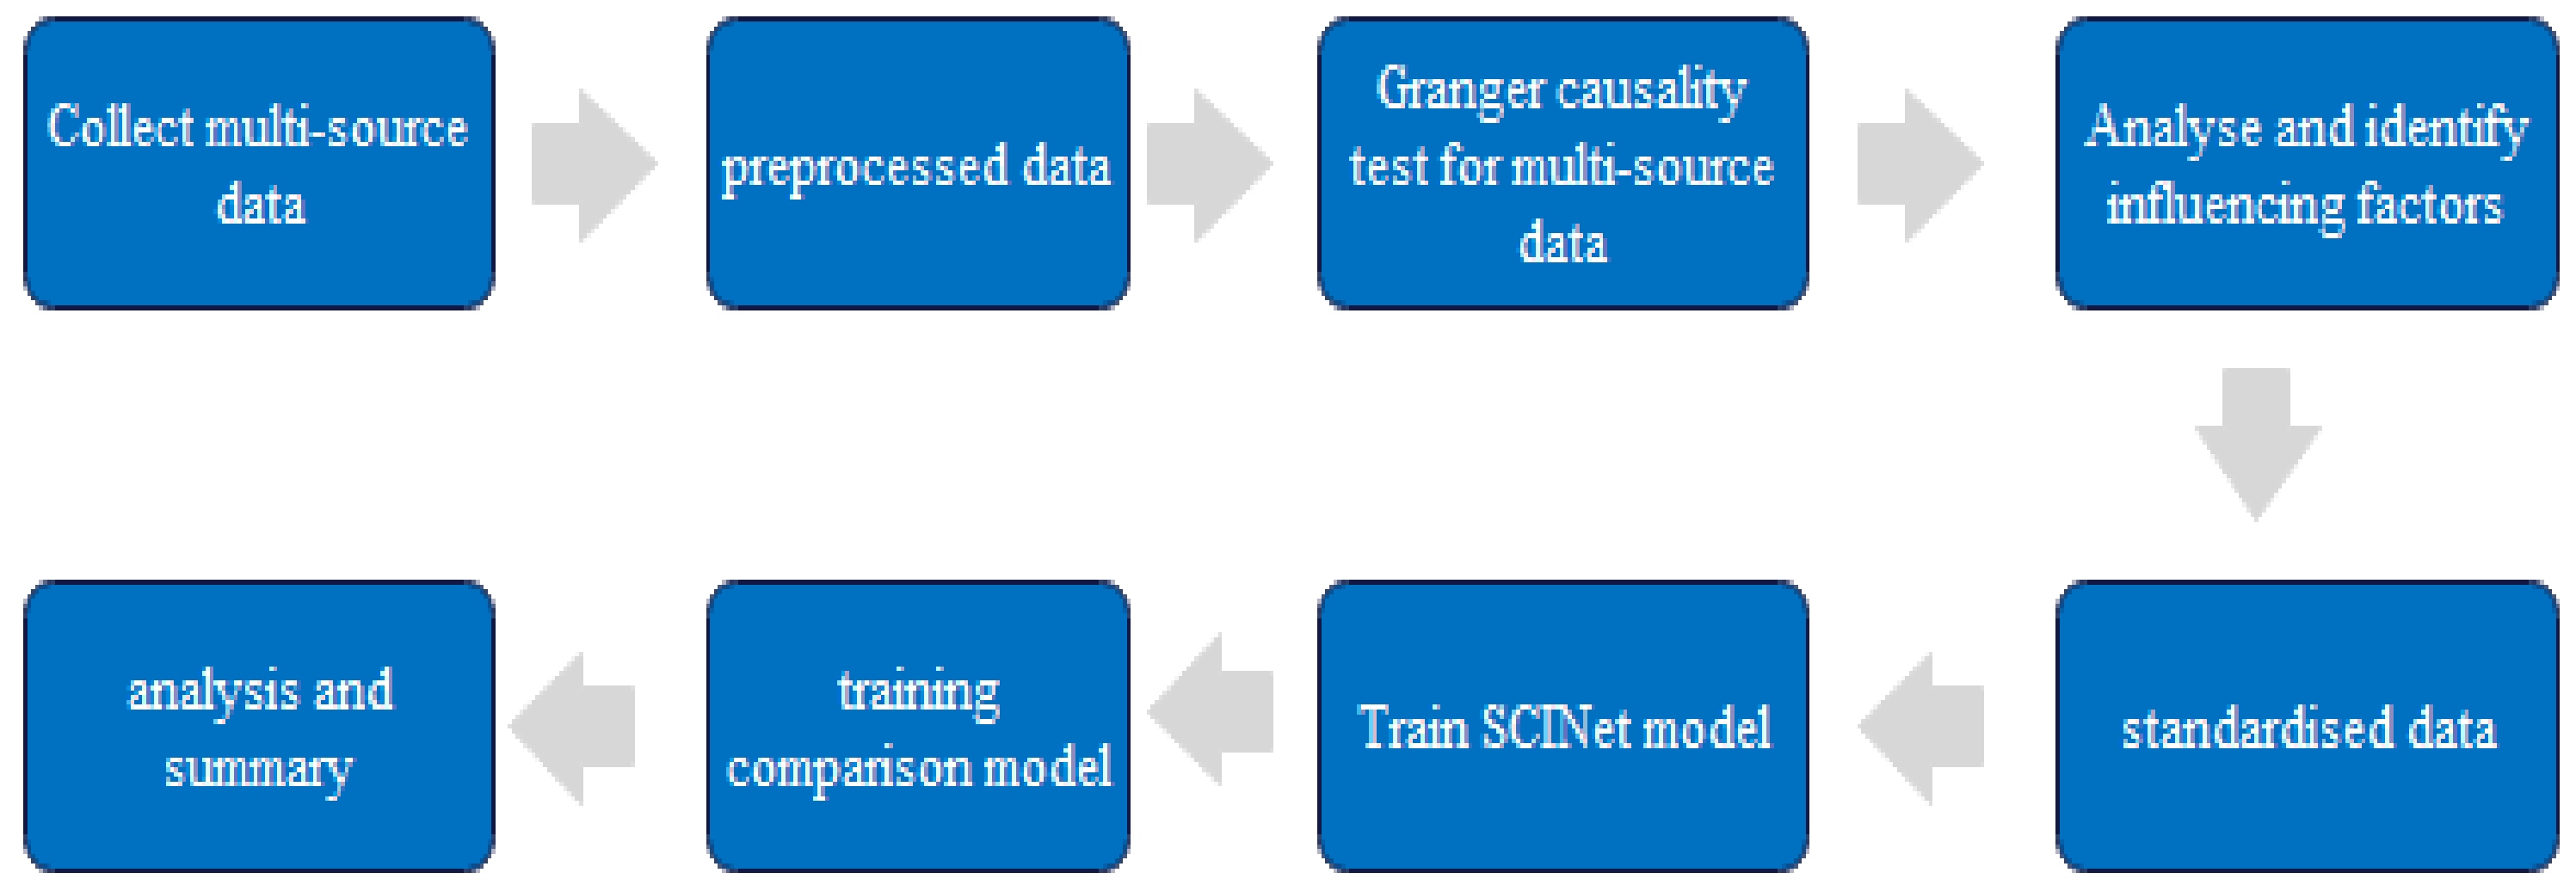
3. Materials and Methods

3.1. Granger Causality Test
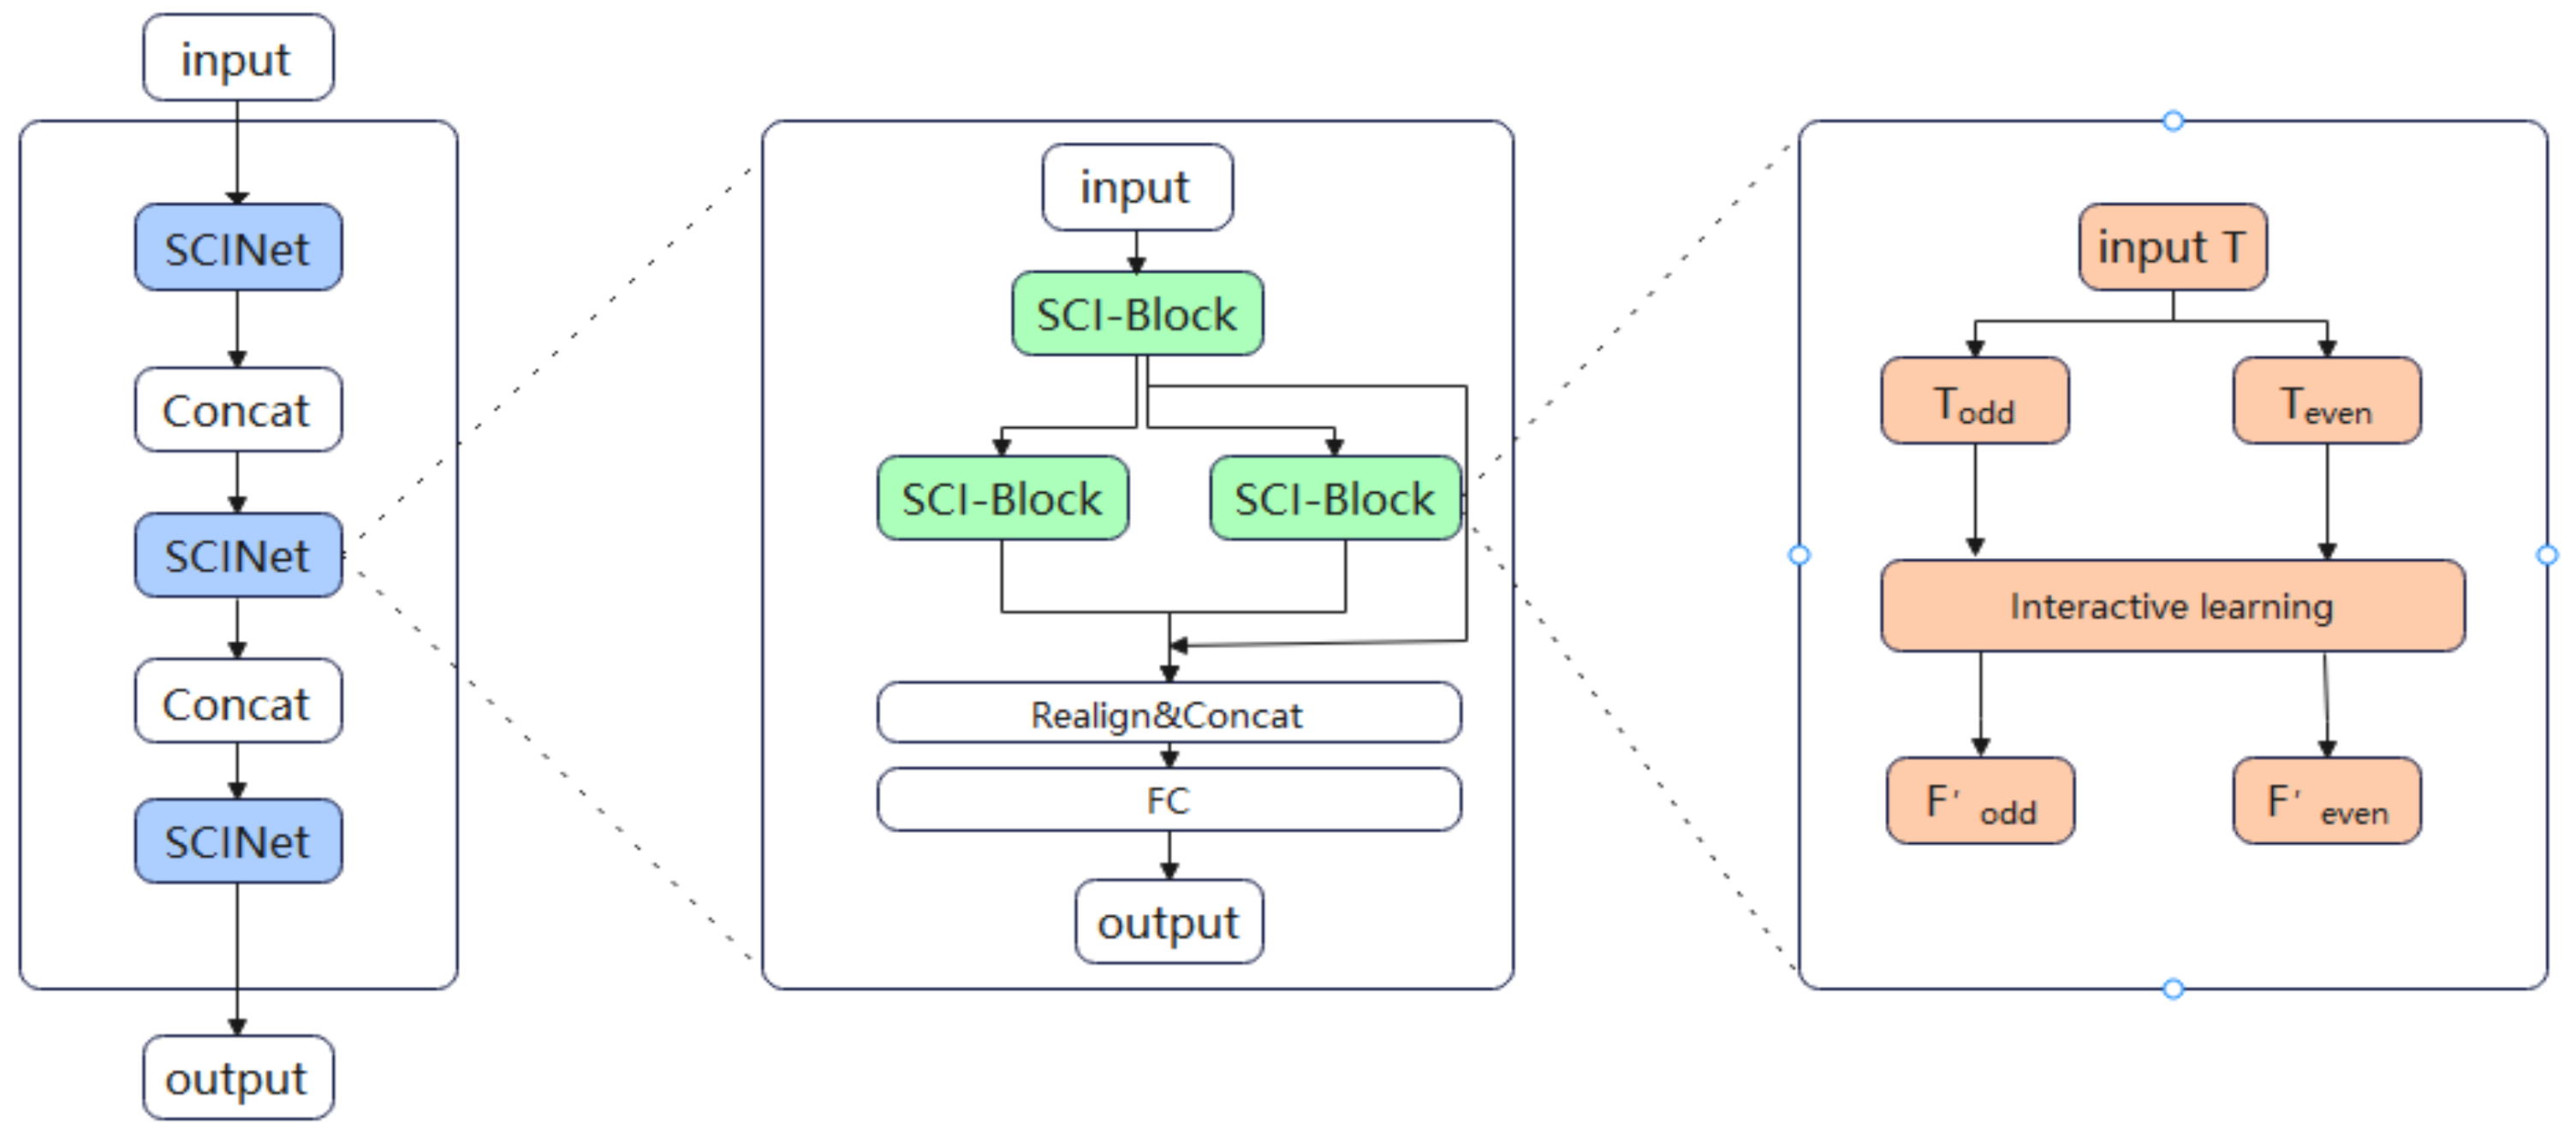
In recent years, many scholars have proposed that although deep learning methods play an indispensable role in various fields, most of their models are still similar to black-box testing, which may cause serious consequences [58]. Hoseinzade et al. [32] proposed a CNN-based framework that automatically selects features from data collected from various sources (including different markets) to predict future market movements, taking into account the correlations between markets. Thus, this approach resembles the previously mentioned concept of black-box testing. In prior research, numerous scholars have employed ARIMA models for financial time series forecasting; however, these models exhibit notable limitations. ARIMA is predominantly utilised for univariate time series analysis, relying on auto-regression, differencing, and moving average components to effectively model temporal patterns. While ARIMA performs well in capturing linear dependencies and trends—rendering it suitable for short-term forecasting in stationary datasets—its reliance on linear assumptions significantly limits its capacity to address the non-stationary and non-linear dynamics that are frequently encountered in financial markets. Extensions like autoregressive integrated moving average with exogenous variables (ARIMAX) incorporate external explanatory variables, enhancing forecasting accuracy by accounting for additional influencing factors. However, ARIMAX remains limited by its linear framework and does not provide insights into causal relationships. In contrast, Granger causality tests focus on identifying causal relationships between variables, providing insights into how one time series can predict another. Unlike ARIMAX, which integrates external variables for prediction, Granger causality emphasises the interaction and directional influence between variables, making it particularly suitable for exploring complex relationships in multivariate datasets. Moreover, while ARIMAX is designed for forecasting with external inputs, Granger causality offers a framework for understanding the direction and strength of causal influences, thereby enhancing interpretability. In this paper, Granger causality testing provides a clearer identification of causal relationships between time series, revealing which variables (such as spot prices, exchange rates, etc.) have predictive power over changes in other variables (such as futures prices). Therefore, Granger causality not only helps identify influencing factors but also analyses the direction of causality between them, making it particularly suitable for causal analysis in macroeconomic forecasting. In this paper, by conducting Granger causality tests on the factors influencing corn futures price fluctuations, the identified factors are used as model inputs. This approach not only improves the forecasting accuracy but also enhances the model’s interpretability, transforming it from a black-box model to one based on actual economic relationships.
The Granger causality test was initially proposed by Granger in 1969 for economic research to explore the direction of causality between two related variables and whether to generate mutual feedback, and proposed the definition of testable causality and feedback [23]. With the development of the Granger causality test, it has been applied to various types of time series data, it is a statistical method used to analyse whether there is a relative causal relationship between variables in time series data. The core of the test is based on the assumption that if the former variables are “Granger causal” to the latter, then the values of the former time series variables can help predict the values of the latter time series variables. The testing process is as follows, the following equation (1) contains only the lag term of Y t self, where a 0 , a 1 , …, a p are regression coefficients and ε 1 t is the error term. Equation (2) contains the lag term of Y t and the lag term of X t , b 0 , b 1 , …, b p are also regression coefficients, c 1 , c 2 , …, c q are the coefficients of the lagged terms of the explanatory variable X t . Then substituting the data, by comparing the variance of the error terms of these two equations, if the error term variance from Equation (2) is significantly smaller than that from Equation (1), X t is considered to Granger-cause Y t .
Y t = a 0 + a 1 Y t 1 + a 2 Y t 2 + + a p Y t p + ε 1 t
Y t = b 0 + b 1 Y t 1 + b 2 Y t 2 + + b p Y t p + c 1 X t 1 + c 2 X t 2 + + c q X t q + ε 2 t
In the previous research on futures prices, some scholars have considered more data into the price prediction of the target futures, but most of them try separately and finally get the influencing factors that help the prediction, and this paper uses Granger causality test to analyse the cause and effect ‘between corn futures and its influencing factors more comprehensively on the basis of theory’ relationship.

3.2. SCINet Model

SCINet (Sample Convolution and Interaction Network) enhances the feature extraction capability of time series data by addressing two key limitations of the TCN model. First, the TCN model uses shared convolutional filters across layers, which limits its ability to extract complex features from time series data. Second, the feature extraction process in TCN often leads to the loss of important temporal relationships. To overcome these issues, SCINet employs a recursive downsampling approach, dividing the time series into two subsequences. This approach allows SCINet to better preserve the important temporal relationships within the series. Furthermore, SCINet uses multiple convolutional filters in each layer to extract more valuable temporal features from the downsampled odd and even subsequences, thereby enhancing its feature extraction capability and overcoming the limitations of TCN in handling complex time series [24].
LSTM and GRU, as classical variants of recurrent neural networks, are capable of capturing long-term dependencies within time series. However, their recursive structures exhibit several limitations when dealing with complex time series. Firstly, the sequential nature of recursive structures restricts parallel computation, resulting in reduced computational efficiency. Furthermore, LSTM and GRU are susceptible to issues such as vanishing or exploding gradients when processing long time series, which can negatively impact model stability and hinder the training process [37]. Additionally, these models have limitations in effectively capturing features across multiple time scales, which constrains their ability to model diverse temporal resolutions. In contrast, SCINet employs a convolution-based decomposition-reconstruction framework, eliminating the need for recursion. By leveraging a recursive downsampling learning mechanism, SCINet facilitates the extraction of features across multiple temporal resolutions. This design not only enhances computational efficiency and mitigates gradient-related issues but also enables the model to better capture complex temporal dependencies, demonstrating significant advantages in modelling intricate time series.
SCINet is a hierarchical time series forecasting framework, with its core building block being the SCI-Block, as shown in Figure 1. Each SCI-Block extracts both homogeneous and heterogeneous information from the raw data by recursively downsampling the sequence into two subsequences. Interaction learning between these subsequences effectively compensates for information loss and enhances feature representation. Multiple SCI-Blocks are arranged in a binary tree structure, forming the SCINet network. Within this structure, time series data is processed at different time resolutions, enabling the extraction of multi-level features. By re-integrating these multi-scale features into the original time series, SCINet can make accurate predictions for the original sequence. To further improve forecasting accuracy, SCINet can be enhanced by appropriately stacking multiple SCINet modules, resulting in a stacked SCINet architecture that strengthens the model’s performance in complex time series prediction tasks.
The smallest unit in SCINet is the SCI-Block, the sample convolutional interaction module decomposes the sequence T into T e v e n and T o d d , representing the even and odd elements, respectively. Subsequently, different convolutional kernels are utilised to extract homogeneous and heterogeneous features from these sub-sequences. To mitigate the information loss caused by downsampling, an interactive learning strategy is employed to determine affine transformation parameters, thereby enabling information exchange between the two sub-sequences. The corresponding formulation is provided in Equation (3). T o d d s represents the tensor obtained after the scaling transformation of T o d d ; denotes the Hadamard product; Both ϕ and φ represent one-dimensional convolution operations. Additionally, two further one-dimensional convolutions are employed to derive the hidden states, where updated features are obtained through addition or subtraction. The corresponding computation is given in Equation (4).
T o d d s = T o d d exp ( ϕ ( T e v e n ) , T e v e n s = T e v e n exp ( φ ( T o d d )
F o d d = T o d d s ± ρ ( T e v e n s ) , F e v e n = T e v e n s ± η ( T o d d s )
In addition, SCINet is constructed by stacking multiple SCI-Blocks in a hierarchical manner, forming a tree-like framework. The first layer (N = 1, 2, 3, …, N, with N ≤ 5) consists of 2n SCI-Blocks. Initially, the input sequence data is processed and then reconnected into a new sequence representation through the Realign & Concat operation. This new sequence representation is subsequently added to the original sequence via residual connections for prediction. Finally, a fully connected layer is employed to decode the sequence and generate the output. This structural arrangement effectively captures both short-term and long-term dependencies within the input time series.
Based on the two methods outlined above, the main framework of this paper is illustrated in Figure 2. The primary steps include the processing of the collected data, the identification of influencing factors using the Granger causality test, followed by the model training, and ultimately, the analysis and conclusions based on the evaluation metrics.

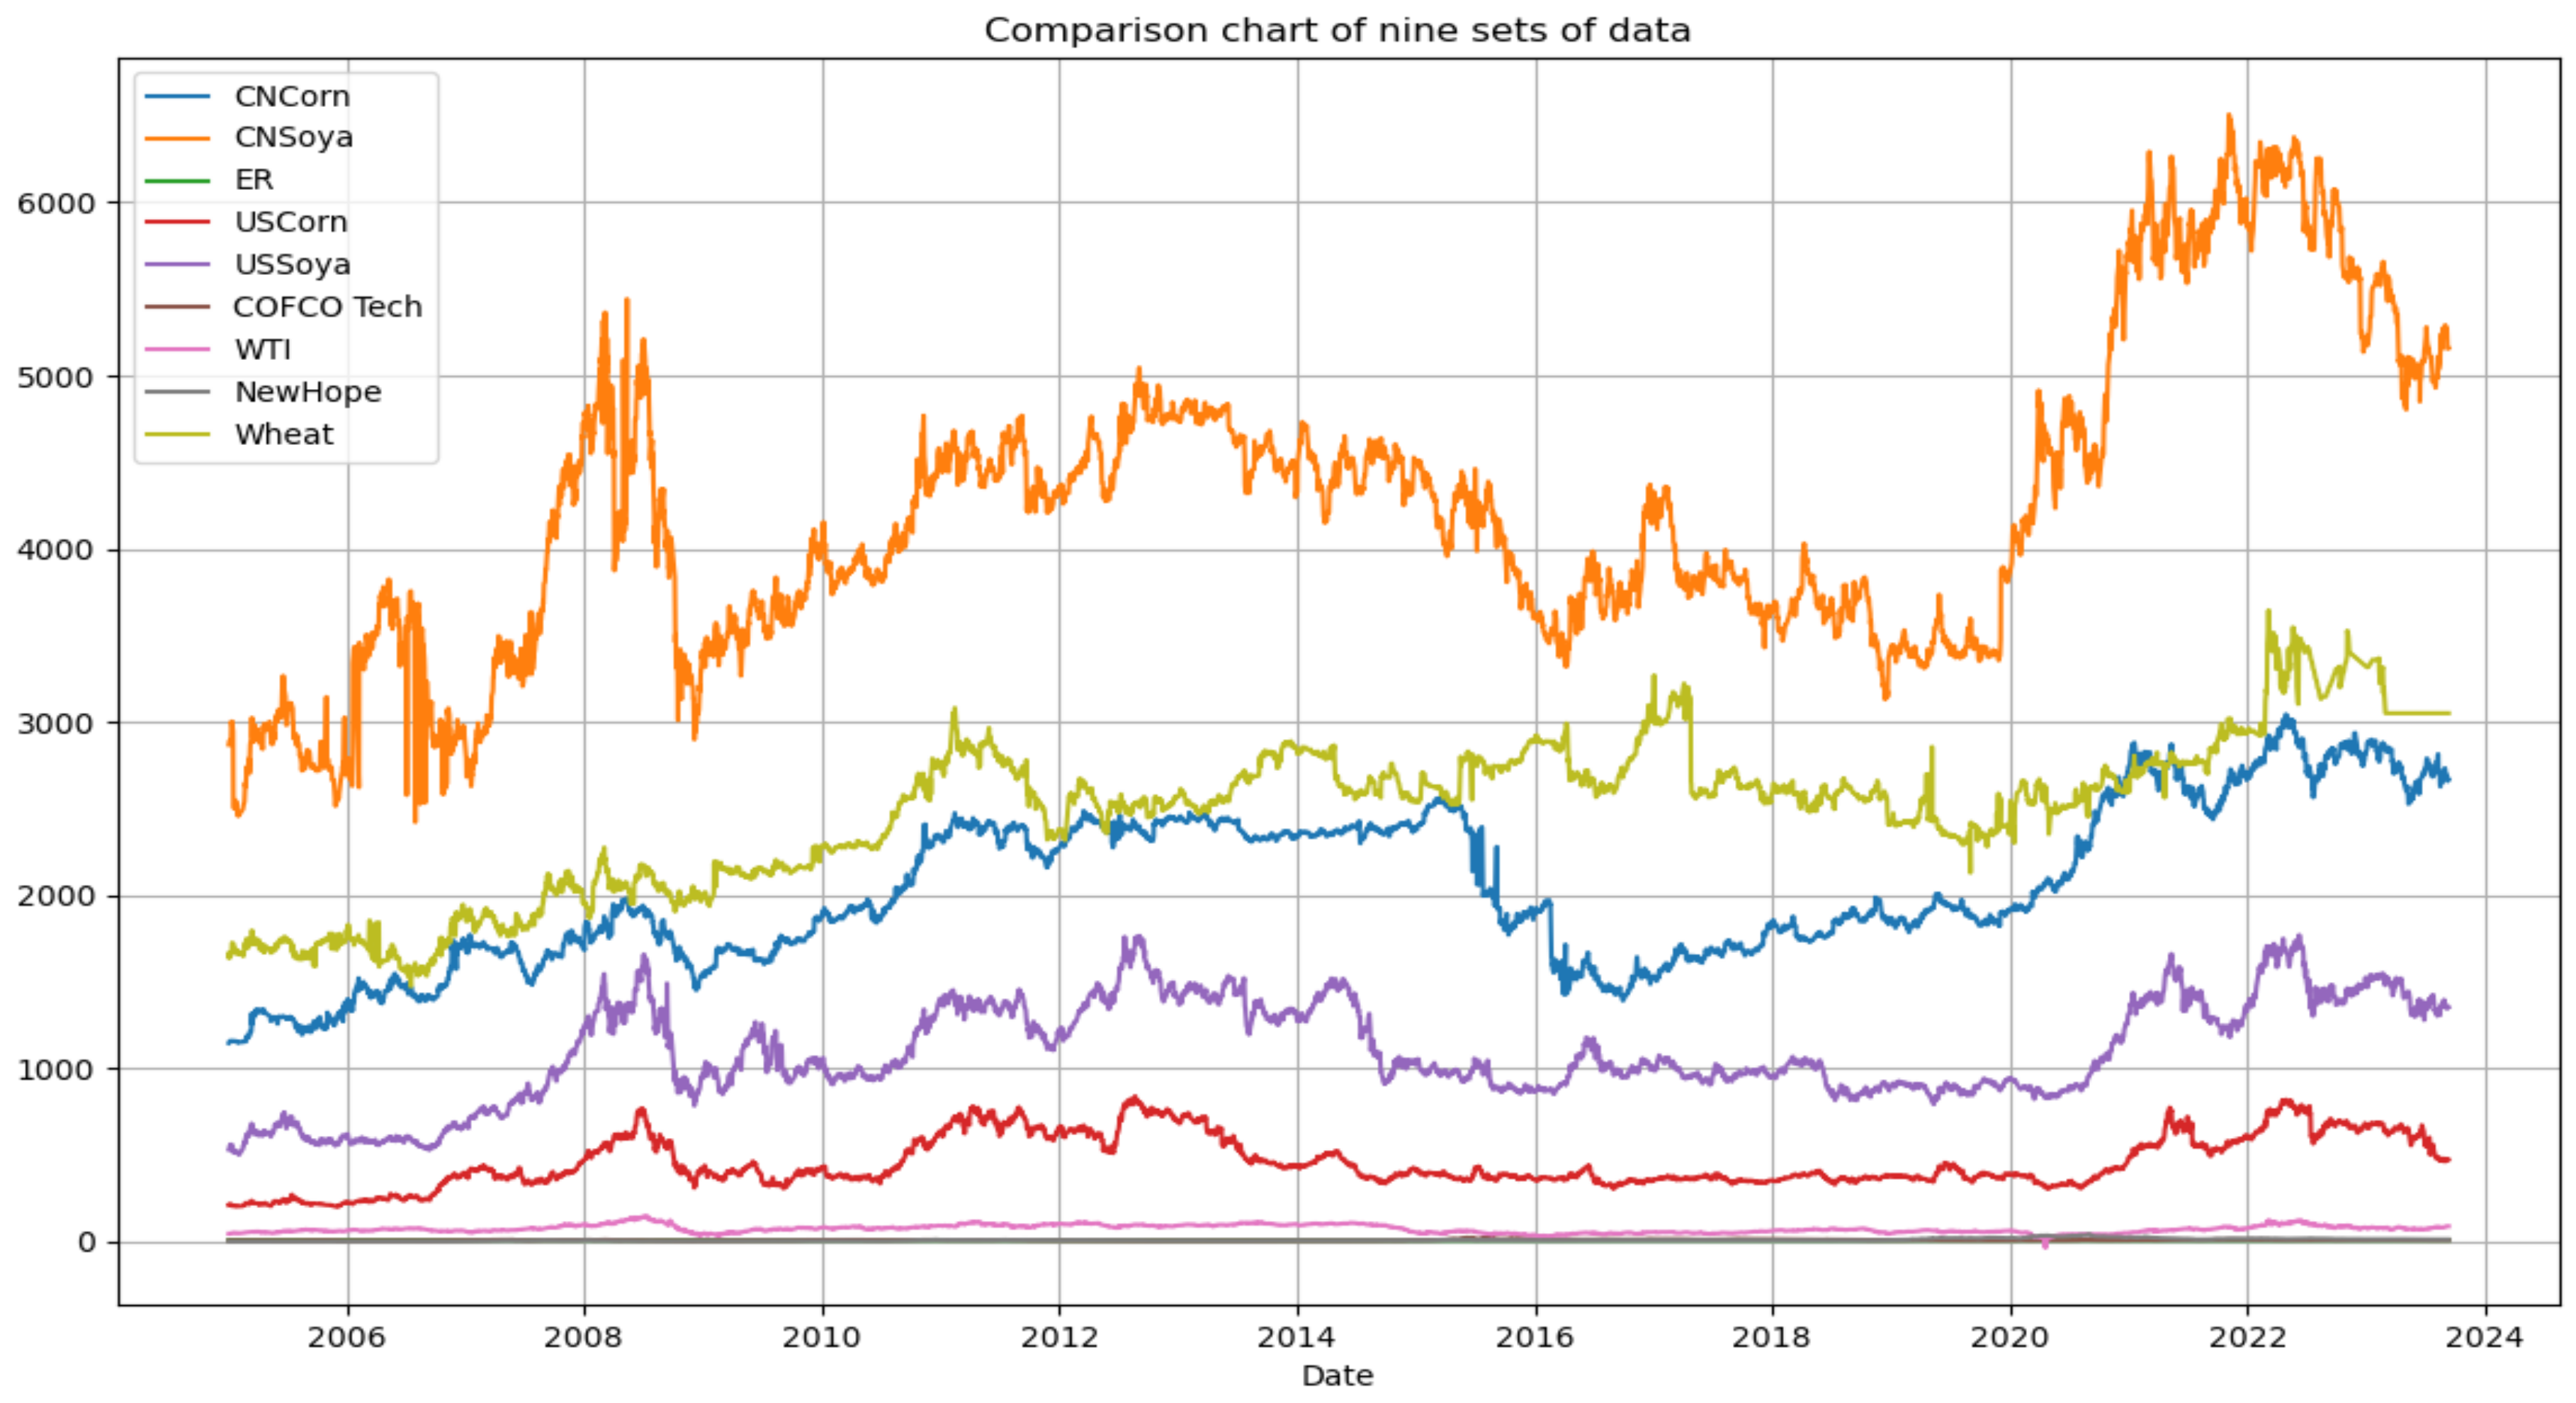
3.3. Data Description

This study selected three types of data: futures, stocks, and exchange rates, resulting in a total of nine groups. The Chinese corn, soybean, and wheat futures prices, as well as the historical price data for COFCO Technology and New Hope stocks, were obtained from the Sina Finance website (Sina Finance, https://finance.sina.com.cn, accessed on 4 November 2024). The historical price data for US corn and soybean futures, WTI crude oil, and the China-US exchange rate were collected from Investing.com (https://cn.investing.com, accessed on 4 November 2024). As shown in Figure 3, with the exception of COFCO Technology, exchange rate, and New Hope stocks—whose values are smaller and whose fluctuations are less pronounced compared to the other six data groups—the rise and fall of the other six groups exhibit notably similar fluctuations. Therefore, further analysis of the correlations among these variables is warranted.
In terms of data processing, due to the extensive time span, some outliers or anomalous data points in the original dataset were removed, such as data corresponding to holidays. Additionally, differences exist between Chinese and American holiday schedules, and errors were found in certain data points. This study uses the time points of the historical data for Chinese corn futures as the reference. For the missing values, the preceding and subsequent data points are averaged to fill in the gaps. The time span of the nine datasets ranges from 4 January 2005 to 11 September 2023, comprising a total of 4551 data points. The datasets are split into training, validation, and test sets in a ratio of 8:1:1, to evaluate the model’s effectiveness.

3.4. Performance Evaluation Criteria

This study uses the root mean square error ( R M S E ), mean absolute error ( M A E ), and mean absolute percentage error ( M A P E ) to comprehensively evaluate the model’s accuracy from a horizontal perspective. Lower R M S E , M A E , and M A P E values indicate better model accuracy, with R M S E being particularly sensitive to large errors, M A E being less affected by outliers, and M A P E providing a relative error measure, making it suitable for comparison across different datasets. The methods for calculating these metrics are as follows.
R M S E = 1 n i = 1 n y i y i ^ 2
M A E = 1 n i = 1 n y i y i ^
M A P E = 1 n i = 1 n y i y i ^ y i × 100 %

4. Empirical Results

4.1. Granger Test Results and Analysis

The Granger causality test was conducted on the 9 sets of data, and the results are presented in Table 1. At the 5% confidence level, the test results indicate that there is a Granger causality relationship between Chinese corn futures and the following factors: Chinese soybean futures, US corn futures, US soybean futures, COFCO Technology stock, and the China-US exchange rate. In contrast, the null hypothesis is accepted for Chinese wheat futures, WTI crude oil futures, and New Hope stock, suggesting that these factors do not exhibit Granger causality with Chinese corn futures.
As shown in Table 1, the Granger causality relationships between various factors influencing Chinese corn futures prices are evident. For factors such as Chinese soya futures, COFCO Technology stock, and US corn futures, the p-values are relatively low (below 0.05), leading us to reject the null hypothesis. This indicates that these factors have a Granger causality relationship with Chinese corn futures prices, suggesting that their historical data can help forecast the future movements of Chinese corn futures prices. Moreover, the table reveals bidirectional Granger causality between Chinese soya futures and Chinese corn futures. This suggests that the Chinese soya futures market plays a dominant role in the price discovery process. Corn and soya are often considered substitutes in agriculture. Thus, when soya prices rise, farmers may shift to planting soya, reducing the supply of corn and driving up its price. As a result, the price of Chinese soya significantly influences the price of Chinese corn. The China-US exchange rate also exerts a significant impact on Chinese corn futures, likely due to fluctuations in the exchange rate, which affect trade costs and linkages between international markets, resulting in price volatility in corn futures. As the world’s largest producer and exporter of corn, US corn futures prices have a significant impact on the global corn market, meaning US corn futures prices also exhibit a notable Granger causality relationship with Chinese corn futures. Additionally, trade policies and tariff changes between China and the US influence international price linkages of corn. Since there are similar substitution effects between US soya and corn, fluctuations in US soya prices also affect Chinese corn futures prices via this substitution effect. In the stock market, COFCO Technology, as a company closely tied to agriculture, sees its stock price influenced by changes in corn prices. Corn price fluctuations directly impact COFCO Technology’s business and profitability, and the volatility of corn futures prices influences market expectations of COFCO Technology’s future performance, which in turn impacts its stock price. Similarly, fluctuations in COFCO Technology’s stock price also affect Chinese corn futures prices. Likewise, New Hope, a representative company in China’s agricultural sector, also influences the domestic corn futures market. However, although there is some correlation between Chinese wheat futures and Chinese corn futures, no significant Granger causality was found between them. This may be due to the limited substitution effect between wheat and corn.
These results reflect the complexity of the Chinese corn futures market, which is affected by many factors, including domestic substitutes and industry linkages, as well as international market linkages and trade policies. Understanding these relationships can help to better predict and analyse the trend of corn futures prices. Finally, in the selection of influencing factors, in terms of stock data, since the F statistics obtained from the above test for New Hope is smaller than that for COFCO, and a larger F statistic generally indicates a stronger causal relationship, COFCO stock was selected. In the futures market, China soybean, US soybean, and corn futures were selected. Moreover, the exchange rate between China and the United States was chosen as the macroeconomic data. The effectiveness of these five influencing factors in predicting China’s corn futures prices will then be tested.

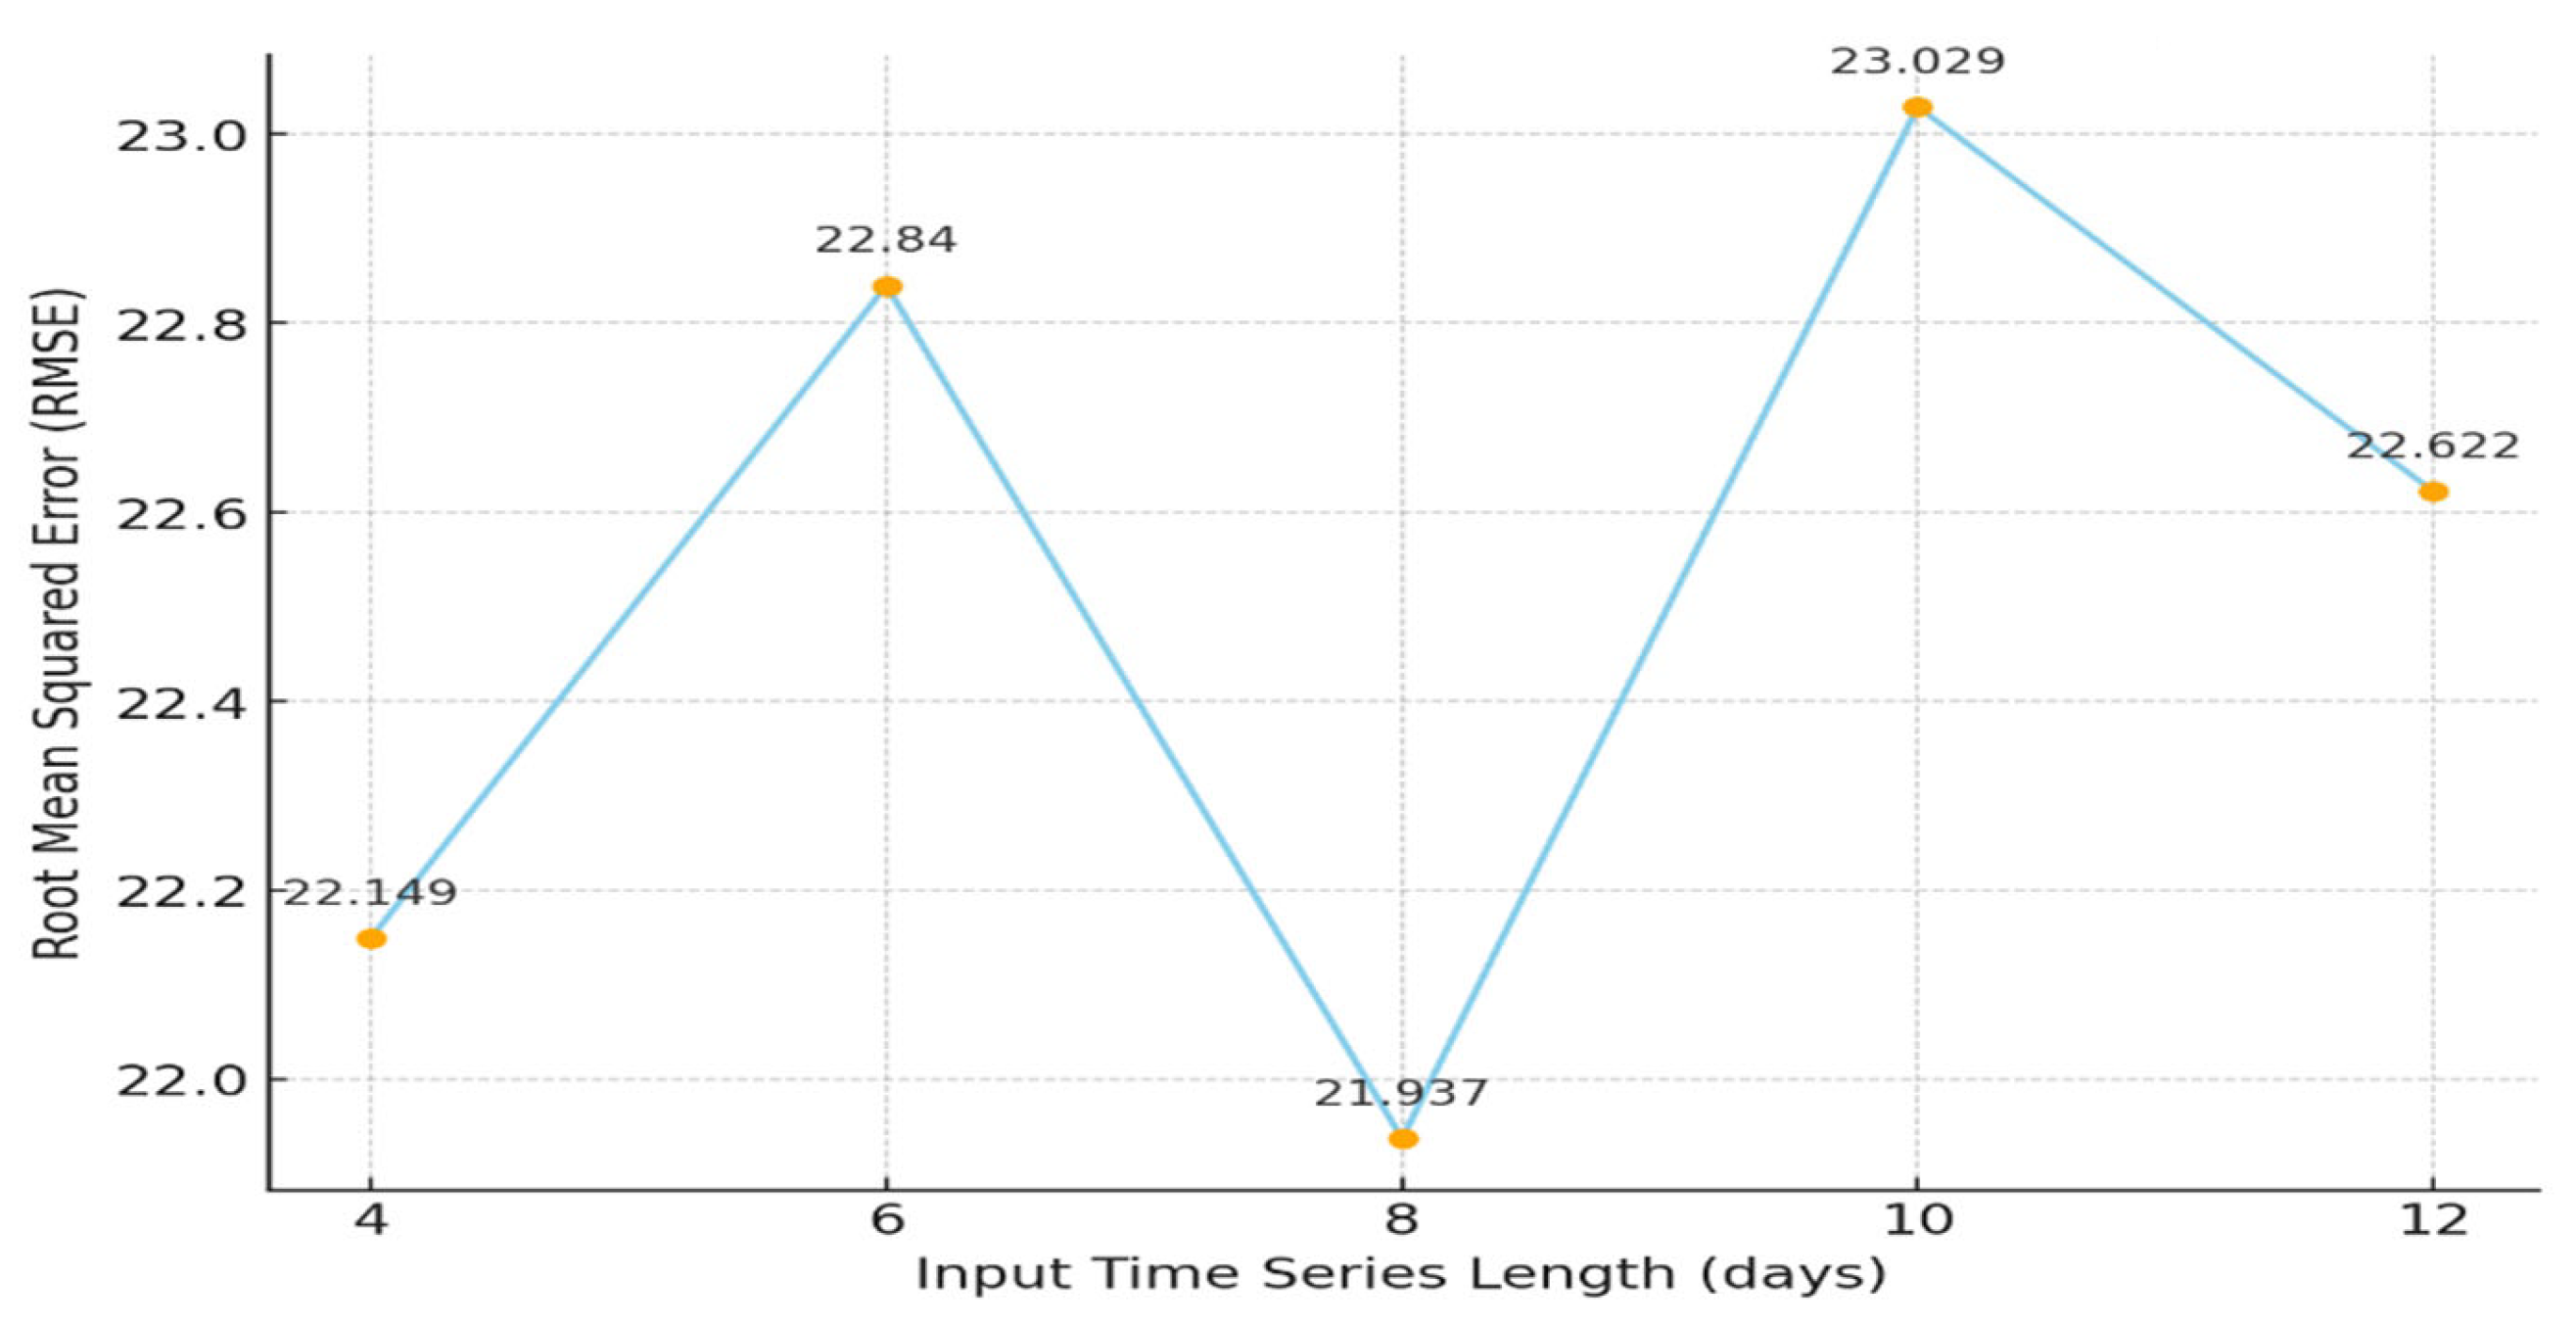
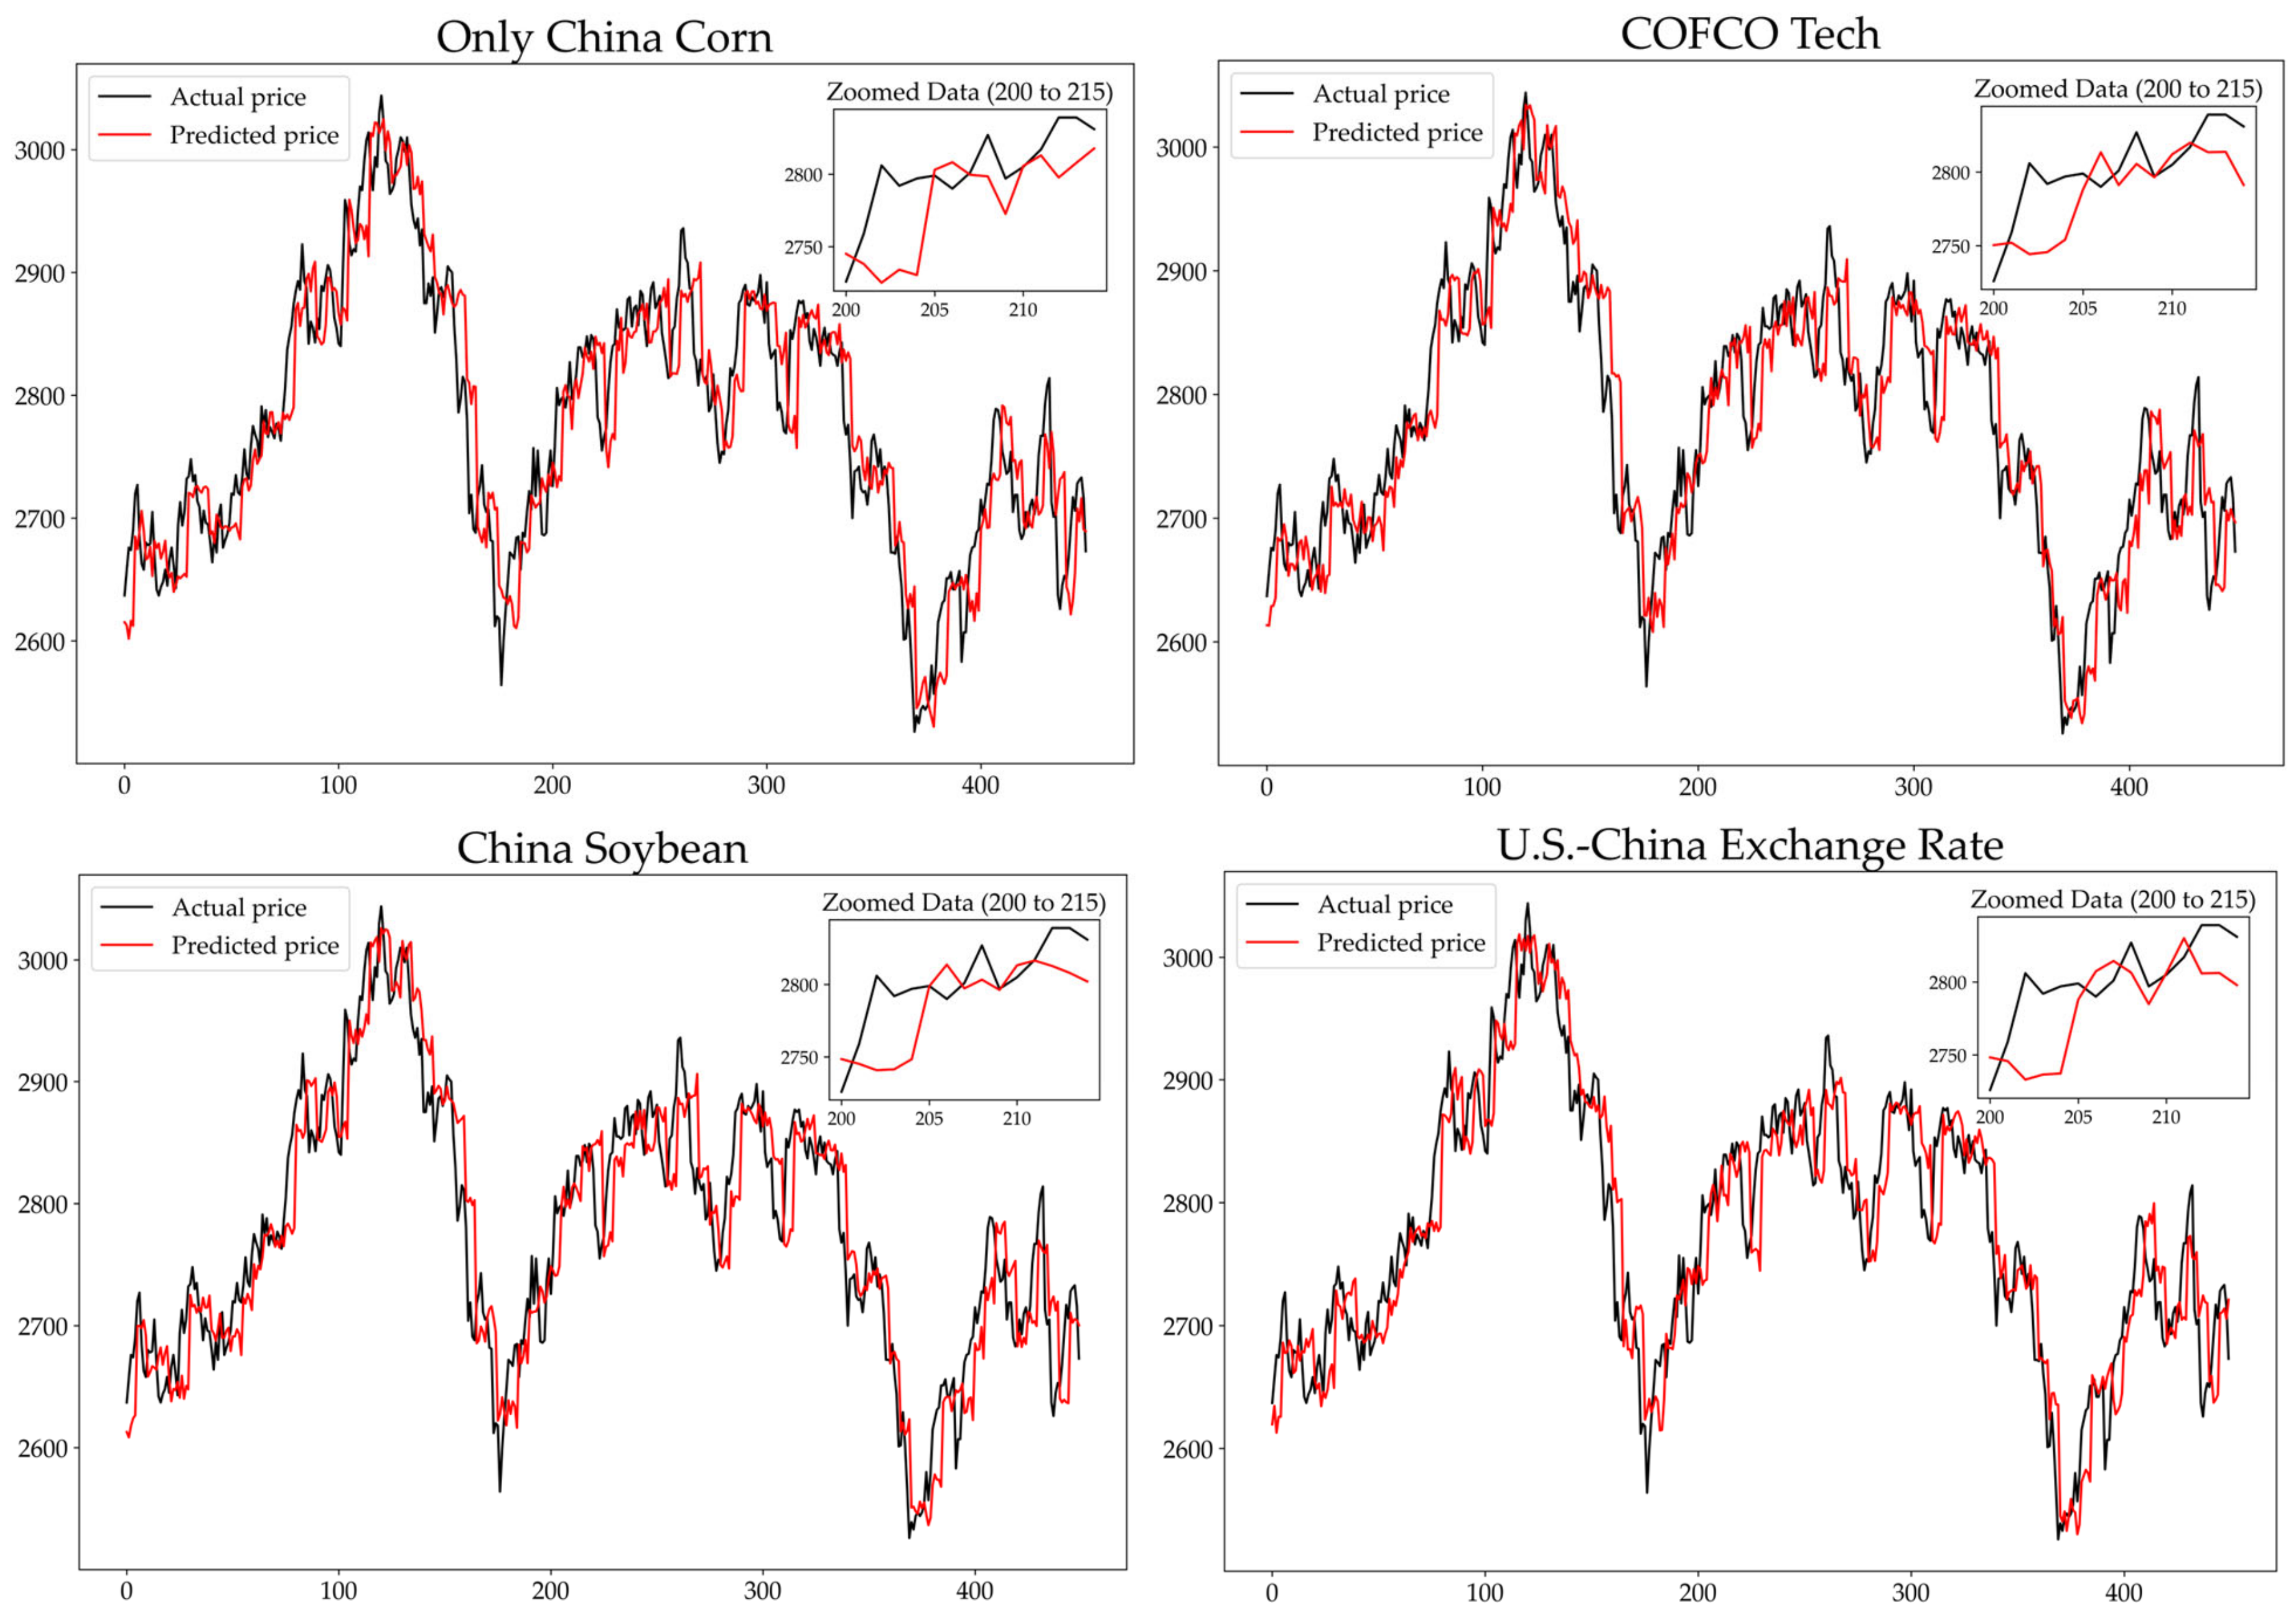
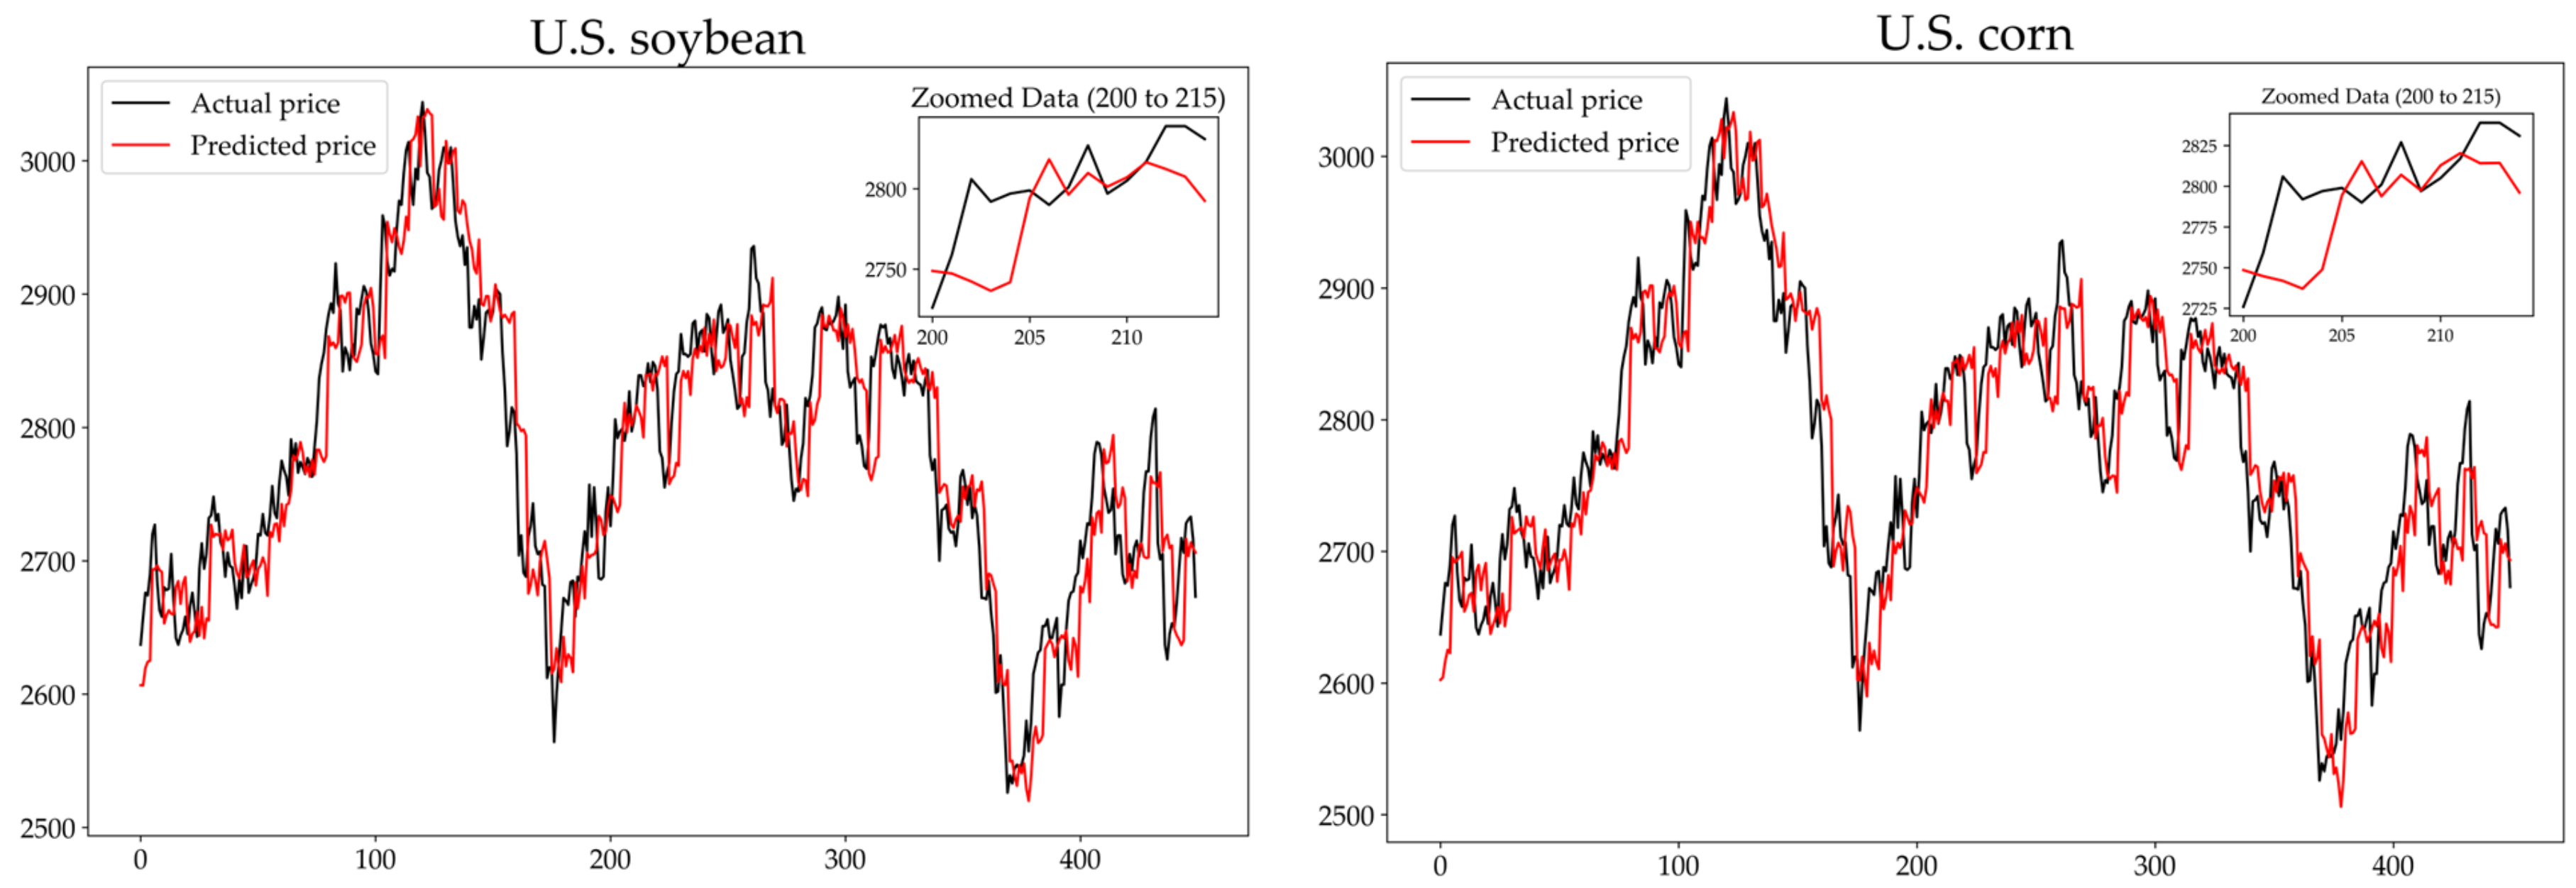
4.2. Analysis of Single-Step Prediction Results

This section evaluates the performance of the SCINet model in single-step forecasting and compares its prediction results with those of LSTM, GRU, and TCN. To identify the optimal input step length, the experiment adjusted the number of input days, ultimately determining that the model performed best when the input length was 8 days. As shown in Figure 4, the RMSE value reached its lowest point, 21.937, at an input length of 8 days, confirming this as the optimal input step.
Firstly, we compared the common approach adopted in most studies, which typically involves single-day predictions with input features consisting solely of historical futures prices, a method frequently used in existing literature. As shown in Table 2, the evaluation metrics indicate that, for one-day predictions, the model proposed in this paper outperforms all others in terms of every evaluation criterion, with the LSTM model coming second.
We then evaluated the effect of combining different influencing factors with historical prices of Chinese corn futures as inputs to the model, assessing the effectiveness of these factors in predicting corn futures prices. The results, shown in Table 3, reveal that Chinese soybean futures had the greatest impact on improving prediction accuracy, with MAE and RMSE values improving by 5.12% and 3.45%, respectively. In contrast, the inclusion of US corn futures and US soybean futures did not result in a significant improvement in prediction performance.
Subsequently, we combined all five sets of influencing factors with the historical prices of Chinese corn futures to examine whether the inclusion of multiple factors would further enhance prediction performance. However, as shown in Table 4, the accuracy of the predictions decreased when multiple influencing factors were combined. This suggests that there may be some degree of multicollinearity between these factors, with redundant information interfering with the model’s learning process. Therefore, in the subsequent multi-step predictions, the model was trained and tested using each influencing factor separately with the historical prices of Chinese corn futures, in order to mitigate the impact of multicollinearity on the prediction results.

4.3. Analysis of Multi-Step Forecast Results

4.3.1. 5-Day Forecast Result Analysis

In the context of multi-day forecasting, two different forecast horizons were selected for testing. Firstly, the 5-day forecast represents a typical trading week, while the 10-day forecast corresponds to approximately half a month of trading days. In agricultural futures markets, which can be highly volatile, multi-day forecasting provides decision-makers with advanced information, enabling more informed and accurate decisions. Compared to single-day forecasting, multi-day forecasts offer greater informational value and better demonstrate the superior performance of the model proposed in this paper, as well as the impact of incorporating multiple influencing factors. As shown in Table 5, when only historical corn futures prices are used as input, the model proposed in this paper outperforms all other models in terms of evaluation metrics. The LSTM model ranks second in terms of performance, which can be attributed to its ability to effectively learn and retain long-term dependencies, enabling it to perform relatively well even in the 5-day forecast. In contrast, the TCN model exhibits the poorest performance across all metrics, validating the limitations of TCN in long time-series forecasting, primarily due to its restricted receptive field, which hampers its ability to capture long-term dependencies.
Next, under the SCINet model, we conducted predictions of Chinese corn futures prices by incorporating various influencing factors, and the resulting evaluation metrics are presented in Table 6. The results show that whether stock data, exchange rate data, or related futures data were included, the model’s performance, as measured by various evaluation metrics, generally declined. However, the inclusion of Chinese soybean futures yielded the most significant improvement in prediction performance. This result further confirms the multifaceted complementary relationship between Chinese corn and soybean futures, highlighting the close link between the two markets. Particularly, the inclusion of US corn futures prices did not result in a substantial performance improvement, reflecting the fact that, in recent years, China’s demand for imported US corn has decreased, while its self-sufficiency rate has increased. As a result, fluctuations in US corn futures prices have a lesser impact on the volatility of Chinese corn futures prices.
As shown in Table 7, the inclusion of COFCO Technology stock and the China-US exchange rate data led to notable improvements in prediction performance, with MAE values decreasing by 2.83% and 3.19%, respectively. This suggests that COFCO Technology, as a company closely related to the corn industry, has a certain influence on the fluctuations of Chinese corn futures prices. Additionally, changes in the exchange rate can impact China’s corn import and export trade as well as international market prices, thus influencing corn futures prices. The exchange rate data’s impact on corn futures prices is second only to that of Chinese soybean futures. Finally, after including US corn futures prices in the model, the MAE value decreased by 1.67%, further validating the previous analysis. Despite the reduction in China’s imports of US corn, the country remains a significant importer of soybeans, and fluctuations in soybean futures prices continue to impact Chinese corn futures prices due to international trade and market transmission effects. In conclusion, these influencing factors prove to be effective in predicting Chinese corn futures prices over a 5-day horizon.
The actual and predicted values for the 5-day forecast with different influencing factors are shown in Figure 5. It can be observed that when Chinese soybean futures prices are included in the input data, the predicted value curve fits the actual values most closely, particularly at multiple inflection points. For example, in the zoomed-in range from 200 to 215, which was randomly selected, the error between the predicted and actual values is minimal. This range was specifically chosen as it corresponds to the pandemic period, a time of heightened market volatility, making the evaluation of prediction accuracy particularly significant. The method of randomly selecting the interval during the critical period was inspired by reference [14], which employed a similar approach for analysing market conditions. Other charts also show that incorporating different influencing factors leads to a noticeable improvement in the overall prediction trend. In contrast, the forecast based solely on historical corn futures prices exhibits the largest error. Therefore, for the 5-day prediction, we obtain results that are consistent with the evaluation metrics, which not only validate the reliability of this experiment but also further confirm that including these influencing factors effectively enhances the prediction accuracy of Chinese corn futures prices.

4.3.2. 10-Day Forecast Result Analysis

In this section, we evaluate the performance of the SCINet model and its comparison models in 10-day forecasting, with results presented in Table 8. As shown, the model selected in this paper still performs the best in the 10-day prediction. Additionally, LSTM outperforms TCN and GRU in the 10-day forecasting task. While LSTM and GRU have advantages in single-step predictions, their performance in the 10-day forecasting task is inferior to the SCINet model used in this study. This suggests that the SCINet model is better equipped to capture complex time dependencies over longer forecasting horizons, leading to more accurate predictions.
In Table 9, it can be seen that after incorporating different influencing factors, all prediction performances improved, except when U.S. corn futures data were added, which led to a decrease in performance. The inclusion of COFCO Technology stock data resulted in the largest improvement, and the addition of Chinese soybean futures also notably enhanced the prediction accuracy, consistent with the 5-day prediction results. This further supports the significant influence of Chinese soybean futures on the short-term fluctuations of Chinese corn futures prices. In Table 10, it is shown that the inclusion of COFCO Technology stock data reduced the MAE by 3.91% and the RMSE by 1.16%. The inclusion of Chinese soybean futures led to reductions in the MAE and RMSE by 3.36% and 1.11%, respectively. In the 5-day prediction, the inclusion of U.S. corn futures showed little improvement, while in the 10-day prediction, the performance actually declined compared to predictions based solely on historical corn prices. This further suggests that the Chinese corn futures market is largely unaffected by the U.S. corn futures market. Additionally, as shown in Figure 3, there is no significant correlation between the historical price movements of the two markets at multiple price peaks and troughs.
In the empirical results of the 10-day prediction, as shown in Figure 6, the randomly selected zoomed-in range from 100 to 140 clearly demonstrates that when only the historical prices of corn futures are used, the overall trend is relatively accurate, thus providing a reasonable reference for decision-makers. However, at several forecast points, there is still a significant discrepancy between the predicted and actual values, particularly at price fluctuation points, where the model fails to predict price movements effectively. This indicates that, with univariate input, the model’s long-term forecasting ability is diminished. When U.S. corn futures and soybean futures are added, there is little improvement in prediction performance. In some cases, the predictions are even worse than when using only historical prices, which aligns with the previously observed evaluation metrics. In contrast, when the data from Chinese soybean futures and COFCO Technology stock are incorporated, the predicted values fit the actual values better, especially at the turning points of price fluctuations, where the predictions become more accurate. For instance, in the zoomed-in starting section of the graph, the inclusion of Chinese soybean futures and COFCO Technology stock enables the model to accurately capture the turning points of price increases and decreases, whereas the predictions based solely on historical prices show slight delays and fail to predict the price direction accurately. This further demonstrates that the volatility of Chinese corn futures prices is more influenced by domestic market factors.

5. Discussion

The literature on forecasting Chinese corn futures prices is relatively scarce. Xu [59] points out that earlier research on futures price forecasting primarily focused on comparing the accuracy of different models, such as the random walk model, econometric models, commercial service models, and expert forecasts using low-frequency data. This study is similar to the work of Xu et al. [60,61], who explored the cointegration, information flow, and price discovery processes between the US corn spot and futures markets. They highlighted that the causal relationships between multiple corn futures and spot markets can enhance the accuracy of price forecasts. Thus, this study seeks to answer two main questions: first, whether there is an optimal method to accurately forecast the Chinese corn futures price; and second, whether incorporating additional factors can improve forecasting accuracy. The empirical results indicate that incorporating multiple market factors (such as Chinese soybean futures, the China-US exchange rate, etc.) alongside historical prices of Chinese corn futures significantly improves forecasting accuracy, particularly in multi-step forecasting, where performance is significantly improved compared to models relying solely on historical corn futures prices. The most notable improvement occurs when Chinese soybean futures and the China-US exchange rate are combined with the historical prices of Chinese corn futures. This is consistent with previous discussions, which suggest that factors such as exchange rates, livestock supply, and feed demand are closely linked to fluctuations in corn prices [17,18]. Moreover, these findings are in line with the results of Ahumada et al. [51], who demonstrated that incorporating both corn and soybean data enhances the forecasting accuracy of single commodity price models.
Traders, economists, and policymakers have a keen interest in the price discovery process [57]. Corn is not only an important source of food consumption but is also widely used in feed and industrial production, making the accurate prediction of corn futures prices of significant practical importance. Firstly, precise forecasting is particularly crucial for investors, especially in multi-step predictions over 5-day and 10-day periods, as it can effectively optimise trading strategies, mitigate risks, and enhance investment returns. By integrating various market factors such as historical corn futures prices, soybean futures, exchange rates, and relevant stock data, investors are able to gain a more comprehensive understanding of market trends and make informed decisions. The Granger causality test results in Table 1 indicate significant Granger causality relationships between Chinese soybean futures, US corn futures, COFCO Technology stock, and the China-US exchange rate with Chinese corn futures. This suggests that investors can use historical data from these factors to predict fluctuations in corn futures prices, thereby improving the accuracy of forecasts and the effectiveness of strategies. Notably, the bidirectional Granger causality between Chinese soybean futures and corn futures emphasises the substantial impact of soybean price changes on corn prices, providing investors with more robust decision-making insights. Secondly, for policymakers, corn futures price forecasting provides vital support for the formulation of agricultural policies. Accurate forecasts help safeguard food security, stabilise market fluctuations, and provide decision-making bases for responding to potential market risks, thereby ensuring national economic stability and food security. As shown in the results in Table 1, the significant impact of the China-US exchange rate on corn futures prices suggests that policymakers should pay attention to the potential impact of exchange rate fluctuations on domestic agricultural markets when formulating macroeconomic policies, especially in the context of global trade shifts. Through precise futures price forecasts, governments can take timely and effective measures to address possible market volatility, ensuring stability in agricultural production and supply chains.
Moreover, the findings of this study offer valuable guidance not only to participants in the Chinese market but also to international market decision-makers. By identifying market trends and potential risks in advance, policymakers can implement effective measures to ensure the long-term stability and sustainability of agriculture and the economy. For instance, the significant Granger causality relationship between US corn futures and Chinese corn futures highlights that fluctuations in the international market can have a substantial impact on the Chinese market, particularly given the US’s position as the world’s largest corn producer and exporter. Therefore, changes in international policies and trade environments, such as adjustments to tariff policies, may affect Chinese corn futures prices through this transnational price linkage, thereby influencing global agricultural economic stability. In conclusion, this study provides precise market forecasting tools for investors and policymakers, with significant practical implications. By combining the Granger causality analysis of multiple market factors, it not only optimises resource allocation, reduces risk, but also supports sustainable development and contributes to the long-term stability of agriculture and the economy.
Inevitably, our study has certain limitations. On one hand, while this paper considers various market factors influencing the price of corn futures, it does not delve deeply into non-market factors, such as geopolitical risks and major unforeseen events. Although these factors are often difficult to quantify, they could have a significant impact on price fluctuations. Future research could explore this direction further, incorporating these non-market factors to investigate their potential causal relationships with corn futures prices, thereby enhancing the accuracy of predictive models. On the other hand, while this study focuses on corn futures, there are still many other potential influencing factors worth exploring within this domain. A more in-depth investigation into the target futures could uncover additional relevant market factors, thereby refining the predictive model and improving its effectiveness. Furthermore, expanding the scope of the research to include other futures markets, as well as considering the price dynamics of other commodities and stocks, would provide a more comprehensive understanding of the complex factors affecting futures prices, thus offering valuable support for developing a more robust forecasting framework.

6. Conclusions

In previous studies, futures price forecasting has largely relied on the historical price data of the futures themselves. In this study, data from 4 January 2005 to 11 September 2023 on Chinese corn futures prices were incorporated, along with other market data, and Granger causality tests were used to identify three key market factors with causal relationships to Chinese corn futures: Chinese corn futures prices, COFCO Technology stock prices, and the China-US exchange rate. Subsequently, the SCINet model used in this study was compared with several deep learning models commonly employed in futures price forecasting. The results indicate that the market factors selected through the Granger causality test, when combined with historical corn futures prices, significantly enhance forecasting performance. This not only improves the accuracy of price volatility predictions but also addresses the issue of autocorrelation in historical data that has been prevalent in previous studies, offering a more comprehensive consideration of the market factors influencing Chinese corn futures price fluctuations. Furthermore, the model presented in this study outperforms others in both single-day and multi-day predictions, demonstrating superior risk prediction capabilities.
Our empirical findings offer valuable practical insights. Accurate forecasting of corn futures prices provides both domestic and international investors with crucial market trend insights, helping them anticipate potential market fluctuations and make more informed investment decisions. By incorporating key market factors such as soybean futures, exchange rates, and relevant stock data, investors can optimize trading strategies, reduce risks, and enhance returns. Furthermore, for policymakers, precise corn futures price forecasts play a significant role in the formulation of agricultural policies, offering vital support for ensuring food security, stabilising agricultural markets, and managing price volatility. By identifying market trends and potential risks in advance, policymakers are better positioned to take timely intervention measures, ensuring the long-term stability and sustainability of the agricultural sector and the broader economy.

Author Contributions

Conceptualization, Y.W.; Data curation, Y.W.; Formal analysis, Y.W.; Funding acquisition, H.L.; Investigation, Y.W.; Methodology, Y.W.; Project administration, Y.W.; Resources, Y.W.; Software, Y.W.; Supervision, Y.W.; Validation, Y.W.; Visualization, Y.W.; Writing—original draft, Y.W.; Writing—review & editing, Q.L., Y.H. and H.L. All authors will be informed about each step of manuscript processing including submission, revision, revision reminder, etc. via emails from our system or assigned Assistant Editor. All authors have read and agreed to the published version of the manuscript.

Funding

The work was supported by the Humanity and Social Science Foundation of the Ministry of Education of China (No. 18YJA630037, 21YJA630054). Zhejiang Province Soft Science Research Program Project (No. 2024C350470).

Institutional Review Board Statement

Not applicable.

Informed Consent Statement

Not applicable.

Data Availability Statement

The data in this paper are available from the website netease (https://finance.sina.com.cn, https://cn.investing.com, accessed on 4 November 2024).

Conflicts of Interest

The authors declare no conflicts of interest.

References

  1. Erenstein, O.; Jaleta, M.; Sonder, K.; Mottaleb, K.; Prasanna, B.M. Global Maize Production, Consumption and Trade: Trends and R&D Implications. Food Secur. 2022, 14, 1295–1319. [Google Scholar]
  2. Fu, H.M.; Zhang, H.Q.; Yao, X.L.; Zhou, L.; Pan, G.X. Can Corn Stove Bioethanol Production Substantially Contribute to China’s Carbon Neutrality Ambition? Resour. Conserv. Recycl. Adv. 2022, 15, 200111. [Google Scholar] [CrossRef]
  3. Yin, T.; Wang, Y. Nonlinear Analysis and Prediction of Soybean Futures. Agric. Econ. 2021, 67, 200–207. [Google Scholar] [CrossRef]
  4. Liu, W.; Wang, C.; Li, Y.; Liu, Y.; Huang, K. Ensemble Forecasting for Product Futures Prices Using Variational Mode Decomposition and Artificial Neural Networks. Chaos Solitons Fractals 2021, 146, 110822. [Google Scholar] [CrossRef]
  5. Ohyver, M.; Pudjihastuti, H. Arima Model for Forecasting the Price of Medium Quality Rice to Anticipate Price Fluctuations. Proc. Procedia Comput. Sci. 2018, 135, 707–711. [Google Scholar]
  6. Li, J.; Wang, J. Forcasting of Energy Futures Market and Synchronization Based on Stochastic Gated Recurrent Unit Model. Energy 2020, 213, 118787. [Google Scholar] [CrossRef]
  7. Jiang, F.; He, J.; Zeng, Z. Pigeon-Inspired Optimization and Extreme Learning Machine via Wavelet Packet Analysis for Predicting Bulk Commodity Futures Prices. Sci. China Inf. Sci. 2019, 62, 070204:1–070204:19. [Google Scholar] [CrossRef]
  8. Heaton, J.B.; Polson, N.G.; Witte, J.H. Deep Learning in Finance. arXiv 2016, arXiv:1602.06561. [Google Scholar]
  9. Gupta, N.; Nigam, S. Crude Oil Price Prediction Using Artificial Neural Network. Proc. Procedia Comput. Sci. 2020, 170, 642–647. [Google Scholar]
  10. Du, Y.; Chen, K.; Chen, S.; Yin, K. Prediction of Carbon Emissions Trading Price in Fujian Province: Based on BP Neural Network Model. Front. Energy Res. 2022, 10, 939602. [Google Scholar] [CrossRef]
  11. Jiang, B.; Gong, H.; Qin, H.; Zhu, M. Attention-LSTM Architecture Combined with Bayesian Hyperparameter Optimization for Indoor Temperature Prediction. Build. Environ. 2022, 224, 109536. [Google Scholar] [CrossRef]
  12. Sareen, K.; Panigrahi, B.K.; Shikhola, T.; Sharma, R. An Imputation and Decomposition Algorithms Based Integrated Approach with Bidirectional LSTM Neural Network for Wind Speed Prediction. Energy 2023, 278, 127799. [Google Scholar] [CrossRef]
  13. Yang, B.; Sun, S.; Li, J.; Lin, X.; Tian, Y. Traffic Flow Prediction Using LSTM with Feature Enhancement. Neurocomputing 2019, 332, 320–327. [Google Scholar] [CrossRef]
  14. Chen, Y.; Wu, J.; Wu, Z. China’s Commercial Bank Stock Price Prediction Using a Novel K-Means-LSTM Hybrid Approach. Expert Syst. Appl. 2022, 202, 117370. [Google Scholar] [CrossRef]
  15. Wang, C.; Zhang, X.; Wang, M.; Lim, M.K.; Ghadimi, P. Predictive Analytics of the Copper Spot Price by Utilizing Complex Network and Artificial Neural Network Techniques. Resour. Policy 2019, 63, 101414. [Google Scholar] [CrossRef]
  16. Wang, D.; Luo, H.; Grunder, O.; Lin, Y.; Guo, H. Multi-Step Ahead Electricity Price Forecasting Using a Hybrid Model Based on Two-Layer Decomposition Technique and BP Neural Network Optimized by Firefly Algorithm. Appl. Energy 2017, 190, 390–407. [Google Scholar] [CrossRef]
  17. Kocak, E.; Bilgili, F.; Bulut, U.; Kuskaya, S. Is Ethanol Production Responsible for the Increase in Corn Prices? Renew. Energy 2022, 199, 689–696. [Google Scholar] [CrossRef]
  18. Suh, D.H.; Moss, C.B. Decompositions of Corn Price Effects: Implications for Feed Grain Demand and Livestock Supply. Agric. Econ. 2017, 48, 491–500. [Google Scholar] [CrossRef]
  19. Xu, X.; Zhang, Y. Corn Cash Price Forecasting with Neural Networks. Comput. Electron. Agric. 2021, 184, 106120. [Google Scholar] [CrossRef]
  20. Demirer, R.; Kutan, A.M.; Shen, F. The Effect of Ethanol Listing on Corn Prices: Evidence from Spot and Futures Markets. Energy Econ. 2012, 34, 1400–1406. [Google Scholar] [CrossRef]
  21. Kristiansen, T. A Time Series Spot Price Forecast Model for the Nord Pool Market. Int. J. Electr. Power Energy Syst. 2014, 61, 20–26. [Google Scholar] [CrossRef]
  22. Guo, L.; Huang, X.; Li, Y.; Li, H. Forecasting Crude Oil Futures Price Using Machine Learning Methods: Evidence from China. Energy Econ. 2023, 127, 107089. [Google Scholar] [CrossRef]
  23. Granger, C.W.J. Investigating Causal Relations by Econometric Models and Cross-Spectral Methods. Econometrica 1969, 37, 424–438. [Google Scholar] [CrossRef]
  24. Liu, M.; Zeng, A.; Chen, M.; Xu, Z.; Lai, Q.; Ma, L.; Xu, Q. Scinet: Time Series Modeling and Forecasting with Sample Convolution and Interaction. Adv. Neural Inf. Process. Syst. 2022, 35, 5816–5828. [Google Scholar] [CrossRef]
  25. Deng, C.; Huang, Y.; Hasan, N.; Bao, Y. Multi-Step-Ahead Stock Price Index Forecasting Using Long Short-Term Memory Model with Multivariate Empirical Mode Decomposition. Inf. Sci. 2022, 607, 297–321. [Google Scholar] [CrossRef]
  26. Contreras, J.; Espínola, R.; Nogales, F.J.; Conejo, A.J. ARIMA Models to Predict Next-Day Electricity Prices. IEEE Trans. Power Syst. 2003, 18, 1014–1020. [Google Scholar] [CrossRef]
  27. Xiang, Y.; Zhuang, X.H. Application of ARIMA Model in Short-Term Prediction of International Crude Oil Price. Adv. Mater. Res. 2013, 798, 979–982. [Google Scholar]
  28. Lanza, A.; Manera, M.; Giovannini, M. Modeling and Forecasting Cointegrated Relationships among Heavy Oil and Product Prices. Energy Econ. 2005, 27, 831–848. [Google Scholar] [CrossRef]
  29. Yi, A.; Yang, M.; Li, Y. Macroeconomic Uncertainty and Crude Oil Futures Volatility–Evidence from China Crude Oil Futures Market. Front. Environ. Sci. 2021, 9, 636903. [Google Scholar] [CrossRef]
  30. Zou, H.F.; Xia, G.P.; Yang, F.T.; Wang, H.Y. An Investigation and Comparison of Artificial Neural Network and Time Series Models for Chinese Food Grain Price Forecasting. Neurocomputing 2007, 70, 2913–2923. [Google Scholar] [CrossRef]
  31. Sánchez Lasheras, F.; de Cos Juez, F.J.; Suárez Sánchez, A.; Krzemień, A.; Riesgo Fernández, P. Forecasting the COMEX Copper Spot Price by Means of Neural Networks and ARIMA Models. Resour. Policy 2015, 45, 37–43. [Google Scholar] [CrossRef]
  32. Hoseinzade, E.; Haratizadeh, S. CNNpred: CNN-Based Stock Market Prediction Using a Diverse Set of Variables. Expert Syst. Appl. 2019, 129, 273–285. [Google Scholar] [CrossRef]
  33. Cen, Z.; Wang, J. Crude Oil Price Prediction Model with Long Short Term Memory Deep Learning Based on Prior Knowledge Data Transfer. Energy 2019, 169, 160–171. [Google Scholar] [CrossRef]
  34. Bai, S.; Kolter, J.Z.; Koltun, V. An Empirical Evaluation of Generic Convolutional and Recurrent Networks for Sequence Modeling. arXiv 2018, arXiv:1803.01271. [Google Scholar]
  35. Li, D.; Li, Y.; Wang, C.; Chen, M.; Wu, Q. Forecasting Carbon Prices Based on Real-Time Decomposition and Causal Temporal Convolutional Networks. Appl. Energy 2023, 331, 120452. [Google Scholar] [CrossRef]
  36. Duan, P.; Goh, Y.M.; Zhou, J. The Impact of COVID-19 Pandemic on Construction Safety in China and the U.S.: A Comparative Study. Saf. Sci. 2023, 161, 106076. [Google Scholar] [CrossRef]
  37. Song, L.; Wang, H. Improved CEEMDAN-Based Aero-Engine Gas-Path Parameter Forecasting Using SCINet. J. Mech. Sci. Technol. 2023, 37, 1485–1500. [Google Scholar] [CrossRef]
  38. Ding, J.; Deng, F.; Liu, Q.; Wang, J. Regional Forecasting of Significant Wave Height and Mean Wave Period Using EOF-EEMD-SCINet Hybrid Model. Appl. Ocean Res. 2023, 136, 103582. [Google Scholar] [CrossRef]
  39. Guo, K.; Liu, F.; Sun, X.; Zhang, D.; Ji, Q. Predicting Natural Gas Futures’ Volatility Using Climate Risks. Financ. Res. Lett. 2023, 55, 103915. [Google Scholar] [CrossRef]
  40. Deng, S.; Huang, X.; Qin, Z.; Fu, Z.; Yang, T. A Novel Hybrid Method for Direction Forecasting and Trading of Apple Futures. Appl. Soft Comput. 2021, 110, 107734. [Google Scholar] [CrossRef]
  41. Lu, Y.; Teng, Y.; Zhang, Q.; Dai, J. Prediction Model for the Chemical Futures Price Using Improved Genetic Algorithm Based Long Short-Term Memory. Processes 2023, 11, 238. [Google Scholar] [CrossRef]
  42. Lin, Y.; Chen, K.; Zhang, X.; Tan, B.; Lu, Q. Forecasting Crude Oil Futures Prices Using BiLSTM-Attention-CNN Model with Wavelet Transform. Appl. Soft Comput. 2022, 130, 109723. [Google Scholar] [CrossRef]
  43. Cavalcante, R.C.; Brasileiro, R.C.; Souza, V.L.F.; Nobrega, J.P.; Oliveira, A.L.I. Computational Intelligence and Financial Markets: A Survey and Future Directions. Expert Syst. Appl. 2016, 55, 194–211. [Google Scholar] [CrossRef]
  44. Zhu, Q.; Zhang, F.; Liu, S.; Wu, Y.; Wang, L. A Hybrid VMD–BiGRU Model for Rubber Futures Time Series Forecasting. Appl. Soft Comput. J. 2019, 84, 105739. [Google Scholar] [CrossRef]
  45. Zhu, B.; Han, D.; Wang, P.; Wu, Z.; Zhang, T.; Wei, Y.M. Forecasting Carbon Price Using Empirical Mode Decomposition and Evolutionary Least Squares Support Vector Regression. Appl. Energy 2017, 191, 521–530. [Google Scholar] [CrossRef]
  46. Li, Y.; Wang, S.; Wei, Y.; Zhu, Q. A New Hybrid VMD-ICSS-BiGRU Approach for Gold Futures Price Forecasting and Algorithmic Trading. IEEE Trans. Comput. Soc. Syst. 2021, 8, 1357–1368. [Google Scholar] [CrossRef]
  47. Hua, R.; Liu, Q.; Tse, Y.; Yu, Q. The Impact of Natural Disaster Risk on the Return of Agricultural Futures. J. Asian Econ. 2023, 87, 101632. [Google Scholar] [CrossRef]
  48. Liang, J.; Jia, G. China Futures Price Forecasting Based on Online Search and Information Transfer. Data Sci. Manag. 2022, 5, 187–198. [Google Scholar] [CrossRef]
  49. Li, J.; Li, G.; Liu, M.; Zhu, X.; Wei, L. A Novel Text-Based Framework for Forecasting Agricultural Futures Using Massive Online News Headlines. Int. J. Forecast. 2022, 38, 35–50. [Google Scholar] [CrossRef]
  50. Dahl, R.E.; Oglend, A.; Yahya, M. Dynamics of Volatility Spillover in Commodity Markets: Linking Crude Oil to Agriculture. J. Commod. Mark. 2020, 20, 100111. [Google Scholar] [CrossRef]
  51. Ahumada, H.; Cornejo, M. Forecasting Food Prices: The Case of Corn, Soybeans and Wheat. Int. J. Forecast. 2016, 32, 838–848. [Google Scholar] [CrossRef]
  52. Hanif, W.; Mensi, W.; Vo, X.V.; BenSaïda, A.; Hernandez, J.A.; Kang, S.H. Dependence and Risk Management of Portfolios of Metals and Agricultural Commodity Futures. Resour. Policy 2023, 82, 103567. [Google Scholar] [CrossRef]
  53. Lu, M.; Chang, B.H.; Salman, A.; Razzaq, M.G.A.; Uddin, M.A. Time Varying Connectedness between Foreign Exchange Markets and Crude Oil Futures Prices. Resour. Policy 2023, 86, 104128. [Google Scholar] [CrossRef]
  54. Čermák, M.; Ligocká, M. Could Exist a Causality Between the Most Traded Commodities and Futures Commodity Prices in the Agricultural Market? Agris On-Line Pap. Econ. Inform. 2022, 14, 11–25. [Google Scholar] [CrossRef]
  55. Xu, X. Causality, Price Discovery, and Price Forecasts: Evidence from U.S. Corn Cash and Futures Markets. Ph.D. Thesis, North Carolina State University, Raleigh, NC, USA, 2015. [Google Scholar]
  56. Xu, X. Linear and Nonlinear Causality between Corn Cash and Futures Prices. J. Agric. Food Ind. Organ. 2018, 16, 20160006. [Google Scholar] [CrossRef]
  57. Xu, X. Causal Structure among US Corn Futures and Regional Cash Prices in the Time and Frequency Domain. J. Appl. Stat. 2018, 45, 2455–2480. [Google Scholar] [CrossRef]
  58. Liang, Y.; Li, S.; Yan, C.; Li, M.; Jiang, C. Explaining the Black-Box Model: A Survey of Local Interpretation Methods for Deep Neural Networks. Neurocomputing 2021, 419, 168–182. [Google Scholar] [CrossRef]
  59. Xu, X.; Thurman, W.N. Using Local Information to Improve Short-Run Corn Cash Price Forecasts. In Proceedings of the NCCC-134 Conference on Applied Commodity Price Analysis, Forecasting, and Market Risk Management, St. Louis, MO, USA, 20–21 April 2015. [Google Scholar] [CrossRef]
  60. Xu, X. Cointegration and Price Discovery in US Corn Cash and Futures Markets. Empir. Econ. 2018, 55, 1889–1923. [Google Scholar] [CrossRef]
  61. Xu, X. Price Dynamics in Corn Cash and Futures Markets: Cointegration, Causality, and Forecasting through a Rolling Window Approach. Financ. Mark. Portf. Manag. 2019, 33, 155–181. [Google Scholar] [CrossRef]
Figure 1. SCINet model structure.
Information 15 00817 g001
Figure 2. Main methodological framework.
Information 15 00817 g002
Figure 3. Historical data for closing prices of nine groups of data.
Information 15 00817 g003
Figure 4. RMSE values for different input numbers of days.
Information 15 00817 g004
Figure 5. 5-day forecast combining different influencing factors.
Information 15 00817 g005aInformation 15 00817 g005b
Figure 6. 10-day forecast combining different influencing factors.
Information 15 00817 g006aInformation 15 00817 g006b
Table 1. Linear Granger causality test.
Null Hypothesis:F-StatisticProb.
CNSOYA does not Granger Cause CNCORN4.225245 × 10−5
CNCORN does not Granger Cause CNSOYA1.851030.0633
COFCO_TECH does not Granger Cause CNCORN4.849586 × 10−6
CNCORN does not Granger Cause COFCO_TECH3.146460.0015
ER does not Granger Cause CNCORN1.252770.0037
CNCORN does not Granger Cause ER0.460510.7039
NEWHOPE does not Granger Cause CNCORN2.414370.0134
CNCORN does not Granger Cause NEWHOPE0.648270.7375
USCORN does not Granger Cause CNCORN13.37873 × 10−19
CNCORN does not Granger Cause USCORN1.684460.0968
USSOYA does not Granger Cause CNCORN10.20183 × 10−14
CNCORN does not Granger Cause USSOYA1.505080.1498
WHEAT does not Granger Cause CNCORN1.146430.3283
CNCORN does not Granger Cause WHEAT1.102810.3577
WTI does not Granger Cause CNCORN1.370310.2042
CNCORN does not Granger Cause WTI0.582850.7929
Table 2. Evaluation indicators for single-step prediction based on corn futures data.
ModelMAEMAPERMSE
TCN29.8511.07034.594
GRU18.1210.65524.059
LSTM17.8100.64323.162
SCINet16.6430.60121.937
Table 3. Evaluation indicators for one-step prediction based on multi-source data.
Input FeaturesMAEMAPERMSE
Chinese corn futures16.6430.60121.937
COFCO Technology15.8370.57921.220
US soybean futures16.5230.59121.821
Exchange rate15.8620.57221.122
US corn futures16.6370.60121.966
Chinese soybean futures15.7910.57021.181
All influencing factors17.1270.61822.460
Table 4. Percentage improvement in single-day forecast results.
Input FeaturesMAEMAPERMSE
Chinese corn futures /
COFCO Technology4.84%3.66%3.27%
US soybean futures0.72%1.66%0.53%
Exchange rate4.69%4.82%3.71%
US corn futures0.04%0.00%0.13%
Chinese soybean futures5.12%5.15%3.45%
All influencing factors−2.90%−2.82%−2.38%
Table 5. Evaluation metrics for different models with 5-day forecasts using historical data only.
ModelMAEMAPERMSE
TCN46.8091.68658.247
GRU43.1871.55452.293
LSTM36.0281.59545.186
SCINet32.8471.18642.101
Table 6. Comparison of the 5-day prediction effects of multiple influencing factors in the SCINet model.
Input FeaturesMAEMAPERMSE
Chinese corn futures32.8471.18642.101
COFCO Technology31.9161.15140.838
US soybean futures32.2971.16641.157
Exchange rate31.7991.14840.855
US corn futures32.7241.18341.630
Chinese soybean futures31.6181.14140.420
Table 7. Percentage improvement in 5-day forecast results.
Input FeaturesMAEMAPERMSE
Chinese corn futures /
COFCO Technology2.83%2.95%3.00%
US soybean futures1.67%1.69%2.24%
Exchange rate3.19%3.20%2.86%
US corn futures0.374%0.253%1.12%
Chinese soybean futures3.74%3.79%3.40%
Table 8. Evaluation metrics for different models with 10-day forecasts using only historical data.
ModelMAEMAPERMSE
TCN70.1282.53285.750
GRU65.0152.34778.946
LSTM59.6572.09374.215
SCINet45.1901.63455.404
Table 9. Comparison of the 10-day prediction effects of multiple influencing factors in the SCINet model.
Input FeaturesMAEMAPERMSE
Chinese corn futures45.1901.63455.404
COFCO Technology43.6301.57754.758
US soybean futures44.9121.62456.166
Exchange rate44.5901.61155.296
US corn futures45.5721.65056.939
Chinese soybean futures43.8811.58654.787
Table 10. Percentage improvement in 10-day forecast results.
Input FeaturesMAEMAPERMSE
Chinese corn futures /
COFCO Technology3.91%3.49%1.16%
US soybean futures1.08%0.61%−1.37%
Exchange rate1.79%1.41%0.20%
US corn futures−0.37%−0.98%−2.77%
Chinese soybean futures3.36%2.94%1.11%
Disclaimer/Publisher’s Note: The statements, opinions and data contained in all publications are solely those of the individual author(s) and contributor(s) and not of MDPI and/or the editor(s). MDPI and/or the editor(s) disclaim responsibility for any injury to people or property resulting from any ideas, methods, instructions or products referred to in the content.

