


Model and Implementation of a Novel Heat-Powered Battery-Less IIoT Architecture for Predictive Industrial Maintenance


Abstract
:1. Introduction
1.1. Waste Heat Recovery Systems (WHRS)
1.2. WHRSs in IoT and Harsh Environments
- They use low-range wireless protocols, which implies expensive costs in wireless infrastructures (i.e., WirelessHart or ISA100 protocols).
- They have a low data rate (sending data from 1 time per hour to 1 time per day).
- They do not process data in the node (edge computing), which implies the need to move computerized data to the cloud (with more costs and carbon footprint).
- Heat affects their durability, reducing their lifetime by more than 20% when the temperature is above 80 °C [21].
1.3. WHRS Modelling
2. WHRS Architectures for IoT
3. IoT-WHRS Model Parametrization
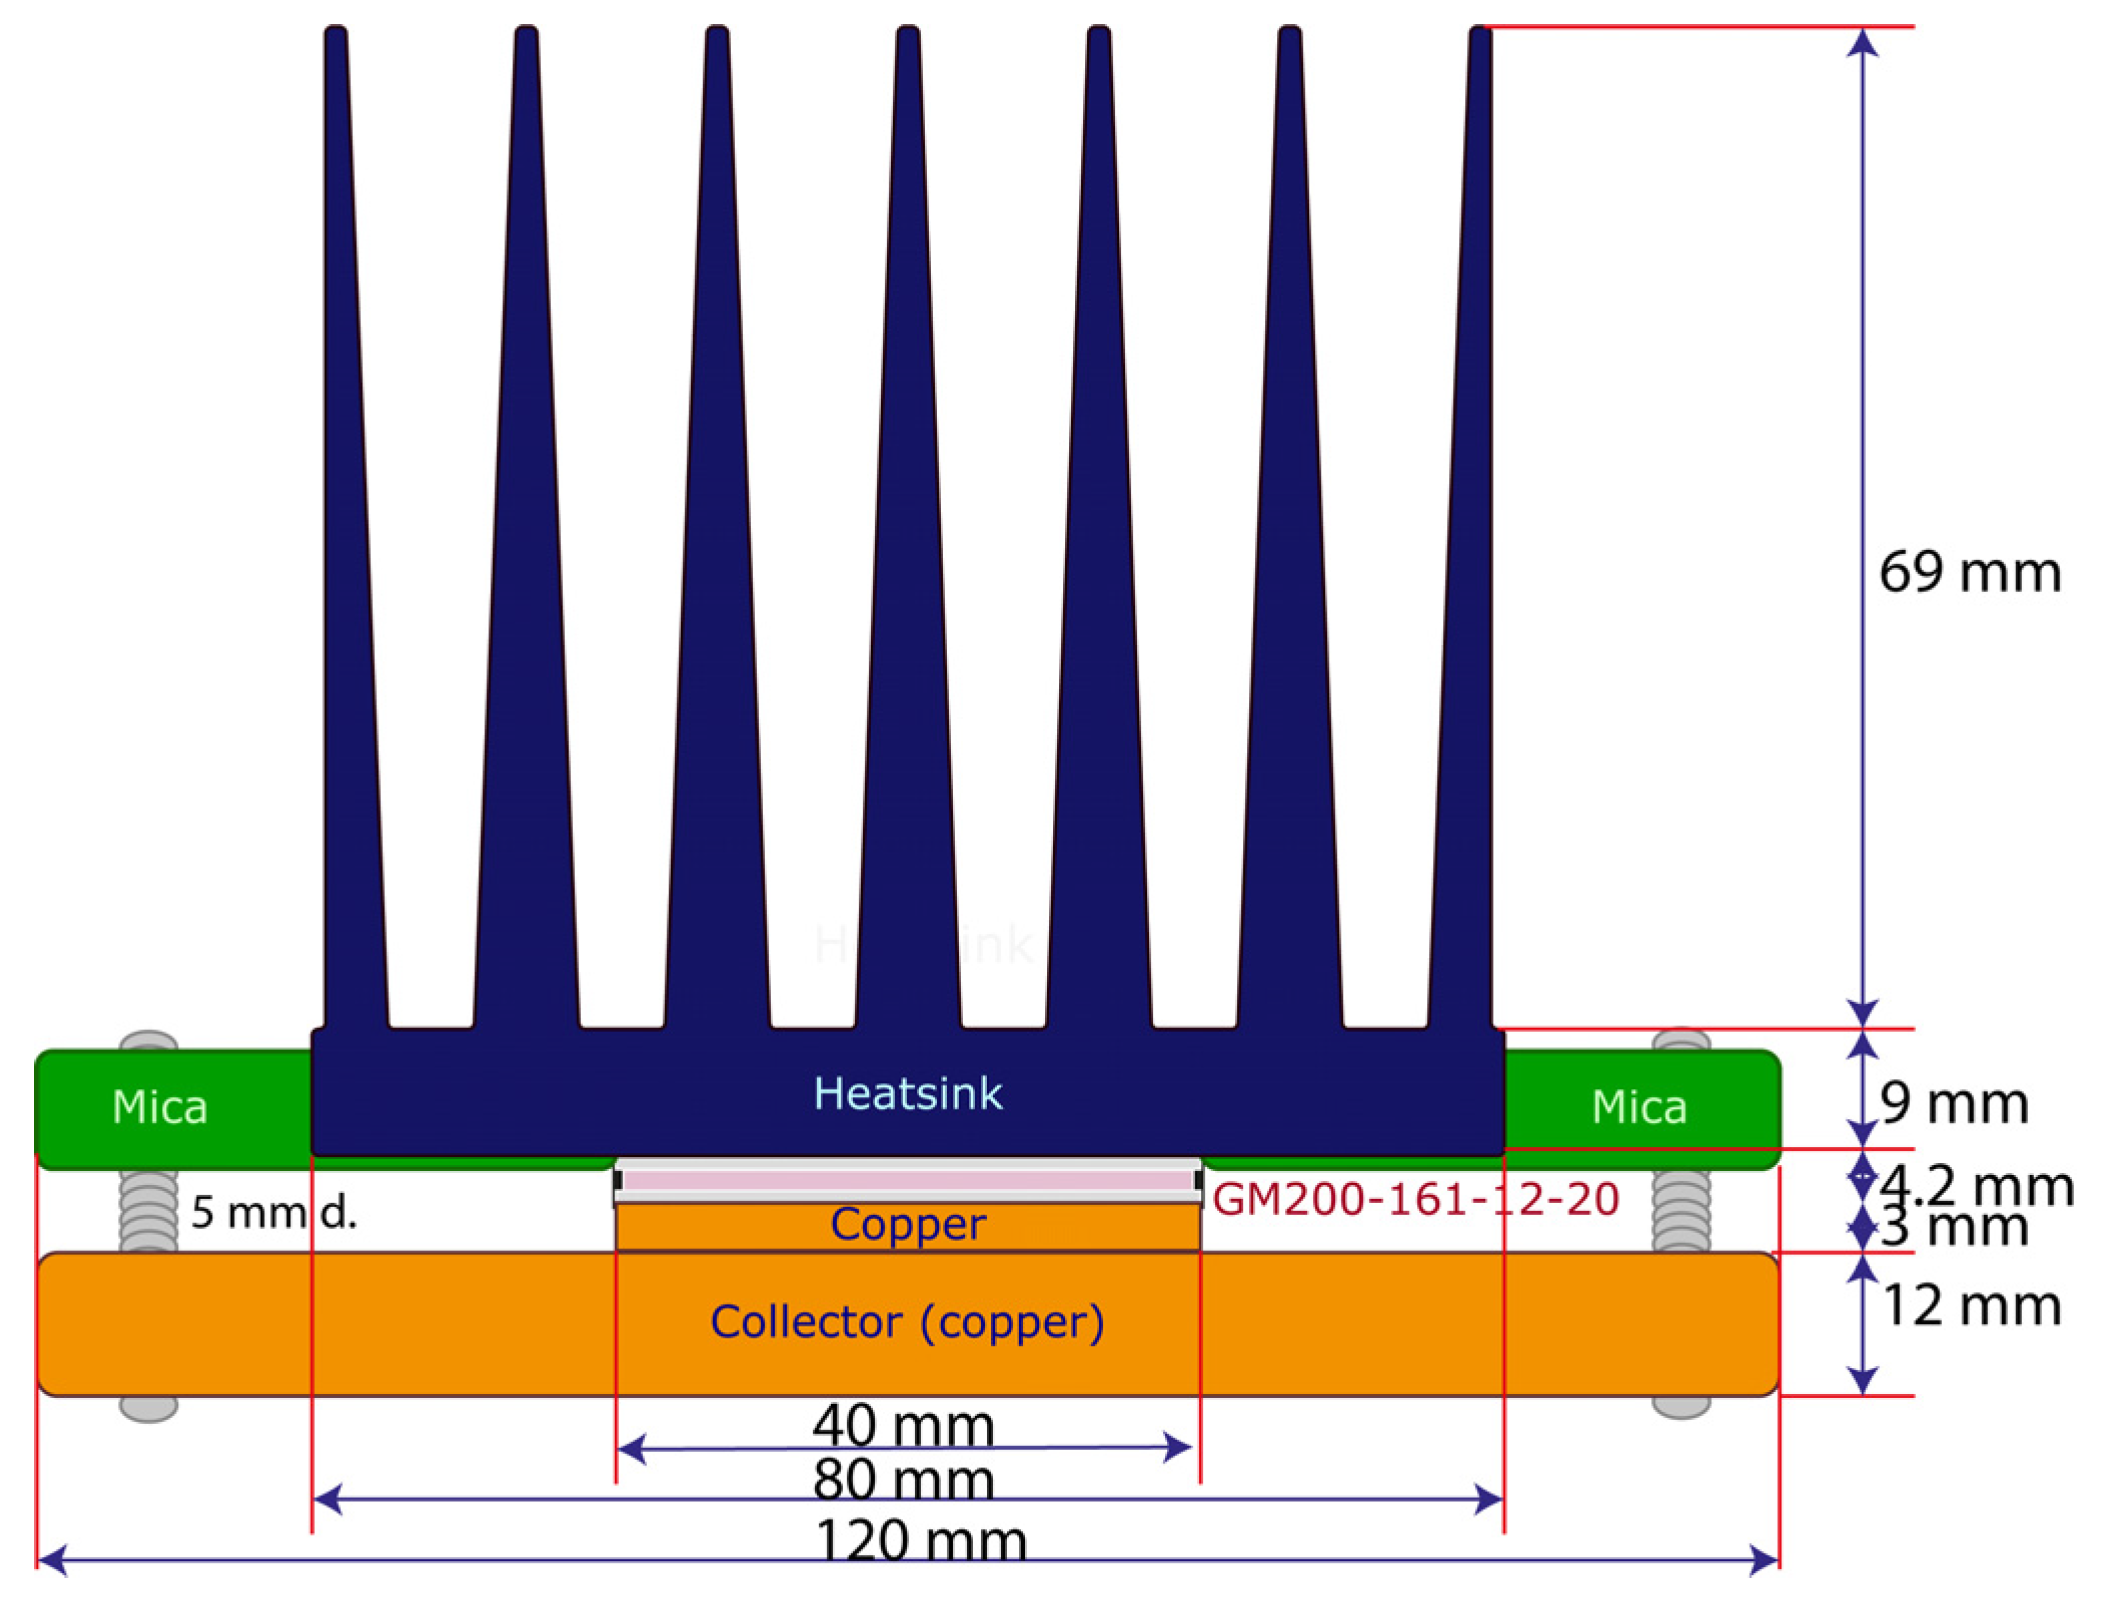
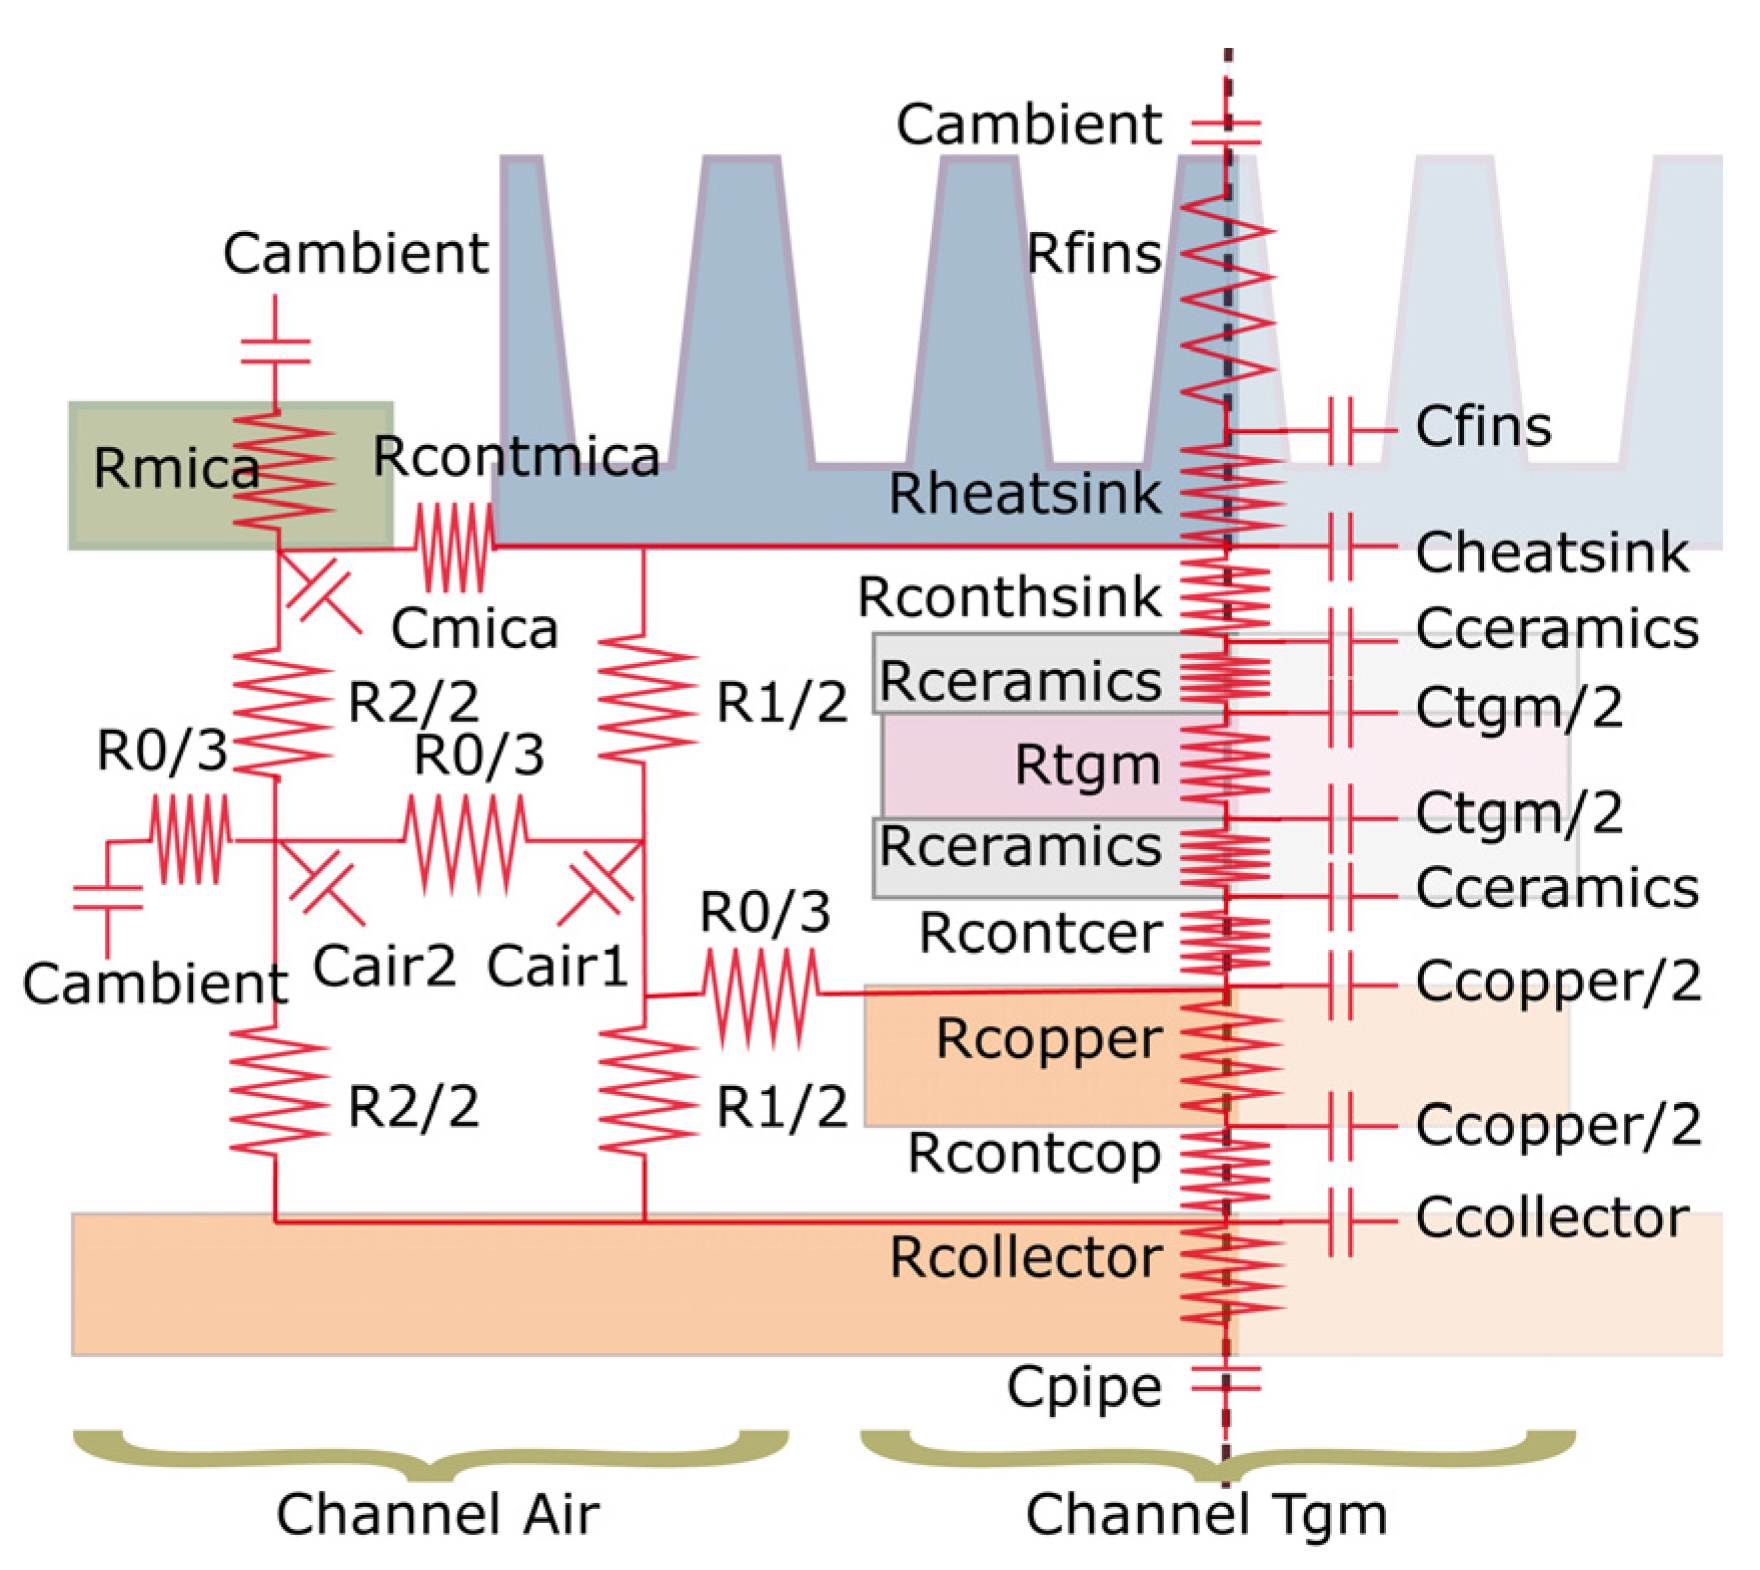
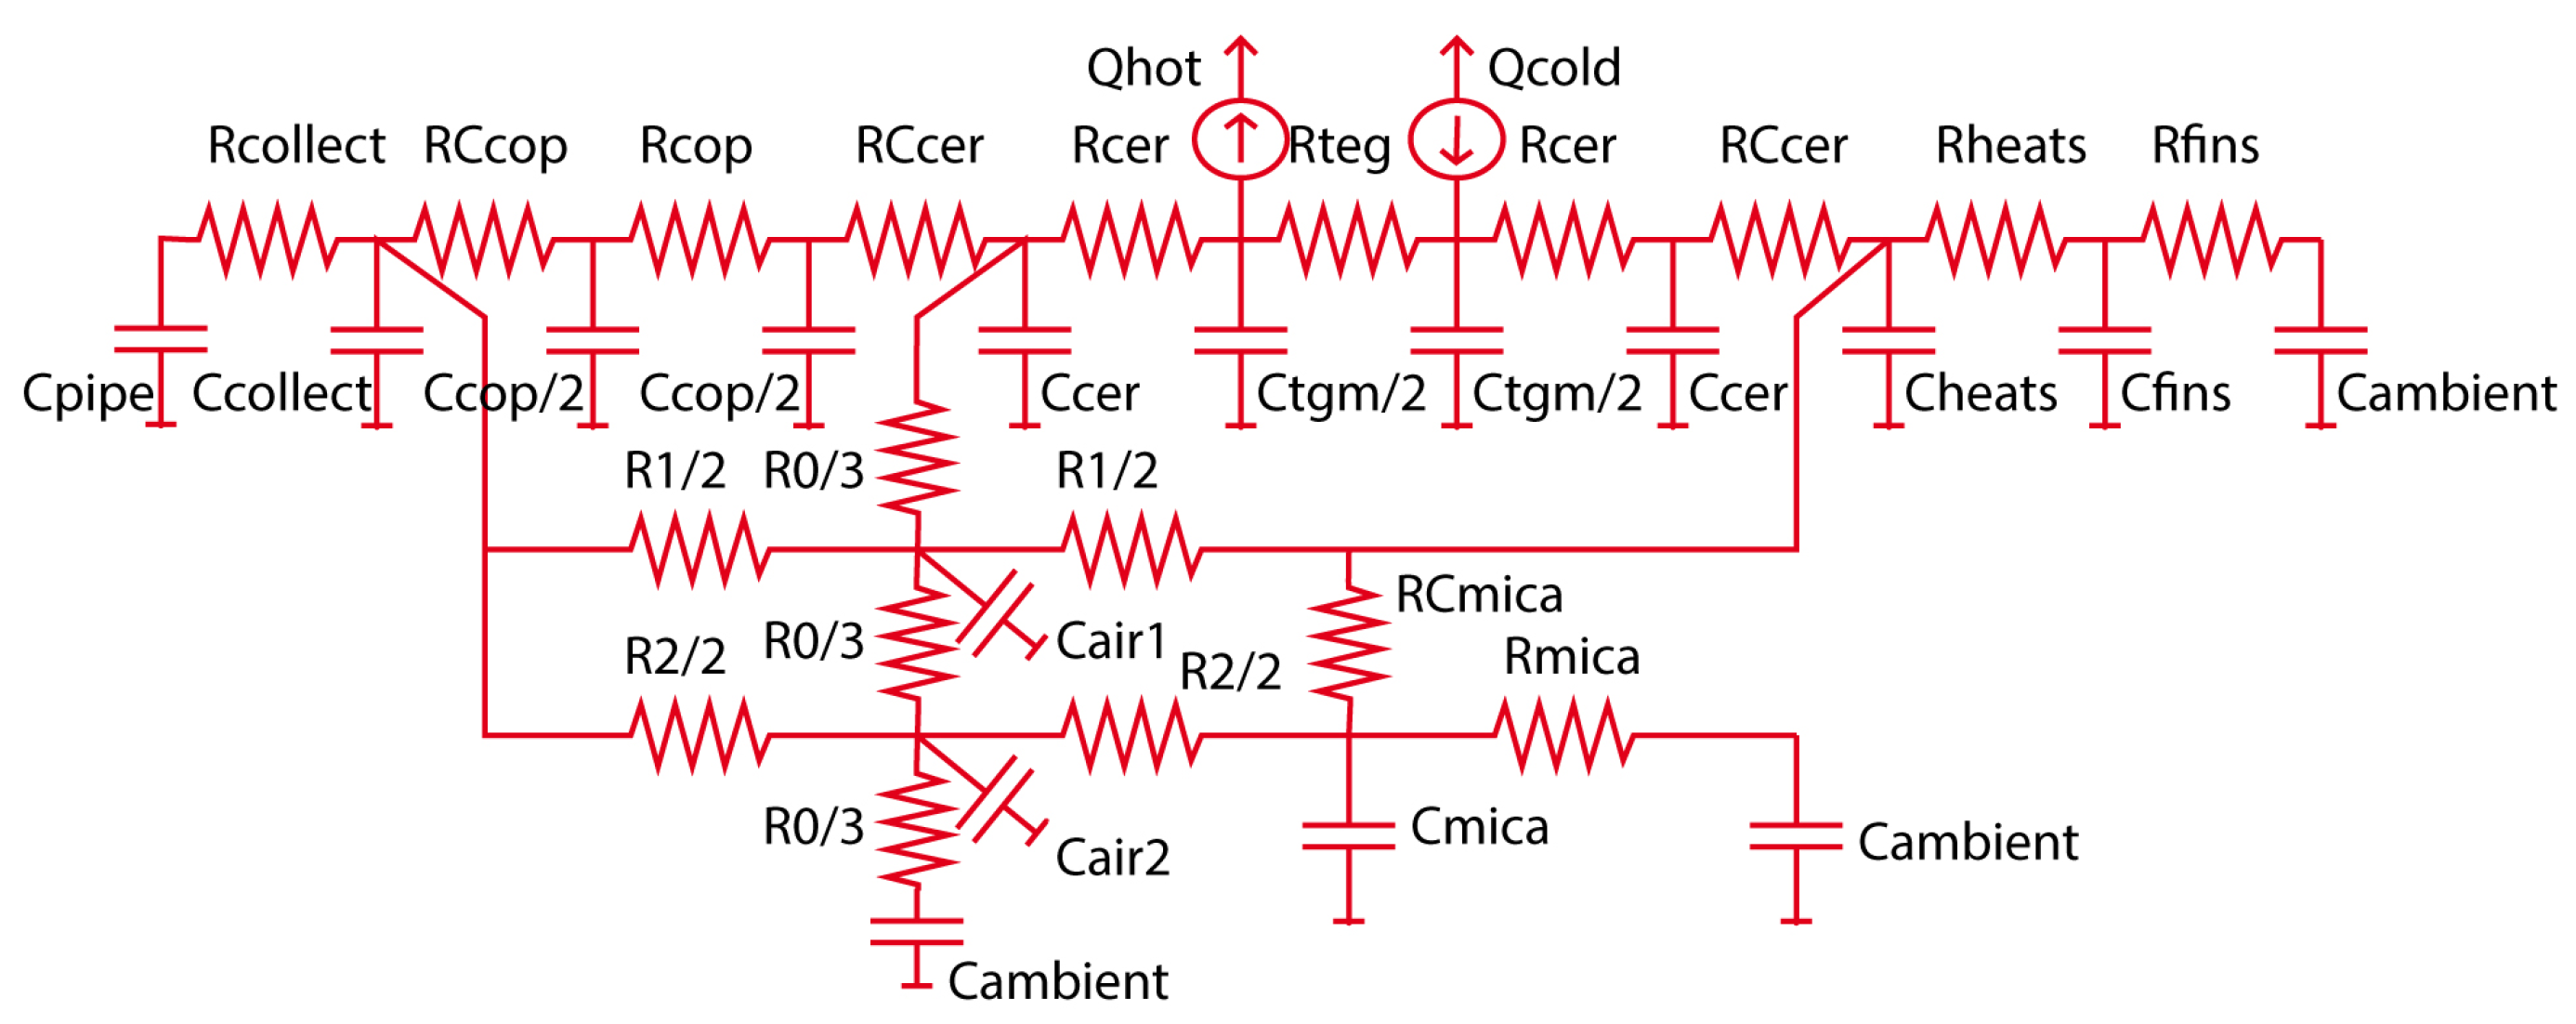
3.1. IoT-WHRS RC Model
- The copper collector and the piece of copper between the collector and the TEG.
- The TEG device. The thermoelectric effect, the ceramic plates and the weld joining to the ceramic plates are considered. Qhot and Qcold explain the rejection and absorption of heat in the TEG.
- The heatsink and heatsink fins.
- The contacts between these components are thermal heat resistances to the heat propagation.
- The volume of the air gap.
3.2. Heat Propagation Contribution of the TEG Channel
3.3. Contribution of the Air Gap Channel to the Heat Propagation
4. TEG Efficient Parameters Model
5. IoT-WHRS Finite Difference Model
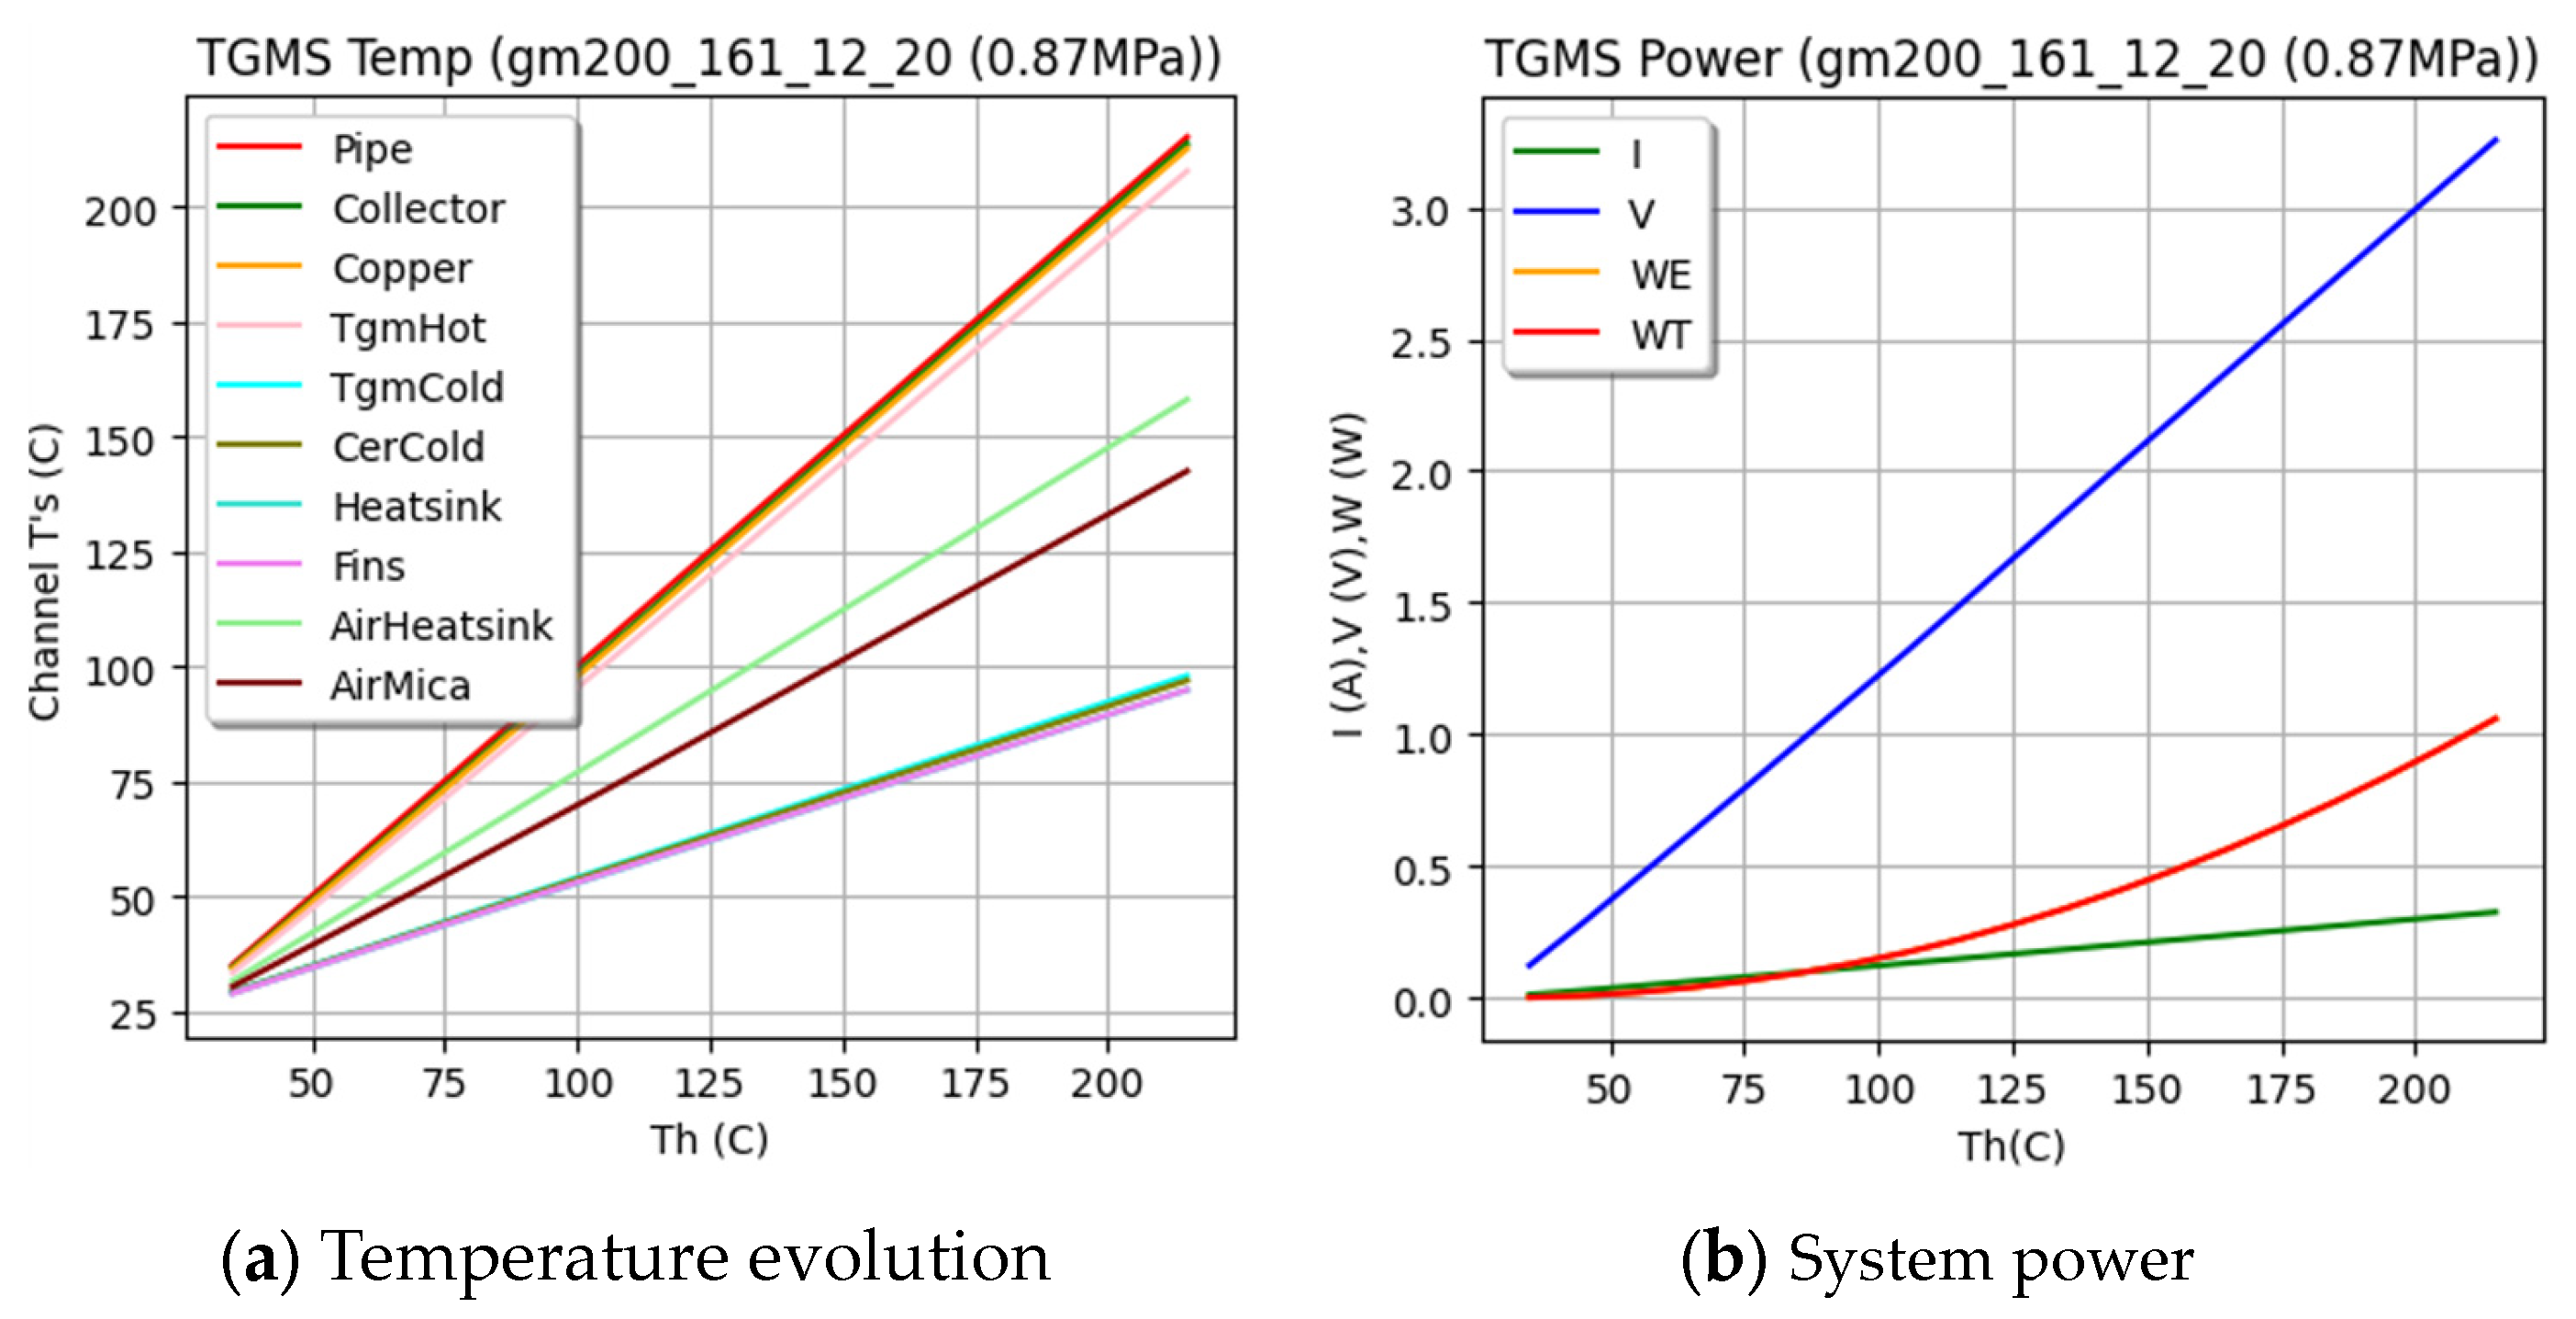
6. Simulation Results
7. Low-Power Autonomous Hardware Architecture
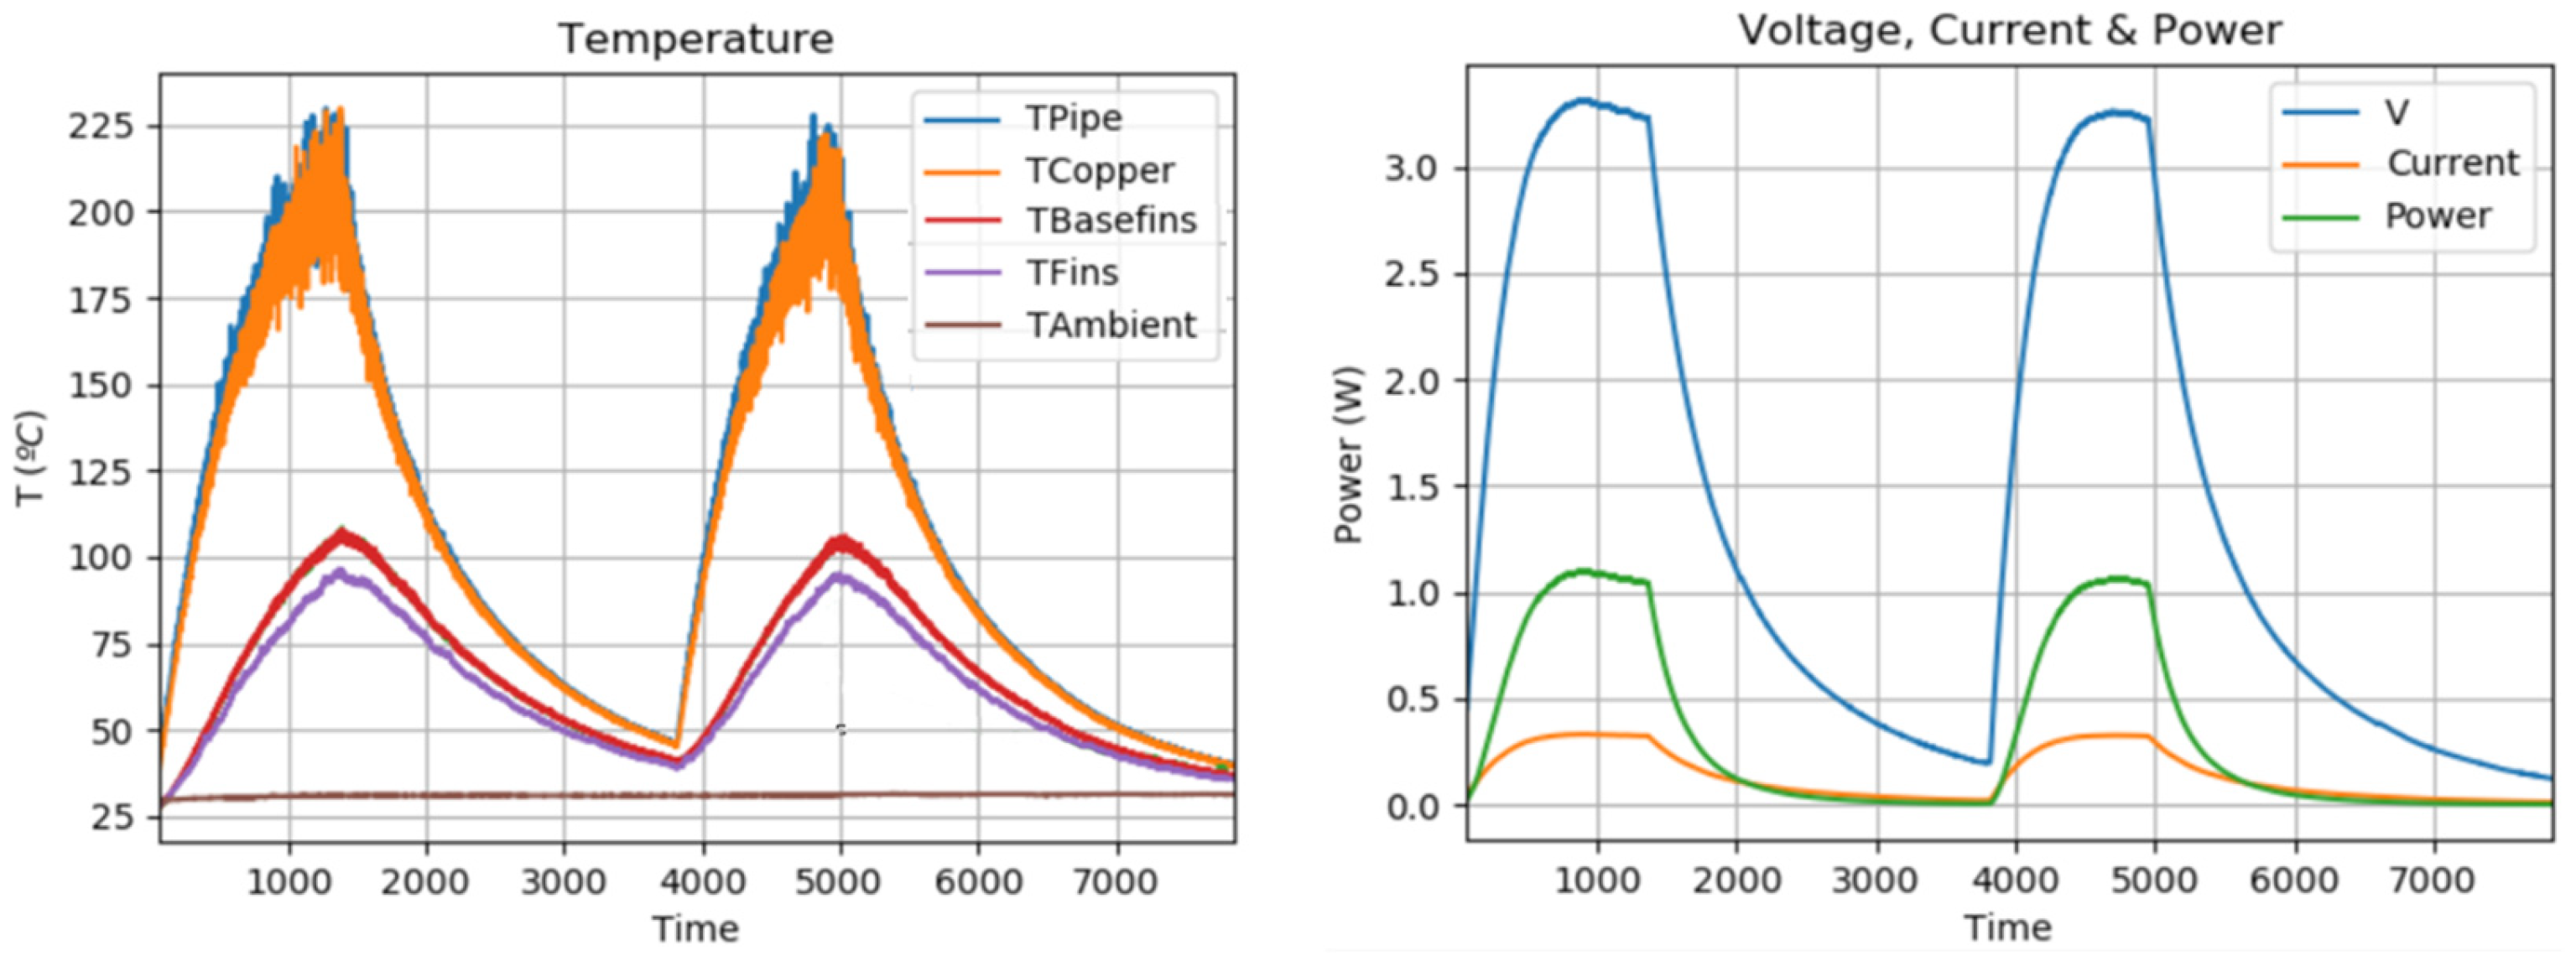
8. Experimental Results
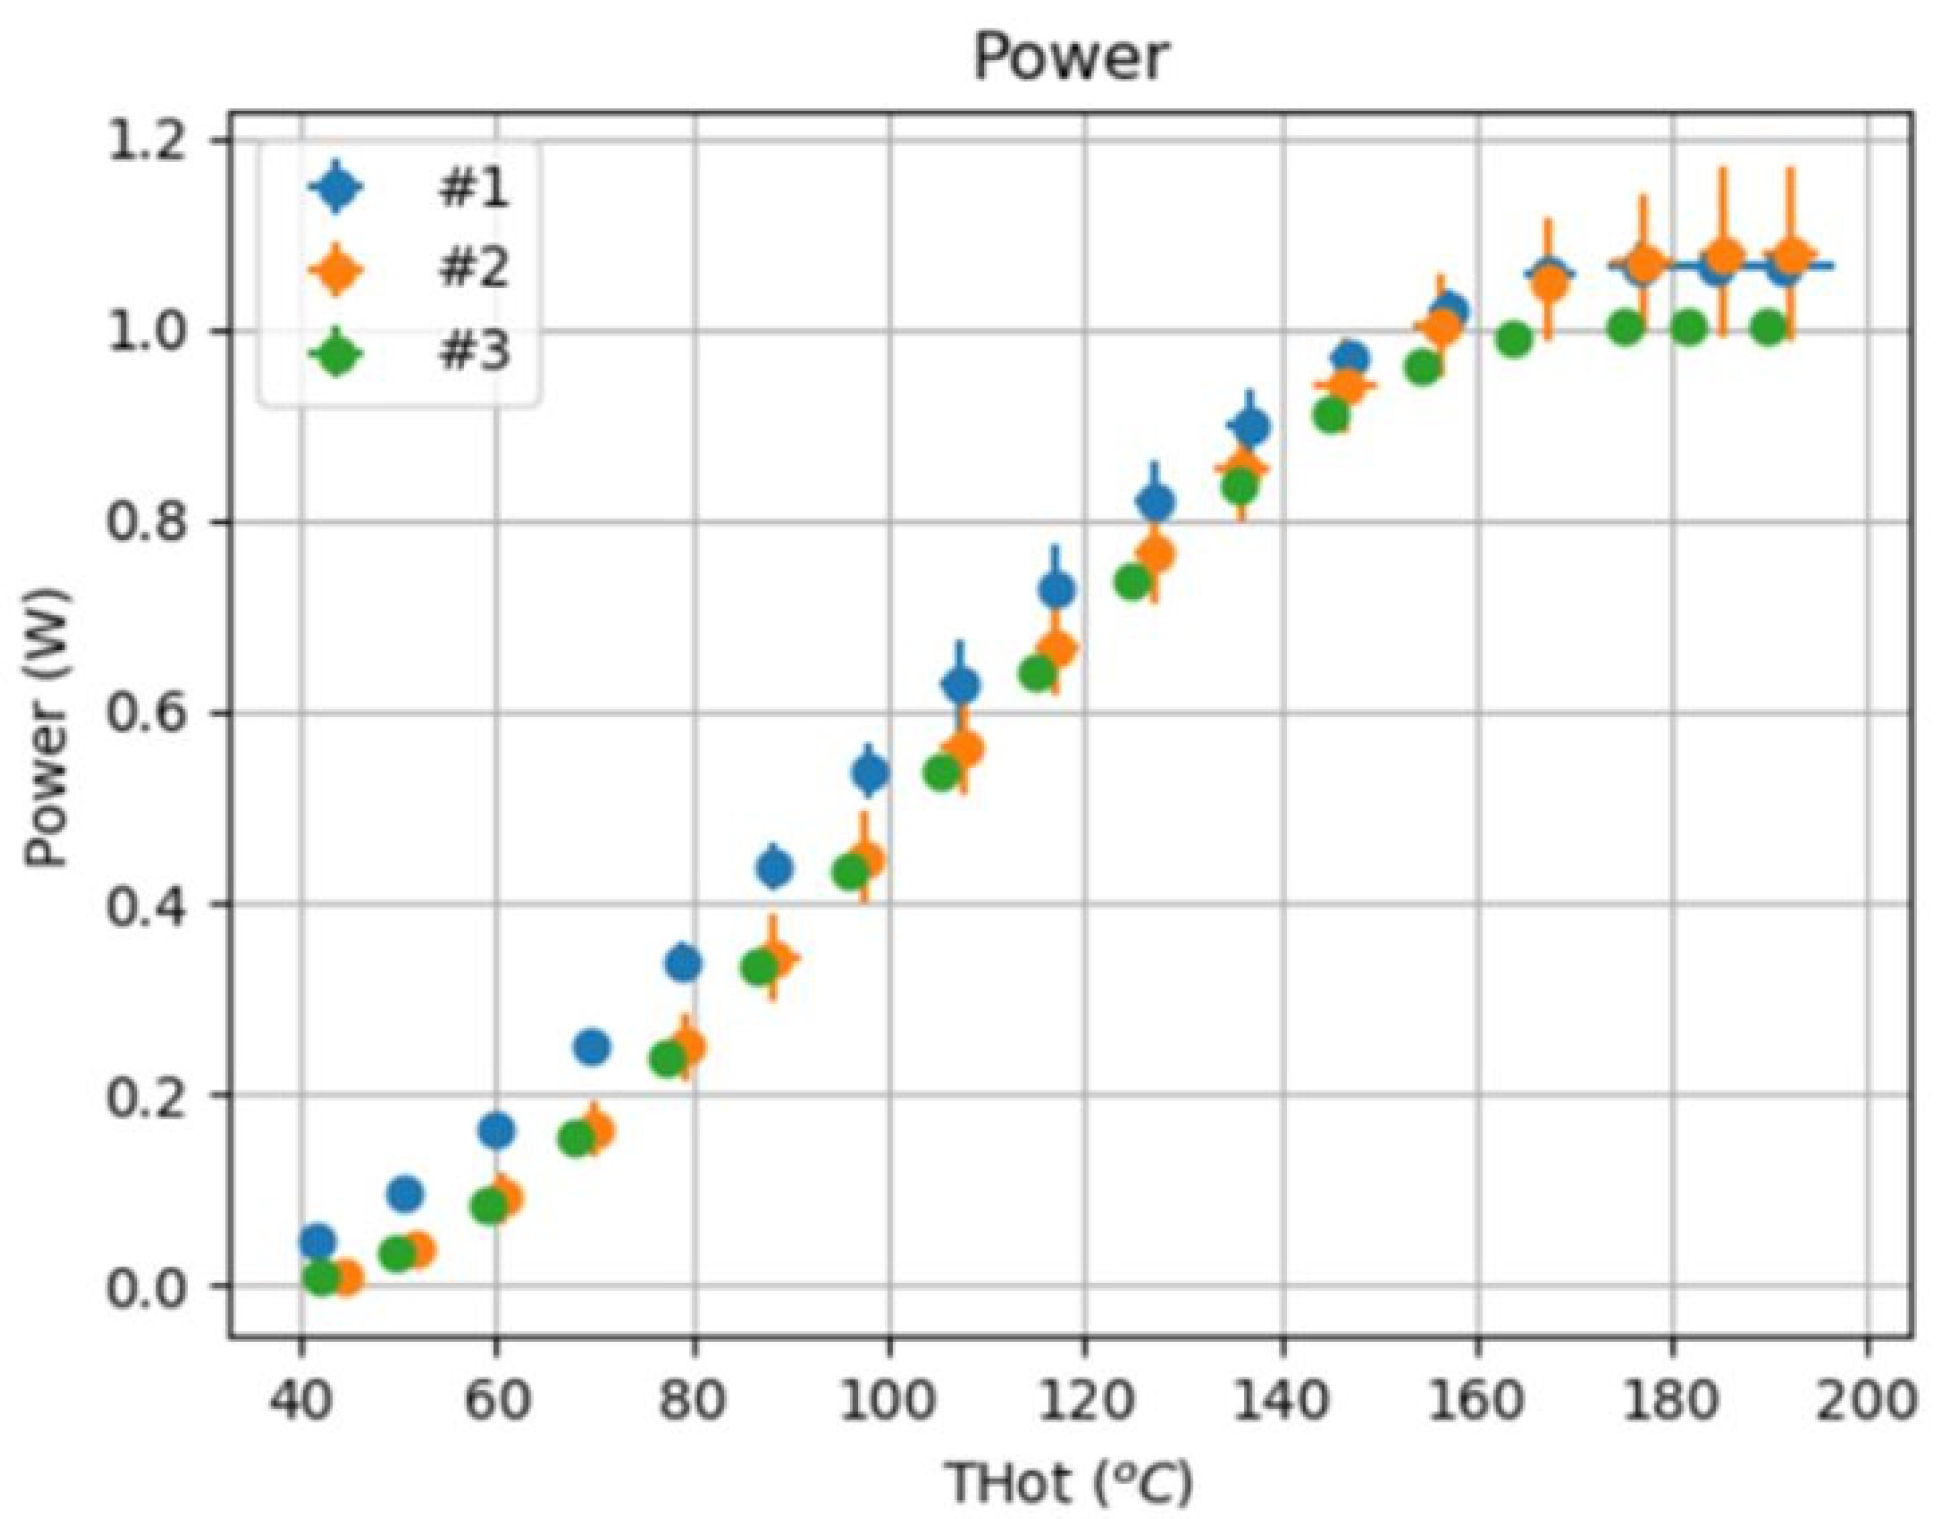
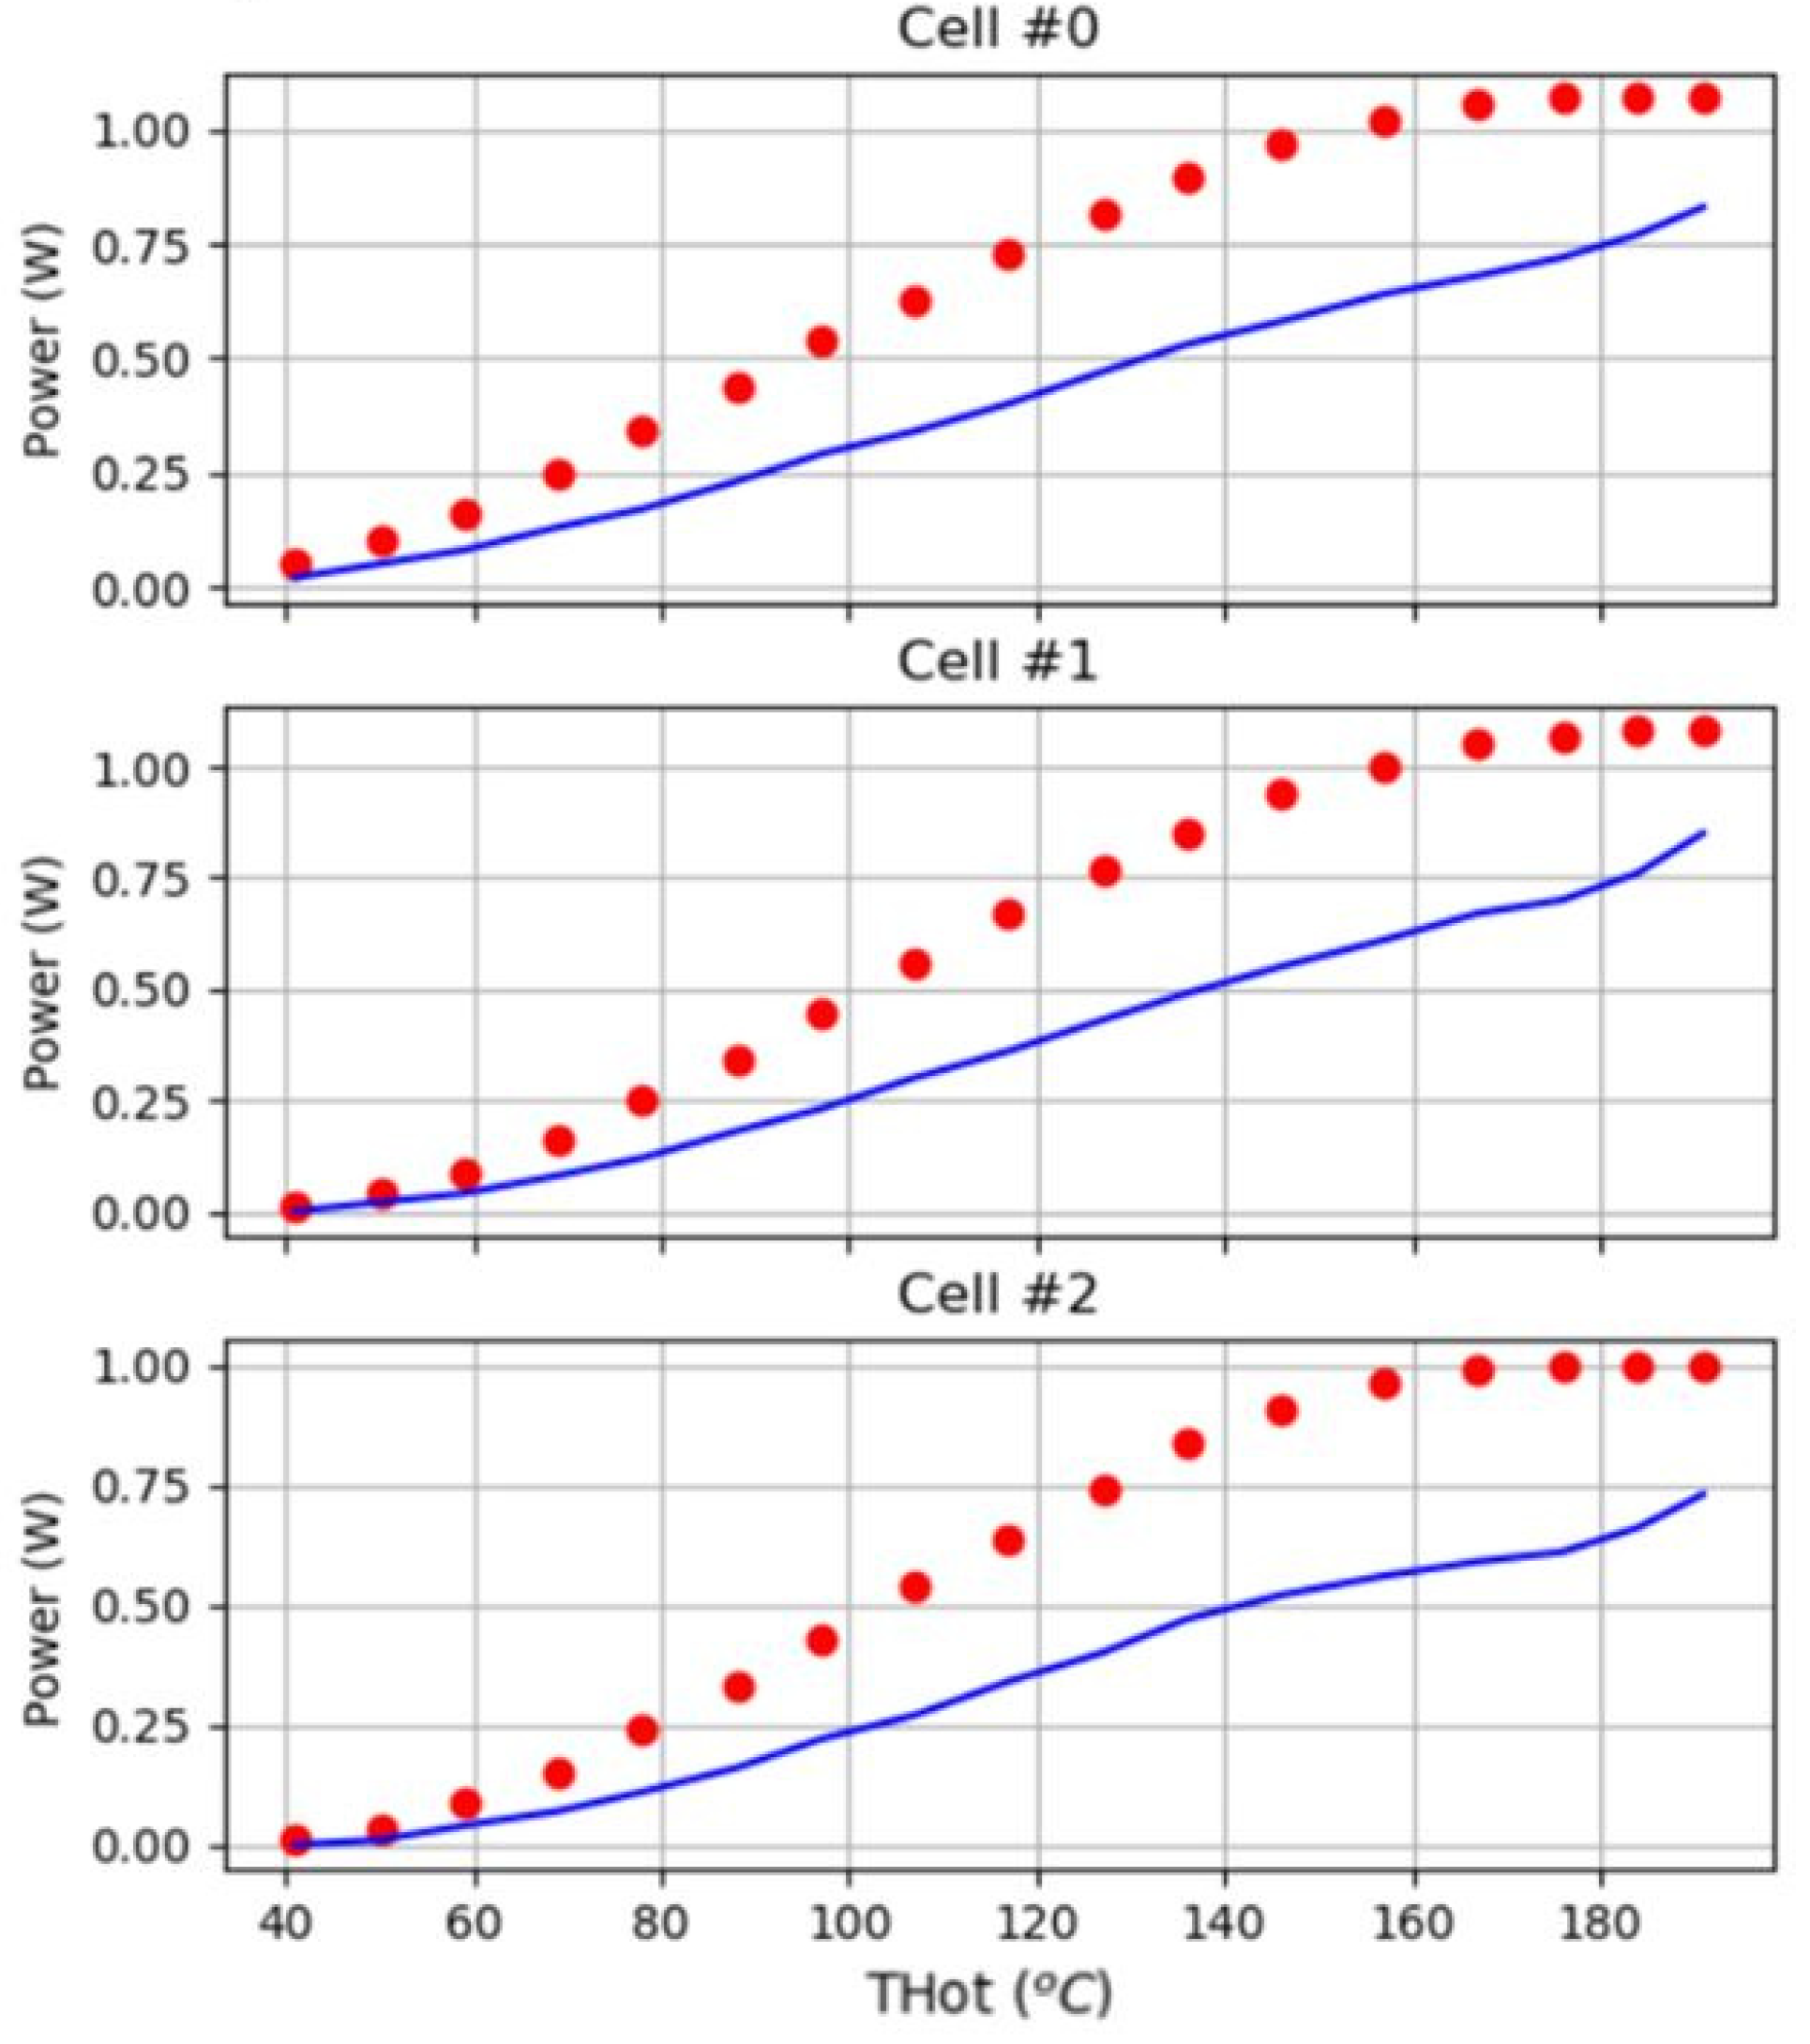
8.1. TEG Module Experiments
8.2. Experimental Data Analysis
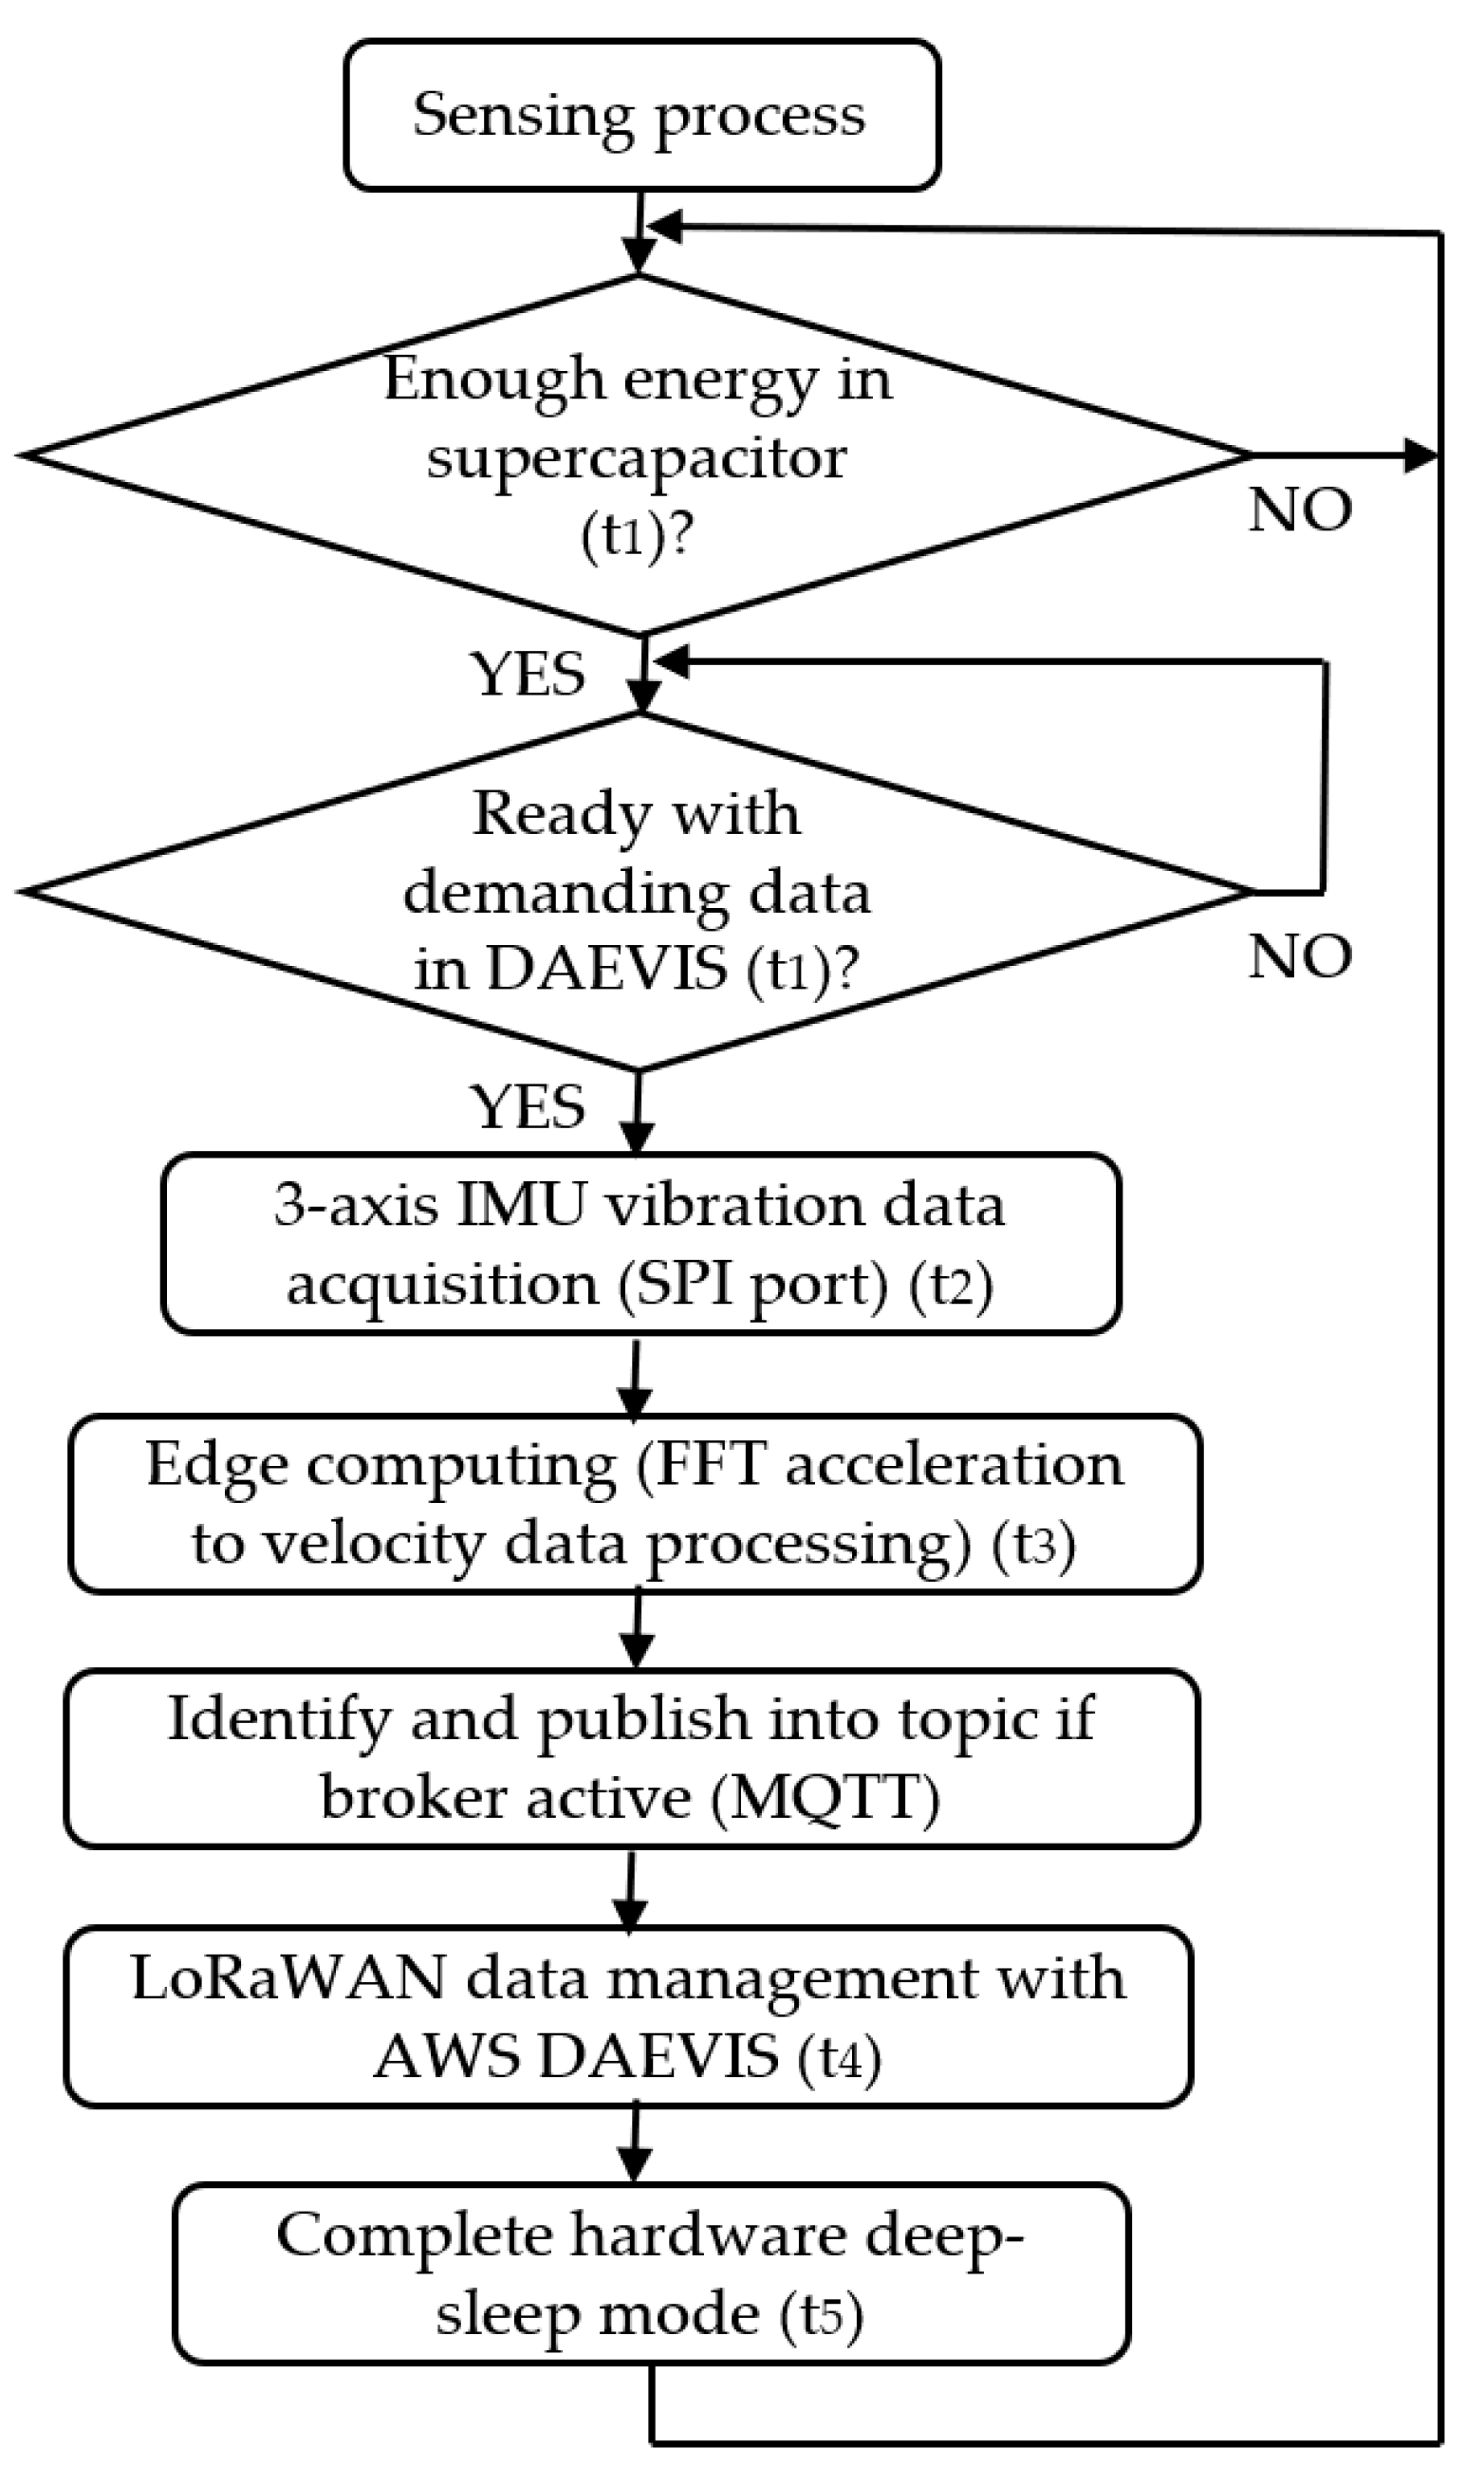
8.3. IoT Module in the Facility
- The low-power cortex M4 processor (STM32L4) as the processing device.
- The Microchip LoRaWAN chipset (RN2483).
- IMU ST-Microelectronics (ISM330DLC) for the vibration monitoring.
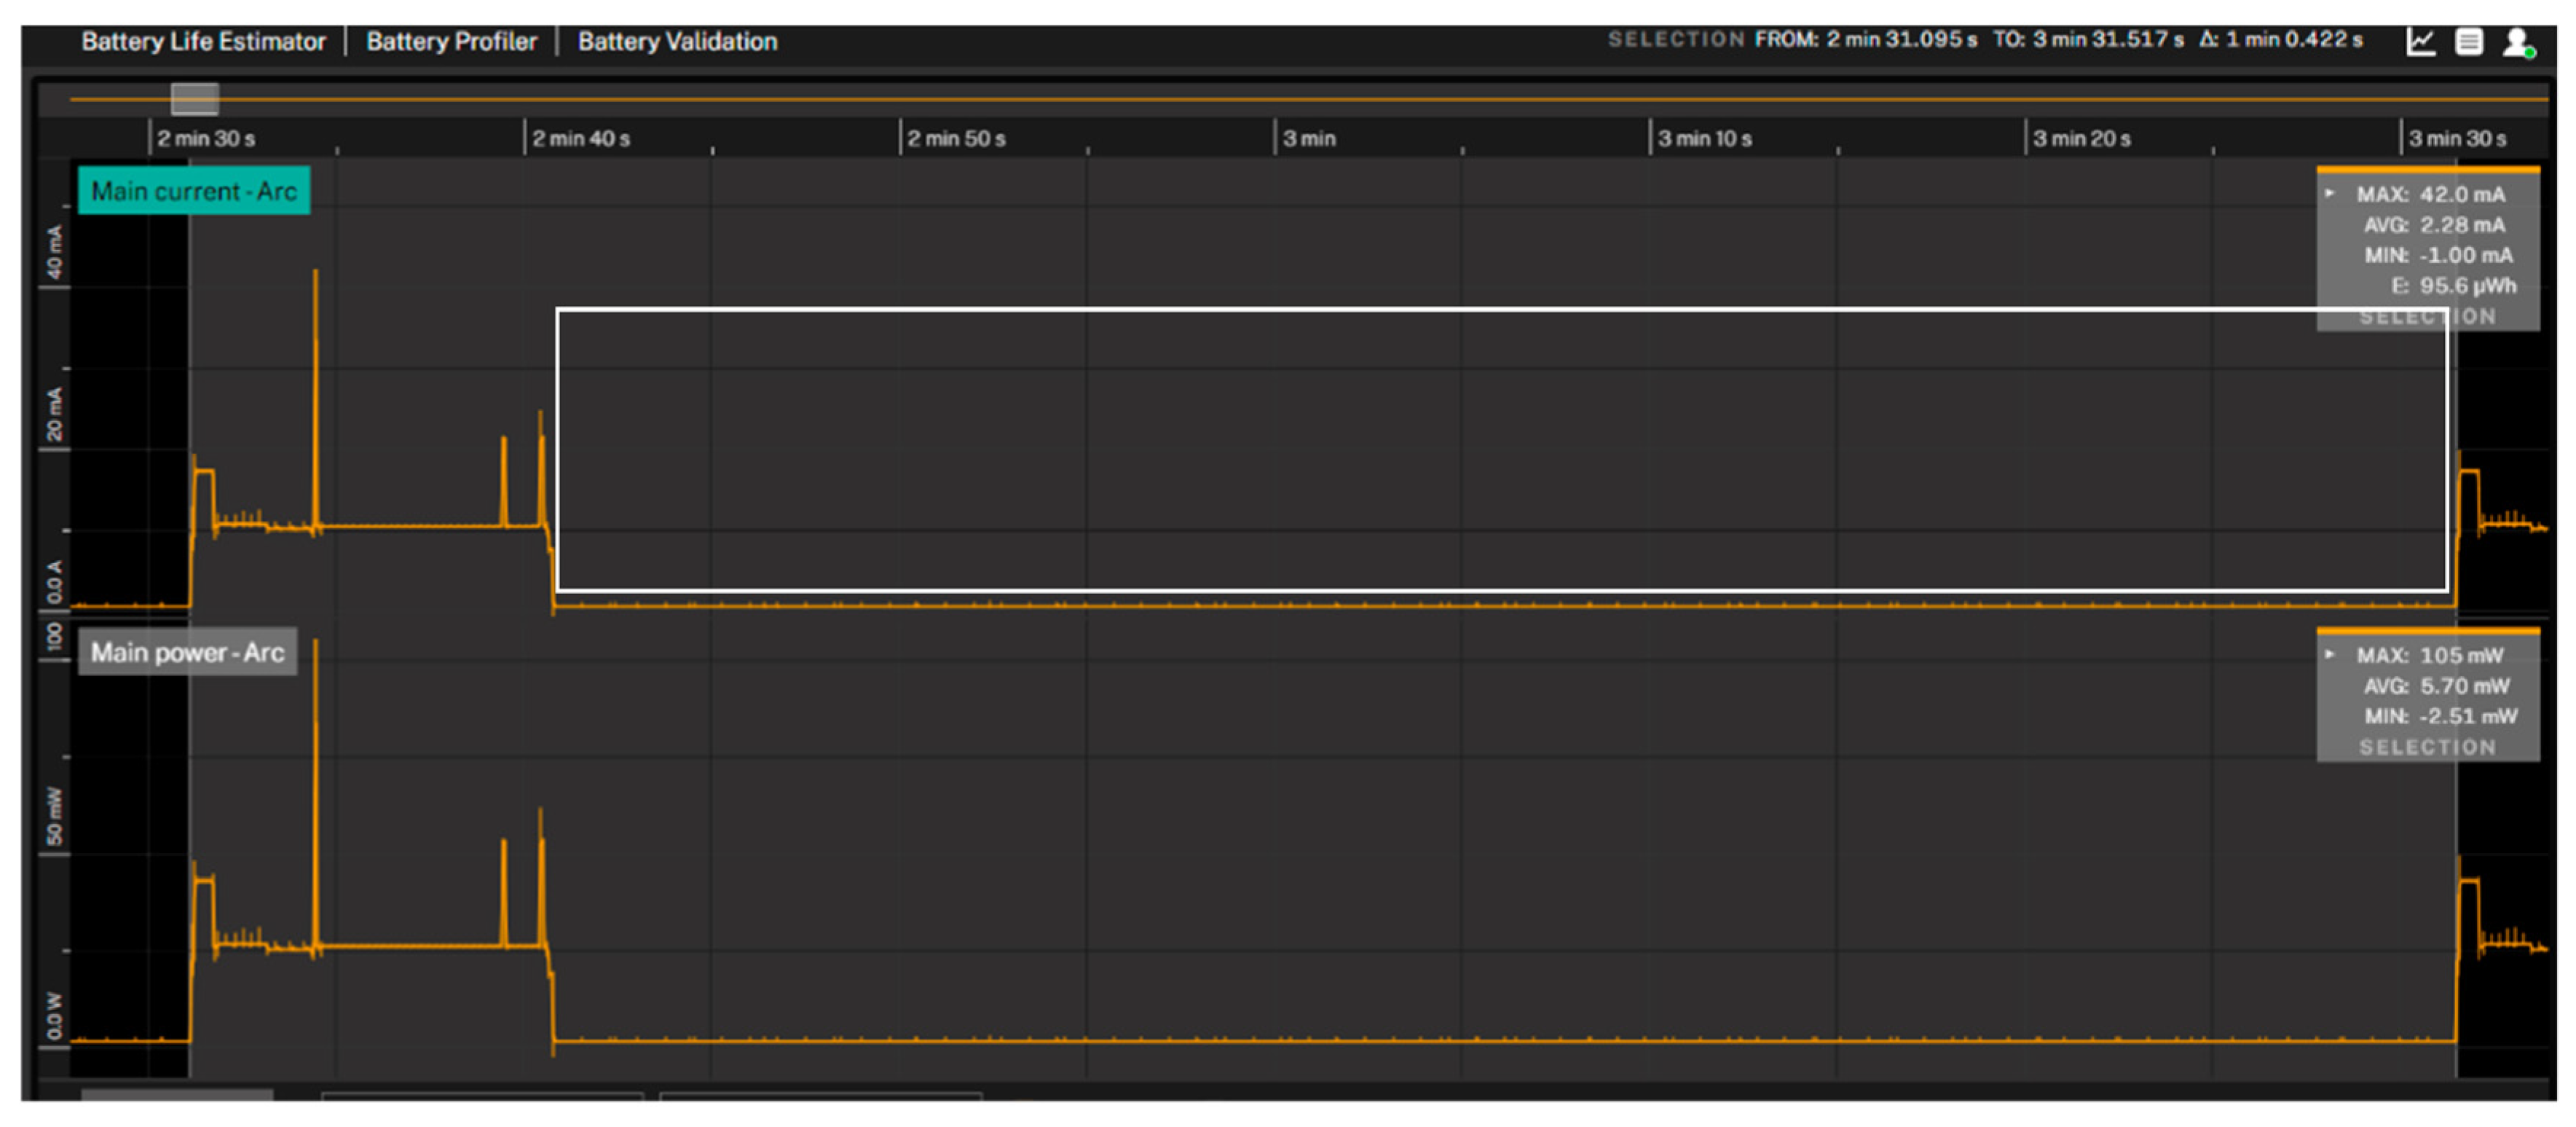
- The total duration of the process is 9.66 s.
- The overall consumption of a cycle containing acquisition, processing and communication is only 74.6 µWh.
- The maximum power peak of 105 mw (a peak of 42 mA in current) occurs when the chipset links with the gateway.
- The acquisition process cycle repeats every 60.422 s.
- The overall consumption (T1–T5) is 95.6 uWh.
- The deep sleep mode of the system is only 1.47 mW.
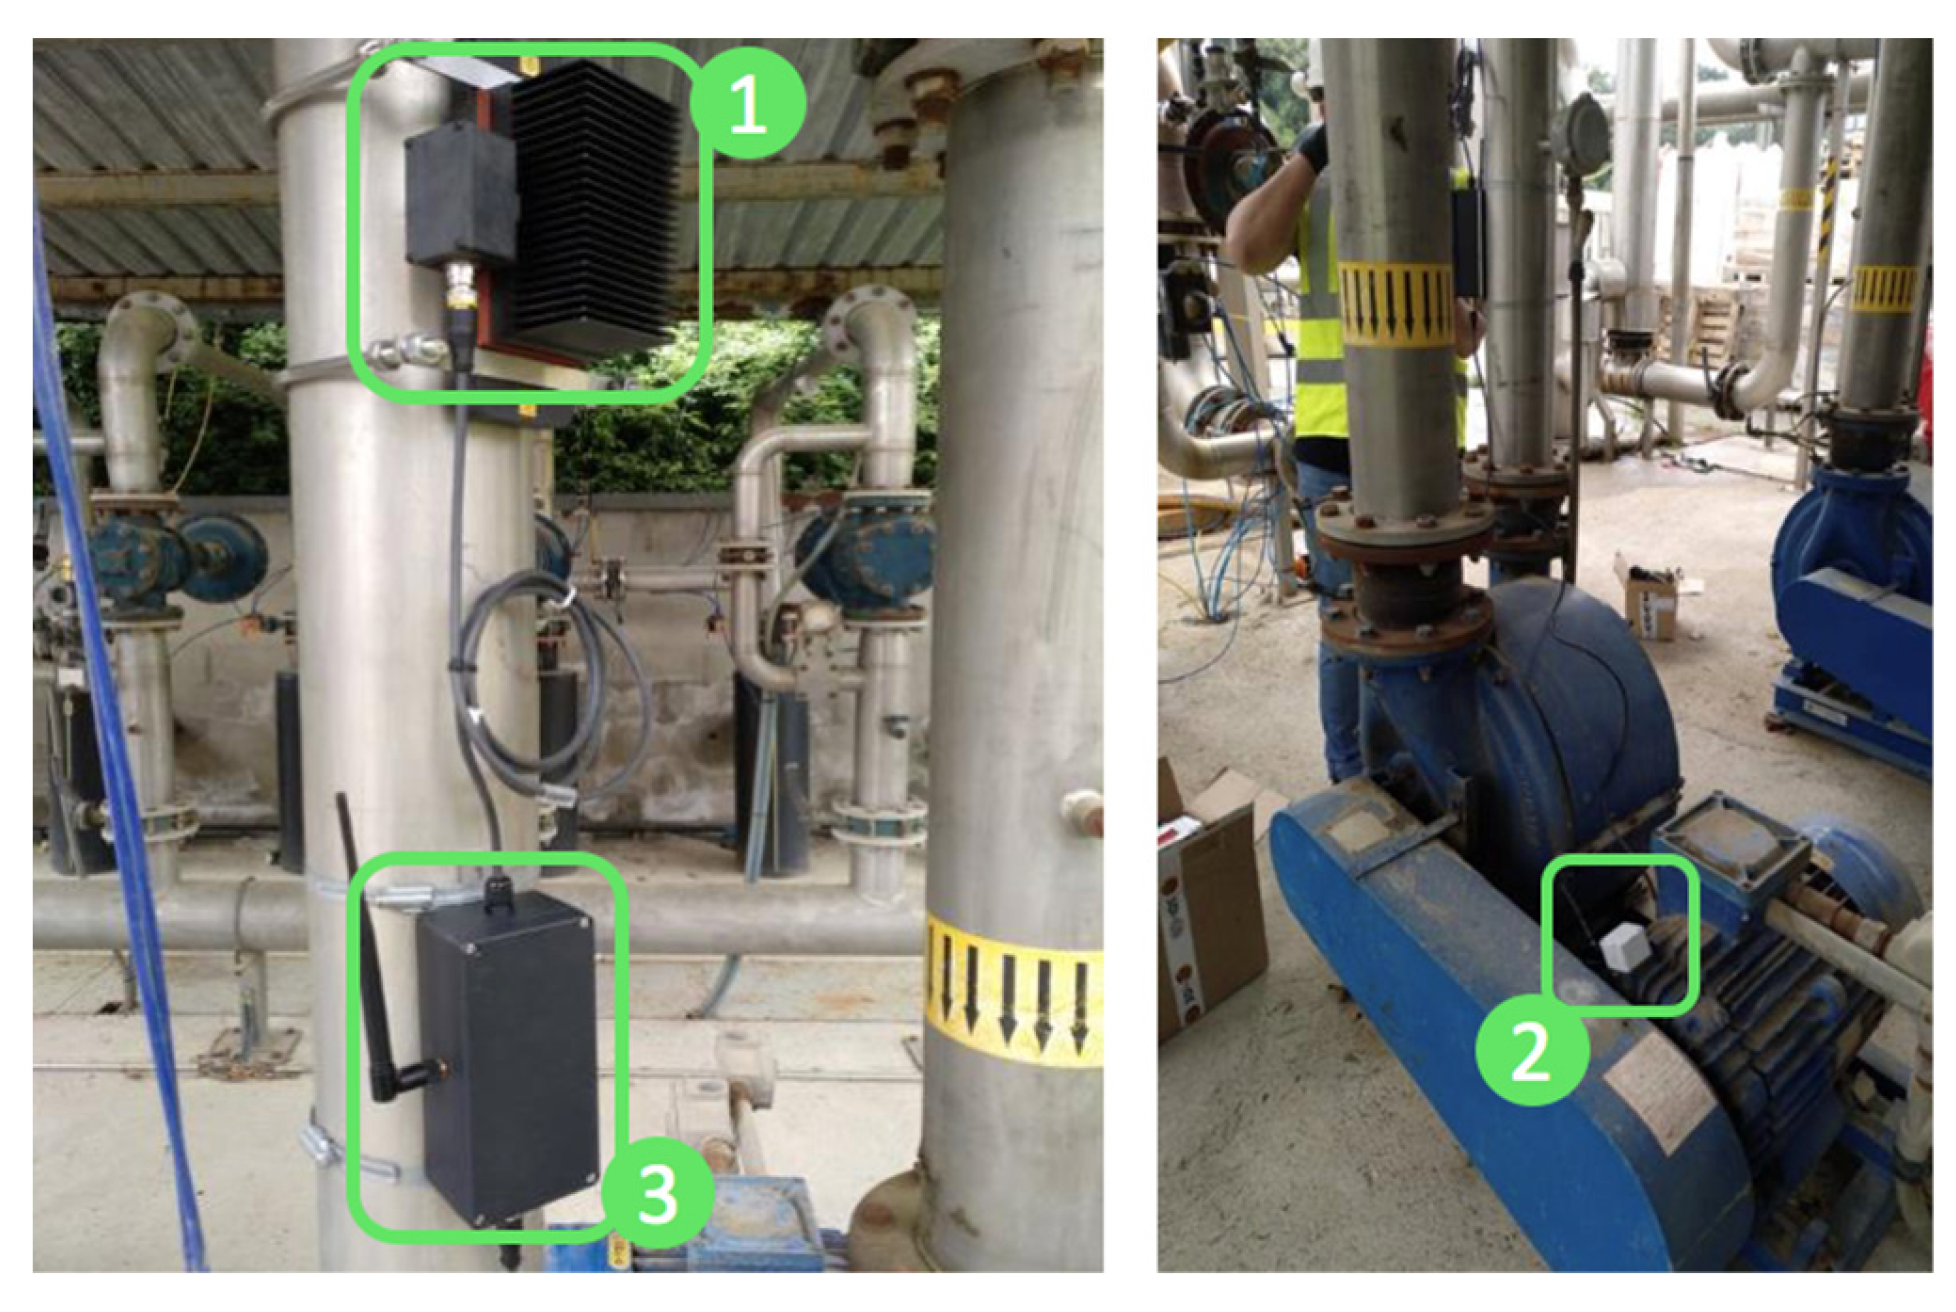
8.4. Hardware Integration in a Real Pilot
- Healthy machine: from 0 mm/s to 1.4 mm/s.
- Short-term operation allowable: from 1.4 mm/s to 4.5 mm/s.
- Vibrations cause machine damage: from 4.5 mm/s to unlimited.
9. Conclusions
Author Contributions
Funding
Data Availability Statement
Acknowledgments
Conflicts of Interest
References
- Kweku, D.W.; Bismark, O.; Maxwell, A.; Desmond, K.A.; Danso, K.B.; Oti-Mensah, E.A.; Quachie, A.T.; Adormaa, B.B. Greenhouse effect: Greenhouse gases and their impact on global warming. J. Sci. Res. Rep. JSRR 2018, 17, 39630. [Google Scholar] [CrossRef]
- Bianchi, G.; Panayiotou, G.P.; Aresti, L.; Kalogirou, S.A.; Florides, G.A.; Tsamos, K.; Tassou, S.A.; Christodoulides, P. Estimating the waste heat recovery in the European Union industry. Energy Ecol. Environ. 2019, 4, 211–221. [Google Scholar] [CrossRef]
- Elahi, H.; Munir, K.; Eugeni, M.; Atek, S.; Gaudenzi, P. Energy harvesting towards self-powered IoT devices. Energies 2020, 13, 5528. [Google Scholar] [CrossRef]
- Junior, O.H.A.; Maran, A.L.O.; Henao, N.C. A review of the development and applications of thermoelectric microgenerators for energy harvesting. Renew. Sustain. Energy Rev. 2018, 91, 376–393. [Google Scholar] [CrossRef]
- Jouhara, H.; Khordehgah, N.; Almahmoud, S.; Delpech, B.; Chauhan, A.; Tassou, S.A. Waste heat recovery technologies and applications. Therm. Sci. Eng. Prog. 2018, 6, 268–289. [Google Scholar] [CrossRef]
- Rodríguez, A.; Vián, J.G.; Astrain, D.; Martínez, A. Study of thermoelectric systems applied to electric power generation. Energy Convers. Manag. 2009, 50, 1236–1243. [Google Scholar] [CrossRef]
- Patidar, S. Applications of thermoelectric energy: A review. Int. J. Res. Appl. Sci. Eng. Technol. (IJRASET) 2018, 6, 1992–1996. [Google Scholar] [CrossRef]
- Agathokleous, R.; Bianchi, G.; Panayiotou, G.; Aresti, L.; Argyrou, M.C.; Georgiou, G.S.; Tassou, S.A.; Jouhara, H.; Kalogirou, S.A.; Florides, G.A.; et al. Waste heat recovery in the EU industry and proposed new technologies. Energy Procedia 2019, 161, 489–496. [Google Scholar] [CrossRef]
- Biswas, K. Advances in Thermoelectric Materials and Devices for Energy Harnessing and Utilization. J. Indian Natl. Sci. Acad. 2015, 81, 903–913. [Google Scholar] [CrossRef]
- Gayner, C.; Kar, K.K. Recent advances in thermoelectric materials. Prog. Mater. Sci. 2016, 83, 330–382. [Google Scholar] [CrossRef]
- Radouane, N. Thermoelectric generators and their applications: Progress, challenges, and future prospects. Chin. Phys. B 2023, 32, 057307. [Google Scholar] [CrossRef]
- Sanin-Villa, D. Recent Developments in Thermoelectric Generation: A Review. Sustainability 2022, 14, 16821. [Google Scholar] [CrossRef]
- Pourkiaei, S.M.; Ahmadi, M.H.; Sadeghzadeh, M.; Moosavi, S.; Pourfayaz, F.; Chen, L.; Yazdi, M.A.P.; Kumar, R. Thermoelectric cooler and thermoelectric generator devices: A review of present and potential applications, modeling and materials. Energy 2019, 186, 115849. [Google Scholar] [CrossRef]
- Sztekler, K.; Wojciechowski, K.; Komorowski, M. The thermoelectric generators use for waste heat utilization from conventional power plant. E3S Web Conf. 2017, 14, 01032. [Google Scholar] [CrossRef]
- Oliver, J.; Malet, R.; Aragonés, R.; Voces, R.; Ferrer, C. Waste heat recovery unit for energy intensive industries Thermoelectricity Harvesting. In Proceedings of the IEEE 29th International Symposium on Industrial Electronics (ISIE), Delft, The Netherlands, 17–19 June 2020; pp. 1041–1046. [Google Scholar]
- Sok, R.; Kusaka, J. Development and validation of thermal performances in a novel thermoelectric generator model for automotive waste heat recovery systems. Int. J. Heat Mass Transf. 2023, 202, 123718. [Google Scholar] [CrossRef]
- Doraghi, Q.; Gora, A.Z.; Voto, G.; Krause, B.; Pötschke, P.; Ezpeleta, I.; Mateo-Mateo, C.; Jouhara, H. Experimental and computational thermoelectric generator for waste heat recovery for aeronautic application. Energy 2024, 297, 131286. [Google Scholar] [CrossRef]
- Sanislav, T.; Mois, G.D.; Zeadally, S.; Folea, S.C. Energy harvesting techniques for internet of things (IoT). IEEE Access 2021, 9, 39530–39549. [Google Scholar] [CrossRef]
- Zeadally, S.; Shaikh, F.K.; Talpur, A.; Sheng, Q.Z. Design architectures for energy harvesting in the Internet of Things. Renew. Sustain. Energy Rev. 2020, 128, 109901. [Google Scholar] [CrossRef]
- Markiewicz, M.; Dziurdzia, P.; Skotnicki, T. Randomly moving thermoelectric energy harvester for wearables and industrial Internet of Things. Nano Energy 2024, 126, 109565. [Google Scholar] [CrossRef]
- EMERSON. Power Module Life Estimator. Available online: https://tools.measurementinstrumentation.com/pervasive-sensing/power-module-life-estimator/products/12/instrument-type/21/result/ (accessed on 16 April 2024).
- Elarusi, A.H.; Fagehi, H.; Lee, H.; Attar, A. Theoretical Approach to predict the performance of thermoelectric generator modules. J. Electron. Mater. 2017, 46, 872–881. [Google Scholar] [CrossRef]
- Aranguren, P.; Araiz, M.; Astrain, D.; Martinez, A. Thermoelectric generators for waste heat harvesting: A computational and experimental approach. Energy Convers. Manag. 2017, 148, 680–691. [Google Scholar] [CrossRef]
- Weera, S.L.L. Analytical Performance Evaluation of Thermoelectric Modules Using Effective Material Properties. Master’s Thesis, Western Michigan University, Kalamazoo, MI, USA, 2014. [Google Scholar]
- Alaoui, C. Peltier thermoelectric modules modeling and evaluation. Int. J. Eng. (IJE) 2011, 5, 114–121. [Google Scholar]
- Yovanovich, M.M.; Culham, J.R.; Teertstra, P. Calculating interface resistance. Electron. Cool. 1997, 3, 24–29. [Google Scholar]
- Lee, H. Thermal Design: Heat Sinks, Thermoelectrics, Heat Pipes, Compact Heat Exchangers, and Solar Cells; John Wiley & Sons, Inc.: Hoboken, NJ, USA, 2011. [Google Scholar]
- Feng, W.; Qi, B.; Wang, Y.; Liu, H. High power DC-DC converter for renewable energy power system. In Proceedings of the IEEE Transportation Electrification Conference and Expo (ITEC Asia-Pacific), Beijing, China, 31 August–September 2014; pp. 1–4. [Google Scholar]
- Aragonés, R.; Malet, R.; Ferrer, C.; Oliver, J. A Thermoelectric Power Generator System. U.S. Patent 20180138701A1, 24 March 2020. [Google Scholar]
- Nab, S. Developement and Application of a computational model for thermoelectric generation out of waste heat. In Internship Report; Technische Universiteit Eindhoven: Eindhoven, The Netherlands, 2017. [Google Scholar]
- Luo, D.; Wang, R.; Yu, W. Comparison and parametric study of two theoretical approaches based on an air-to-water thermoelectric generator system. J. Power Sources 2019, 439, 226079. [Google Scholar] [CrossRef]
- Martínez, A.; Astrain, D.; Rodríguez, A. Dynamic model for simulation of thermoelectric self-cooling applications. Energy 2013, 55, 1114–1126. [Google Scholar] [CrossRef]
- DIN ISO 10816; Why ISO 10816 Is Important for Vibration Measurement Engineers. Available online: https://www.vibsens.com/index.php/en/knowledge-base/iso10816-iso7919-charts/iso10816-charts (accessed on 16 April 2024).
- European Commission. Ensuring That Batteries Placed on the EU Market Are Sustainable and Circular throughout Their Whole Life Cycle. Available online: https://environment.ec.europa.eu/topics/waste-and-recycling/batteries_en (accessed on 16 April 2024).


| Units | Air (*) | Copper | Al6063-T5 | Alumina 96%, Al2O3 | Graphite | Mica | |
|---|---|---|---|---|---|---|---|
| Density | ρ, (Kg/m3) | 1.1839 | 8900 | 2700 | 3750 | 1800 | 1000 |
| Thermal conductivity | K, (W/(mK)) | 0.0261 | 385 | 209 | 20 | 5 | 0.3 |
| Specific heat | Cp, (J/(kgK)) | 1004.3 | 385 | 896 | 900 | 895 | 900 |
| Micro-hardness (**) | μH, (MPa) | 1500 | 670 | 14,700 | 100 | 50 | |
| Surface roughness (**) | sR, (μm) | 2.6 | 1.8 | 1.0 | 2.0 | 5.0 |
| Seebeck effect: | |
| Peltier effect: | |
| Thomson effect: | |
| Joule effect: | |
| Efficiency coefficient: | |
| Figure of merit: |
| Thermoelectric Parameters | ||
| Number of pellets, n | 199 | |
| Maximum power (Th = 200 °C), Wmax | 5.3 | W |
| Max. voltage (no load), Vmax | 11.2 | V |
| Max. current, Imax | 1.88 | A |
| Max. efficiency, ηmax | 5.6 | % |
| Matched load resistance (200 °C), RL | 5.9 | Ω |
| Effective Parameters | ||
| Effective Seebeck coefficient, α* | 3.33 × 10⁻⁴ | V/K |
| Effective thermal conductivity, κ* | 1.94 | W/(m·K) |
| Effective resistivity, ρ* | 3.8 × 10⁻⁵ | Ω·m |
| Figure of merit Z* | 1.6 × 10⁻³ | 1/K |
| Figure of merit ZT* | 0.48 | |
| Simulation Setup Parameters | |
|---|---|
| Rload | =10.0 Ω |
| Torque | =0.7 N/m |
| Force | =875,000 Pa |
| Screw diameter | =5 mm ∅ |
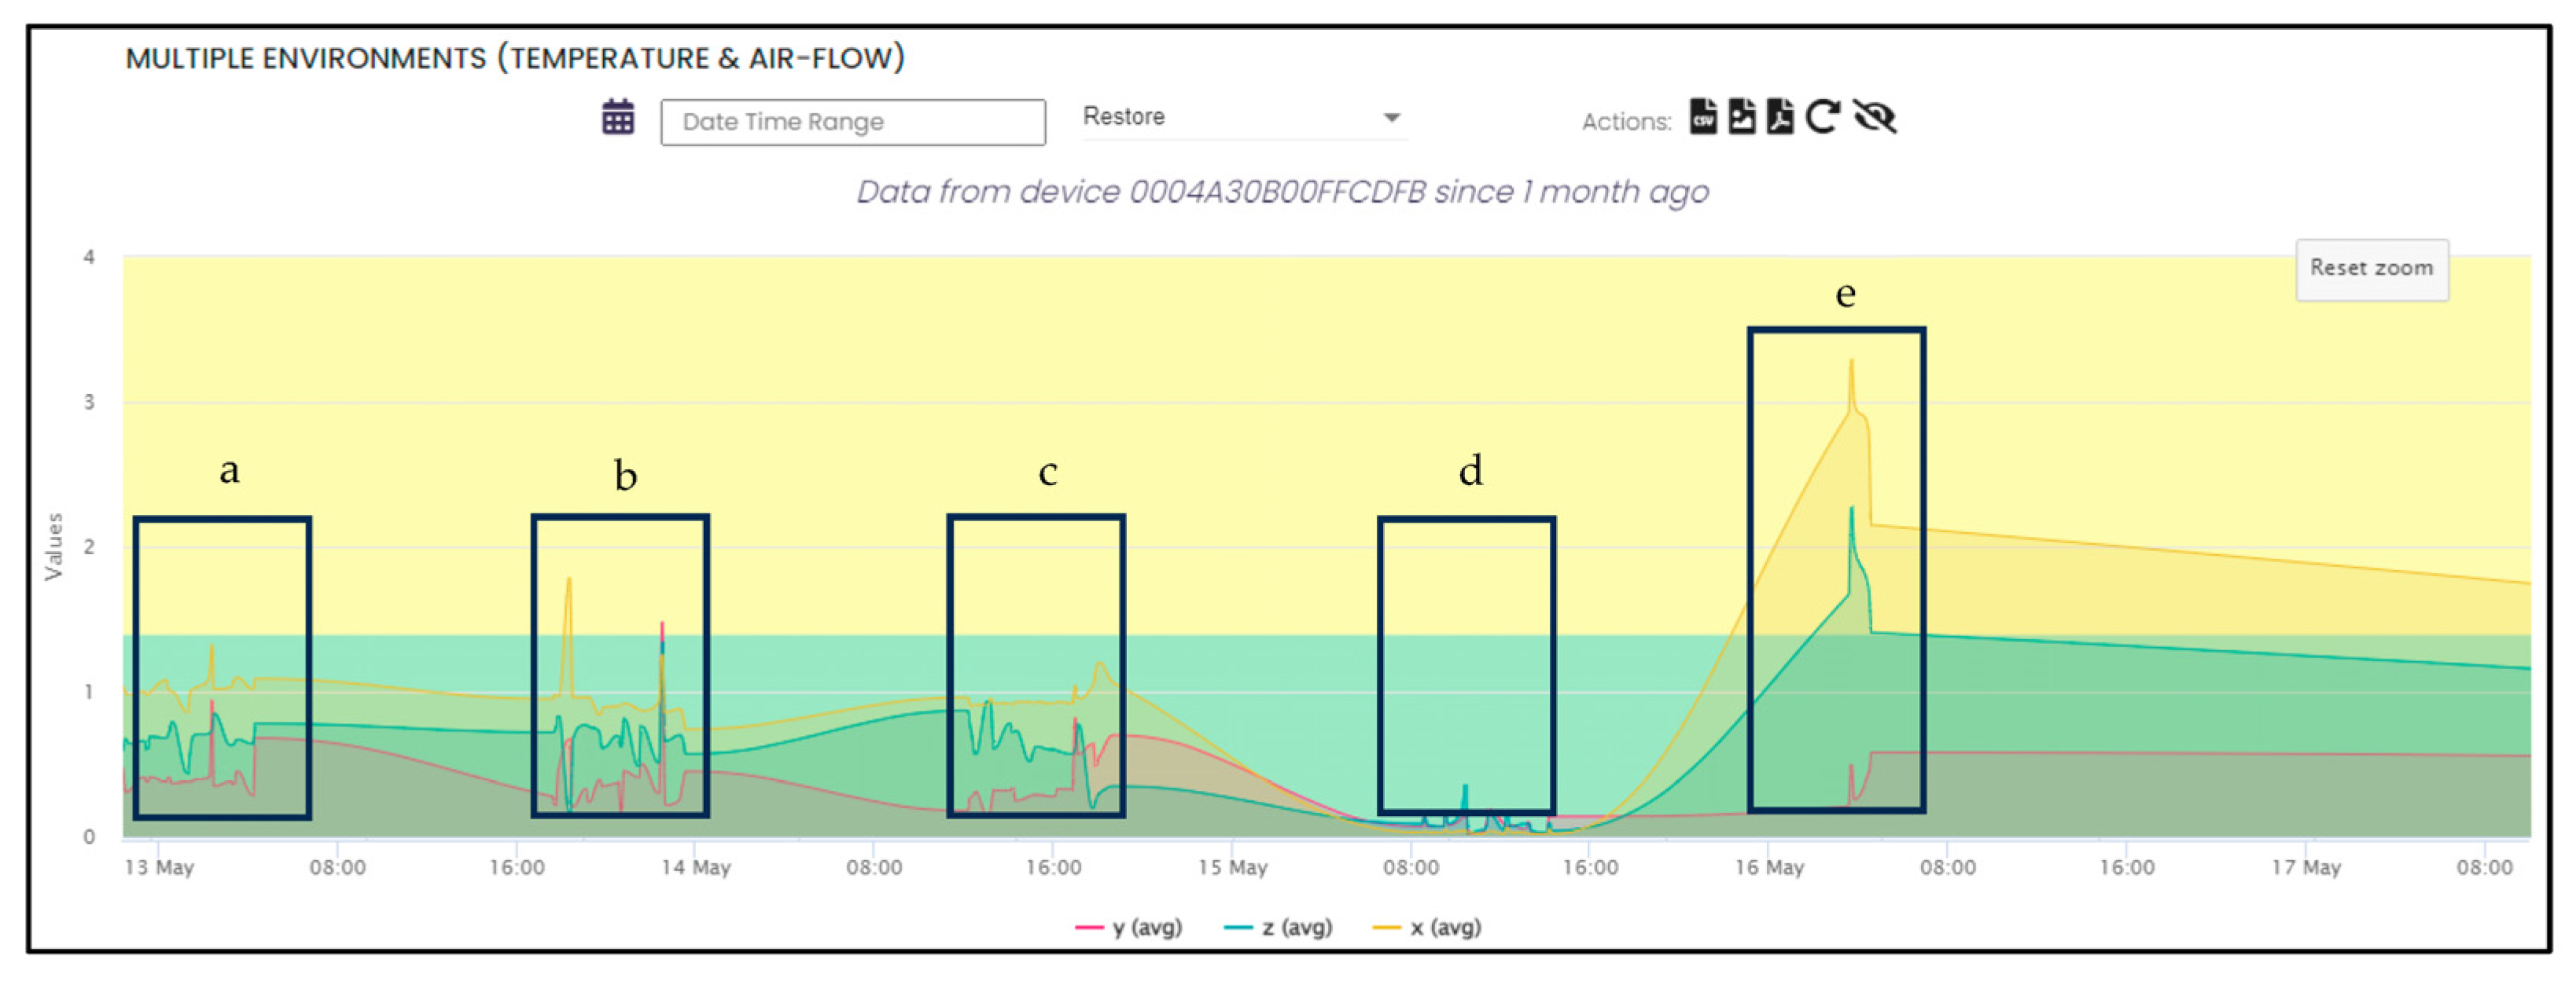
| Case | ΔT | Air Flow | Data Cadence | Motor Type. |
|---|---|---|---|---|
| A | 125 °C | 0 m/s | 5 | 350 W with small misalignment. |
| B | 100 °C | 0 m/s | 7 | 350 W with small misalignment. |
| C | 75 °C | 5 m/s | 10 | 350 W with small misalignment. |
| D | 50 °C | 10 m/s | 10 | 350 W without misalignment. |
| E | 25 °C | 0 m/s | 30 | 350 W with big misalignment. |
| Industrial Sector | Section of the Process | Temperature Range °C |
|---|---|---|
| Iron and steel production Ferrous metals processing | Basic oxygen steelmaking | 200 |
| Re-heating and heat treatment furnaces radiation | 240 | |
| Cement industry | Steam and gas exhausts | 130–220 |
| Co-generation/combined heat and power | 100 | |
| Chemical and petrochemical Large volume inorganic chemicals solid industry | Sulphur burning processes | 145 |
| Chemical and petrochemical Large volume inorganic chemicals, ammonia, acids and fertilizers | Conventional steam reforming: desulphurization processes | 350–400 |
| Conventional steam reforming: primary and secondary reforming | Primary: 400–600 Secondary: 400–600 Exhaust gas: 1000 | |
| Chemical and petrochemical Surface treatment using organic solvents | Drying and curing | 300–700 |
| Manufacturing of abrasives | 35–110 in the drier 700 for the exhaust air | |
| Coil coating | 150–220 | |
| Food and tobacco Food, drink and milk industry | Heat recovery from cooling systems | 50–60 |
| Winery exhausts | 200–240 | |
| Alcohol distillation exhausts | 130–220 | |
| Wood Wood-based panel production | Drying of wood particles | 60–220 |
| Pressing | 100–300 | |
| Paper and printing Paper and board production | Paper making and related processes | 150–300 (exhausts) >350 (Coated wood-free printing tissue processes |
| Textile and leather Textiles industry | Tanning and hide drying | 60–90 |
| Drying | 130 | |
| Non-specific industry Waste treatment | Drying and degassing | 100–300 |
| Drying | 100 | |
| Dying of wood particles | 200–370 for single/triple pass dryers 500 at rotary dryers |
Disclaimer/Publisher’s Note: The statements, opinions and data contained in all publications are solely those of the individual author(s) and contributor(s) and not of MDPI and/or the editor(s). MDPI and/or the editor(s) disclaim responsibility for any injury to people or property resulting from any ideas, methods, instructions or products referred to in the content. |
© 2024 by the authors. Licensee MDPI, Basel, Switzerland. This article is an open access article distributed under the terms and conditions of the Creative Commons Attribution (CC BY) license (https://creativecommons.org/licenses/by/4.0/).
Share and Cite
Aragonés, R.; Oliver, J.; Malet, R.; Oliver-Parera, M.; Ferrer, C. Model and Implementation of a Novel Heat-Powered Battery-Less IIoT Architecture for Predictive Industrial Maintenance. Information 2024, 15, 330. https://doi.org/10.3390/info15060330
Aragonés R, Oliver J, Malet R, Oliver-Parera M, Ferrer C. Model and Implementation of a Novel Heat-Powered Battery-Less IIoT Architecture for Predictive Industrial Maintenance. Information. 2024; 15(6):330. https://doi.org/10.3390/info15060330
Chicago/Turabian StyleAragonés, Raúl, Joan Oliver, Roger Malet, Maria Oliver-Parera, and Carles Ferrer. 2024. "Model and Implementation of a Novel Heat-Powered Battery-Less IIoT Architecture for Predictive Industrial Maintenance" Information 15, no. 6: 330. https://doi.org/10.3390/info15060330
APA StyleAragonés, R., Oliver, J., Malet, R., Oliver-Parera, M., & Ferrer, C. (2024). Model and Implementation of a Novel Heat-Powered Battery-Less IIoT Architecture for Predictive Industrial Maintenance. Information, 15(6), 330. https://doi.org/10.3390/info15060330