Article

Mining Spatial-Temporal Frequent Patterns of Natural Disasters in China Based on Textual Records

1
State Key Laboratory of Resources and Environmental Information System, Institute of Geographic Sciences and Natural Resources Research, Chinese Academy of Sciences, Beijing 100101, China
2
University of Chinese Academy of Sciences, Beijing 100049, China
3
School of Computer Science, Beijing Institute of Technology, Beijing 100081, China
4
Max-Planck-Institut für Radioastronomie, 53121 Bonn, Germany
*
Author to whom correspondence should be addressed.
Information 2024, 15(7), 372; https://doi.org/10.3390/info15070372
Submission received: 30 April 2024 / Revised: 5 June 2024 / Accepted: 24 June 2024 / Published: 27 June 2024

Abstract

:
Natural disasters pose serious threats to human survival. With global warming, disaster chains related to extreme weather are becoming more common, making it increasingly urgent to understand the relationships between different types of natural disasters. However, there remains a lack of research on the frequent spatial-temporal intervals between different disaster events. In this study, we utilize textual records of natural disaster events to mine frequent spatial-temporal patterns of disasters in China. We first transform the discrete spatial-temporal disaster events into a graph structure. Due to the limit of computing power, we reduce the number of edges in the graph based on domain expertise. We then apply the GraMi frequent subgraph mining algorithm to the spatial-temporal disaster event graph, and the results reveal frequent spatial-temporal intervals between disasters and reflect the spatial-temporal changing pattern of disaster interactions. For example, the pattern of sandstorms happening after gales is mainly concentrated within 50 km and rarely happens at farther spatial distances, and the most common temporal interval is 1 day. The statistical results of this study provide data support for further understanding disaster association patterns and offer decision-making references for disaster prevention efforts.

1. Introduction

Natural disasters pose serious threats to human survival. According to China Meteorological Administration’s “China Climate Bulletin”, the direct economic losses caused by natural disasters in China exceeded CNY 300 billion each year from 2019 to 2021 [1]. Many natural disaster events can potentially trigger a series of secondary disasters. Thus, studying the relationships between natural disasters helps to understand their patterns of occurrence, enabling people to take better measures to reduce the losses caused by disasters. AghaKouchak et al. [2] pointed out that with global warming, the prevalence of disaster chains related to extreme weather events will increase. Hence, understanding the relationships between natural disasters becomes particularly urgent.
To date, there have been many studies on the relationships between natural disasters. Some studies have summarized various disaster chains through manual analysis of historical disaster events in certain regions [3]. Manual summarization can yield reliable and comprehensive results of disaster relationships, but this method can hardly be generalized to larger spatial-temporal scopes and be used to obtain quantitative results. Hence, many studies have introduced methods from the field of data mining to conduct quantitative research based on more extensive data. Various data forms have been considered, including station monitoring data, statistical data, and textual data. Xu et al. [4] employed the Apriori algorithm to mine association rules between landslide rapid deformation processes and rainfall characteristics. Fu et al. [5], based on EM-DAT data, analyzed the typical characteristics and transmission processes of drought disaster chains in seven major regions worldwide using an index of triggering rates. Liu et al. [6] and Yang et al. [7] extracted type and spatial-temporal information of natural disaster events from news texts and then analyzed the spatial-temporal distributions and co-occurrence relationships of disasters using the FP-Growth association rule mining algorithms.
However, the existing studies focus on co-occurrence relationships or causal probabilities between disasters, neglecting the investigation of temporal and spatial intervals between different disaster events, which are crucial for disaster prevention. To fill this gap, this study utilizes frequent subgraph mining algorithms to uncover both the frequent sequences of disaster occurrences and frequent spatial-temporal intervals between disasters. We conducted the study based on extensive textual data and focused on the spatial-temporal relationships between 21 different types of natural disasters. The findings of this research can provide decision-making references for disaster prevention efforts and serve as a foundation for future studies on text-based causal analysis or prediction of disasters.
The structure of this paper is as follows: Section 2 provides a summary of the background knowledge and research progress in relationships between natural disasters and spatial-temporal frequent pattern mining. Section 3 introduces the research data and methods. Section 4 shows and analyzes the results. Section 5 discusses the innovations and limitations of this study and proposes future research directions. Finally, Section 6 lists the main conclusions of this study.

2. Literature Review

2.1. Research Status of Relationships between Natural Disasters

There are many types of relationships between natural hazard events. Liu et al. [8] classified them into four categories: independent relationship, mutex relationship, parallel relationship, and series relationship. Wang et al. [9] pointed out that no unified classification framework has been established to cover all the relationships between hazards, but they summarized that the mutually reinforcing relationships between disasters are human-induced hazards, disaster chain, cascading disaster, domino effect, and concurrent hazards/compound disasters.
Some studies have summarized various disaster relationships through manual analysis of historical disaster events in certain regions. Han et al. [10] summarized the disaster chains related to geological hazards in China based on a large number of cases and classified them according to the causative factors. Van Westen et al. [11] analyzed multiple hazards and their interrelationships in mountainous environments, including landslides, debris flows, collapses, avalanches, and floods. There are also studies focusing on some specific hazard events and analyzing the various hazard relationships reflected in the disaster process. Cui et al. [12] analyzed the typhoon–rainstorm–landslide–barrier lake–flooding natural disaster chain based on field surveys, satellite image interpretation, a digital elevation model (DEM), etc. Marengo et al. [13] analyzed the causes and specific processes of the rainstorm-triggered landslide and flash flooding events that occurred in May 2022 in the city of Recife, Northeast Brazil. Further, some studies quantitatively analyzed the disaster correlation mechanisms based on long time-series monitoring data. Papagiannaki [14] combined station monitoring data and disaster event data over more than a decade to study the relationship between flash flood events and rainfall in the Attica prefecture of Greece. Zhang et al. [15] used soil moisture data and daily maximum temperature data to study the compound disasters of heatwaves and flash droughts, and concluded that heatwaves increase the intensification rate of drought events by about 20%. In recent years, with the continuous development of various online media, some studies have found that online news text can be used as a source of disaster data, and accordingly analyzed the relationships between different disasters. Liu et al. [6] collected news text containing the keyword “natural disasters” from the China News Service website from 2008 to 2017, and analyzed the temporal and spatial distribution of natural disasters and the co-occurrence of disasters in different regions. Yang et al. [7] collected news texts containing the names of 15 natural disasters from the China News Network from 2008 to 2021, and analyzed the spatial-temporal distributions and co-occurrence relationships of disasters.
At present, studies on the disaster relationships based on text data have only analyzed the co-occurrence relationships, neglecting the spatial and temporal intervals between different disasters. In this paper, we combine ancient Chinese disaster record texts and modern internet disaster texts to study the temporal and spatial intervals between different disasters.

2.2. Research Status of Spatial-Temporal Frequent Pattern Mining
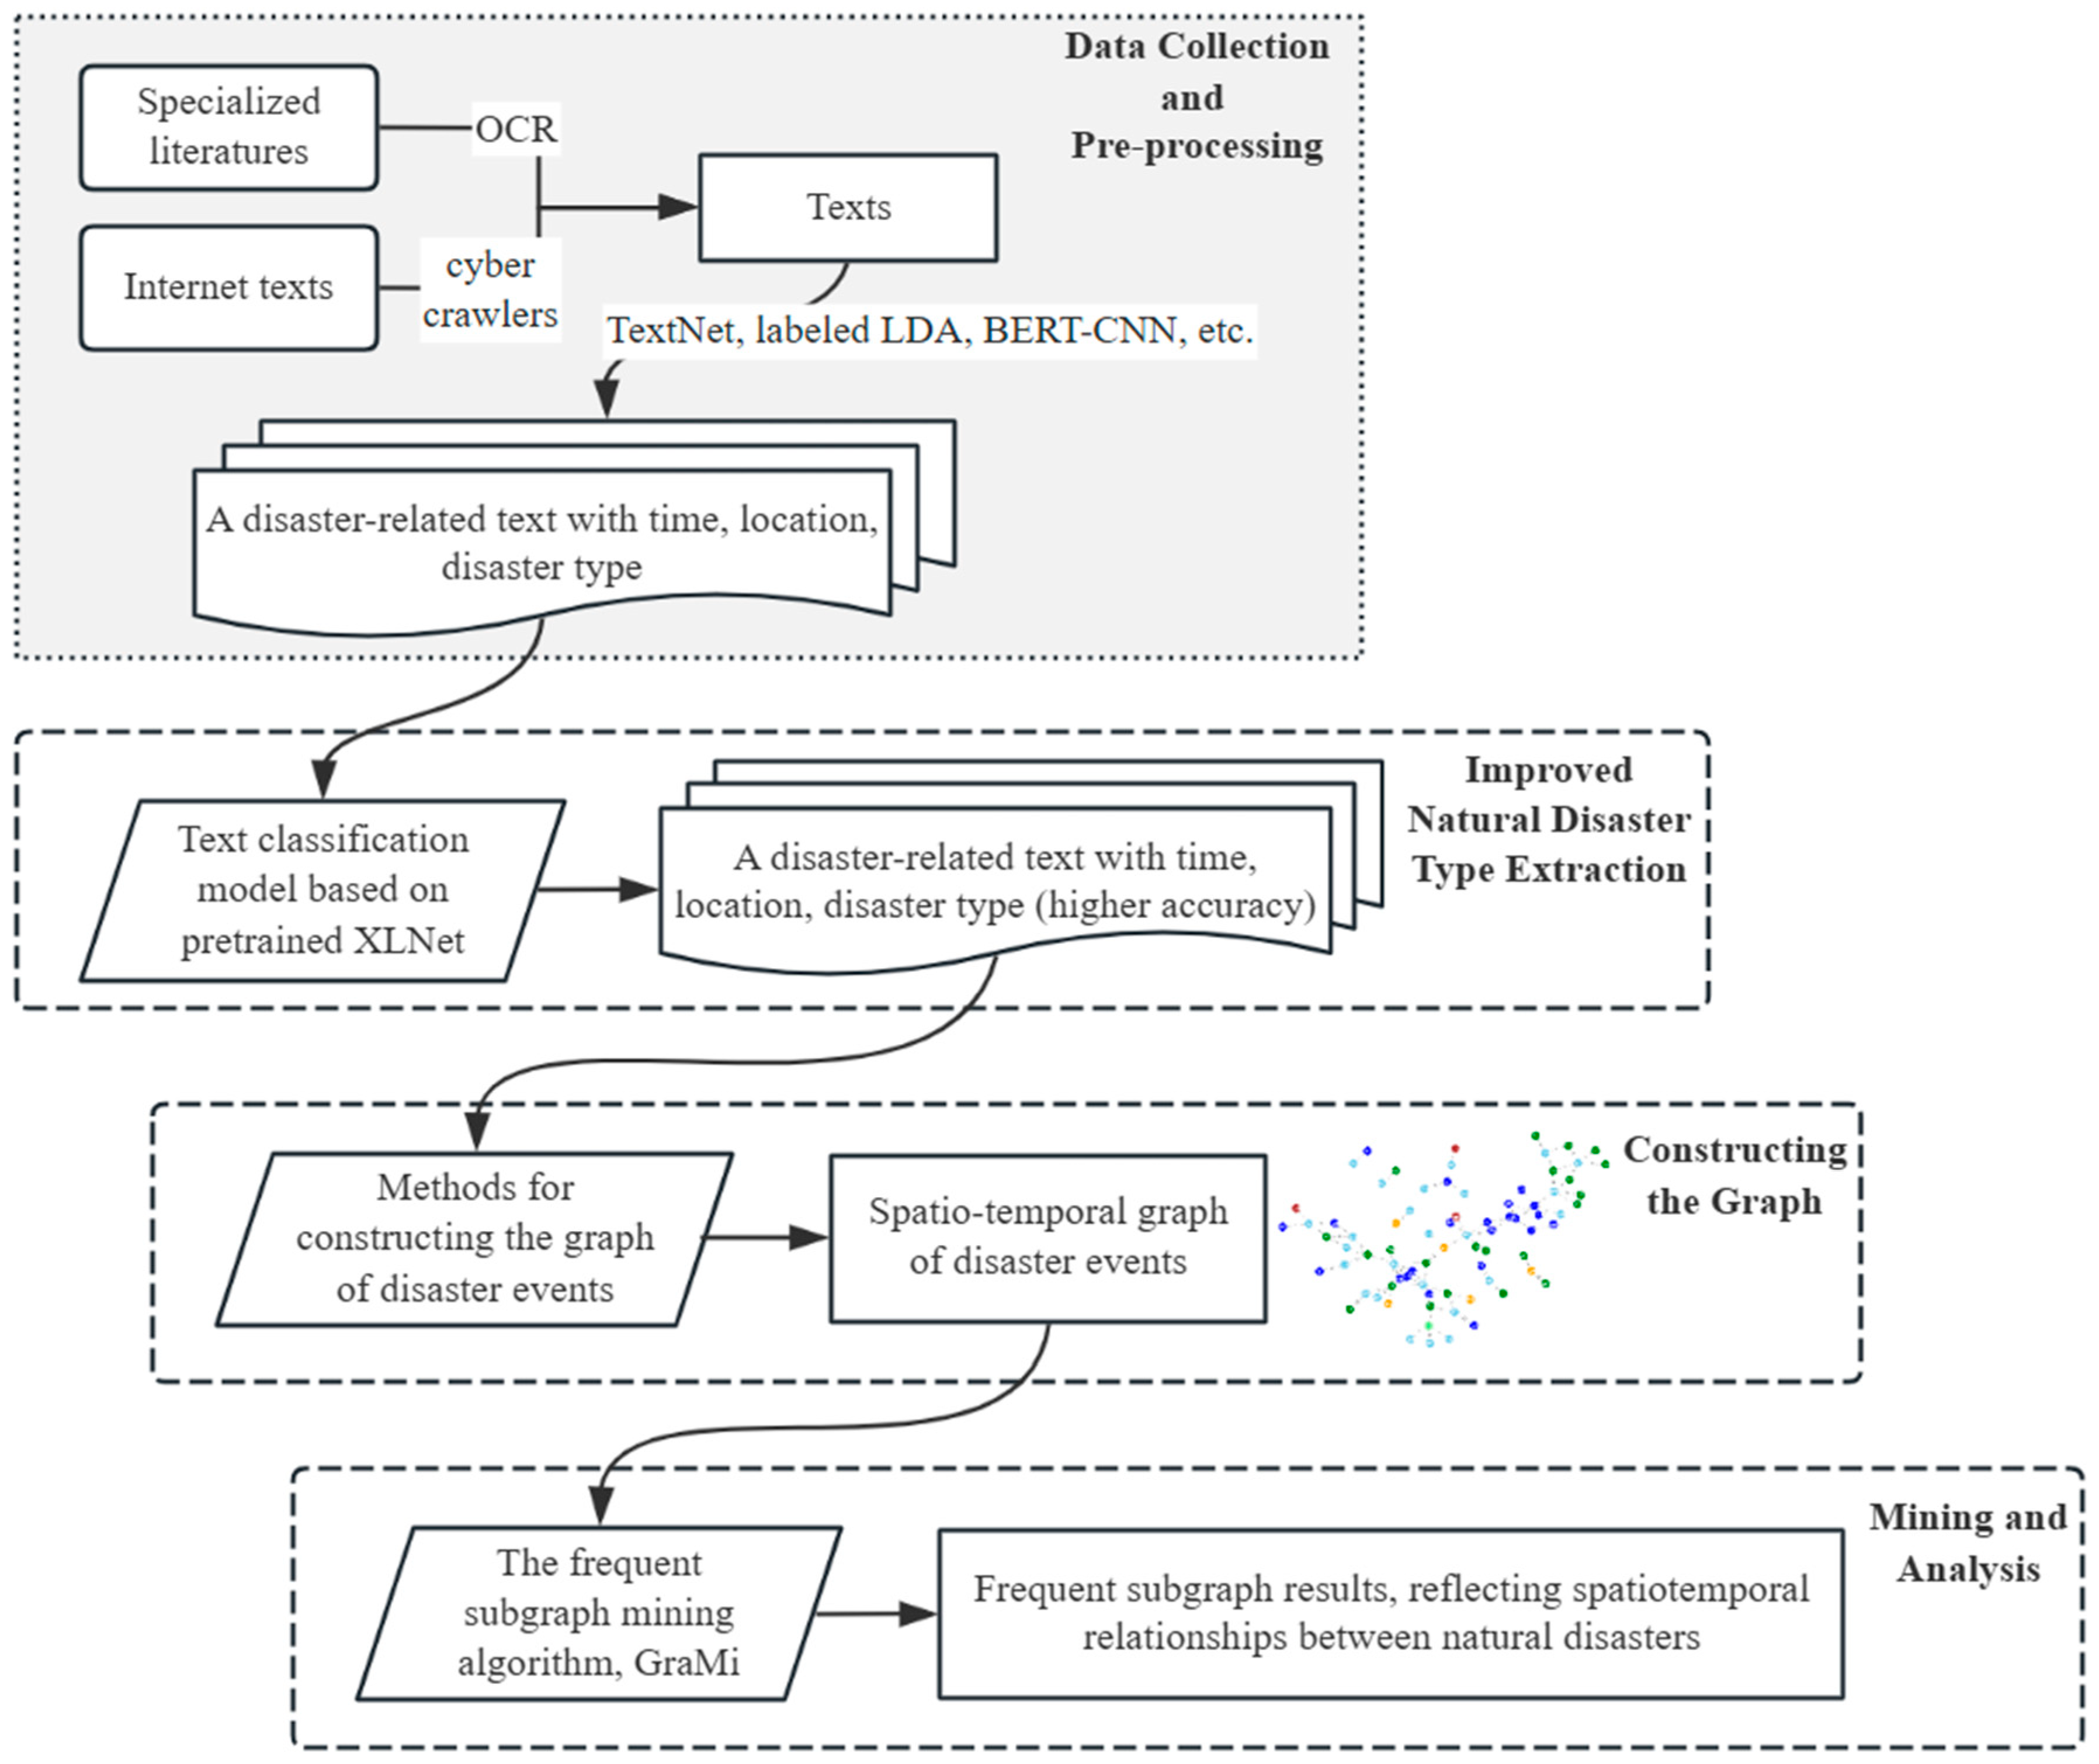
Frequent pattern mining is a fundamental technique in data mining and it aims to find patterns that occur frequently in a dataset, thus discovering interesting correlations in the dataset. The application of frequent pattern mining methods to data with both temporal and spatial attributes, aiming to discover the correlations in data across space and time, is referred to as spatial-temporal frequent pattern mining. Spatial-temporal frequent pattern mining can be classified into various types based on the data structure and tasks, including spatial-temporal co-occurrence pattern mining, spatial-temporal sequence pattern mining, and spatial-temporal network pattern mining.
To find spatial-temporal co-occurrence patterns, association rule mining algorithms are often applied. Association rule mining, also known as frequent itemset mining, is a basic technique of data mining, whose goal is to find the set of data items that occur together more than a preset threshold number of times in the data source, regardless of the order of occurrence of the data items [16]. A spatial-temporal co-occurrence pattern refers to the frequent temporal and spatial proximity of different objects. Many spatial-temporal co-occurrence pattern mining studies are based on the classical frequent itemset mining algorithms Apriori [17] and FP-Growth [18], introducing spatial-temporal co-occurrence metrics and processing data or modifying algorithms according to practical applications in order to accomplish association rule mining under spatial-temporal constraints [19,20,21,22]. This method is widely used in identifying traffic congestion [23], mining cab movement rules [24,25], discovering crime event dependency [26,27], and exploring solar astronomical data [28].
Spatial-temporal co-occurrence patterns can reflect the spatial and temporal proximity of different events, but cannot reveal the complex multi-branch interactions among multiple events in space and time. Some studies have indicated that using a graph-based approach to model spatial-temporal data can better analyze and mine patterns in spatial-temporal data [29,30,31]. Currently, researchers have utilized frequent subgraph mining for analyzing spatial-temporal data, addressing various issues such as air pollution propagation [32], ocean eddy transformation [33], travel trajectory mining [34,35], and remote sensing target analysis [36].
In this study, we applied existing frequent subgraph mining algorithms to the text-based spatial-temporal event database of disasters to perform spatial-temporal association mining. We aimed to obtain detailed spatial-temporal associations between different disaster events, including their spatial-temporal intervals.

3. Data and Methods

Figure 1 illustrates the flowchart of this study, and the three main parts are improved natural disaster type extraction, construction of the spatial-temporal graph, and subgraph mining and analysis, each of which is explained in the following subsections.

3.1. Data Source and Pre-Processing

The data of this study come from the textual database of disaster events constructed by Hu et al. [37]. The data sources of this database include the internet texts and specialized literature. The internet texts were collected from emergency management portals of various provinces and cities in China, as well as news microblog accounts of provincial, municipal, and county governments. The specialized literature includes two books: “Compendium of Chinese Meteorological Disasters” and “Comprehensive Collection of Chinese Meteorological Records Over Three Thousand Years”.
The original textual data from internet texts and specialized literature were obtained through cyber crawlers and an OCR technique, respectively. Then, TextNet [38] was applied to segment all the texts into different spatial-temporal scenes and to extract the temporal and spatial information from each text. Subsequently, a series of techniques, including Labeled LDA, TF-IDF, N-gram, and BERT-CNN, were utilized to identify the disaster types in each text, and the final precision of classification was around 80~89%.
After using the processes above, each piece of data in the database represents the disaster event extracted from a text, with information about the event’s occurrence time, location (transformed to the geographic coordinate of the center of the minimal administrative unit), and disaster type.

3.2. Natural Disaster Type Extraction

The precision of disaster classification of the original dataset was around 80~89%, which is not very high. To further enhance the precision of the natural disaster event type extraction, we developed a text classification model. In this study, we identified 21 kinds of natural disasters: sandstorms, heatwaves, droughts, floods, snow disasters, rainstorms, debris flows, frosts, fog disaster, cold waves, freezing damage, collapses, continuous rainy days, typhoons, hails, gales, thunder and lightning, glaze ice, storm surges, landslides, and tornadoes. Furthermore, many internet texts, due to their diversity and complexity, are related to disasters but are not directly focused on specific disaster events, such as texts on disaster management or disaster education. In order to filter out these non-disaster events from the dataset, we added a category called “non-disaster events” to the classification targets. Thus, our task was to classify each text into some of the 22 categories in total.
Firstly, we constructed the database for model training by manual labeling. The specific process of data annotation was as follows: (1) approximately 1000 texts for each disaster category were randomly chosen from the dataset; (2) each text was manually read, and then the label set of the text was determined. Here, “label set” means that each text can belong to more than one category simultaneously.
Totally, 21,961 texts were annotated. When training the model, the annotated texts were divided into a training set and a validation set in a 7:3 ratio.
Then, we fine-tuned the text classification model based on the pre-trained language model of XLNet. The detailed model structure is shown in Figure 2; each text is tokenized and converted into vectors by the tokenizer, resulting in vectors E 1 , E 2 , …, E n , where n is the maximum text length the model reads. In this study, n = 512 . This sequence of vectors is input to the Chinese pre-trained XLNet model, and the representation output from the last layer is used for classification.
Then, all word vectors E 1 , E 2 , …, E n are compressed from n × 768 to 1 × 768 using a 1 × 1 convolutional layer, resulting in E . Finally, E is passed through a linear classifier to obtain P 1 , P 2 , …, P 22 , where P represents the probability that the text belongs to a certain class, ranging from 0 to 1. When it exceeds 0.5, the text is considered to belong to that label class.
The Chinese pre-trained XLNet model used in the study was released by the Joint Laboratory of Harbin Institute of Technology and iFLYTEK Research [39].

3.3. Methods for Constructing the Spatial-Temporal Graph of Disaster Events

To mine disaster association patterns containing information of temporal intervals and spatial distances, we transformed the research problem into a frequent subgraph mining problem. Therefore, it is necessary to transform the numerous discrete disaster events into a graph firstly.
In this study, the spatial-temporal graph of disaster events is a single-labeled directed graph, where each node and each edge both have only one label and directed edges point from earlier occurring disaster events to later occurring ones. Figure 3 shows the process of constructing the graph, and we provide details of each part in the following.

3.3.1. Construction of the Nodes in the Graph

When constructing nodes for the spatial-temporal graph of disaster events, we let each node represent a specific disaster event, and the node label indicate the type of the disaster. If a single text contains multiple kinds of disaster event, we split that text into multiple nodes, ensuring that each node has only one label. Moreover, there is no edge between these multiple nodes split from the same text when we construct edges of the graph.

3.3.2. Design of the Edge Labels in the Graph

We let each edge label reflect both the temporal interval and spatial distance between two disaster events. The temporal interval is calculated as the number of days between the dates of the two events, while the spatial distance is calculated through the Haversine formula based on geographic coordinates of the two events (assuming the geographic coordinates of two events are ( l o n 1 , l a t 1 ) and ( l o n 2 , l a t 2 ) , the distance d is calculated through Equation (1) and the outcome’s unit is kilometer).
d = 2 × 6378.137 × a r g s i n ( s i n 2 ( l a t 2 l a t 1 2 ) + cos ( l a t 2 ) cos ( l a t 1 ) s i n 2 ( l o n 2 l o n 1 2 ) )
In order to represent both the temporal interval and spatial distance within the single edge label, we divided the values of the temporal interval and spatial distance into less than 10 levels each (Table 1 shows an example). Then, we combined the two single-digit numbers into a two-digit number, with the spatial distance level as the tens digit and the temporal interval level as the units digit, forming the label for the edge. For example, if event B occurs 5 days after event A (level 4) and the spatial distance between them is 70 km (level 2), the label of the edge pointing from A to B will be “24”.

3.3.3. Rules for Creating Edges between Nodes

Ideally, there should be an edge between each pair of nodes in the graph. However, this would lead to an excessive number of edges in the graph, exceeding tens of millions, making it computationally challenging to conduct the data mining procedure. Therefore, we propose a series of specific criteria for determining whether there should be an edge between any two nodes, aiming to reduce the number of edges in the graph.
This paper constrains the creation of edges between nodes in terms of 2 aspects.
Firstly, there are constraints on the classes of disasters. Specifically, based on disaster expertise, we determined the disaster types that can result from each kind of disaster, to exclude the edges between the pairs of disaster types with very weak causal associations. For example, it is highly unlikely for a rainstorm to cause a drought, so it is stipulated that nodes representing rainstorms cannot point to nodes representing droughts. It should be noted that the purpose of adding causal constraints here is to reduce the number of edges in the graph, and we have not conducted a causal inference of disasters yet.
Furthermore, there are constraints on the spatial-temporal range. Typically, the impact of an event spreads out like ripples on water, gradually attenuating with the passage of time and increasing spatial distance until it fades away. Therefore, it can be assumed that any disaster event only affects events within a certain spatial-temporal range.
To determine the possible triggering and consequent disaster categories, we searched the relevant research. Gill et al. [40] summarized the relationships between 21 natural hazards and the spatial-temporal extent of their impacts. Their conclusions stated that storms can trigger floods, landslides, tornados, collapses, and thunder storms with an impact range of 100 square kilometers and less than a week, while tropical cyclones’ impact range can be 1,000,000 square kilometers and less than a month. Mohamed et al. [41] mentioned that a flood caused by a rainstorm once overwhelmed a city within 100 km of the rainstorm location. Edwards [42] concluded that the highest concentrations of tornadoes occurred 100–500 km from the center of a typhoon. Salvador et al. [43] mentioned that drought and gales increase the risk of sandstorms. Darvishi Boloorani et al. [44] proposed that wind speed is a determining factor in the formation of sandstorm events. Spencer et al. [45] analyzed a surge storm which affected the coastal margins of the southern North Sea for two days.
Based on the disaster knowledge, we set a relatively lenient spatial-temporal range of influence for each triggering disaster category, as shown in Table 2.

3.4. The Frequent Subgraph Mining Algorithm

The objective of this study was to discover detailed frequent spatial-temporal association patterns among different disasters, including complex associations with multiple branches and spatiotemporal gap information between disasters. To achieve this objective, we implemented the frequent subgraph mining based on the GraMi algorithm.
GraMi is a general algorithm used to discover frequent patterns and subgraphs within a single large graph. The core idea of the GraMi algorithm lies in its ability to efficiently mine frequent subgraphs within large graphs by leveraging the MNI (minimum image based) metric to avoid storing subgraphs during computation. Additionally, GraMi significantly improves efficiency by pruning the search space and prioritizing the search for short patterns. The algorithm supports mining various types of graphs, including directed graphs with labeled nodes and edges [46].

4. Results

4.1. Performance of the Natural Disaster Type Extraction

After model experiments, we obtained the text classification model for the natural disaster type extraction, with an F1-score of 94.28% on the validation set.
Then, we directly compared the performance of our model with the previous work [37]. We randomly selected 500 texts from the original dataset and reclassified them using our XLNet-based model. Both the new classification results and the old ones were then manually checked. Based on the subset accuracy evaluation method [47], the accuracy of the old classification results was 67.7% and the accuracy of the new classification results was 92.4%. This indicates a significant improvement in classification performance, with the accuracy increasing by 24.7% compared to the original dataset.
Based on the new classification results, we conducted the following experiments.

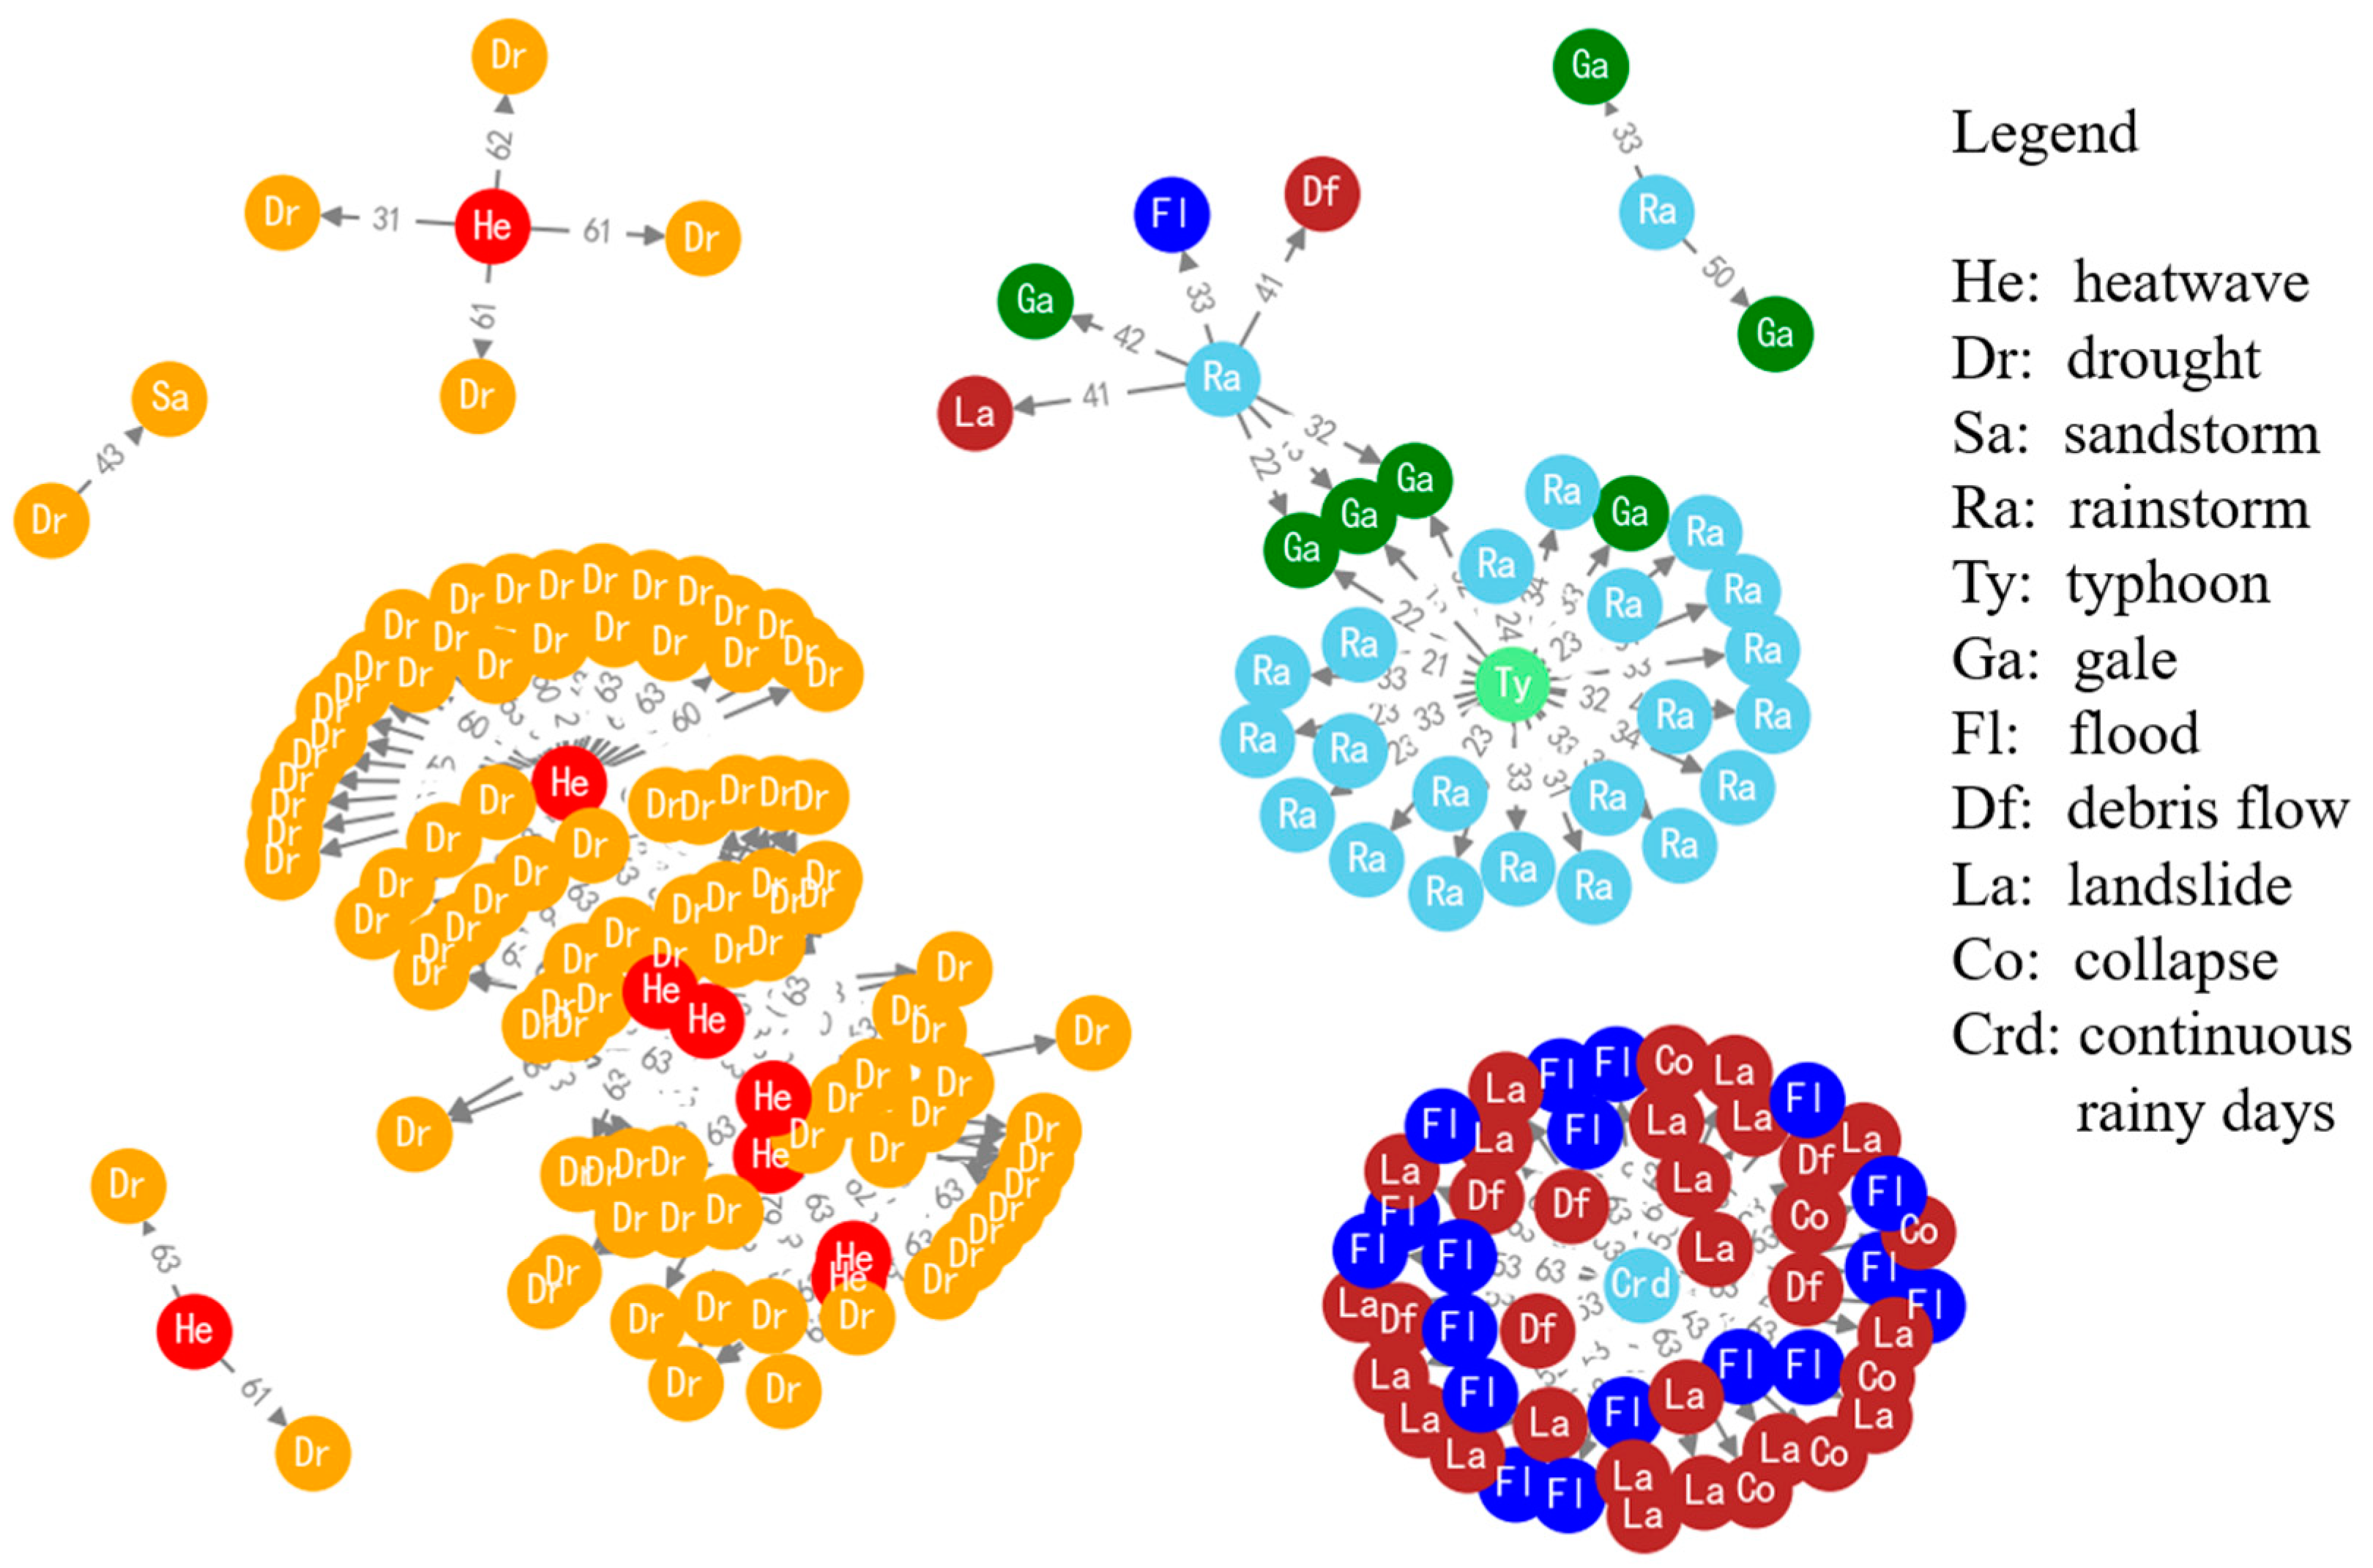
4.2. The Spatial-Temporal Graph of Disaster Events

Due to the vast amount of data, it is hard to visualize all the data while ensuring readability. Therefore, 100 nodes were selected from the data for visualization, as shown in Figure 4. This subgraph displays nodes representing various disaster events connected by directed edges, and the number on each edge is the label of edge, meaning the spatial-temporal interval between two events, as explained in Section 3.3. The incomplete connectivity of the graph is not problematic for the frequent subgraph mining algorithm, as the algorithm treats disconnected graphs as non-connected subgraphs of a single large graph. The subgraph shown in Figure 4 mainly reflects the associations between rainstorms, thunder and lightning, gales, floods, typhoons, and some geological disasters.
The complete spatial-temporal event graph comprises 134,831 nodes, 1,822,687 directed edges, and 3290 connected subgraphs. One can see that the total number of connected subgraphs is significantly smaller than the total number of nodes. This suggests that many connected subgraphs in the graph contain a lot of nodes. Therefore, it is necessary to utilize frequent subgraph mining algorithms tailored for large graphs to expedite the mining process.

4.3. Results of Frequent Subgraph Mining

We conducted frequent subgraph mining on the spatiotemporal disaster event graph, setting the minimum support threshold to 100 (i.e., searching for subgraphs that appear 100 times or more) and limiting the occurrence of nodes of the same disaster type to a maximum of 2 in each subgraph. After the program execution, we obtained a series of frequent disaster association subgraphs.
In this section, we categorize these results into two types: frequent subgraphs with one edge and frequent subgraphs with multiple edges. We then proceed to analyze and discuss each pattern separately.

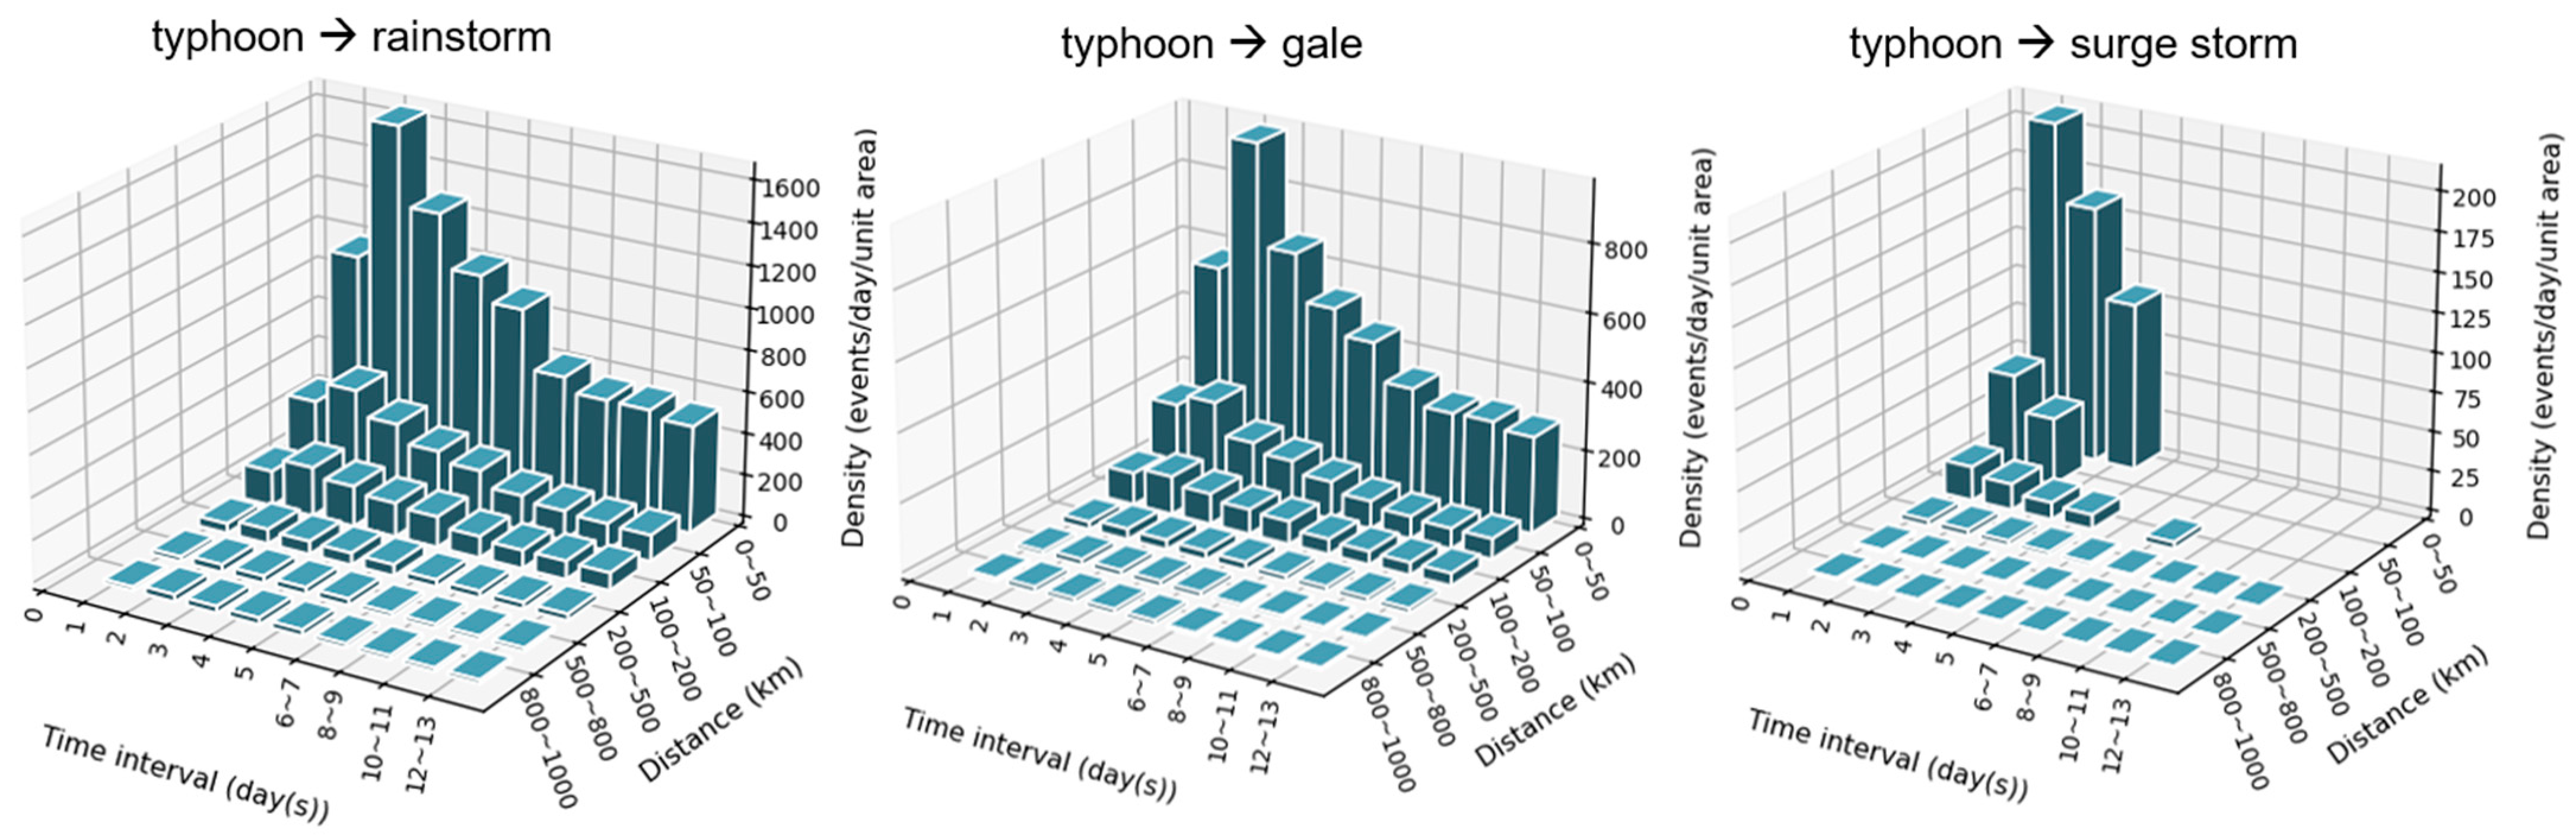
4.3.1. Frequent Subgraphs with One Edge

Firstly, we calculated the total number of frequent subgraphs with one edge for different disaster categories, as shown in Figure 5. It can be observed that the frequency of various disasters occurring following typhoons, rainstorms, or cold waves is quite high. Additionally, the occurrence of “drought → heatwave” is also very common. The result also shows that “typhoon → rainstorm” and “rainstorm → flood” are the most frequent patterns, which is consistent with the research finding that flooding was the major disaster type contributing to the most losses in most regions of China [48,49,50], and rainstorm-induced flood disasters are the most frequent and influential among common meteorological disasters in East China [51]. This proves that the statistical results of this paper are generally reliable. However, the spatial and temporal intervals between disasters are seldom examined in other studies; therefore, finding related studies to compare the results of the spatial and temporal intervals below is more difficult.
During our analysis of the results, we found a problem, namely that the spatiotemporal interval information contained in the edge labels is divided into levels, and the number of spatiotemporal gap units varies across these levels. This discrepancy makes direct comparison of frequencies at each level ineffective in reflecting the variation patterns over time and space. To address this issue, we computed the occurrence density of each pattern according to Equation (2). For example, for the pattern “heatwave → drought, temporal interval 0~3 days, spatial distance 25~50 km”, the occurrence density of this pattern is calculated by dividing the occurrence of this pattern by the product of its temporal interval units (4) and spatial area units ( π 50 2     π 25 2 π 25 2 ).
o c c u r r e n c e   d e n s i t y = o c c u r r e n c e n u m b e r   o f   t i m e   i n t e r v a l   u n i t s × n u m b e r   o f   s p a t i a l   a r e a   u n i t s
(1)
typhoon → rainstorm/gale/storm surge
The frequent spatiotemporal pattern distributions of “typhoon → rainstorm” and “typhoon → gale” are almost identical (Figure 6). At each temporal interval level, the occurrence density peaks at spatial distances of 0~50 km. At each spatial distance level, the occurrence density peaks at a temporal interval of 2 days. This time lag could be attributed to the issuance of typhoon warnings occurring before the typhoon arrives at a certain location, and that typhoon warnings are also classified as typhoon events. Based on the distributions, we can infer that the pattern of typhoons bringing rainstorms and gales is mainly concentrated within 7 days and 200 km.
The pattern of “typhoon → storm surge” is mainly concentrated within 3 days and 200 km. Unlike “typhoon → rainstorm/gale”, the attenuation of “typhoon → storm surge” over time and space does not exhibit any delay. The reason for this difference may be attributed to the fact that typhoons originate from the sea, and storm surges are also oceanic disasters. Therefore, storm surges are the first results of typhoons upon landfall.
(2)
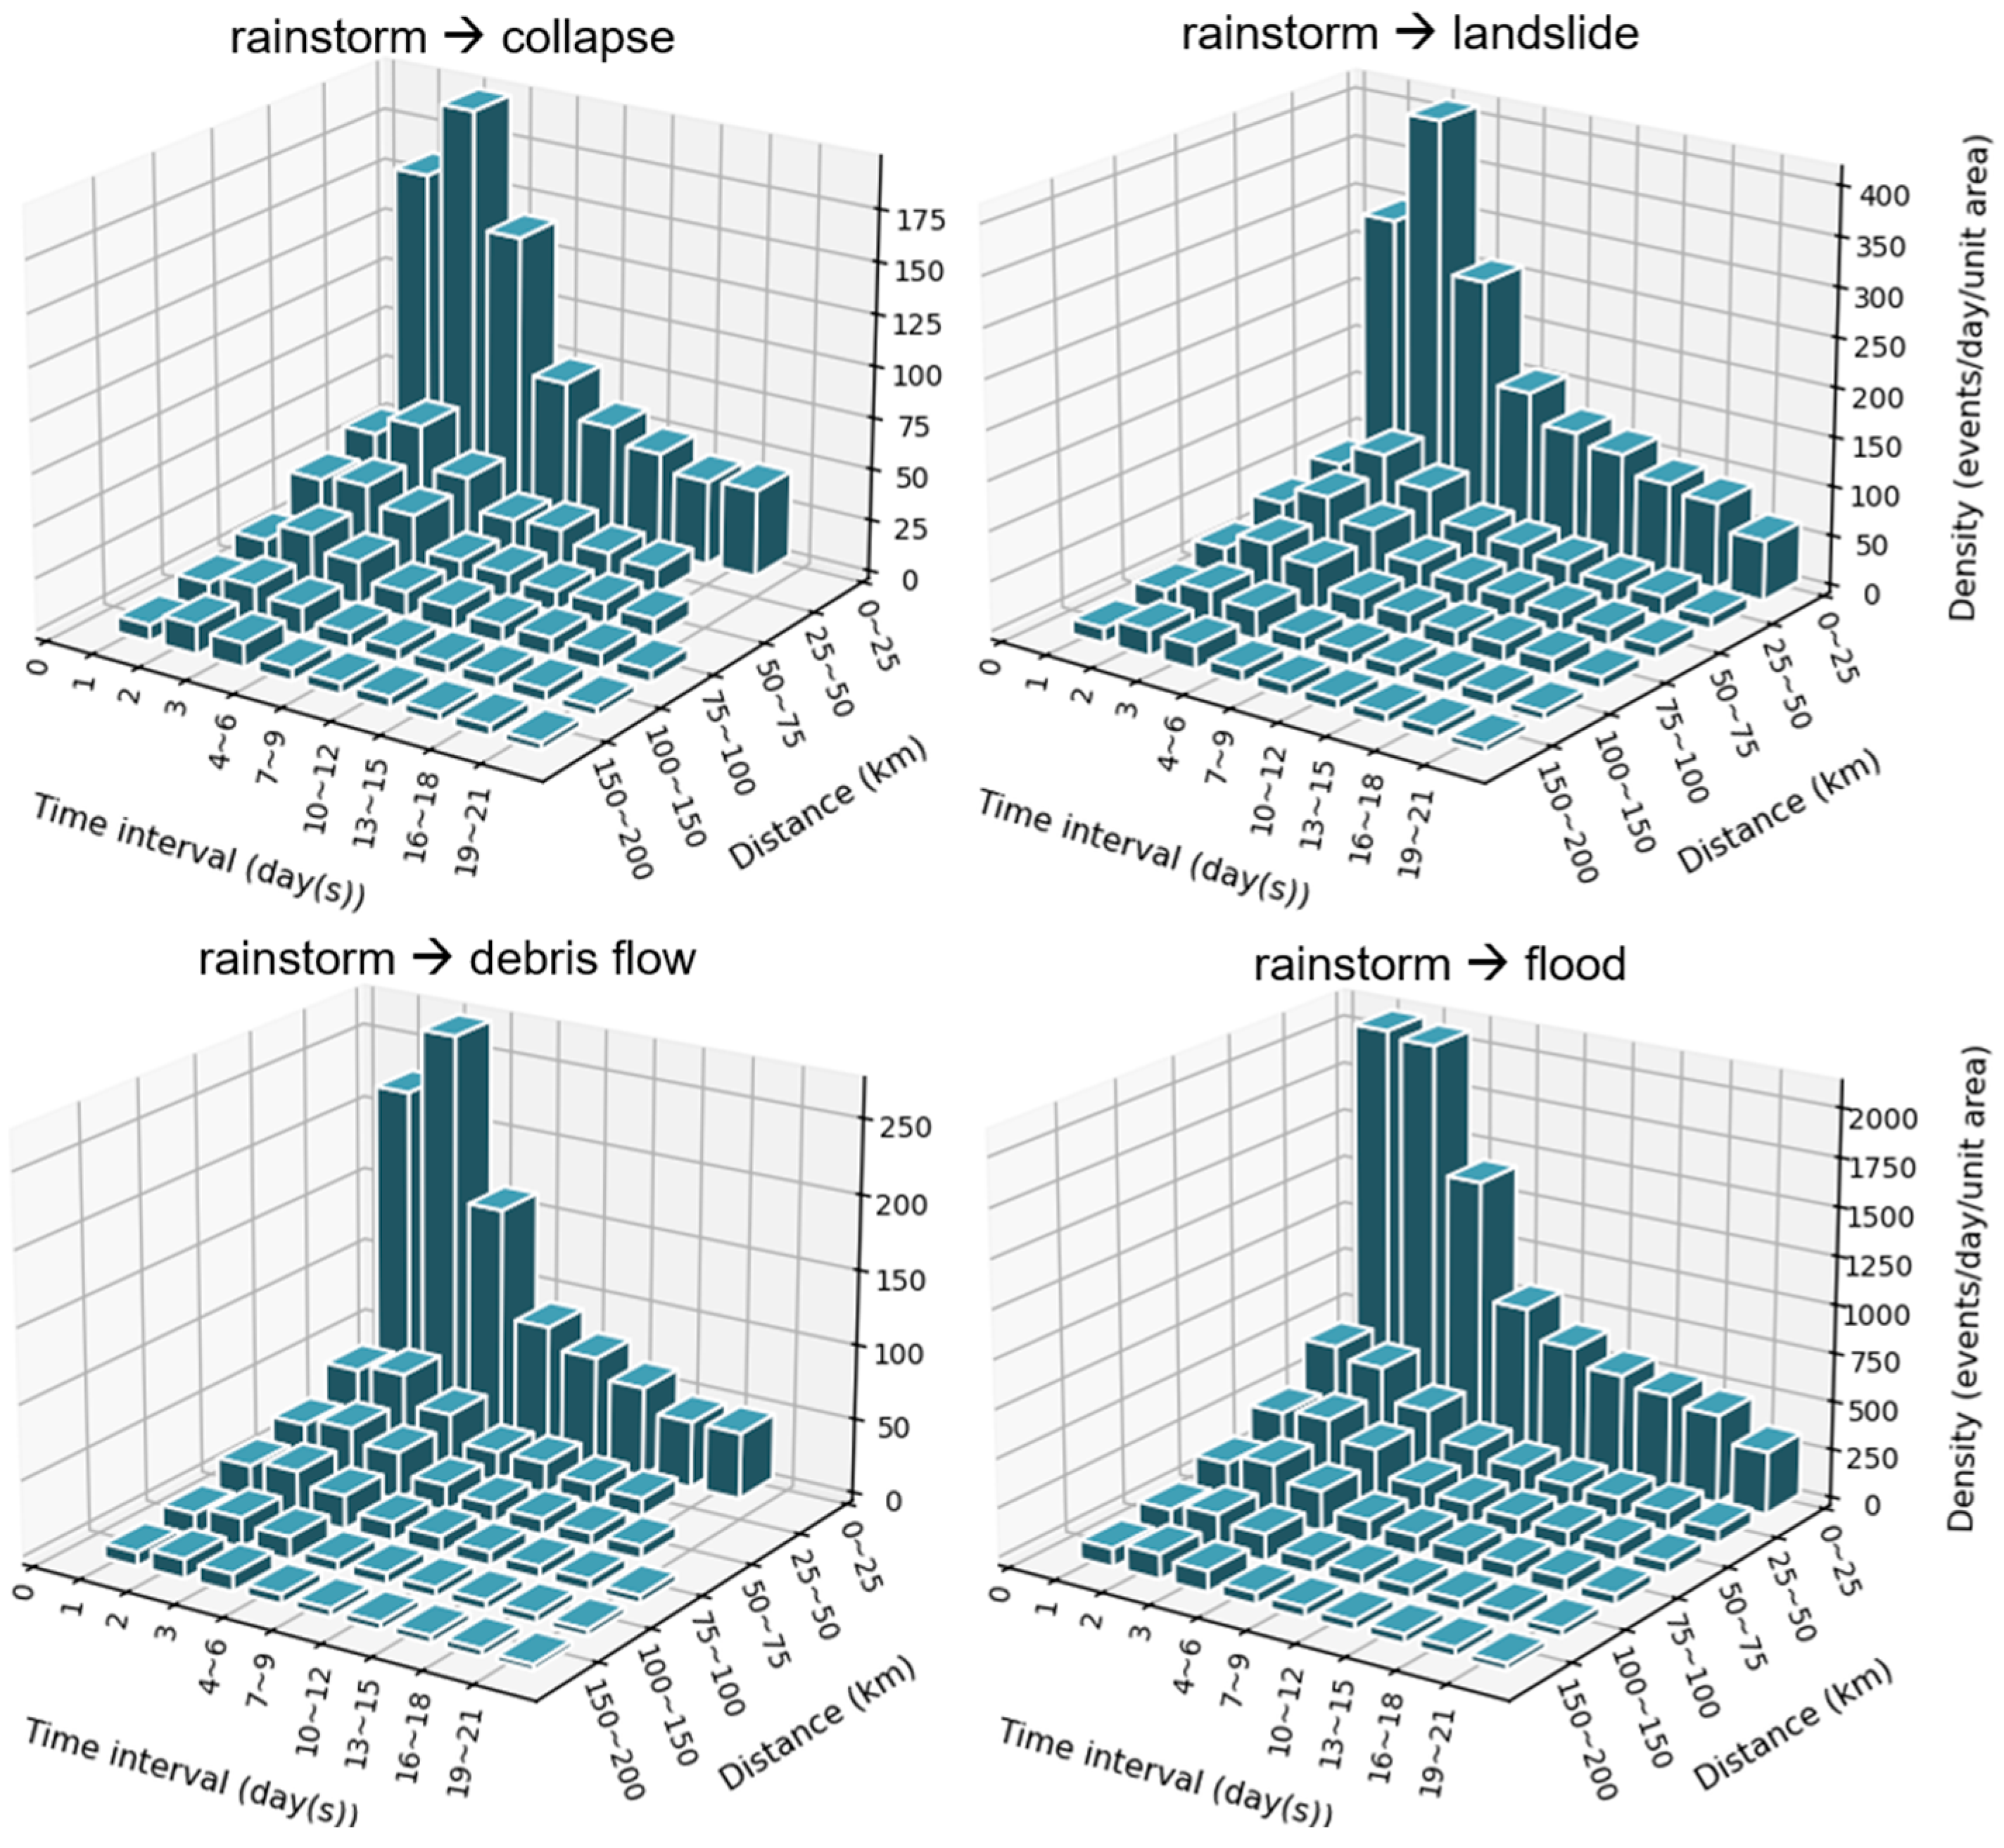
rainstorm → collapse/landslide/debris flow/flood/tornado
The frequent spatiotemporal pattern distributions of “rainstorm → collapse/landslide/debris flow/flood” are similar (Figure A1). Overall, “rainstorm → flood” has the highest frequency, while “rainstorm → landslide” is slightly more common than “rainstorm → collapse/debris flow”. The occurrence densities of “rainstorm → collapse/landslide/debris flow” all peak at the temporal interval of 2 days and the spatial distance of 0~25 km. Some studies have mentioned that rainstorms of 2 days’ duration lead to more large-scale landslide disasters, which is consistent with our findings [52,53].
The occurrence density of “rainstorm → tornado” is mainly concentrated at the temporal interval of 1 day and spatial distances of 0~25 km (Figure A2). The occurrence density is quite low at other spatiotemporal intervals.
(3)
heatwave → drought, drought → heatwave/sandstorm
The occurrence density of “heatwave → drought” (Figure A3) peaks at a time interval of 8~11 days and decreases at time intervals exceeding 23 days. In terms of spatial distance, the occurrence density of “heatwave → drought” is typically highest at distances of 0~25 km. The occurrence density of “drought → heatwave” peaks at a time interval of 0~6 days and spatial distances of 0~50 km, and decreases with increasing time intervals and spatial distances. Compared to “heatwave → drought”, the pattern of “drought → heatwave” more strictly obeys the rule of decreasing occurrence density with increasing spatiotemporal intervals.
The occurrence density of “drought → sandstorm” is mainly concentrated at spatial distances of 200~1000 km when the temporal interval is fewer than 60 days (Figure A3). Only at the temporal interval of 42~59 days does the occurrence density of “drought → sandstorm” become relatively high at spatial distances of 100~200 km. It is hypothesized that in the process of “drought → sandstorm”, drought and sandstorms usually occur in different places which are more than 200 km apart.
(4)
cold wave → hail/freezing damage/glaze ice/gale/frost/snow disaster/fog disaster
The total frequencies of “cold wave → hail/freezing damage/glaze ice” are relatively low and especially low at spatial distances of 0~200 km (Figure A4). The occurrence densities of “cold wave → hail/freezing damage/glaze ice” all peak at the temporal interval of 2 days and spatial distances of 100~200 km or 200~500 km. One week after cold waves, freezing damage occurrences are rare, while hail or glaze ice still occur.
The occurrence densities of “cold wave → gale/frost/snow disaster” all peak at the temporal interval of 2 days and spatial distances of 0~50 km (Figure A5), but the spatiotemporal distributions of the three patterns are different. Overall, the occurrence densities of “cold wave → gale/frost/snow disaster” decrease with increasing spatial distance, and decrease with increasing temporal interval after peaking at interval of 2 days. However, the occurrence density of “cold wave → frost” becomes quite low when the temporal interval exceeds 10 days at the spatial distances of 0~50 km, and the occurrence density of “cold wave → snow disaster” becomes quite low when the temporal interval exceeds 3 days at the spatial distances of 0~100 km.
The time lag, where the patterns above all peak at a time interval of 2 days instead of 0 day or 1 day, may be due to cold wave warnings being identified as cold wave disasters.
There is no clear pattern in the change with the temporal interval of occurrence density of “cold wave → fog disaster” and the occurrence density is not high enough until the temporal interval exceeds 6 days at the spatial distances of 0~100 km (Figure A5).
(5)
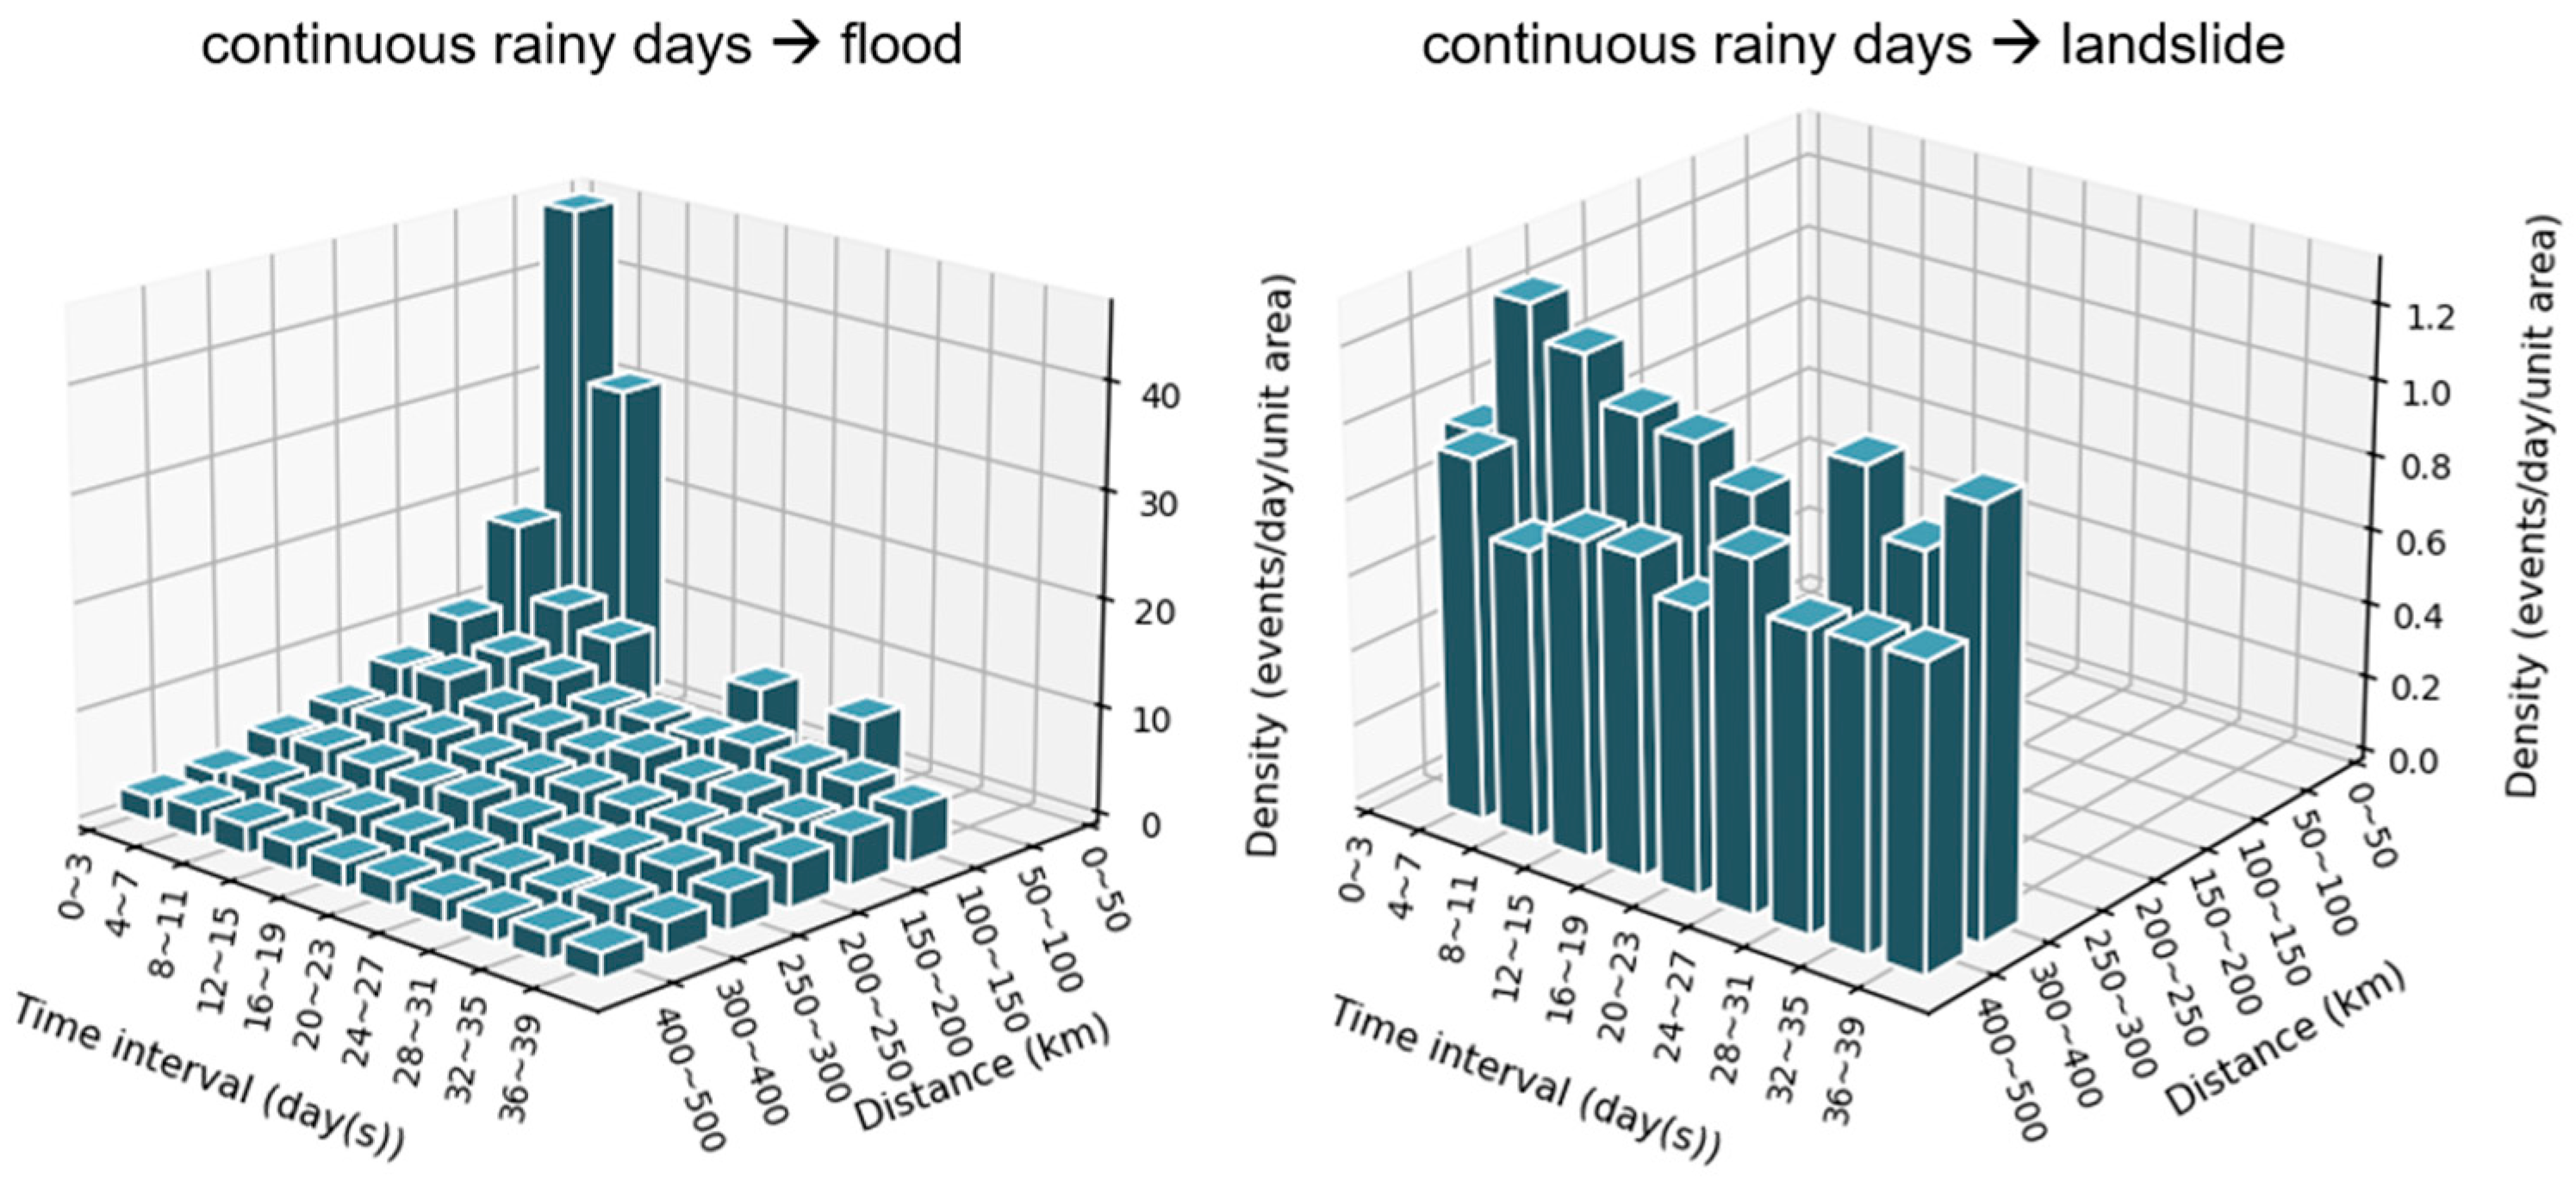
continuous rainy days → flood/landslide
The total frequency of “continuous rainy days → flood” is much higher than that of “continuous rainy days → landslide” (Figure A6). At the spatial distances of 0~50 km, the occurrence density of “continuous rainy days → flood” is only high when the time interval is less than 8 days. When the spatial distance exceeds 100 km, there is no clear pattern in the change with increasing temporal interval.
For “continuous rainy days → landslide”, the occurrence density is not high enough until the spatial distance exceeds 300 km. There is also no clear pattern in the change with increasing temporal interval.
(6)
storm surge → flood
The occurrence density of “storm surge → flood” peaks at the temporal interval of 1 day and spatial distances of 0~50 km, and it rapidly decreases with time interval and spatial distance (Figure A7). Based on the distribution, we can infer that the pattern of surge storms bringing floods is mainly concentrated within 1~2 days and 200 km.
(7)
gale → sandstorm
The pattern of “gale → sandstorm” is mainly concentrated within 50 km and rarely happens at farther spatial distances (Figure A8). The occurrence density of “gale → sandstorm” peaks at the temporal interval of 1 day and spatial distances of 0~50 km, and it decreases with increasing time intervals at the spatial distances of 0~50 km.

4.3.2. Frequent Subgraphs with Multiple Edges

The case of frequent subgraphs with multiple edges is shown in Table 3. All the frequent subgraphs with multiple edges contain nodes representing a rainstorm or flood. Additionally, there are also some subgraphs containing nodes representing typhoons or gales.
Figure 7 presents some frequent subgraphs related to typhoons, illustrating various frequent patterns among typhoons, rainstorms, and floods. It can be observed that “typhoon → rainstorm/gale” typically occurs with longer temporal intervals of 2 days or more and at relatively longer distances, while “rainstorm → flood” occurs with shorter temporal intervals and closer distances, mostly within 1 day and within 25 km.

5. Discussion

This study, based on extensive textual records of natural disaster events, utilized frequent subgraph mining algorithms to discover spatiotemporal frequent patterns of natural disasters, which not only reflect the sequence of disaster events but also capture common spatiotemporal intervals between disaster events. From the results of spatiotemporal frequent patterns, we summarized associations among 21 different types of disasters such as typhoons, rainstorms, heatwaves, and cold waves.
The findings of this study can serve as decision-making references for disaster prevention and control efforts. For instance, based on the discovery that the most common spatiotemporal interval for cold wave → snow disaster is within 3 days and 0~200 km, relevant authorities can organize and prioritize preparations for a snow disaster response within a radius of 200 km from the epicenter within 3 days after the occurrence of a cold wave.
This study has several limitations that require further research in the future:
(1)
When constructing the spatiotemporal graph of disaster events, the constraints on the edge connection may lead to the omission of some frequent patterns. Future research will try not to set the constraints and complete the subgraph mining through high-efficiency methods such as concurrent computation.
(2)
The information of occurrence time extracted from textual records may be biased due to disaster warnings issued before the actual occurrence or statistical reports after the event. Future studies will consider eliminating the deviations.
Furthermore, based on the results of this study, future research could explore causal relationships among disasters or disaster prediction issues.

6. Conclusions

Studying the relationships between natural disasters helps to understand their patterns of occurrence, enabling people to take better measures to reduce the losses. This study, based on the extensive textual records of natural disaster events, utilizes frequent subgraph mining algorithms to uncover both the common sequences of disaster occurrences and common spatial-temporal intervals between disasters in China.
The textual data, including ancient Chinese disaster record texts and modern internet disaster texts, are taken from the database established by Hu et al. [37]. Since the disaster type extraction precision of the database is not high enough, we fine-tuned a text classification model based on the Chinese pre-trained XLNet, and repeated the extraction of the disaster type from the data, enhancing the accuracy by about 24%.
We reformulated the research problem into a frequent subgraph mining problem. First, we transformed a large amount of discrete spatiotemporal event data into a single-label directed graph structure, with 134,831 nodes and 1,822,687 directed edges. Then, we utilized the GraMi frequent subgraph mining algorithm to obtain a series of frequent subgraph results. Some of the key findings regarding disaster relationships are as follows:
(1)
After typhoons, rainstorms, and cold waves, the frequencies of various secondary disasters are high. Additionally, the occurrence of heatwaves after droughts is also very common.
(2)
The pattern of “gale → sandstorm” is mainly concentrated within 50 km and rarely happens at farther spatial distances, and the most common temporal interval is 1 day.
(3)
The occurrence density of most patterns obeys the rule of decreasing with increasing temporal interval and spatial distance, but there are some exceptional patterns not obeying this rule: “heatwave → drought”, “drought → sandstorm”, “cold wave → hail/freezing damage/glaze ice”, and “continuous rainy days → landslide”.
The statistical results of frequent subgraphs provide detailed data support for further understanding the patterns of disaster occurrences and offer decision-making references for disaster prevention efforts. They also lay the foundation for research on text-based disaster causality or prediction.

Author Contributions

Conceptualization, A.H. and W.Y. (Wen Yuan); methodology, A.H.; resources, W.Y. (Wen Yuan); writing—original draft preparation, A.H.; writing—review and editing, J.Z.; supervision, W.Y. (Wu Yuan); project administration, X.J., X.G. and R.W. All authors have read and agreed to the published version of the manuscript.

Funding

This research was funded by National Key R&D Program of China (No. 2022YFF0711601) and Strategic Priority Research Program of the Chinese Academy of Sciences (No. XDA23100103).

Institutional Review Board Statement

Not applicable.

Informed Consent Statement

Not applicable.

Data Availability Statement

The dataset is not available but can be obtained from the corresponding author upon reasonable request.

Conflicts of Interest

The authors declare no conflicts of interest.

Appendix A

Figure A1. Frequent spatiotemporal pattern distributions of “rainstorm → collapse/landslide/debris flow/flood”.
Information 15 00372 g0a1
Figure A2. Frequent spatiotemporal pattern distributions of “rainstorm → tornado”.
Information 15 00372 g0a2
Figure A3. Frequent spatiotemporal pattern distributions of “heatwave → drought” and “drought → heatwave/sandstorm”.
Information 15 00372 g0a3
Figure A4. Frequent spatiotemporal pattern distributions of “cold wave → hail/freezing damage/glaze ice”.
Information 15 00372 g0a4
Figure A5. Frequent spatiotemporal pattern distributions of “cold wave → gale/frost/snow disaster/fog disaster”.
Information 15 00372 g0a5
Figure A6. Frequent spatiotemporal pattern distributions of “cold wave → gale/fog disaster/frost/snow disaster”.
Information 15 00372 g0a6
Figure A7. Frequent spatiotemporal pattern distributions of “storm surge → flood”.
Information 15 00372 g0a7
Figure A8. Frequent spatiotemporal pattern distributions of “gale → sandstorm”.
Information 15 00372 g0a8

References

  1. China Climate Bulletin 2021. Available online: https://www.cma.gov.cn/zfxxgk/gknr/qxbg/202203/t20220308_4568477.html (accessed on 14 March 2024).
  2. AghaKouchak, A.; Huning, L.S.; Chiang, F.; Sadegh, M.; Vahedifard, F.; Mazdiyasni, O.; Moftakhari, H.; Mallakpour, I. How do natural hazards cascade to cause disasters? Nature 2018, 561, 458–460. [Google Scholar] [CrossRef] [PubMed]
  3. Peng, L.J.; Wu, Y.P.; Wang, F.; Li, Y.N. Landslide disaster genesis pattern in Enshi area, Hubei. Chin. J. Geol. Hazard Control 2017, 28, 1–9. (In Chinese) [Google Scholar] [CrossRef]
  4. Xu, J.; Bai, D.; He, H.; Luo, J.; Lu, G. Disaster Precursor Identification and Early Warning of the Lishanyuan Landslide Based on Association Rule Mining. Appl. Sci. 2022, 12, 12836. [Google Scholar] [CrossRef]
  5. Fu, P.F.; Sun, H.Q.; Su, Z.C.; Yang, X.J. Research on global drought disaster chain analysis based on EM-DAT data. J. China Inst. Water Resour. Hydropower Res. 2023, 21, 287–294+306. (In Chinese) [Google Scholar] [CrossRef]
  6. Liu, X.; Guo, H.; Lin, Y.; Li, Y.; Hou, J. Analyzing Spatial-Temporal Distribution of Natural Hazards in China by Mining News Sources. Nat. Hazards Rev. 2018, 19, 04018006. [Google Scholar] [CrossRef]
  7. Yang, C.; Zhang, H.; Li, X.; He, Z.; Li, J. Analysis of Spatial and Temporal Characteristics of Major Natural Disasters in China from 2008 to 2021 Based on Mining News Database. Nat. Hazards 2023, 118, 1881–1916. [Google Scholar] [CrossRef]
  8. Liu, B.; Siu, Y.L.; Mitchell, G. Hazard Interaction Analysis for Multi-Hazard Risk Assessment: A Systematic Classification Based on Hazard-Forming Environment. Nat. Hazards Earth Syst. Sci. 2016, 16, 629–642. [Google Scholar] [CrossRef]
  9. Wang, J.; He, Z.; Weng, W. A Review of the Research into the Relations between Hazards in Multi-Hazard Risk Analysis. Nat. Hazards 2020, 104, 2003–2026. [Google Scholar] [CrossRef]
  10. Han, J.; Wu, S.; Wang, H. Preliminary Study on Geological Hazard Chains. Earth Sci. Front. 2007, 14, 11–20. [Google Scholar] [CrossRef]
  11. van Westen, C.; Kappes, M.S.; Luna, B.Q.; Frigerio, S.; Glade, T.; Malet, J.-P. Medium-Scale Multi-Hazard Risk Assessment of Gravitational Processes. In Mountain Risks: From Prediction to Management and Governance; Van Asch, T., Corominas, J., Greiving, S., Malet, J.-P., Sterlacchini, S., Eds.; Springer: Dordrecht, The Netherlands, 2014; pp. 201–231. ISBN 978-94-007-6769-0. [Google Scholar]
  12. Cui, Y.; Hu, J.; Xu, C.; Zheng, J.; Wei, J. A Catastrophic Natural Disaster Chain of Typhoon-Rainstorm-Landslide-Barrier Lake-Flooding in Zhejiang Province, China. J. Mt. Sci. 2021, 18, 2108–2119. [Google Scholar] [CrossRef]
  13. Marengo, J.A.; Alcantara, E.; Cunha, A.P.; Seluchi, M.; Nobre, C.A.; Dolif, G.; Goncalves, D.; Assis Dias, M.; Cuartas, L.A.; Bender, F.; et al. Flash Floods and Landslides in the City of Recife, Northeast Brazil after Heavy Rain on May 25–28, 2022: Causes, Impacts, and Disaster Preparedness. Weather Clim. Extrem. 2023, 39, 100545. [Google Scholar] [CrossRef]
  14. Papagiannaki, K.; Lagouvardos, K.; Kotroni, V.; Bezes, A. Flash Flood Occurrence and Relation to the Rainfall Hazard in a Highly Urbanized Area. Nat. Hazards Earth Syst. Sci. 2015, 15, 1859–1871. [Google Scholar] [CrossRef]
  15. Zhang, X.; Liu, Y.; Zhu, Y.; Ma, Q.; Philippe, G.; Qu, Y.; Yin, H. Probabilistic Analysis on the Influences of Heatwaves during the Onset of Flash Droughts over China. Hydrol. Res. 2023, 54, 869–884. [Google Scholar] [CrossRef]
  16. Bustio-Martínez, L.; Cumplido, R.; Letras, M.; Hernández-León, R.; Feregrino-Uribe, C.; Hernández-Palancar, J. FPGA/GPU-Based Acceleration for Frequent Itemsets Mining: A Comprehensive Review. ACM Comput. Surv. 2022, 54, 1–35. [Google Scholar] [CrossRef]
  17. Agrawal, R.; Ramakrishnan, S. Fast algorithms for mining association rules in large databases. In Proceedings of the 20th International Conference on Very Large Data Bases (VLDB’94), Santiago de Chile, Chile, 12–15 September 1994; Morgan Kaufmann: San Francisco, CA, USA, 1994. [Google Scholar]
  18. Han, J.; Pei, J.; Yin, Y. Mining Frequent Patterns without Candidate Generation. SIGMOD Rec. (ACM Spec. Interes. Gr. Manag. Data) 2000, 29, 1–12. [Google Scholar] [CrossRef]
  19. Zhang, Z.; Wu, W. Composite spatio-temporal co-occurrence pattern mining. In Proceedings of the Wireless Algorithms, Systems, and Applications, Dallas, TX, USA, 26–28 October 2008. [Google Scholar] [CrossRef]
  20. Alatrista Salas, H.; Bringay, S.; Flouvat, F.; Selmaoui-Folcher, N.; Teisseire, M. The Pattern Next Door: Towards Spatio-Sequential Pattern Discovery. In Proceedings of the Advances in Knowledge Discovery and Data Mining, Kuala Lumpur, Malaysia, 29 May 2012. [Google Scholar] [CrossRef]
  21. Atluri, G.; Karpatne, A.; Kumar, V. Spatio-Temporal Data Mining: A Survey of Problems and Methods. ACM Comput. Surv. 2018, 51, 1–41. [Google Scholar] [CrossRef]
  22. Shekhar, S.; Jiang, Z.; Ali, R.Y.; Eftelioglu, E.; Tang, X.; Gunturi, V.M.V.; Zhou, X. Spatiotemporal Data Mining: A Computational Perspective. ISPRS Int. J. Geo-Inf. 2015, 4, 2306–2338. [Google Scholar] [CrossRef]
  23. Wang, X.; Wang, J.; Wang, L.; Wang, S.; Ding, L. TCPMS-FCP: A Traffic Congestion Pattern Mining System Based on Spatio-Temporal Fuzzy Co-Location Patterns. In Proceedings of the Web Information Systems Engineering—WISE 2022, Biarritz, France, 1–3 November 2022. [Google Scholar] [CrossRef]
  24. Xia, D.; Lu, X.; Li, H.; Wang, W.; Li, Y.; Zhang, Z. A MapReduce-Based Parallel Frequent Pattern Growth Algorithm for Spatiotemporal Association Analysis of Mobile Trajectory Big Data. Complexity 2018, 2018, 2818251. [Google Scholar] [CrossRef]
  25. Ghosh, S.; Ghosh, S.K.; Buyya, R. MARIO: A Spatio-Temporal Data Mining Framework on Google Cloud to Explore Mobility Dynamics from Taxi Trajectories. J. Netw. Comput. Appl. 2020, 164, 102692. [Google Scholar] [CrossRef]
  26. Celik, M. Partial Spatio-Temporal Co-Occurrence Pattern Mining. Knowl. Inf. Syst. 2015, 44, 27–49. [Google Scholar] [CrossRef]
  27. He, Z.; Tao, L.; Xie, Z.; Xu, C. Discovering Spatial Interaction Patterns of near Repeat Crime by Spatial Association Rules Mining. Sci. Rep. 2020, 10, 1–11. [Google Scholar] [CrossRef]
  28. Aydin, B.; Angryk, R. Spatiotemporal Frequent Pattern Mining on Solar Data: Current Algorithms and Future Directions. In Proceedings of the 15th IEEE International Conference on Data Mining Workshop (ICDMW), Atlantic City, NJ, USA, 14–17 November 2015; pp. 575–581. [Google Scholar] [CrossRef]
  29. Vega-Oliveros, D.A.; Cotacallapa, M.; Ferreira, L.N.; Quiles, M.G.; Zhao, L.; Macau, E.E.N.; Cardoso, M.F. From Spatio-Temporal Data to Chronological Networks: An Application to Wildfire Analysis. In Proceedings of the 34th ACM/SIGAPP Symposium on Applied Computing, Limassol, Cyprus, 8–12 April 2019; Association for Computing Machinery: New York, NY, USA, 2019. [Google Scholar] [CrossRef]
  30. Ferreira, L.N.; Vega-Oliveros, D.A.; Cotacallapa, M.; Cardoso, M.F.; Quiles, M.G.; Zhao, L.; Macau, E.E.N. Spatiotemporal Data Analysis with Chronological Networks. Nat. Commun. 2020, 11, 1–11. [Google Scholar] [CrossRef]
  31. Oberoi, K.S.; del Mondo, G. Graph-Based Pattern Detection in Spatio-Temporal Phenomena. In Proceedings of the 16th Spatial Analysis and Geomatics Conference (SAGEO 2021), La Rochelle, France, 5–7 May 2021. [Google Scholar]
  32. Deng, Z.; Weng, D.; Chen, J.; Liu, R.; Wang, Z.; Bao, J.; Zheng, Y.; Wu, Y. AirVis: Visual Analytics of Air Pollution Propagation. IEEE Trans. Vis. Comput. Graph. 2020, 26, 800–810. [Google Scholar] [CrossRef] [PubMed]
  33. Petelin, B.; Kononenko, I.; Malačič, V.; Kukar, M. Frequent Subgraph Mining in Oceanographic Multi-Level Directed Graphs. Int. J. Geogr. Inf. Sci. 2019, 33, 1936–1959. [Google Scholar] [CrossRef]
  34. Park, S.; Yuan, Y.; Choe, Y. Application of Graph Theory to Mining the Similarity of Travel Trajectories. Tour. Manag. 2021, 87, 104391. [Google Scholar] [CrossRef]
  35. Wang, S.; Niu, X.; Fournier-Viger, P.; Zhou, D.; Min, F. A Graph Based Approach for Mining Significant Places in Trajectory Data. Inf. Sci. 2022, 609, 172–194. [Google Scholar] [CrossRef]
  36. Ayadi, Z.; Boulila, W.; Farah, I.R. Modeling Complex Object Changes in Satellite Image Time-Series: Approach Based on CSP and Spatiotemporal Graphs. Procedia Comput. Sci. 2023, 225, 2467–2476. [Google Scholar] [CrossRef]
  37. Hu, D.M.; Yuan, W.; Niu, F.Q.; Yuan, W.; Han, A.A. Multi-model fusion extraction method for chinese text implicative meteorological disasters event information. J. Geoinfo. Sci. 2022, 24, 2342–2355. (In Chinese) [Google Scholar] [CrossRef]
  38. School of Computer Science and Technology, BIT, Yuan Wu. Available online: https://cs.bit.edu.cn/szdw/jsml/fjs/yw/index.htm (accessed on 28 May 2024).
  39. Cui, Y.; Che, W.; Liu, T.; Qin, B.; Wang, S.; Hu, G. Revisiting Pre-Trained Models for Chinese Natural Language Processing. In Proceedings of the 2020 Conference on Empirical Methods in Natural Language Processing: Findings, Online, 16–20 November 2020; Association for Computational Linguistics: Sydney, Australia, 2020; pp. 657–668. [Google Scholar] [CrossRef]
  40. Gill, J.C.; Malamud, B.D. Reviewing and visualizing the interactions of natural hazards. Rev. Geophys. 2014, 52, 680–722. [Google Scholar] [CrossRef]
  41. Mohamed, M.J.; Karim, I.R.; Fattah, M.Y.; Al-Ansari, N. Modelling Flood Wave Propagation as a Result of Dam Piping Failure Using 2D-HEC-RAS. Civ. Eng. J. 2023, 9, 2503–2515. [Google Scholar] [CrossRef]
  42. Edwards, R. Tropical Cyclone Tornadoes: A Review of Knowledge in Research and Prediction. E-J. Sev. Storms Meteorol. 2021, 7, 1–61. [Google Scholar] [CrossRef]
  43. Salvador, C.; Nieto, R.; Vicente-Serrano, S.M.; García-Herrera, R.; Gimeno, L.; Vicedo-Cabrera, A.M. Public Health Implications of Drought in a Climate Change Context: A Critical Review. Annu. Rev. Public Health 2023, 44, 213–232. [Google Scholar] [CrossRef] [PubMed]
  44. Darvishi Boloorani, A.; Soleimani, M.; Papi, R.; Neysani Samany, N.; Teymouri, P.; Soleimani, Z. Sources, Drivers, and Impacts of Sand and Dust Storms: A Global View. In Dust and Health: Challenges and Solutions; Al-Dousari, A., Hashmi, M.Z., Eds.; Springer International Publishing: Cham, Switzerland, 2023; pp. 31–49. ISBN 978-3-031-21209-3. [Google Scholar]
  45. Spencer, T.; Brooks, S.M.; Evans, B.R.; Tempest, J.A.; Möller, I. Southern North Sea Storm Surge Event of 5 December 2013: Water Levels, Waves and Coastal Impacts. Earth-Sci. Rev. 2015, 146, 120–145. [Google Scholar] [CrossRef]
  46. Elseidy, M.; Abdelhamid, E.; Skiadopoulos, S.; Kalnis, P. GRAMI: Frequent Subgraph and Pattern Mining in a Single Large Graph. Proc. VLDB Endow. 2014, 7, 517–528. [Google Scholar] [CrossRef]
  47. Godbole, S.; Sarawagi, S. Discriminative Methods for Multi-Labeled Classification. Adv. Knowl. Discov. Data Mining. 2004, 3056, 22–30. [Google Scholar] [CrossRef]
  48. Guan, Y.; Zheng, F.; Zhang, P.; Qin, C. Spatial and Temporal Changes of Meteorological Disasters in China during 1950–2013. Nat. Hazards 2015, 75, 2607–2623. [Google Scholar] [CrossRef]
  49. Xu, X.; Tang, Q. Meteorological Disaster Frequency at Prefecture-Level City Scale and Induced Losses in Mainland China during 2011–2019. Nat. Hazards 2021, 109, 827–844. [Google Scholar] [CrossRef]
  50. Wang, Y.; Gao, G.; Zhai, J.; Liu, Q.; Song, L. Evolution Characteristics of the Rainstorm Disaster Chains in the Guangdong–Hong Kong–Macao Greater Bay Area, China. Nat. Hazards 2023, 119, 2011–2032. [Google Scholar] [CrossRef]
  51. Shi, J.; Cui, L. Spatial and Temporal Characteristics of Four Main Types of Meteorological Disasters in East China. Atmosfera 2020, 33, 233–247. [Google Scholar] [CrossRef]
  52. Dhakal, A.S.; Sidle, R.C. Distributed Simulations of Landslides for Different Rainfall Conditions. Hydrol. Process. 2004, 18, 757–776. [Google Scholar] [CrossRef]
  53. Li, B.; Gao, Y.; Yin, Y.; Wan, J.; He, K.; Wu, W.; Zhang, H. Rainstorm-Induced Large-Scale Landslides in Northeastern Chongqing, China, August 31 to September 2, 2014. Bull. Eng. Geol. Environ. 2022, 81, 271. [Google Scholar] [CrossRef]
Figure 1. Flowchart of the study. The grey part was undertaken in previous work, but we show it here for better understanding of the research.
Information 15 00372 g001
Figure 2. The classification model architecture.
Information 15 00372 g002
Figure 3. Flowchart for construction of the spatial-temporal graph of disaster events.
Information 15 00372 g003
Figure 4. Part of the graph of spatial-temporal disaster events.
Information 15 00372 g004
Figure 5. Total frequency of all 1-edge frequent subgraphs. Note: “-” represents a directed edge, with the disaster before “-” occurring first, and the disaster after “-” occurring later.
Information 15 00372 g005
Figure 6. Frequent spatiotemporal pattern distributions of “typhoon → rainstorm/gale/surge storm”.
Information 15 00372 g006
Figure 7. Some of the frequent subgraphs with multi edges.
Information 15 00372 g007
Table 1. Method of classifying time intervals and spatial distance levels.
Spatial DistanceTemporal Interval
LevelsRange of Values (km)LevelsRange of Values (day(s))
1[0, 50)00
2[50, 100)11
3[100, 200)22
4[200, 500)33
5[500, 800)44~6
6[800, 1000)57~9
610~12
713~15
816~18
919~21
Table 2. Causal and consequential disaster categories and constraints on the spatial-temporal range of their impact.
Causal Disaster CategoryConsequential Disaster CategoryTime Intervals (day)Spatial
Distance (km)
Rainstorms Floods, Collapses, Landslides, Debris flows, Tornados 21200
HeatwavesDroughts35200
DroughtsSandstorms, Heatwaves601000
Snow disasterFreezing damage7100
Cold wavesFreezing damage, Glaze ice, Fog disaster, Gales, Snow disasters, Storm surges, Frosts, Hails141000
Continuous rainy daysFloods, Debris flows, Landslides, Freezing damage, Collapses40500
TyphoonsRainstorms, Gales, Thunder and lightning, Storm surges, Tornados141000
Gales Sandstorms7500
Storm surgesFloods71000
Table 3. Overview of frequent subgraphs with multiple edges.
Number of Frequent Subgraphs
All103
Contain rainstorm103
Contain flood103
Contain gale84
Contain typhoon79
Contain drought2
Contain continuous rainy days1
Contain debris flow1
Contain landslide1
Disclaimer/Publisher’s Note: The statements, opinions and data contained in all publications are solely those of the individual author(s) and contributor(s) and not of MDPI and/or the editor(s). MDPI and/or the editor(s) disclaim responsibility for any injury to people or property resulting from any ideas, methods, instructions or products referred to in the content.

