Article

Intelligent Text Mining for Ontological Knowledge Graph Refinement and Patent Portfolio Analysis—Case Study of Net-Zero Data Center Innovation Management

1
Department of Industrial Engineering and Engineering Management, National Tsing Hua University, Hsinchu 300, Taiwan
2
Science and Technology Policy Research and Information Center, National Applied Research Laboratories, Taipei 106, Taiwan
*
Author to whom correspondence should be addressed.
Information 2024, 15(7), 374; https://doi.org/10.3390/info15070374
Submission received: 20 May 2024 / Revised: 15 June 2024 / Accepted: 25 June 2024 / Published: 28 June 2024
(This article belongs to the Special Issue Knowledge Graph Technology and its Applications II)

Abstract

:
Ontological knowledge graph (OKG) is a well-formed visual representation that depicts knowledge organization in formal elements (e.g., entities and attributes) and their interrelationships. OKG is crucial for innovation management analysis as it provides a clear boundary to understand complex knowledge domain in detail. In the patent analysis field, it facilitates the definition of a well-defined patent portfolio, aiming for accurate and complete patent retrievals and subsequent analyses. In recent decade, the rapid growth of the information and communication technology (ICT) sector has rendered data centers (DCs) indispensable for data processing, storage, and cloud computing, while ensuring security and privacy during DC operations. However, their energy-intensive operations pose challenges to global efforts toward achieving net-zero emissions goals. In response, this research develops a formal OKG refinement process and uses DC net-zero technology OKG as case study for in-depth OKG refinement and application in patent portfolio analysis. The net-zero DC domain covers five sub-technologies. Utilizing the proposed OKG refinement and patent portfolio analysis framework, the 1801 most recent decade’s patents related to relevant “DC net-zero technologies” are retrieved and analyzed. Particularly in this case, DC colocation and server-as-a-service perspectives are the newly discovered sub-domains for OKG refinement. Furthermore, the research also adopts the technology function matrix and technology maturity to assess current and future technology development trends, providing crucial insights supporting strategic innovation management.

1. Introduction

Ontological knowledge graph (OKG) is a meticulously structured visual representation designed to organize and depict knowledge through formal components, which include entities, attributes, and the intricate interrelationships among these components [1]. The concept draws inspiration from “ontology,” which standardizes abstract domain-specific concepts, converting them into formal knowledge systems for human and machine understanding and interchanges [2]. The process of systematically gathering, integrating and representing knowledge within a specific domain is referred to as “ontology engineering” [3]. Establishing OKG can provide a clear definition for the knowledge scope under study, assisting in the creation of a coherent research framework, particularly for innovative knowledge management.
A data center (DC) is a specially designed physical facility used for storing, managing, and processing large amounts of data and information, constituting a part of the modern information technology infrastructure. Typically, it consists of large-scale computer systems, servers, network equipment, and storage devices, along with necessary cooling, power supply, and physical security facilities [4]. DCs play an indispensable role in various industry chains, especially in the information and communication technology (ICT) related industries, yet their significant energy consumption has been widely discussed in recent years. According to a report in 2024, global DC electricity consumption had already reached 460 terawatt-hours (TWh), with a forecasted increase to 650 to 1050 TWh by 2026 [5], indicating the substantial energy consumption of DCs. In response to this, the European Union (EU) issued an Energy Efficiency Directive in 2023, which explicitly states that, starting from May 15 2024, all DC owners and operators within the EU must report their energy performance for the previous year annually. The EU plans to inspect and compile the collected data and publish a report by 2025 to enhance the performance of DCs and reduce their environmental impact [6].
Net-zero emissions refer to achieving a balance between the amount of greenhouse gas emissions generated by human activities and the amount removed from the atmosphere. Net-zero emissions do not imply complete elimination of emissions, but signify a concerted effort to minimize anthropogenic greenhouse gas emissions to the greatest extent possible [7]. Within the realm of net-zero emissions in DCs, numerous innovative technologies have emerged, many of which are being realized through patents. Patents play a crucial role in technology development and equitable dissemination, providing inventors with proprietary rights and legal protection [8].
The research begins by conducting an exhaustive literature review focusing on DC net-zero technologies. Subsequently, an OKG is systematically constructed, consolidating pertinent technologies and establishing a clear framework for the research domain, and also serving as the basis for conducting the patent retrieval strategy. Through major patenting trend analysis, trends related to net-zero technologies in DC, such as major patent assignees, trends in patent publication years, and the context of related developments, can be depicted. Additionally, natural language processing (NLP) techniques (e.g., patent clustering, keyword extraction, topic modeling) are employed for enhancing domain OKG, by integrating the results and mapping to the initial OKG, making this a more comprehensive technical framework for the research domain. After the refinement of the OKG, we conduct further critical analysis of relevant patents, including the prediction of the related technologies’ maturity by s-curve, as well as identifying patent hotspots and cold spots by TFM, aiming to provides important references for relevant academic and research institutions, and enabling related enterprises to strategically position themselves through early patent layout.

2. Literature Review

This section offers a comprehensive literature review and synthesis of diverse analytical methodologies slated for future analysis, encompassing OKG, keyword extraction, clustering, topic modeling, and technology maturity analysis. In addition to elucidating the underlying principles of each method, recent pertinent research utilizing these techniques is also delineated.

2.1. Ontological Knowledge Graph (OKG)

The term “ontology” carries different meanings across various fields. Gruber views ontology as a science aimed at standardizing abstract or vague concepts as well as domain-specific concepts, thereby transforming them into knowledge systems that are understandable to humans [9].
An OKG, also known as an ontology graph, or ontology map, serves as a meticulously crafted visual depiction, delineating the intricate tapestry of knowledge within a given domain, offering a structured framework for comprehending the depth and breadth of a complex knowledge domain. In research related to innovative knowledge and technology management, OKG often serve as a crucial method and tool, supporting many analyses, including patent portfolio analyses, in various knowledge domains. For instance, some researchers commence their research by constructing an OKG of the research domain through a comprehensive literature review, which serves as a foundational basis for subsequent patent retrieval and analysis. However, subsequent refinements of the OKG after its initial establishment are lacking [10,11,12,13], i.e., viewed as a critical research gap. This research’s objective is to overcome the research gap. Some of the recent OKG research is found to emphasize machine learning and NLP text mining techniques to generate the OKG in various knowledge representations [14,15] as well as employing intelligent ontology-based patent analyses [16,17,18,19].

2.2. Keyword Extraction

Keyword extraction is a core technique for filtering out important information from a large volume of text-based documents, either automated or semi-automated, for effectively unearthing key concepts, themes, or focal points from the body of text. As listed in Table 1, keyword extraction (from text) techniques can be broadly categorized into three main categories; (1) simple statistical methods, (2) linguistic methods, and (3) machine learning methods [20].
In recent patent mining research, KeyBERT is a popular method for keyword extraction. KeyBERT is an unsupervised keyword extraction approach, which is capable of extracting semantically meaningful keywords, thereby enhancing the quality of information extraction from textual data [21]. For example, Trappey et al. [22] employed KeyBERT and normalized term frequency (NTF) to conduct a bibliometric study of the United Nations Sustainable Development Goals (SDGs), aiming to observe the current research publication trends and directions for SDGs among developed and developing economies.

2.3. Clustering Method

The clustering method emphasizes the partitioning of a dataset into multiple sub-sets (or groups), ensuring higher similarity among data points within the same group and lower similarity between different groups. Clustering methods can be broadly categorized into two types, i.e., hard clustering and soft clustering [23]. Hard clustering involves partitioning data such that each data item belongs to only one cluster, like K-means, hierarchical clustering, or density-based clustering; on the other hand, soft clustering allows data points to potentially belong to multiple clusters; this approach includes methods such as Gaussian mixture models, fuzzy C-means, and model-based clustering.
In the research, K-means is a classical and popular algorithm for clustering. K-means is an unsupervised clustering technique used to group data based on similarity. The objective of K-means is to partition the data into k distinct clusters, where the value of k needs to be predefined, aiming for data points within each cluster to be similar to each other while being dissimilar to those in other clusters [24]. K-means is commonly applied in text clustering, where texts are grouped into different categories based on thematic or content similarity. In the related research, Trappey et al. [25] utilized advanced techniques to condense request for quotation (RFQ) documents, first applying N-gram TF–IDF to extract key terms from RFQ and automatically extract basic specifications, then employing K-means algorithm to cluster sentences associated with each specification, producing concise RFQ summaries.

2.4. Topic Modeling

Topic modeling is a statistical model used for analyzing text data. The main objective of topic modeling is to identify the latent topic structure inherent in these extensive text collections [26]. The topic modeling technique can be divided into two main types: probabilistic generative models and information-theoretic models. We will introduce two well-known topic models from each category, Latent Dirichlet Allocation (LDA) and Correlation Explanation (CorEx).
LDA is a probabilistic generative model for topic modeling. It assumes that documents are mixtures of latent topics, which are characterized by a distribution of key words. These keywords are commonly used for document semantic clustering, topic discovery and their information retrieval [27]. For instance, collected relevant patent data on Cyber-Physical Systems (CPS) and solar energy technology innovations, respectively, are retrieved and topic modeling using LDA is deployed for in-depth patent portfolio analyses [18,28].
CorEx is an unsupervised information-theoretic model used for learning latent factors from data. It captures correlations between variables to identify the most informative and non-redundant factors. It is versatile and applied in tasks like topic modeling, feature selection, and dimensionality reduction [29]. In the relevant research, Trappey et al. [11,12] developed a system for technology mining and exploration based on relevant patents and non-patent literature in the B5G domain. They used CorEx, combined with keyBERT for keyword extraction, aiming to grasp multiple underlying themes within extensive patent datasets. Further, Ounacer et al. [30] utilized CorEx for sentiment analysis of reviews from travel websites, such as Booking and TripAdvisor, aiming to assist consumers in better understanding the reviews on these travel websites.

2.5. Technology Maturity Analysis

Technology maturity analysis is employed to depict the evolution of various domains and is recognized as a crucial tool for understanding the dynamics of product and technological development [31]. The concept of technology maturity originates from the product life cycle, which typically comprises four stages: introduction, growth, maturity, and decline [32]. During the introduction stage, the growth of technology and product numbers is typically slow; in the growth stage, technology and product numbers exhibit exponential growth; during the maturity stage, the growth of technology and product numbers gradually slows down; if technology lacks further development or innovation, it will eventually decline.
Technology maturity analysis is commonly applied in patent research across various domains [33,34,35]. It initially involves the statistical compilation of patent data within a specific technological field to calculate the cumulative publication numbers. These data are then utilized to construct an S-curve model, which serves as a tool to assess the current state of technological development in the field and to forecast future trends, grounded in the logistic growth model, which can be articulated using the formula below:
P x = L 1 + e k ( x x 0 )
where P x denotes the output or predicted value for a given input x , L represents the maximum value or the upper limit of the function, k indicates the slope or steepness of the curve, and x 0 specifies the inflection point of the curve, where the growth rate shifts from increasing to decreasing.

3. Methodology

Figure 1 illustrates the system architecture flowchart for the research, detailing the step-by-step processes and methods adopted for patent portfolio analysis. This approach is generically applicable to other technology domains. After determining the research topic, non-patent literature references are collected to construct the OKG, forming the basis for development of a patent retrieval strategy. Initial patent trend analysis used data visualization to explore the innovation trends and directions in the given domain. Text mining techniques then refined the OKG by comparing results with literature reviews. Furthermore, the technology function matrix (TFM) and technology maturity s-curve assessed current and future development trends, offering an in-depth exploration of hotspots and trends in relevant patent technologies from both macro and micro perspectives.

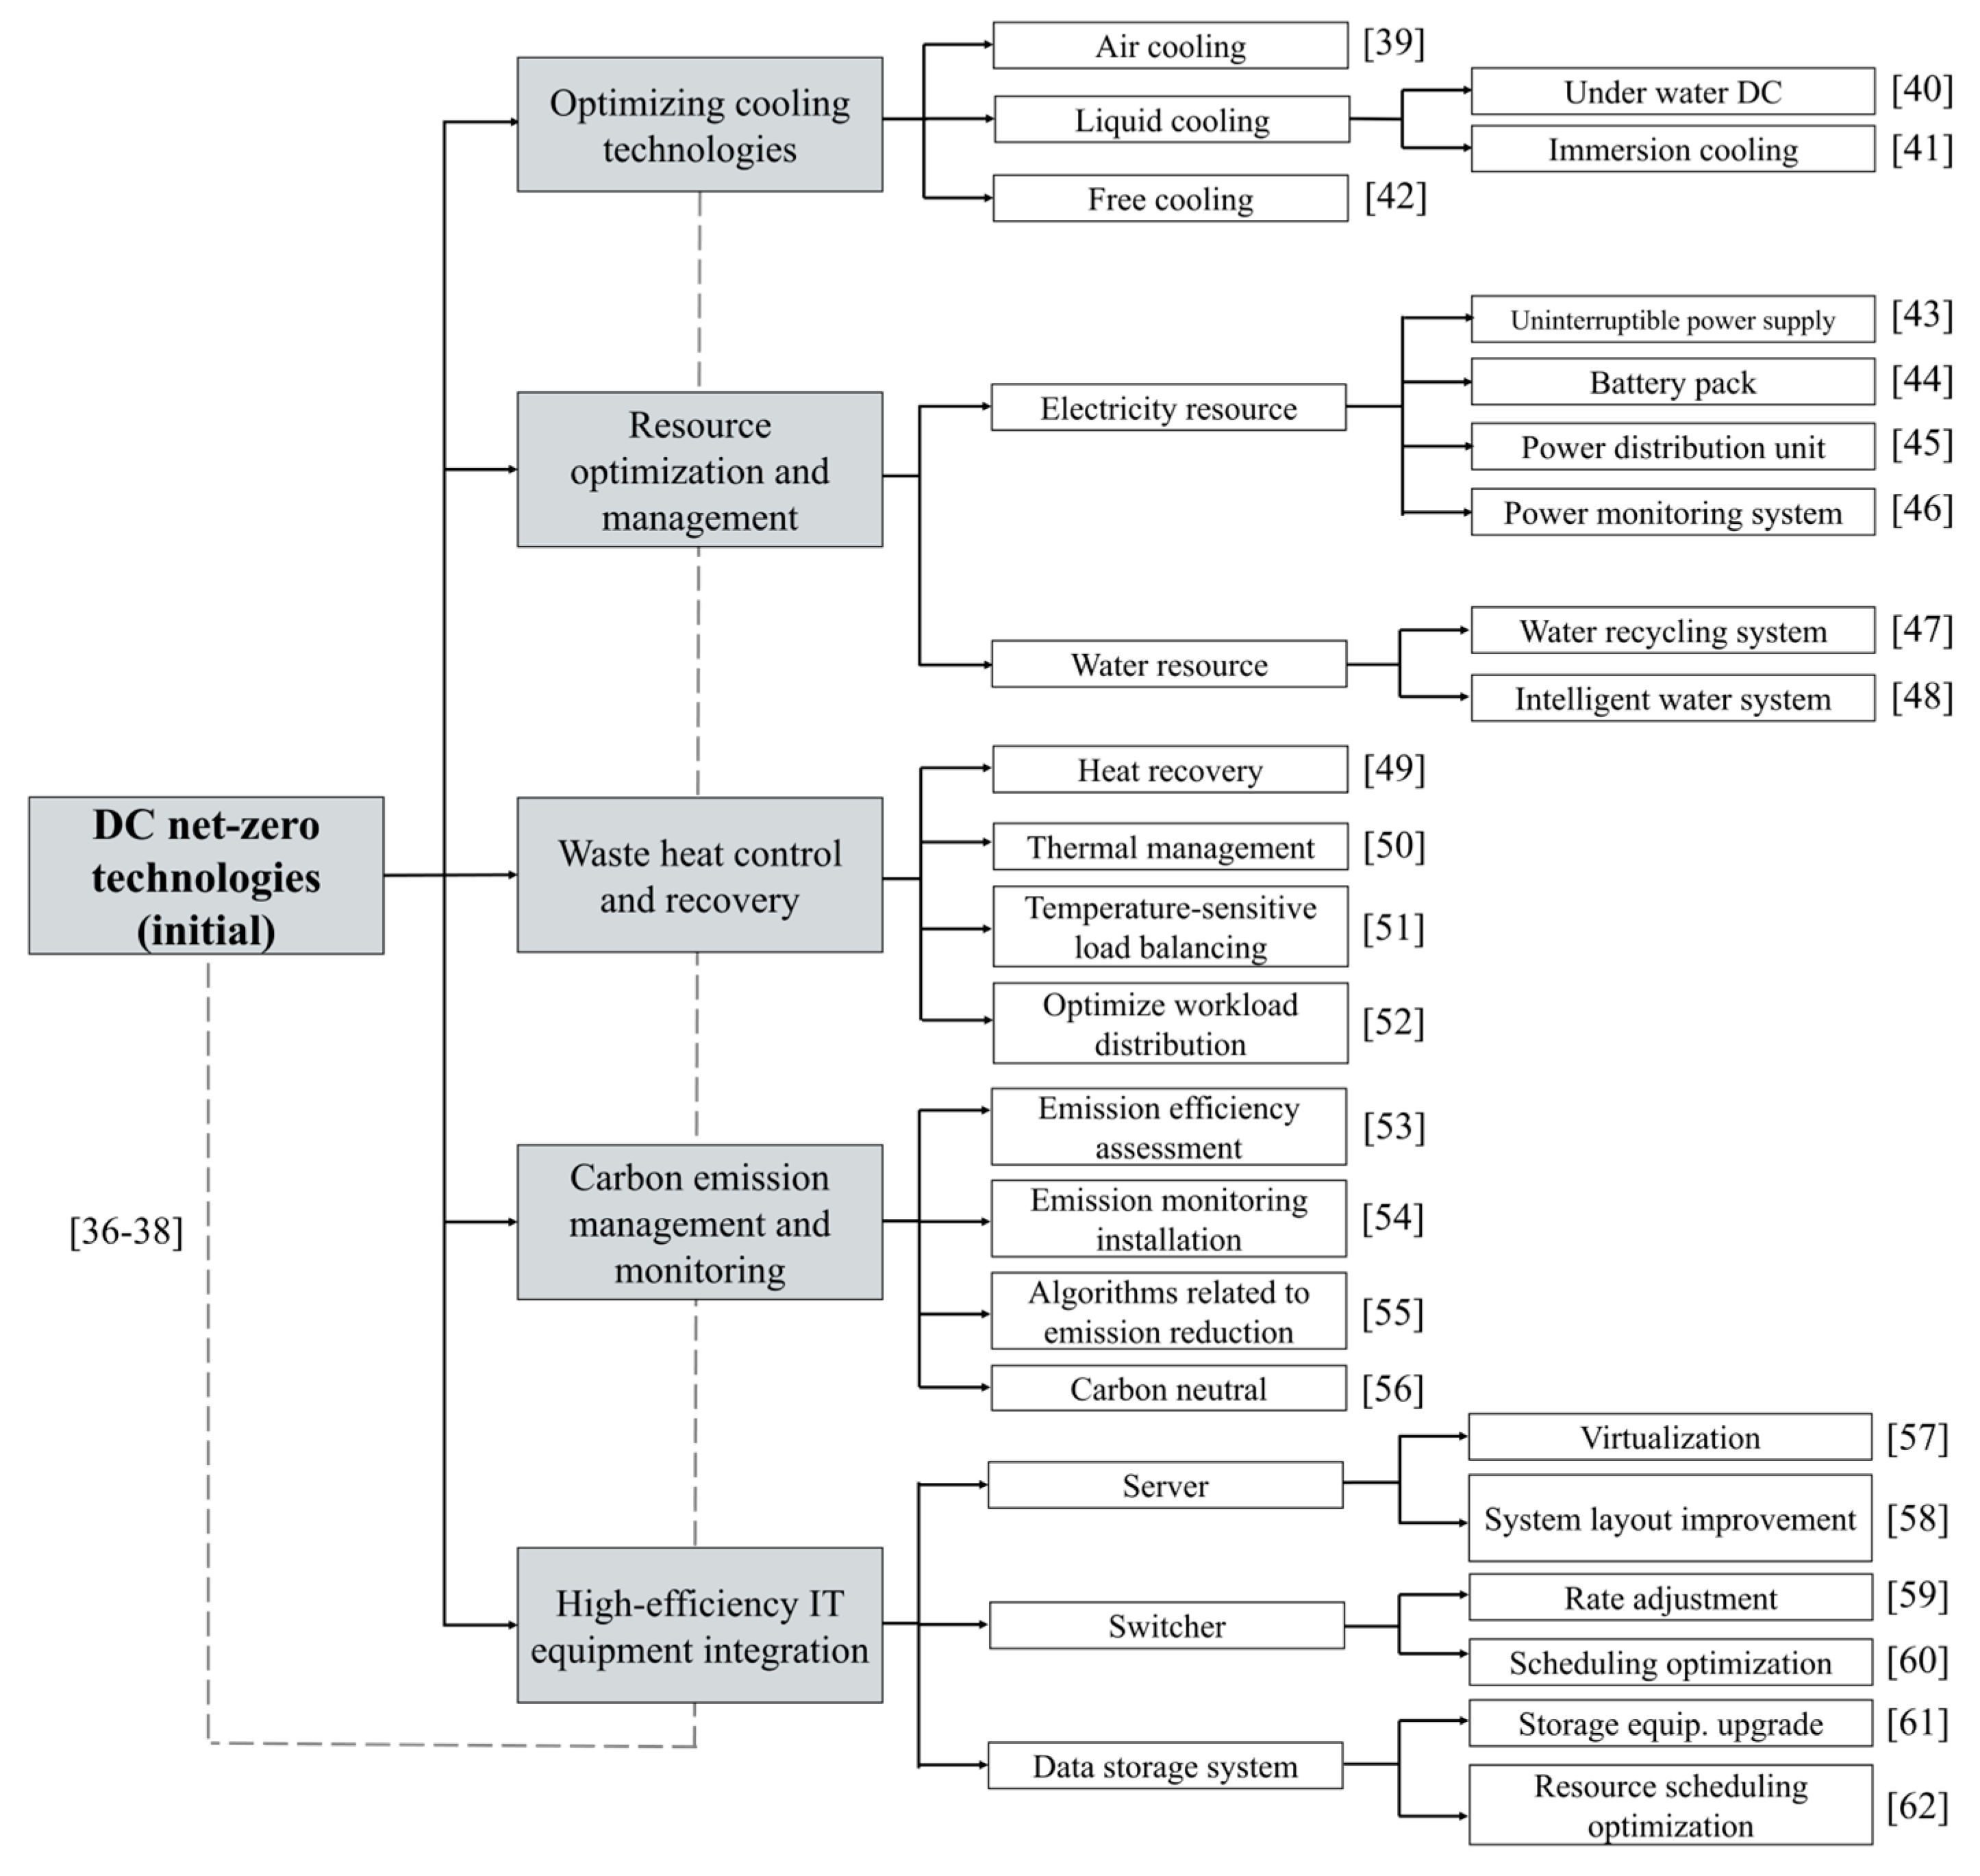
3.1. DC Net-Zero Technologies’ OKG Construction

As a high-energy-consuming industry, DCs have increasingly significant environmental impacts. In recent years, the growing global attention to net-zero emissions has underscored the importance of DC sustainability, attracting widespread research interest from academia. Hoosain et al. [36] emphasize that achieving net-zero emissions in DCs hinges on improving energy efficiency, enhancing sustainability, and reducing carbon footprints. The research also incorporates the United Nations SDGs, highlighting the importance of water resource management and the use of renewable energy in achieving net-zero goals. Jin et al. [37] delve into green DCs, which are relevant to achieving net-zero objectives, including energy efficiency improvement to reduce consumption, enhancing resource utilization through resource management and cloud computing, reducing energy consumption through thermal management techniques, and establishing green DC assessment standards to achieve energy efficiency and carbon emission reduction. Cao et al. [38] propose key indicators to enhance the sustainability and future outlook of DCs; these indicators include energy efficiency, cooling management efficiency, power supply chain efficiency, and environmental impact.
The synthesis of the aforementioned literature serves as a crucial foundation for establishing the OKG for the research. The OKG we constructed considers the DC as a core object, and conceptually defines its major sub-technologies centered on how the object will achieve the goal of net- or near-zero emission. The OKG scope of consideration includes the technologies and functions for building DCs, while optimizing natural resource utilization with minimal carbon footprint. It covers five main sub-technologies: optimizing cooling technologies, resource optimization and management, waste heat control and recovery, carbon emission management and monitoring, and the integration of high-efficiency IT equipment (as shown in Figure 2).
Optimizing cooling technology is crucial for DCs; this includes exploring more efficient liquid cooling techniques. The main cooling methods used in DCs are air cooling, liquid cooling, and free cooling. Air cooling is widely used due to its simplicity and low operating costs, but it is less efficient [39]. Liquid cooling is highly effective, lowering equipment temperatures by circulating cooling fluid; for instance, the underwater DC proposed by Microsoft offers cost-effective cooling, promotes renewable energy use, and improves overall performance [40]. Immersion cooling is a type of liquid cooling, which submerges servers in non-conductive liquid to dissipate heat without additional cooling parts [41]. Free cooling harnesses outdoor temperatures to reduce energy consumption and carbon emissions, enhancing energy efficiency and environmental sustainability [42].
Resource management and optimization in DCs encompass both power and water resource management. Power resource management consists of several key components, uninterruptible power supply (UPS) providing power backup to ensure continuous operation in the event of a primary power failure. This swiftly switches to battery power to prevent data loss and equipment failures, ensuring high reliability [43]. Generators serve as backup power sources during prolonged outages, while battery arrays store energy for short-term use, guaranteeing smooth transitions [44]. Power distribution units (PDUs) allocate primary power to various DC equipment and systems, ensuring a stable and balanced power supply, thus enhancing power utilization efficiency [45]. Power monitoring systems track energy consumption, power distribution, and energy efficiency in real-time, enabling DC managers to make informed energy adjustments and optimization measures [46]. Water resource management includes water recycling systems and smart water management systems. Water recycling systems recycle and treat wastewater generated by DCs, reducing reliance on fresh water, minimizing water consumption and emissions. Smart water management systems, powered by data and advanced technology, monitor, control, and optimize water usage in DCs in real-time. By collecting water resource data through sensors and monitoring devices, these systems utilize artificial intelligence and data analytics to achieve water conservation and optimization goals [47,48].
In an operational DC generating significant amounts of heat, the objective of heat management and recovery is to capture this generated heat under appropriate conditions and then reuse it to reduce the energy consumption and heat emissions of the DC, which can be achieved through various means. Heat recovery aims to capture the heat generated during DC operation and reuse it, for example, for heating or other energy needs, thereby reducing energy wastage [49]. Dynamic thermal management is a real-time method of monitoring and adjusting the temperatures of various devices and components in DCs, adjusting the operation of cooling systems according to actual requirements and load conditions to ensure that equipment operates within a safe temperature range while minimizing energy wastage [50]. Temperature-aware load balancing is an optimization strategy aimed at distributing the workload across different servers in a DC to achieve temperature balance, ensuring uniform temperature distribution across all servers and thereby improving cooling efficiency [51]. Workload distribution optimization is a process aimed at distributing different workloads across different servers in the DC to achieve optimal resource utilization and balance, reducing energy consumption and cooling requirements by minimizing the overuse of certain servers [52].
DCs need to establish comprehensive carbon emission monitoring systems, set emission targets, and conduct regular carbon footprint assessments. Carbon emission efficiency assessments measure emissions generated during energy consumption and operations, informing corresponding emission reduction strategies [53]. Carbon accounting monitoring devices are employed to monitor and record carbon emissions in real-time, aiding DCs in accurately tracking their emission levels [54]. Carbon reduction algorithms optimize energy usage and emissions by intelligently adjusting equipment operation and optimizing energy consumption and supply [55]. Carbon neutrality technologies aim to offset carbon emissions generated by DCs, utilizing methods such as carbon capture and storage or implementing carbon offset projects to achieve carbon neutrality goals [56].
High-efficiency IT equipment integration can reduce energy consumption and carbon emissions while maintaining the same workload. The use of virtualization technology is crucial for achieving high efficiency, as multiple virtual servers can run on the same physical server, thereby increasing hardware resource utilization [57]. Optimizing server deployment also plays a significant role in improving efficiency by reducing heat dissipation requirements and saving energy [58]. Adjusting switch rates and optimizing switch scheduling are important strategies for improving efficiency, and unnecessary energy waste in network devices can be minimized [59,60]. Upgrading storage devices is also part of achieving net-zero carbon goals, ss next-generation storage technologies typically offer higher efficiency, larger capacities, faster data access speeds, and reduced energy consumption and space occupancy [61]. Optimizing and scheduling equipment resources is another important strategy for improving efficiency, dynamic resource allocation and scheduling to ensure that DC resources are optimally utilized [62].

3.2. Patent Data Retrieval Strategy Design

This research focuses on the patent analysis of DC net-zero technologies. In formulating the patent retrieval strategy, three major keyword combinations were included, along with restrictions on the number of patent families (≥3) and publication year (2014 to 2023). The detailed patent retrieval strategy formulated in this research (search on Derwent Innovation) is as follows:
TID = (Datacenter or data ADJ center or datacenter or data ADJ center or datawarehouse or data ADJ warehouse) AND ALL = (Server or Storage SAME equipment or Storage SAME device or Switcher or CPU or GPU or hard ADJ disk or hard ADJ drive or Memory or Register or IT ADJ Equipment or Cooling or cold or air ADJ condition or Cooler or Fluorine ADJ pump or compute or Electricity or Power or Transformer or Compressor or Energy SAME storage or Water or Sewage SAME recycling or Recycled NEAR5 material or Heat or Green SAME Building) AND ALL = ((Netzero or net ADJ zero or zero ADJ emission or eco-friendly) or ((Carbon or CO2) NEAR5 (neutral or capture or storage or footprint or Monitoring or calculation or credit or emission)) or ((Reduce or decrease or decline or low or efficient) NEAR5 (resource or waste or cost or consumption or electricity or water or Energy or Carbon or contamination or pollution or emission)) or (energy SAME (Renewable or clean or Sustainable or recycle or green)) or energy-efficient or ((responsibility) NEAR5 (enterprise or social)) or Circular NEAR5 Economy or Climate or Sustainability or Waste ADJ Heat ADJ Recovery);
The patent retrieval strategy primarily comprises three components, each interconnected with the Boolean operator “AND”, indicating that the retrieved patent data must concurrently satisfy all components. Within the three components, keywords are connected with the Boolean operator “OR,” indicating that the retrieval of relevant patent data requires the satisfaction of at least one keyword within each component, resulting in a total of 1971 relevant patents. Subsequently, these patents underwent manual reading and screening, where the titles, abstracts, and claims were reviewed to eliminate patents not within the scope of this research. During the screening process, 1801 patents that met the criteria of this research were retained, and these patent data will be utilized for further analysis in this research.

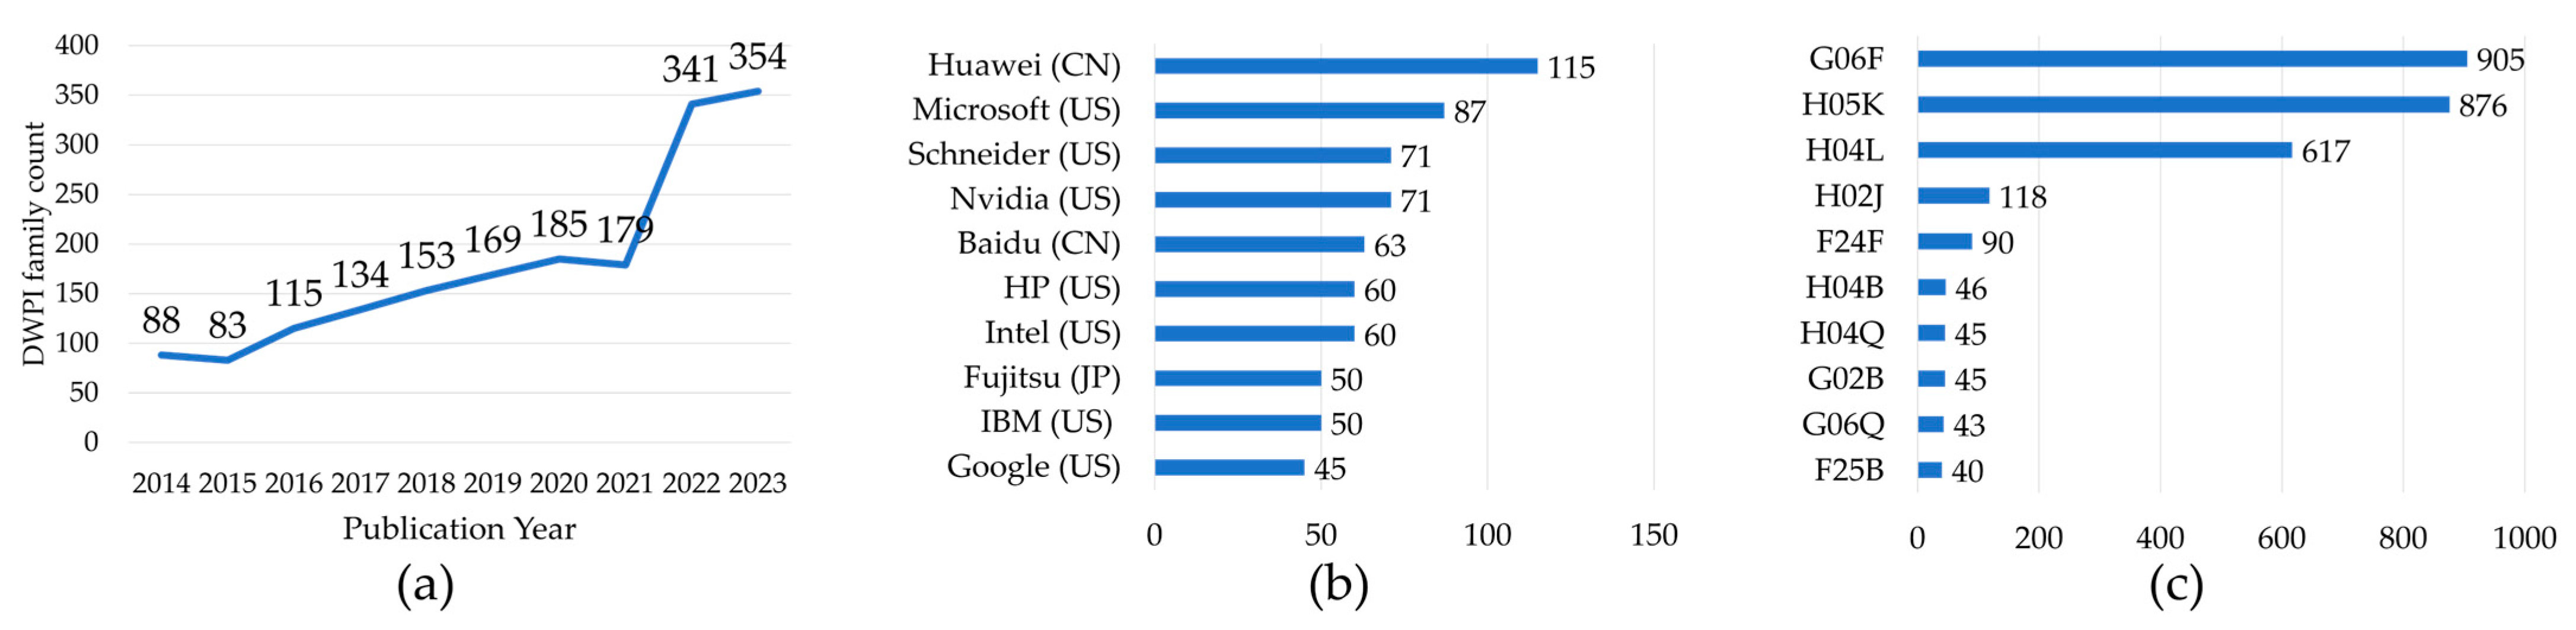
3.3. Major Patenting Trend Analysis

Major patenting trend analysis involves the comprehensive examination and interpretation of data within a broad and holistic context; this approach typically emphasizes overarching trends, overall relationships, and aggregate performance, while paying less attention to localized, individual, or granular details. Its primary objective is to offer a comprehensive perspective, enabling decision-makers to better comprehend the overall landscape, thereby facilitating the formulation of corresponding strategies and policies. This analysis encompasses data organization, cleansing, visualization, and in-depth interpretation to unveil underlying patterns and correlations. Specific analyses included trends in patent publication years, major patent assignees, and CPC classifications.

3.4. Clustering and Topic Modeling for Enhancing Domain OKG

In clustering and topic modeling for enhancing domain OKG, preprocessing was applied to the retrieved patent dataset. Subsequently, K-means clustering was employed, KeyBERT was utilized for keyword extraction, and CorEx was used for topic modeling. Finally, based on the synthesis of all results, refinement of OKG was performed.
  • Combination of K-means Clustering and KeyBERT Keyword Extraction
In this research, we developed a specific patent document clustering process. Initially, text preprocessing was conducted to filter out stop words defined in this research. Subsequently, SpaCy, a natural language processing package, was employed to lemmatize parts of speech and convert English words into their base forms. Following this, the sklearn package in Python was utilized to perform TF–IDF vectorization, transforming the textual data into feature values. Finally, the number of clusters was determined based on the results of the elbow method, and the K-means clustering algorithm was employed for further data analysis. After performing K-means clustering, KeyBERT keyword extraction is employed with the aim of extracting keywords from each cluster of patents, aiming to ascertain the technical themes represented by each cluster. The keyword extraction process generated results for both 1-g and 2-g keywords.
  • CorEx Topic Modeling
This research developed and implemented a CorEx topic modeling process. It incorporated both 1-g and 2-g word combinations to capture more meaningful phrases. Subsequently, the textual data was transformed into numerical format. For each extracted topic, the program listed the associated keywords along with their corresponding weights.
Furthermore, the CorEx topic results were mapped back to the clustering results obtained from K-means to enhance the interpretability of the text analysis. By associating each topic with one or more clusters, a deeper understanding of the technological categories and contents represented by each cluster was achieved. Finally, this result was cross-referenced and validated against the OKG originally constructed in this research, reinforcing the robustness of the ontology framework.

3.5. Critical Patent Portfolio Analysis Based on Refined OKG

The purpose of critical patent portfolio analysis is to delve deeper into the hotspots of patent development and the maturity of patent technologies within specific domains. This analytical approach combines TFM and technology maturity analysis (s-curve) to gain insights into the patent innovation trends across various fields.
  • KeyBERT-based Technology Function Matrix (KeyBERT-based eTFM)
This research employs and optimizes a method known as the computer-aided technology function matrix (eTFM) to analyze patent data [63]. The eTFM utilizes the computational power and data processing capabilities of computers to automatically and quickly identify patents (and the patent count) under each technology/function (or efficacy) combination. The research utilizes KeyBERT, an NLP-based model, in patent-text mining for keyword extractions [11]. The identified keywords for each patent are then utilized to find matching technology- and function-categories for eTFM’s patent distribution counts [12].
To begin, preparation of patent datasets (including each patent’s title, abstract, and claims) and technology/function datasets (including each technology/function’s descriptions based on the related literature review) is necessary. Programming will be utilized to first extract keywords from both the patent dataset and the technology/function dataset using KeyBERT, acquiring keywords for each patent and technology/function. After confirming the generated keywords, the score is calculated for the match between patents and technologies/functions, by summing up the scores of overlapping keywords and then dividing by the total keyword score. As a result, a relevance score ranging from 1 to 0 is obtained, indicating the score of correlation between patents and technologies/functions, it can be expressed by the following equation:
S c o r e   P , T / F = D u p l i c a t e   k e y w o r d s   s c o r e   T o t a l   k e y w o r d s   s c o r e
Subsequently, considering the threshold value, binary processing is conducted. If the score is greater than or equal to the threshold, the patent is considered relevant to a specific technology/function and labeled as 1; conversely, if less than the threshold, it is deemed irrelevant and labeled as 0, resulting in the generation of a binary matrix, which can be expressed by the following equation:
B P n ,   T i = 1 ,   i f   S c o r e P n ,   T i   θ   0 ,   o t h e r w i s e B P n ,   F j = 1 ,   i f   S c o r e P n ,   F j   θ   0 ,   o t h e r w i s e
Finally, the multiplication of the binary matrix T’s transpose matrix (TT, an i × n matrix) and the function matrix F (an n × j matrix) yields the final Technology-Function matrix (T × F matrix):
T × F i k = n = 1 n T i n T × F n k
  • Technology Maturity Analysis
In conducting a technology maturity analysis using s-curve, it is essential not only to consider the annual cumulative number of publications, but also to precisely define three critical parameters ( L , k , x 0 ). In the related research, the parameters are mostly generated by Loglet Lab’s “guess parameters” function [64,65,66] or by using statistical software [67,68].
The research conducts a s-curve analysis based on the clustering results of patents. Initially, the cumulative number of patents published annually is compiled for each cluster. Subsequently, through the examination of relevant literature, technical reports, and publicly available information, specific technological clusters’ actual development stages are understood, and preliminary assumptions are made regarding these clusters, hypothesizing whether they are in the early, middle, or late stages of development. Different initial parameters are assigned to clusters at different stages. For instance, in the early stages of technology, parameters, such as saturation value (L), are set higher, the inflection point (x0) is set further away from the current time, and the growth rate (k) is set higher to capture potential growth opportunities. This flexible approach allows for adaptation to the specific circumstances of different technological clusters, enhancing the accuracy and reliability of predictions.
In order to fit the Logistic model to the dataset, residual sum of squares (RSS) is defined as the loss function, which is used to measure the difference between the model’s predicted values and the actual data values, which can be represented by the following formula:
R S S = i = 1 n y i P x i 2 = i = 1 n e i 2
where y i represents the i-th observed value, and P x i denotes the model’s predicted value at the i-th observation point.
When refining the models, we leverage a method called gradient descent to iteratively adjust our model’s parameters. By calculating the gradient of the RSS with respect to a given parameter, we obtain the direction in which the parameter should be adjusted to reduce the RSS; this is based on the derivative of the RSS, which for a small step h can be approximated as follows:
R S S θ   f θ + h f θ h 2 h
This approximation aids in updating the parameters effectively. For a parameter θ, the gradient descent step can be represented as:
θ n e w = θ o l d α R S S
where α is the learning rate, which controls the size of each update step; R S S is the gradient vector of RSS with respect to the parameter θ (which can be L , k , or x 0 ). Through the above process, the optimal parameter to minimize the loss function can be calculated, and then the s-curve can be simulated.

4. Discover Enhanced OKG and Patent Analysis—Case of Net-Zero DC Innovations

This section analyzes the collected patent data (1801 patents) in the domain of net-zero DC innovations. The analysis commences with an examination of the overarching patent trends, subsequent to which the validation and refinement of OKG are undertaken, culminating in a more granular exploration of patent data from diverse perspectives.

4.1. Major Patenting Trend Analysis

Based on the trend in patent publications for each year, we observe a continuous increase in the number of related patents published globally each year. The upward trajectory underscores an increasing focus on DC net-zero technologies, prompting a rise in patent applications (as shown in Figure 3a).
Figure 3b shows the top 10 patent (family) assignee distribution. The top three assignees are Huawei, Microsoft, and Schneider. Huawei is a provider of information and communication technology infrastructure and smart devices. In recent years, Huawei has been increasing its investment in net-zero DC technology and resources, collaborating with many enterprises to build green DCs. Reducing carbon emissions in DCs has been a proactive goal for Microsoft; for instance, Microsoft has established an underwater-operated DC in Scotland, utilizing seawater to lower temperatures and reduce energy consumption, thereby minimizing carbon emissions. Schneider Electric focuses on creating future-ready DCs with sustainable value, high efficiency, excellent adaptability, and high flexibility.
Figure 3c displays the distribution of the top ten CPC categories in global patent data related to net-zero DCs. Among these, G06F, H05K, and H04L dominate. G06F covers electronic data processing, including control, input, imaging, and object electronic data processing. H05K encompasses cooling, heat dissipation, and structural components of electronic equipment. H04L relates to networks, wireless communications, and information transmission.

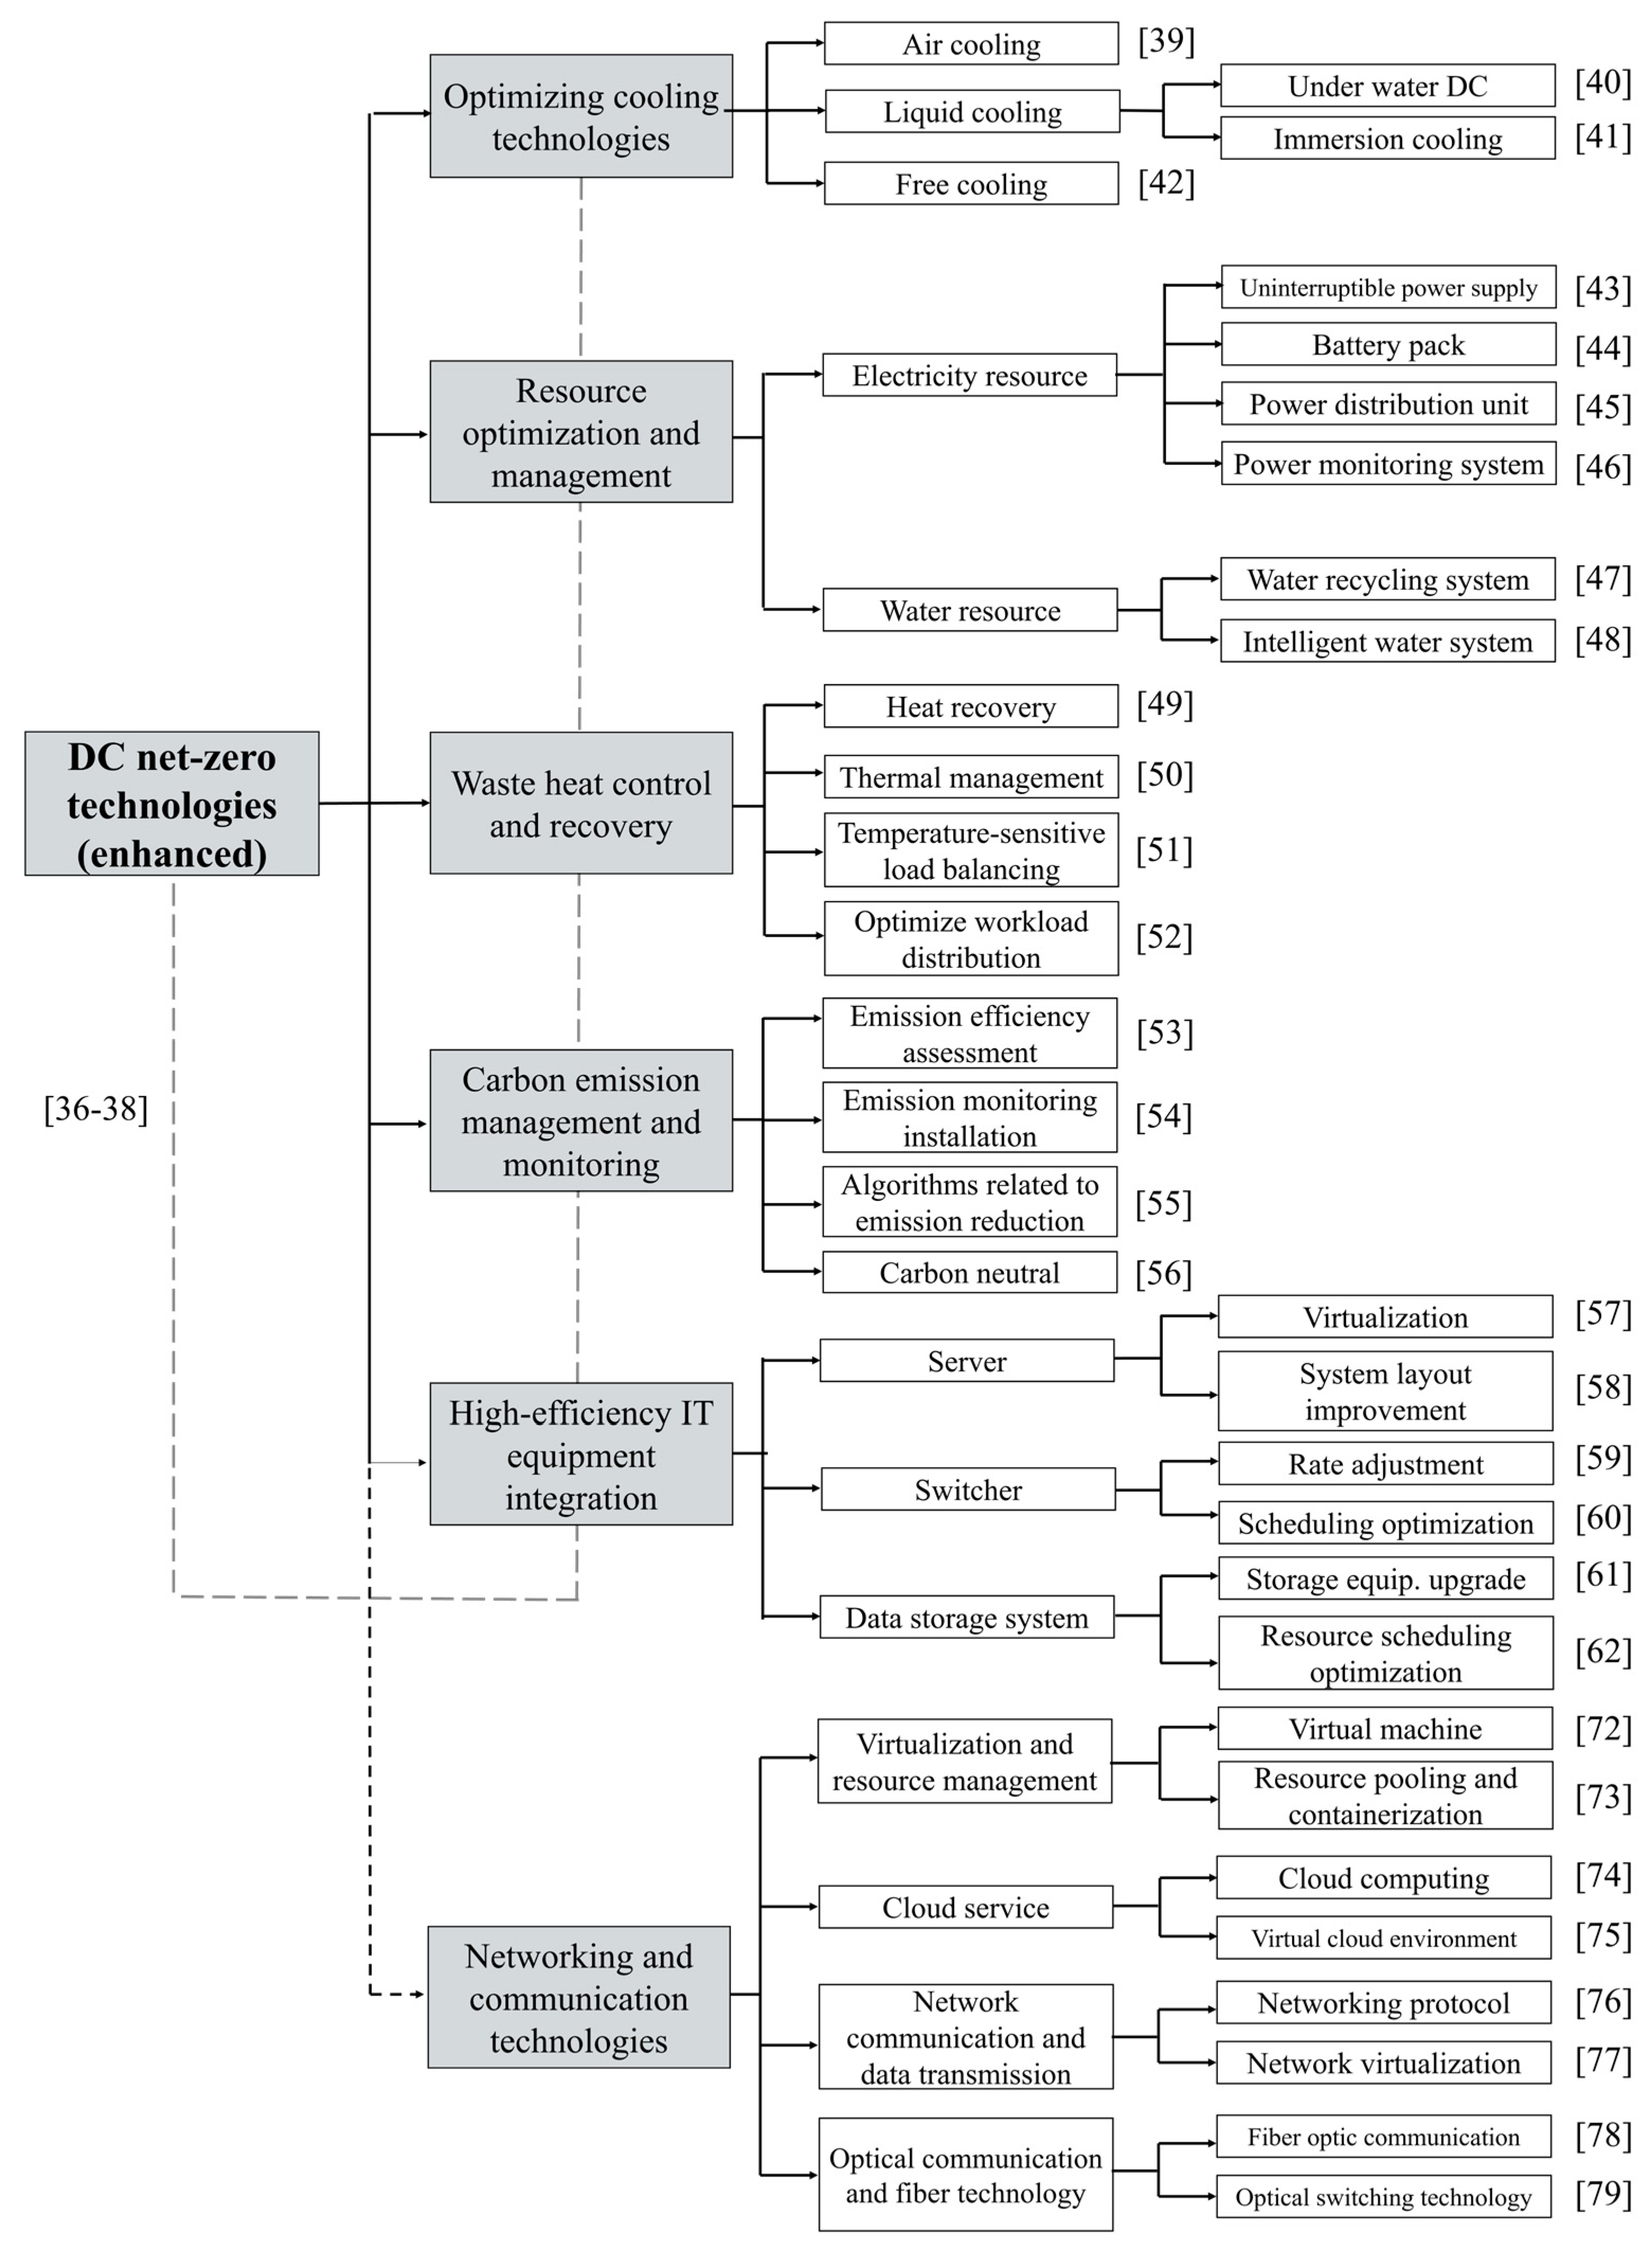
4.2. Clustering and Topic Modeling for Enhancing Domain OKG

The present research uses both the “title” and “abstract” of each retrieved patent as input data. By employing the elbow method, the optimal number of clusters was determined. The result indicated a prominent elbow point at k = 5, suggesting that the patent dataset should be divided into five clusters. Subsequently, each cluster’s patents underwent keyword extraction. Table 2 presents the clustering results, keyword extraction results, and their respective interpretations of the patent dataset. Notably, since the original clusters 3 and 4 overlap conceptually in technologies related to cooling and heat control, patents in these two clusters are merged as cluster 3 for further TFM and technology maturity analyses.
Table 3 presents the results of topic modeling while using CorEx. After multiple parameter adjustments and optimizations, the optimal outcome consisted of 10 topics. Each topic is identified by a topic number, a description, and keywords. It is important to note that the topic model may result in some topics sharing similar or identical keywords, leading to high similarity or even overlap between topics. However, this phenomenon also reflects the interconnected concepts and themes within the field of DC net-zero technologies.
Figure 4 compares clustering and topic modeling analysis results (in clean nodes) with the initial OKG (in gray nodes). The initial OKG aligns well with most analysis results, validating its effectiveness in explaining and organizing. However, there is a cluster of technologies, particularly in networking and communication (cluster 4), not adequately covered in the initial OKG, which entails a different focus from our initial construction aimed at maintaining DC and achieving net-zero goals, and involves DC-provided services to users to assist them in reducing their carbon footprint and thereby achieving net-zero emissions. Enhancing the OKG to address this gap would better reflect the diversity of technologies and ensure comprehensive coverage and explanation of relevant concepts (in dotted nodes). When DC utilization falls below a certain threshold, a portion of the equipment remains idle, leading to significantly lower overall energy efficiency [69]. Resource sharing in DC involve providers or operators offering solutions to customers to achieve net-zero practices. As a result, recent developments have led to the emergence of commercial models, such as Platform-as-a-Service (PaaS), Infrastructure-as-a-Service (IaaS), Software-as-a-Service (SaaS), Server-as-a-Service and the data center colocation model. Amazon AWS, Microsoft Azure, and Google Cloud offer a range of such services with significant impact [70]. In response to this rapid growing business model, the development of net-zero DC related technologies, such as virtualized servers, cloud computing, and robust communication methods, e.g., wireless communication integrated with fiber optics, are crucial [71]. Therefore, these sub-domains (T3, T4, T7, T8) are identified and newly added after extensive text mining using clustering and topic modeling (as shown in Figure 5). These additional sub-domains are indeed very crucial from the perspectives of DC net-zero technologies in Server-as-a-Service implementation.
Further, Figure 5 shows the results of the enhanced OKG, aiming to address technological gaps in DC net-zero technologies for Server-as-a-Service.
Virtualization technology allows the virtualization of physical hardware resources in DCs, such as servers, storage, and networking, creating a virtual server environment. Resource pooling integrates different hardware resources into a shared pool, allocating them to various applications or workloads as needed, reducing waste and enhancing resource flexibility. Containerization facilitates lightweight and portable deployment and management of applications, enhancing flexibility and scalability [72,73]. Cloud computing services provide computing, storage, networking, and application services through remote servers, offering flexibility in resource allocation, cost reduction, and performance improvement. Virtual cloud environments built upon cloud computing allow flexible management and configuration of computing resources to meet varying workload demands, simplifying IT infrastructure management [74,75]. Networking protocols ensure effective communication between different devices, with TCP/IP serving as the core protocol for reliable data transmission. Network virtualization enables the creation of multiple virtual independent network environments on a single physical network infrastructure, enhancing resource sharing, security, and network configuration simplicity [76,77]. Fiber optic communication transmits data signals using optical pulses through fiber optic cables, offering high-speed, long-distance, and high-capacity data transmission with low latency and energy consumption. Optical network architectures leverage optical technology for high-speed, scalable, and reliable data transmission, supporting large-scale DCs and long-distance communication. Optical switching technology enables data routing and switching in optical fiber networks, achieving high-speed optical communication [78,79].

4.3. Critical Patent Portfolio Analysis Based on Refined OKG

This section uses critical patent analysis tools to provide further insight into domain patent data, including TFM and s-curve technology maturity analysis. TFM is a commonly utilized tool in patent analysis, by leveraging text mining and NLP techniques [28,80], it has effectively overcome drawbacks associated with resource intensiveness and time consumption, and has emerged as a potent and robust tool widely applied across various domains for patent analysis. S-curve technology maturity analyses the development trend of each sub-technology under the relevant domain and is widely used in patent analysis and literature analysis in various fields [10,12].
  • KeyBERT-based eTFM Analysis
In KeyBERT-based eTFM analysis, the selection of technologies (T) primarily stems from the OKG, clustering, and topic modeling results, while functions (F) were filtered based on their relevance to net-zero emissions. Setting the threshold at 20%, Table 4 shows the result of eTFM: T1—Cooling and heat recovery technology obtained the highest cumulative score for technology, while F1—Energy efficiency achieved the highest cumulative score for efficacy, indicating their significance. Patent hotspots were observed in T1—cooling and heat recovery technology and F1—enhanced energy efficiency. As global attention on reducing carbon footprints and addressing climate change continues to rise, enhancing energy efficiency and developing energy recovery technologies have become critical strategies. These technologies not only aid in reducing energy waste and improving system efficiency but also promote the utilization of green energy, thereby supporting global sustainable development goals.
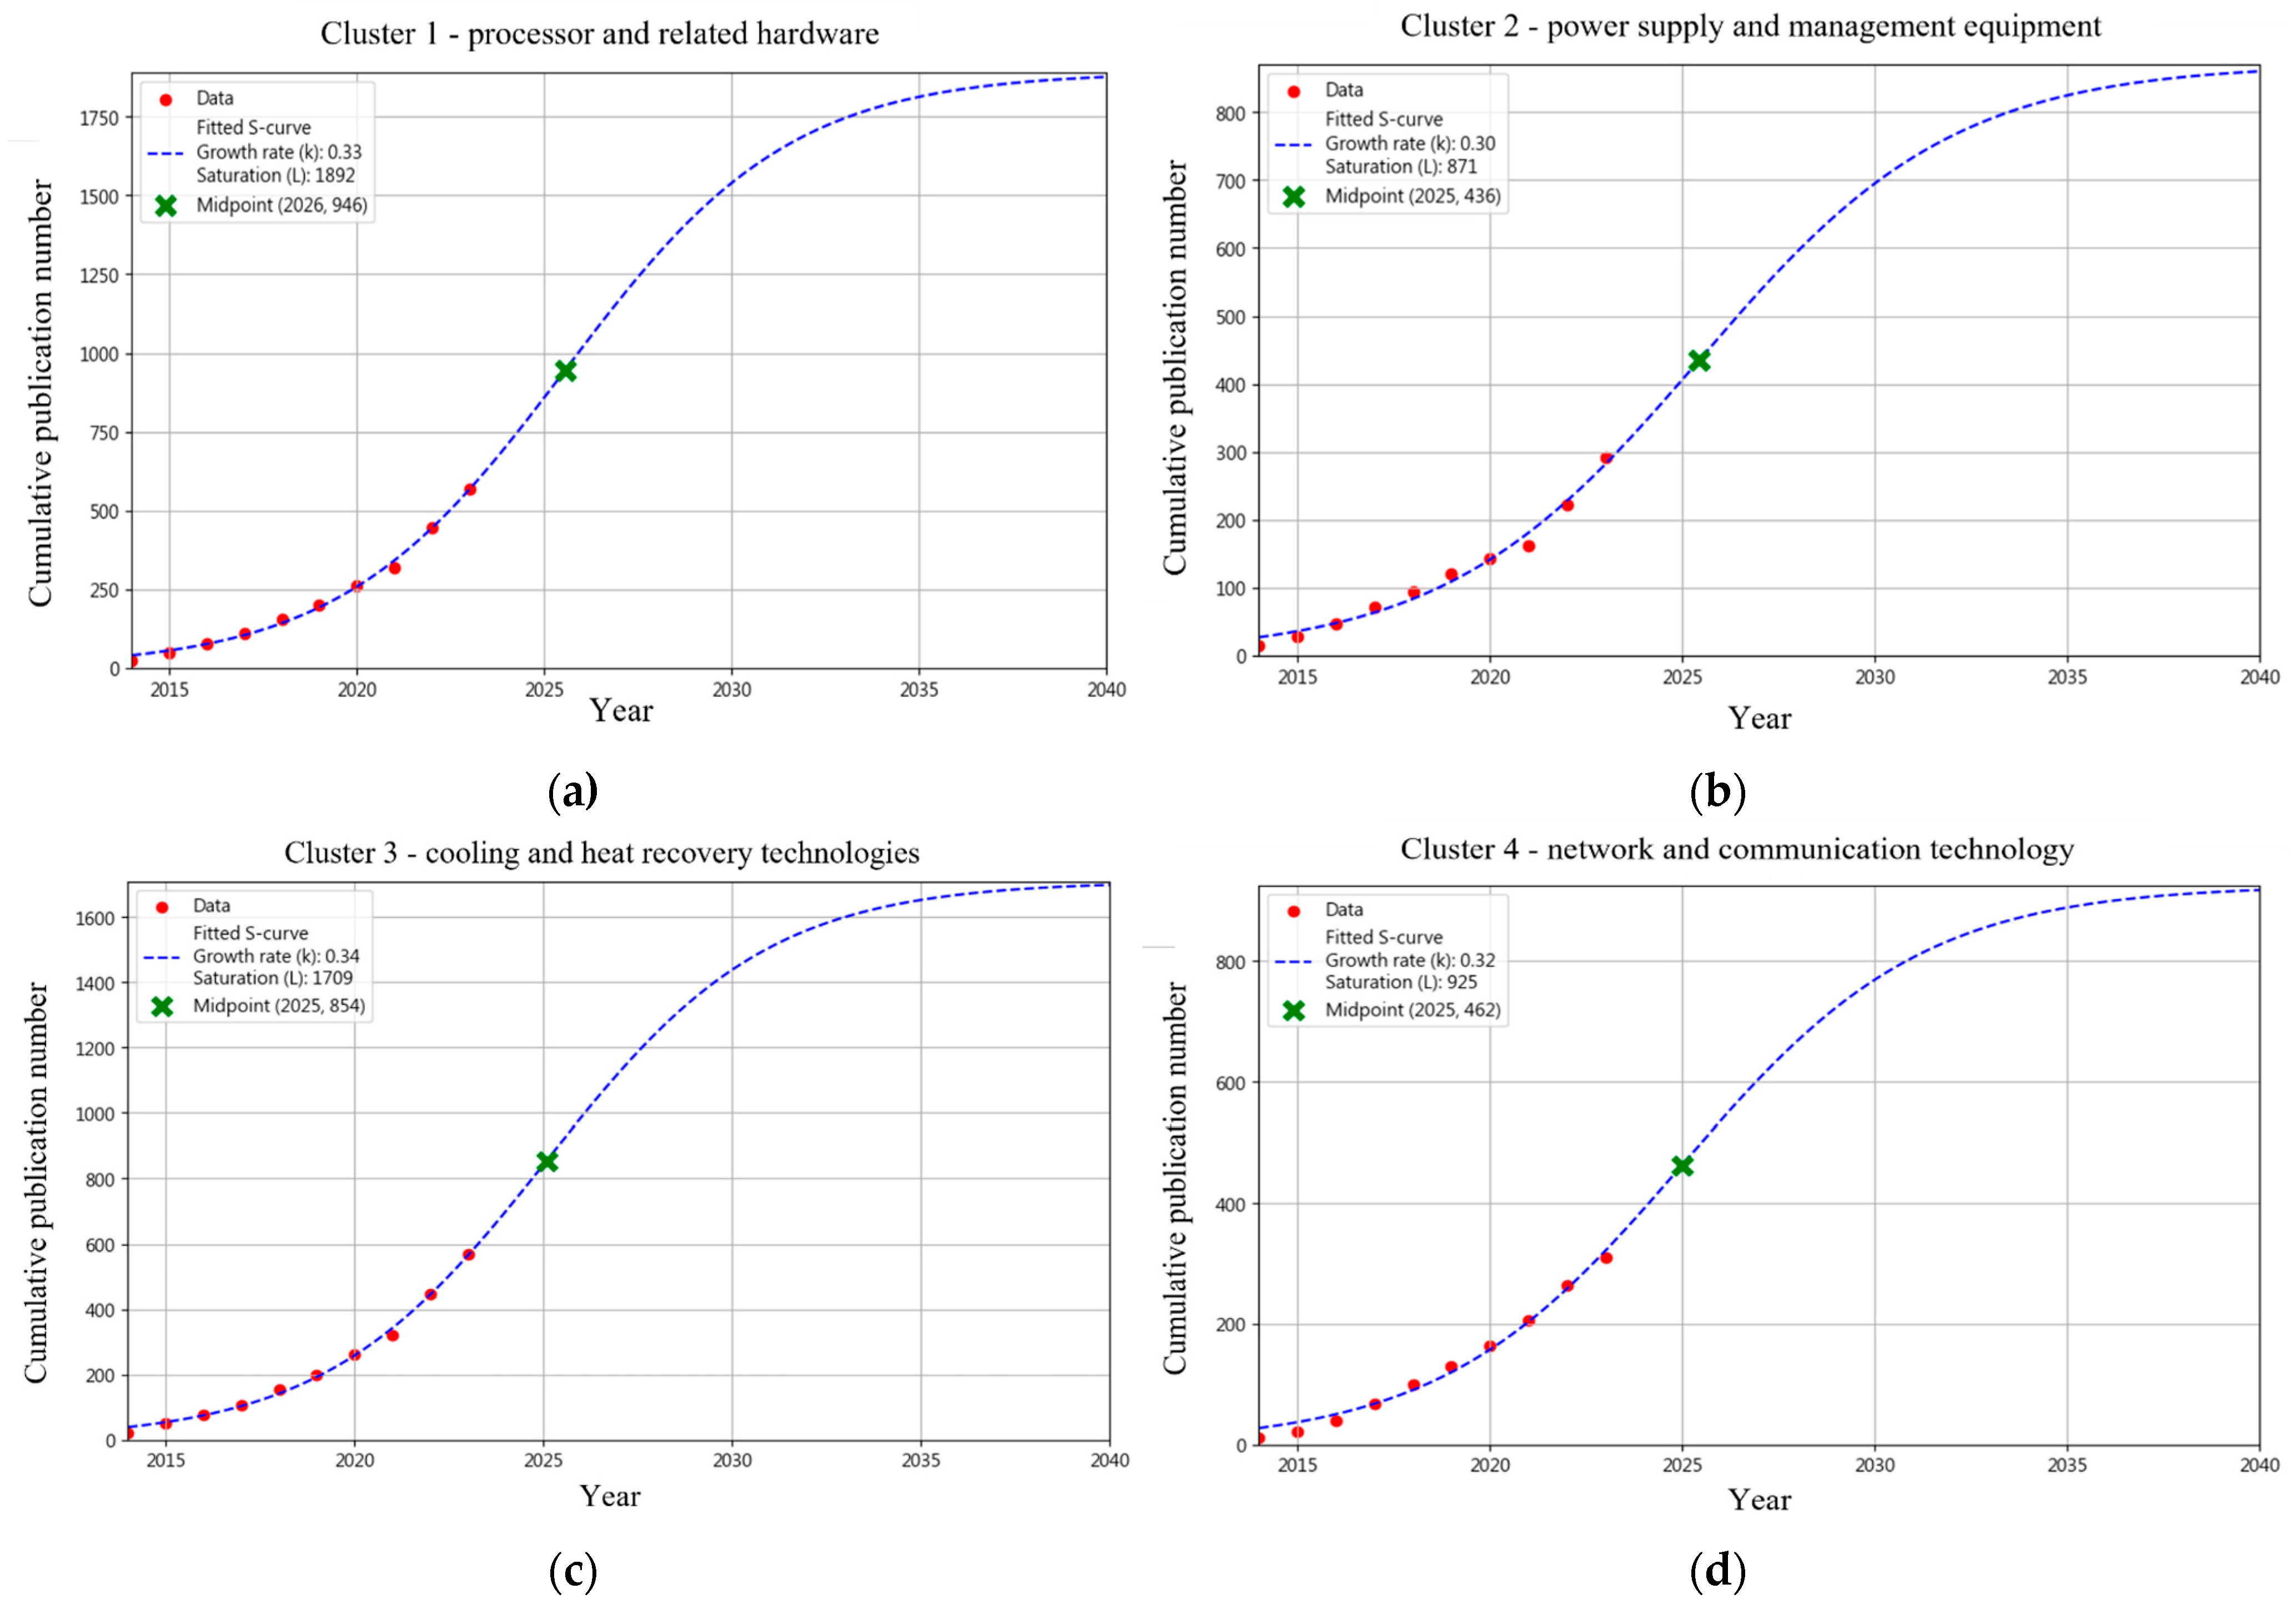
  • Technology Maturity Analysis (s-curve)
In this section, the results of patent K-means clustering will be analyzed by s-curve technology maturity analysis for each patent cluster. The first is cooling and heat recovery technology (C3). According to the latest market analysis, cooling technologies for DCs are experiencing rapid growth, anticipating that by 2030 the market value will surpass $560 billion, with a compound annual growth rate (CAGR) of 17.1%. This growth is primarily driven by the increasing demand for energy-efficient solutions and substantial planned investments [81]. Various market reports indicate that trends such as digital transformation, cloud computing services, and artificial intelligence in the Asia-Pacific region will serve as significant drivers for the rapid expansion of DC infrastructure; government initiatives aimed at reducing the carbon footprint of high-power density facilities are also propelling the development of cooling technologies [82,83]. Based on the collected references, assuming the current technological development stage is in its early phases, this suggests that these technologies are expected to reach maturity by 2025, indicating that they are currently in the later stages of growth. During this phase, companies may be evaluating different cooling technologies to find the most suitable solutions for their needs (shown in Figure 6c).
Subsequently, an analysis was conducted of DC processors and related hardware (C1), power supply and management equipment (C2), and network and communication technologies (C4). According to various references, the CAGR of server racks and network racks in DCs is projected to be 11.25% from 2023 to 2027. Additionally, IT equipment (including server equipment, storage equipment, and network equipment) is expected to experience a CAGR of 9.09% from 2022 to 2027; it is estimated that DC equipment will reach $164.36 billion by 2031, with a CAGR of 13.2% from 2023 to 2031 [84,85]. Based on all the aforementioned references, it is assumed that the current technological development status of these technology clusters is in the early stages. Figure 6 depicts the maturity analysis results for these clusters; it can be observed that these three clusters have not yet reached their midpoint, indicating that they are still in the growth phase.

5. Conclusions, Limitations and Future Works

This research has established a comprehensive patent analysis framework based on OKG, encompassing a process refinement for OKG. Initially, we constructed a detailed OKG centered on DC net-zero technologies, serving as a clear research boundary and basis of patent retrieval strategy. Through major patenting trend analysis, we obtained a comprehensive understanding of the development trends and directions in specific technological domains. Subsequently, we further corroborated that the OKG, when grounded in natural language processing models of text mining, enables a more objective observation and understanding of specific issues. This approach contrasts with the initial construction of the OKG, which was predominantly influenced by the subjective interpretations of researchers, and facilitates a more holistic representation of the issues under the DC net-zero technologies’ domain. In the critical patent portfolio analysis, we employed a natural language model-based keyword extraction method to develop the eTFM algorithm, aiming to leverage the rapid and objective analysis capabilities of computers to swiftly identify the development status of patents under specific technologies/functions. Moreover, based on actual technological status and patent data, we developed the S-curve algorithm to more accurately assess the development stages and trends of technologies. The framework we established not only elucidates the current patent landscape but also sets the stage for future advancements in patent analysis.
While this research offers valuable insights into the refinement of ontological knowledge graphs and, subsequently, patent portfolio analysis for DC net-zero technologies, it is important to acknowledge several limitations that may influence the interpretation and generalization of the results. The following points highlight specific areas where constraints are encountered and some strategies for overcoming the limitations.
(a)
Data sources and scope: This study utilized data from international journal literature search systems, including IEEE, Google Scholar, and Innovation Q+, as well as the patent search system Derwent Innovation. The data scope may still be limited by the coverage and indexing of these databases. Future research can expand the search to include additional literature databases (e.g., Scopus, WoS, etc.)
(b)
Limitations in predictive analysis: The S-curve model for technology maturity is based on historical data and current trends, making it inherently uncertain. It may not account for unexpected breakthroughs, market shifts, regulatory changes, or geopolitical influences. Such factors could rapidly alter technology development trends. Complementing patent analyses with qualitative analysis of these issues is essential for a more comprehensive understanding.
(c)
Subjectivity in OKG construction: The initial construction of the OKG was influenced by the subjective interpretations of the researchers during the literature review. Despite subsequent efforts using text mining and NLP models to enhance objectivity, the initial bias may still affect the overall findings and interpretations. To mitigate this, we propose specific future research directions outlined in the following paragraph.
Future works in improving OKG construction and refinement (to reduce subjective biases) require integrating advanced machine learning approaches and NLP modeling. One promising approach is leveraging large language models (LLMs), such as GPT, BERT, BART, or BLOOM to assist in OKG, construction and refinement. These models can process vast amounts of text data (including text in multi-languages), identify relevant concepts, and establish relationships between them with minimal human intervention. Moreover, the use of LLMs can be extended to improve eTFM process. Consequently, this would enhance the precision, comprehensiveness, and efficiency of patent portfolio analyses across various technical domains.

Author Contributions

Conceptualization, A.J.C.T.; Methodology, A.J.C.T. and G.-B.L.; Writing—Original Draft, A.J.C.T. and G.-B.L.; Writing—Review and Editing, A.J.C.T. and L.-P.H., Funding Acquisition, A.J.C.T.; Project Administration, A.J.C.T.; Literature Review, G.-B.L.; Investigation, G.-B.L. and L.-P.H.; Data Curation, G.-B.L.; Visualization, G.-B.L.; Formal Analysis, G.-B.L.; Validation, L.-P.H. All authors have read and agreed to the published version of the manuscript.

Funding

This research was partially funded by National Science and Technology Council (NSTC, Taiwan) individual research grant (Grant No.: MOST 111-2221-E-007-050-MY3).

Institutional Review Board Statement

Not applicable.

Informed Consent Statement

Not applicable.

Data Availability Statement

The original contributions presented in the study are included in the article.

Conflicts of Interest

The authors declare no conflicts of interest.

References

  1. Paulheim, H. Knowledge graph refinement: A survey of approaches and evaluation methods. Semant. Web 2017, 8, 489–508. [Google Scholar] [CrossRef]
  2. Staab, S.; Studer, R. “What Is an Ontology?”, Handbook on Ontologies; Springer Science & Business Media: Berlin/Heidelberg, Germany, 2013; pp. 1–17. [Google Scholar]
  3. Mizoguchi, R.; Ikeda, M. Towards ontology engineering. J.-Jpn. Soc. Artif. Intell. 1998, 13, 9–10. [Google Scholar]
  4. Arregoces, M.; Portolani, M. Data Center Fundamentals; Cisco Press: Indianapolis, IN, USA, 2003. [Google Scholar]
  5. IEA. Available online: https://iea.blob.core.windows.net/assets/6b2fd954-2017-408e-bf08-952fdd62118a/Electricity2024-Analysisandforecastto2026.pdf (accessed on 20 March 2023).
  6. Datacenter Dynamic. Available online: https://www.datacenterdynamics.com/en/news/european-energy-efficiency-directive-published-with-mandatory-data-center-reporting/ (accessed on 20 March 2023).
  7. Fankhauser, S.; Smith, S.M.; Allen, M.; Axelsson, K.; Hale, T.; Hepburn, C.; Kendall, J.M.; Khosla, R.; Lezaun, J.; Mitchell-Larson, E.; et al. The meaning of net-zero and how to get it right. Nat. Clim. Change 2022, 12, 15–21. [Google Scholar] [CrossRef]
  8. Strandburg, K.J. Users as innovators: Implications for patent doctrine. Univ. Colo. Law Rev. 2008, 79, 467. [Google Scholar] [CrossRef]
  9. Gruber, T.R. A translation approach to portable ontology specifications. Knowl. Acquis. 1993, 5, 199–220. [Google Scholar] [CrossRef]
  10. Trappey, A.J.; Lin, G.B.; Chen, H.K.; Chen, M.C. A comprehensive analysis of global patent landscape for recent R&D in agricultural drone technologies. World Pat. Inf. 2023, 74, 102216. [Google Scholar]
  11. Trappey, A.J.; Wei, A.Y.; Chen, N.K.; Li, K.A.; Hung, L.P.; Trappey, C.V. Patent landscape and key technology interaction roadmap using graph convolutional network–Case of mobile communication technologies beyond 5G. J. Inf. 2023, 17, 101354. [Google Scholar] [CrossRef]
  12. Trappey, A.J.; Pa, R.J.; Chen, N.K.; Huang, A.Z.; Li, K.A.; Hung, L.P. Digital transformation of technological IP portfolio analysis for complex domain of satellite communication innovations. Adv. Eng. Inform. 2023, 55, 101879. [Google Scholar] [CrossRef]
  13. Trappey, C.V.; Wu, H.Y.; Taghaboni-Dutta, F.; Trappey, A.J. Using patent data for technology forecasting: China RFID patent analysis. Adv. Eng. Inform. 2011, 25, 53–64. [Google Scholar] [CrossRef]
  14. Arcan, M.; Manjunath, S.; Robin, C.; Verma, G.; Pillai, D.; Sarkar, S.; Dutta, S.; Assem, H.; McCrae, J.P.; Buitelaar, P. Intent Classification by the Use of Automatically Generated Knowledge Graphs. Information 2023, 14, 288. [Google Scholar] [CrossRef]
  15. Zafeiropoulos, N.; Bitilis, P.; Tsekouras, G.E.; Kotis, K. Evaluating Ontology-Based PD Monitoring and Alerting in Personal Health Knowledge Graphs and Graph Neural Networks. Information 2024, 15, 100. [Google Scholar] [CrossRef]
  16. Trappey, A.J.; Trappey, C.V.; Chang, A.C. Intelligent extraction of a knowledge ontology from global patents: The case of smart retailing technology mining. Int. J. Semantic Web Inf. Syst. 2020, 16, 61–80. [Google Scholar] [CrossRef]
  17. Trappey, A.J.; Liang, C.P.; Lin, H.J. Using machine learning language models to generate innovation knowledge graphs for patent mining. Appl. Sci. 2022, 12, 9818. [Google Scholar] [CrossRef]
  18. Trappey, A.J.; Chen, P.P.; Trappey, C.V.; Ma, L. A machine learning approach for solar power technology review and patent evolution analysis. Appl. Sci. 2019, 9, 1478. [Google Scholar] [CrossRef]
  19. Trappey, A.J.; Trappey, C.V.; Liang, C.P.; Lin, H.J. IP Analytics and Machine Learning Applied to Create Process Visualization Graphs for Chemical Utility Patents. Processes 2021, 9, 1342. [Google Scholar] [CrossRef]
  20. Bharti, S.K.; Babu, K.S. Automatic keyword extraction for text summarization: A survey. arXiv 2017, arXiv:1704.03242. [Google Scholar]
  21. Khan, M.Q.; Shahid, A.; Uddin, M.I.; Roman, M.; Alharbi, A.; Alosaimi, W.; Almalki, J.; Alshahrani, S.M. Impact analysis of keyword extraction using contextual word embedding. PeerJ 2022, 8, e967. [Google Scholar] [CrossRef] [PubMed]
  22. Trappey, C.V.; Trappey, A.J.; Lin, H.J.; Chang, A.C. Comparative Analysis of Food Related Sustainable Development Goals in the North Asia Pacific Region. Food Ethics 2023, 8, 21. [Google Scholar] [CrossRef]
  23. Petrus, J. Soft and Hard Clustering for Abstract Scientific Paper in Indonesian. In Proceedings of the 2019 International Conference on Informatics, Multimedia, Cyber and Information System (ICIMCIS), Jakarta, Indonesia, 24–25 October 2019; IEEE: New York, NY, USA, 2019; pp. 131–136. [Google Scholar]
  24. Bock, H.H. Clustering methods: A history of k-means algorithms. In Selected Contributions in Data Analysis and Classification; Springer: Berlin/Heidelberg, Germany, 2007; pp. 161–172. [Google Scholar]
  25. Trappey, A.J.; Chang, A.C.; Trappey, C.V.; Chien, J.Y.C. Intelligent RFQ summarization using natural language processing, text mining, and machine learning techniques. J. Glob. Inf. Manag. 2022, 30, 1–26. [Google Scholar] [CrossRef]
  26. Blei, D.; Lafferty, J. Correlated topic models. Adv. Neural Inf. Process. Syst. 2006, 18, 147. [Google Scholar]
  27. Blei, D.M.; Ng, A.Y.; Jordan, M.I. Latent dirichlet allocation. J. Mach. Learn. Res. 2003, 3, 993–1022. [Google Scholar]
  28. Trappey, A.J.; Trappey, C.V.; Govindarajan, U.H.; Jhuang, A.C. Construction and validation of an ontology-based technology function matrix: Technology mining of cyber physical system patent portfolios. World Pat. Inf. 2018, 55, 19–24. [Google Scholar] [CrossRef]
  29. Gallagher, R.J.; Reing, K.; Kale, D.; Ver Steeg, G. Anchored correlation explanation: Topic modeling with minimal domain knowledge. Trans. Assoc. Comput. Linguistics 2017, 5, 529–542. [Google Scholar] [CrossRef]
  30. Ounacer, S.; Mhamdi, D.; Ardchir, S.; Daif, A.; Azzouazi, M. Customer Sentiment Analysis in Hotel Reviews Through Natural Language Processing Techniques. Int. J. Adv. Comput. Sci. Appl. 2023, 14, 569–579. [Google Scholar] [CrossRef]
  31. Adamuthe, A.C.; Thampi, G.T. Forecasting Technology Maturity Curve of Cloud Computing with its Enabler Technologies. J. Sci. Res. 2020, 64, 239–246. [Google Scholar] [CrossRef]
  32. Kotler, P. Marketing Management, 11th ed.; Prentice-Hall: Upper Saddle River, NJ, USA, 2003. [Google Scholar]
  33. Coccia, M.; Roshani, S. Technological Phases of Quantum Technologies Driving Long-Term Development. 2023. Available online: https://www.researchsquare.com/article/rs-2942054/v1 (accessed on 14 January 2024).
  34. Ampah, J.D.; Jin, C.; Fattah, I.M.R.; Appiah-Otoo, I.; Afrane, S.; Geng, Z.; Yusuf, A.A.; Li, T.; Mahlia, T.I.; Liu, H. Investigating the evolutionary trends and key enablers of hydrogen production technologies: A patent-life cycle and econometric analysis. Int. J. Hydrogen Energy 2023, 48, 37674–37707. [Google Scholar] [CrossRef]
  35. Huang, Y.; Li, R.; Zou, F.; Jiang, L.; Porter, A.L.; Zhang, L. Technology life cycle analysis: From the dynamic perspective of patent citation networks. Technol. Forecast. Soc. Chang. 2022, 181, 121760. [Google Scholar] [CrossRef]
  36. Hoosain, M.S.; Paul, B.S.; Kass, S.; Ramakrishna, S. Tools towards the sustainability and circularity of data centers. Circ. Econ. Sustain. 2023, 3, 173–197. [Google Scholar] [CrossRef]
  37. Jin, X.; Zhang, F.; Vasilakos, A.V.; Liu, Z. Green data centers: A survey, perspectives, and future directions. arXiv 2016, arXiv:1608.00687. [Google Scholar]
  38. Cao, Z.; Zhou, X.; Wu, X.; Zhu, Z.; Liu, T.; Neng, J.; Wen, Y. Data Center Sustainability: Revisits and Outlooks. IEEE Trans. Sustain. Comput. 2024, 9, 236–248. [Google Scholar] [CrossRef]
  39. Kuncoro, I.W.; Pambudi, N.A.; Biddinika, M.K.; Widiastuti, I.; Hijriawan, M.; Wibowo, K.M. Immersion Cooling as the Next Technology for Data Center Cooling: A Review. J. Phys. Conf. Ser. 2019, 1402, 044057. [Google Scholar] [CrossRef]
  40. Cutler, B.; Fowers, S.; Kramer, J.; Peterson, E. Dunking the data center. IEEE Spectr. 2017, 54, 26–31. [Google Scholar] [CrossRef]
  41. Kanbur, B.B.; Wu, C.; Fan, S.; Duan, F. System-level experimental investigations of the direct immersion cooling data center units with thermodynamic and thermoeconomic assessments. Energy 2017, 217, 119373. [Google Scholar] [CrossRef]
  42. Gözcü, O.; Özada, B.; Carfi, M.U.; Erden, H.S. Worldwide Energy Analysis of Major Free Cooling Methods for Data Centers. In Proceedings of the 2017 16th IEEE Intersociety Conference on Thermal and Thermomechanical Phenomena in Electronic Systems (ITherm), Orlando, FL, USA, 30 May–2 June 2017; pp. 968–976. [Google Scholar]
  43. Milad, M.; Darwish, M. UPS System: How Can Future Technology and Topology Improve the Energy Efficiency in Data Centers? In Proceedings of the 2014 49th International Universities Power Engineering Conference (UPEC), Cluj-Napoca, Romania, 2–5 September 2014; pp. 1–4. [Google Scholar] [CrossRef]
  44. Krein, P.T. Data center challenges and their power electronics. CPSS Trans. Power Electron. Appl. 2017, 2, 39–46. [Google Scholar] [CrossRef]
  45. Pelley, S.; Meisner, D.; Zandevakili, P.; Wenisch, T.F.; Underwood, J. Power routing: Dynamic power provisioning in the data center. ACM SIGPLAN Not. 2017, 38, 231–242. [Google Scholar]
  46. Shoukourian, H.; Wilde, T.; Auweter, A.; Bode, A. Monitoring power data: A first step towards a unified energy efficiency evaluation toolset for HPC data centers. Environ. Model. Softw. 2014, 56, 13–26. [Google Scholar] [CrossRef]
  47. Mytton, D. Data centre water consumption. Clean Water 2014, 4, 11. [Google Scholar] [CrossRef]
  48. Liang, J.; Xie, J.; Zhang, X.; Wang, X. Study on the Construction of Big Data and Valorization Services of Intelligent Water. In Proceedings of the 2021 IEEE 11th International Conference on Electronics Information and Emergency Communication (ICEIEC), Beijing, China, 18–20 June 2021; pp. 145–149. [Google Scholar]
  49. Ebrahimi, K.; Jones, G.F.; Fleischer, A.S. A review of data center cooling technology, operating conditions and the corresponding low-grade waste heat recovery opportunities. Renew. Sustain. Energy Rev. 2014, 31, 622–638. [Google Scholar] [CrossRef]
  50. Sharma, R.K.; Bash, C.E.; Patel, C.D.; Friedrich, R.J.; Chase, J.S. Balance of power: Dynamic thermal management for internet data centers. IEEE Internet Comput. 2005, 9, 42–49. [Google Scholar] [CrossRef]
  51. Zhang, Y.; Shan, K.; Li, X.; Li, H.; Wang, S. Research and Technologies for next-generation high-temperature data centers–State-of-the-arts and future perspectives. Renew. Sustain. Energy Rev. 2023, 171, 112991. [Google Scholar] [CrossRef]
  52. Ran, Y.; Hu, H.; Zhou, X.; Wen, Y. Deepee: Joint Optimization of Job Scheduling and Cooling Control for Data Center Energy Efficiency Using Deep Reinforcement Learning. In Proceedings of the 2019 IEEE 39th International Conference on Distributed Computing Systems (ICDCS), Dallas, TX, USA, 7–10 July 2019; pp. 645–655. [Google Scholar]
  53. Bose, R.; Roy, S.; Mondal, H.; Chowdhury, D.R.; Chakraborty, S. Energy-efficient approach to lower the carbon emissions of data centers. Computing 2021, 103, 1703–1721. [Google Scholar] [CrossRef]
  54. Lykou, G.; Mentzelioti, D.; Gritzalis, D. A new methodology toward effectively assessing data center sustainability. Comput. Secur. 2018, 76, 327–340. [Google Scholar] [CrossRef]
  55. Ren, S.; He, Y. COCA: Online Distributed Resource Management for Cost Minimization and Carbon Neutrality in Data Centers. In Proceedings of the International Conference on High Performance Computing, Networking, Storage and Analysis, Denver, CO, USA, 7–22 November 2013; pp. 1–12. [Google Scholar]
  56. Cao, Z.; Zhou, X.; Hu, H.; Wang, Z.; Wen, Y. Toward a Systematic Survey for Carbon Neutral Data Centers. IEEE Commun. Surv. Tutor. 2022, 24, 895–936. [Google Scholar] [CrossRef]
  57. Shaw, R.; Howley, E.; Barrett, E. Applying reinforcement learning towards automating energy efficient virtual machine consolidation in cloud data centers. Inf. Syst. 2022, 107, 101722. [Google Scholar] [CrossRef]
  58. Yao, W.; Shen, Y.; Wang, D. A weighted pagerank-based algorithm for virtual machine placement in cloud computing. IEEE Access 2019, 7, 176369–176381. [Google Scholar] [CrossRef]
  59. Scioscia, F.; Bilenchi, I.; Ruta, M.; Gramegna, F.; Loconte, D. A multiplatform energy-aware OWL reasoner benchmarking framework. J. Web Semant. 2022, 72, 100694. [Google Scholar] [CrossRef]
  60. Reddy, K.H.K.; Luhach, A.K.; Kumar, V.V.; Pratihar, S.; Kumar, D.; Roy, D.S. Towards energy efficient Smart city services: A software defined resource management scheme for data centers. Sustain. Comput. Informatics Syst. 2022, 35, 100776. [Google Scholar] [CrossRef]
  61. Imamura, S.; Yoshida, E.; Oe, K. Reducing CPU Power Consumption with Device Utilization-Aware DVFS for Low-Latency SSDs. IEICE Trans. Inf. Syst. 2019, 102, 1740–1749. [Google Scholar] [CrossRef]
  62. Chou, J.C.Y.; Lai, T.H.; Kim, J.; Rotem, D. Exploiting replication for energy-aware scheduling in disk storage systems. IEEE Trans. Parallel Distrib. Syst. 2014, 26, 2734–2749. [Google Scholar] [CrossRef]
  63. Jhuang, A.C.; Sun, J.J.; Trappey, A.J.; Trappey, C.V.; Govindarajan, U.H. Computer Supported Technology Function Matrix Construction for Patent Data Analytics. In Proceedings of the 2017 IEEE 21st International Conference on Computer Supported Cooperative Work in Design (CSCWD), Wellington, New Zealand, 26–28 April 2017; pp. 457–462. [Google Scholar]
  64. Urbina-Suarez, N.A.; Angel-Ospina, A.C.; Lopez-Barrera, G.L.; Barajas-Solano, A.F.; Machuca-Martínez, F. S-curve and landscape maps for the analysis of trends on industrial textile wastewater treatment. Environ. Adv. 2024, 15, 100491. [Google Scholar] [CrossRef]
  65. Zahoor, A.; Kun, R.; Mao, G.; Farkas, F.; Sápi, A.; Kónya, Z. Urgent Needs for Second Life Using and Recycling Design of Wasted E-car Lithium-ion Battery: A Scientometric Analysis. Environ. Sci. Pollut. Res. Int. 2024; ahead of print. [Google Scholar] [CrossRef]
  66. Zhang, H.; Qi, Y.; Zhang, G. Comparative analysis of intelligent connected vehicle industry in China, United States and European Union from technology lifecycle perspective. Kybernetes, 2023; ahead of print. [Google Scholar] [CrossRef]
  67. Huang, L.; Hou, Z.; Fang, Y.; Liu, J.; Shi, T. Evolution of CCUS Technologies Using LDA Topic Model and Derwent Patent Data. Energies 2023, 16, 2556. [Google Scholar] [CrossRef]
  68. Sossa, J.W.Z.; Marro, F.P.; Alzate, B.A.; Salazar, F.M.V.; Patiño, A.F.A. S-Curve analysis and technology life cycle. Application in series of data of articles and patents. Espacios 2016, 37, 19. [Google Scholar]
  69. Clement, S.; Burdett, K.; Rteil, N.; Wynne, A.; Kenny, R. Is Hot IT a False Economy? An Analysis of Server and Data Center Energy Efficiency as Temperatures Rise. IEEE Trans. Sustain. Comput. 2024, 9, 482–493. [Google Scholar] [CrossRef]
  70. Zakarya, M.; Khan, A.A.; Qazani, M.R.C.; Ali, H.; Al-Bahri, M.; Khan, A.U.R.; Ali, A.; Khan, R. Sustainable computing across datacenters: A review of enabling models and techniques. Comput. Sci. Rev. 2024, 52, 100620. [Google Scholar] [CrossRef]
  71. Jihad, N.J.; Abd Almuhsan, M.A. Future trends in optical wireless communications systems. Tech. Rom. J. Appl. Sci. Technol. 2023, 13, 53–67. [Google Scholar] [CrossRef]
  72. Xu, J.; Fortes, J.A. Multi-objective Virtual Machine Placement in Virtualized Data Center Environments. In Proceedings of the 2010 IEEE/ACM Int’l Conference on Green Computing and Communications & Int’l Conference on Cyber, Physical and Social Computing, Washington, DC, USA, 18–20 December 2010; pp. 179–188. [Google Scholar]
  73. Dutreilh, X.; Moreau, A.; Malenfant, J.; Rivierre, N.; Truck, I. From Data Center Resource Allocation to Control Theory and Back. In Proceedings of the 2010 IEEE 3rd International Conference on Cloud Computing, Miami, FL, USA, 5–10 July 2010; pp. 410–417. [Google Scholar]
  74. Youssef, A.E. Exploring cloud computing services and applications. J. Emerg. Trends Comp. Inf. Sci. 2012, 3, 838–847. [Google Scholar]
  75. Ye, K.; Huang, D.; Jiang, X.; Chen, H.; Wu, S. Virtual Machine-based Energy-efficient Data Center Architecture for Cloud Computing: A Performance Perspective. In Proceedings of the 2010 IEEE/ACM Int’l Conference on Green Computing and Communications & Int’l Conference on Cyber, Physical and Social Computing, Washington, DC, USA, 18–20 December 2010; pp. 171–178. [Google Scholar]
  76. Bitar, N.; Gringeri, S.; Xia, T.J. Technologies and protocols for data center and cloud networking. IEEE Commun. Mag. 2023, 51, 24–31. [Google Scholar] [CrossRef]
  77. Bari, M.F.; Boutaba, R.; Esteves, R.; Granville, L.Z.; Podlesny, M.; Rabbani, M.G.; Zhang, Q.; Zhani, M.F. Data center network virtualization: A survey. IEEE Commun. Surv. Tutor. 2012, 15, 909–928. [Google Scholar] [CrossRef]
  78. Lam, C.F.; Liu, H.; Koley, B.; Zhao, X.; Kamalov, V.; Gill, V. Fiber optic communication technologies: What’s needed for datacenter network operations. IEEE Commun. Mag. 2010, 48, 32–39. [Google Scholar] [CrossRef]
  79. Sato, K.I.; Matsuura, H.; Konoike, R.; Suzuki, K.; Ikeda, K.; Namiki, S. Prospects and challenges of optical switching technologies for intra data center networks. J. Opt. Commun. Netw. 2022, 14, 903–915. [Google Scholar] [CrossRef]
  80. Cheng, T.Y. A new method of creating technology/function matrix for systematic innovation without expert. J. Technol. Manag. 2012, 7, 118–127. [Google Scholar] [CrossRef]
  81. Skyquest. Available online: https://www.skyquestt.com/sample-request/data-center-cooling-market (accessed on 25 March 2023).
  82. Marketsandmarkets. Available online: https://www.marketsandmarkets.com/Market-Reports/data-center-cooling (accessed on 20 March 2023).
  83. GMI. Available online: https://www.gminsights.com/industry-analysis/data-center-cooling-market (accessed on 25 March 2023).
  84. Newswire. Available online: https://www.prnewswire.com/news-releases/data-center-rack-market-size-to-grow-by-usd-1628-53-million-belden-inc-black-box-corp-chatsworth-products-inc-and-more-among-the-key-companies-in-the-market-technavio-302090327.html (accessed on 25 March 2023).
  85. Technavio. Available online: https://www.technavio.com/report/data-center-it-equipment-market-analysis (accessed on 25 March 2023).
Figure 1. Processes and methods adopted for patent landscape analysis.
Information 15 00374 g001
Figure 2. OKG of DC net-zero technologies [36,37,38,39,40,41,42,43,44,45,46,47,48,49,50,51,52,53,54,55,56,57,58,59,60,61,62].
Information 15 00374 g002
Figure 3. Major patenting trend analysis results: (a) Patent (family) publishing trend in the past decade (2014~2023); (b) Top 10 patent (family) assignees distribution; (c) The distribution of patent (family) numbers among top 10 CPC classes.
Information 15 00374 g003
Figure 4. The extended OKG, including the initial OKG sub-domains (in gray boxes), the original sub-technologies (in solid boxes), and the newly updated sub-domains (in dotted boxes).
Information 15 00374 g004
Figure 5. Map sub-technologies in the enhanced OKG with key literature [36,37,38,39,40,41,42,43,44,45,46,47,48,49,50,51,52,53,54,55,56,57,58,59,60,61,62,72,73,74,75,76,77,78,79].
Information 15 00374 g005
Figure 6. Technology maturity analysis results: (a) processor and related hardware; (b) power supply and management equipment; (c) cooling and heat recovery technologies; (d) network and communication technology.
Information 15 00374 g006
Table 1. Comparison of common keyword extraction techniques.
Keyword Extraction MethodsDescriptionExample
Simple statistical methodsIn the absence of considering linguistic features of the text, attention is focused on extracting statistical data from the text, including word position, word frequency, and inverse document frequency, to generate a list of keywords.N-gram
TF–IDF 1
PAT-tree 2
Linguistic methodsRequires a thorough understanding of grammar and semantic structures between words. It involves techniques such as syntactic role identification, parsing, and morphological analysis to determine keyword relationships.WordNet
EDR 3
Tree Tagger
Machine learning methodsUsing machine learning algorithms, keywords are identified based on training data, can better handle context and semantics, and typically yield higher accuracy.SVM 4
NB 5
Bagging
KeyBERT
1 TF–IDF = term frequency–inverse document frequency. 2 PAT-tree = Patricia tree. 3 EDR = electronic dictionary. 4 SVM = support vector machine. 5 NB = Naive Bayes.
Table 2. Clustering (K-means) and keyword extraction (KeyBERT) results.
ClusterCluster Meaning
(Number of Patents for Each Cluster)
Keyword Extraction Results
1Processor and related hardware
(631)
CPU, board, processor, server
2Power supply and management equipment
(291)
transformers, power supplies, capacitors, grids, power equipment
3Cooling technology and heat recovery
(570) 1
coolants, cool, cooling racks, refrigeration, fluidical 2
thermoelectric, ventilator, refrigerate, HVAC, heating 3
4Network and communication technologies
(309)
ethernet, cloud, protocol, transport, IP
1 The revised cluster 3 contains 570 patents, which is the sum of the original cluster 3 (351 patents) and cluster 4 (219 patents) due to their overlapping focus on technologies related to heat control and cooling. 2 The keyword extraction result of the original cluster 3. 3 The keyword extraction result of the original cluster 4.
Table 3. Topic modeling (CorEx) result.
TopicMeaning of TopicKeywords
1Heat recoveryheat, liquid, heat exchanger, refrigeration, evaporator, coolant
2Cooling technologycool, air, cold, fluid, temperature, cooling, cool air, flow, air flow
3Virtualization, resource management
and performance optimization
virtual, resource management, performance optimization, virtual machine, resource allocation
4Cloud services and resource allocationvirtual, execute, cloud, virtual machine, host, computing, virtualize, workload, instance, program, cloud computing
5Power supply and distributionpower, power distribution, power supply, power device, power comprise
6Rack and equipment installationrack, assembly, frame, cabinet, housing, enclosure, electronic rack
7Network communication and data transfernetwork, network switch, network involve, network traffic, optical
8Optical communications and fiber technologyoptical, fiber, cable, connector, optical signal
9Energy efficiency and conservation measuresreduce, efficiency, energy, energy consumption, energy saving
10Storage technology, inspection and measurement technologydrawing, detect, diagram, schematic, drawing schematic
Table 4. KeyBERT-based eTFM result.
F1
Energy
Efficiency
F2
Environmental and Sustainability
F3
Energy Efficient Operations
F4
Reliability
Sum
T1Cooling and heat recovery3437124131686
T2Energy saving technology3017023036637
T3Computing systems and HPC2804118628535
T4Cloud and virtualization2864019529550
Sum12102228521242408
Disclaimer/Publisher’s Note: The statements, opinions and data contained in all publications are solely those of the individual author(s) and contributor(s) and not of MDPI and/or the editor(s). MDPI and/or the editor(s) disclaim responsibility for any injury to people or property resulting from any ideas, methods, instructions or products referred to in the content.

