

Virtual Journeys, Real Engagement: Analyzing User Experience on a Virtual Travel Social Platform


Abstract

1. Introduction
- RQ1. How do VTPs contribute to sustainable tourism practices and the promotion of lesser-known destinations?
- RQ2. How can VTPs complement physical visits to tourist destinations, and what is their impact on user engagement and decision-making processes?
- RQ3. What are the primary challenges and factors influencing user engagement with VTPs, particularly in terms of technological familiarity and design principles?
- RQ4. How do the social, interactive, and UGC features of VTPs enhance user satisfaction, foster community building, and build trust among users?
2. Background and Literature Review
2.1. Virtual Touring as a Sustainable Practice
2.2. Complementing Physical Tourism and Decision-Making Processes
2.3. Factors Influencing User Engagement
2.4. Community Building and UGC
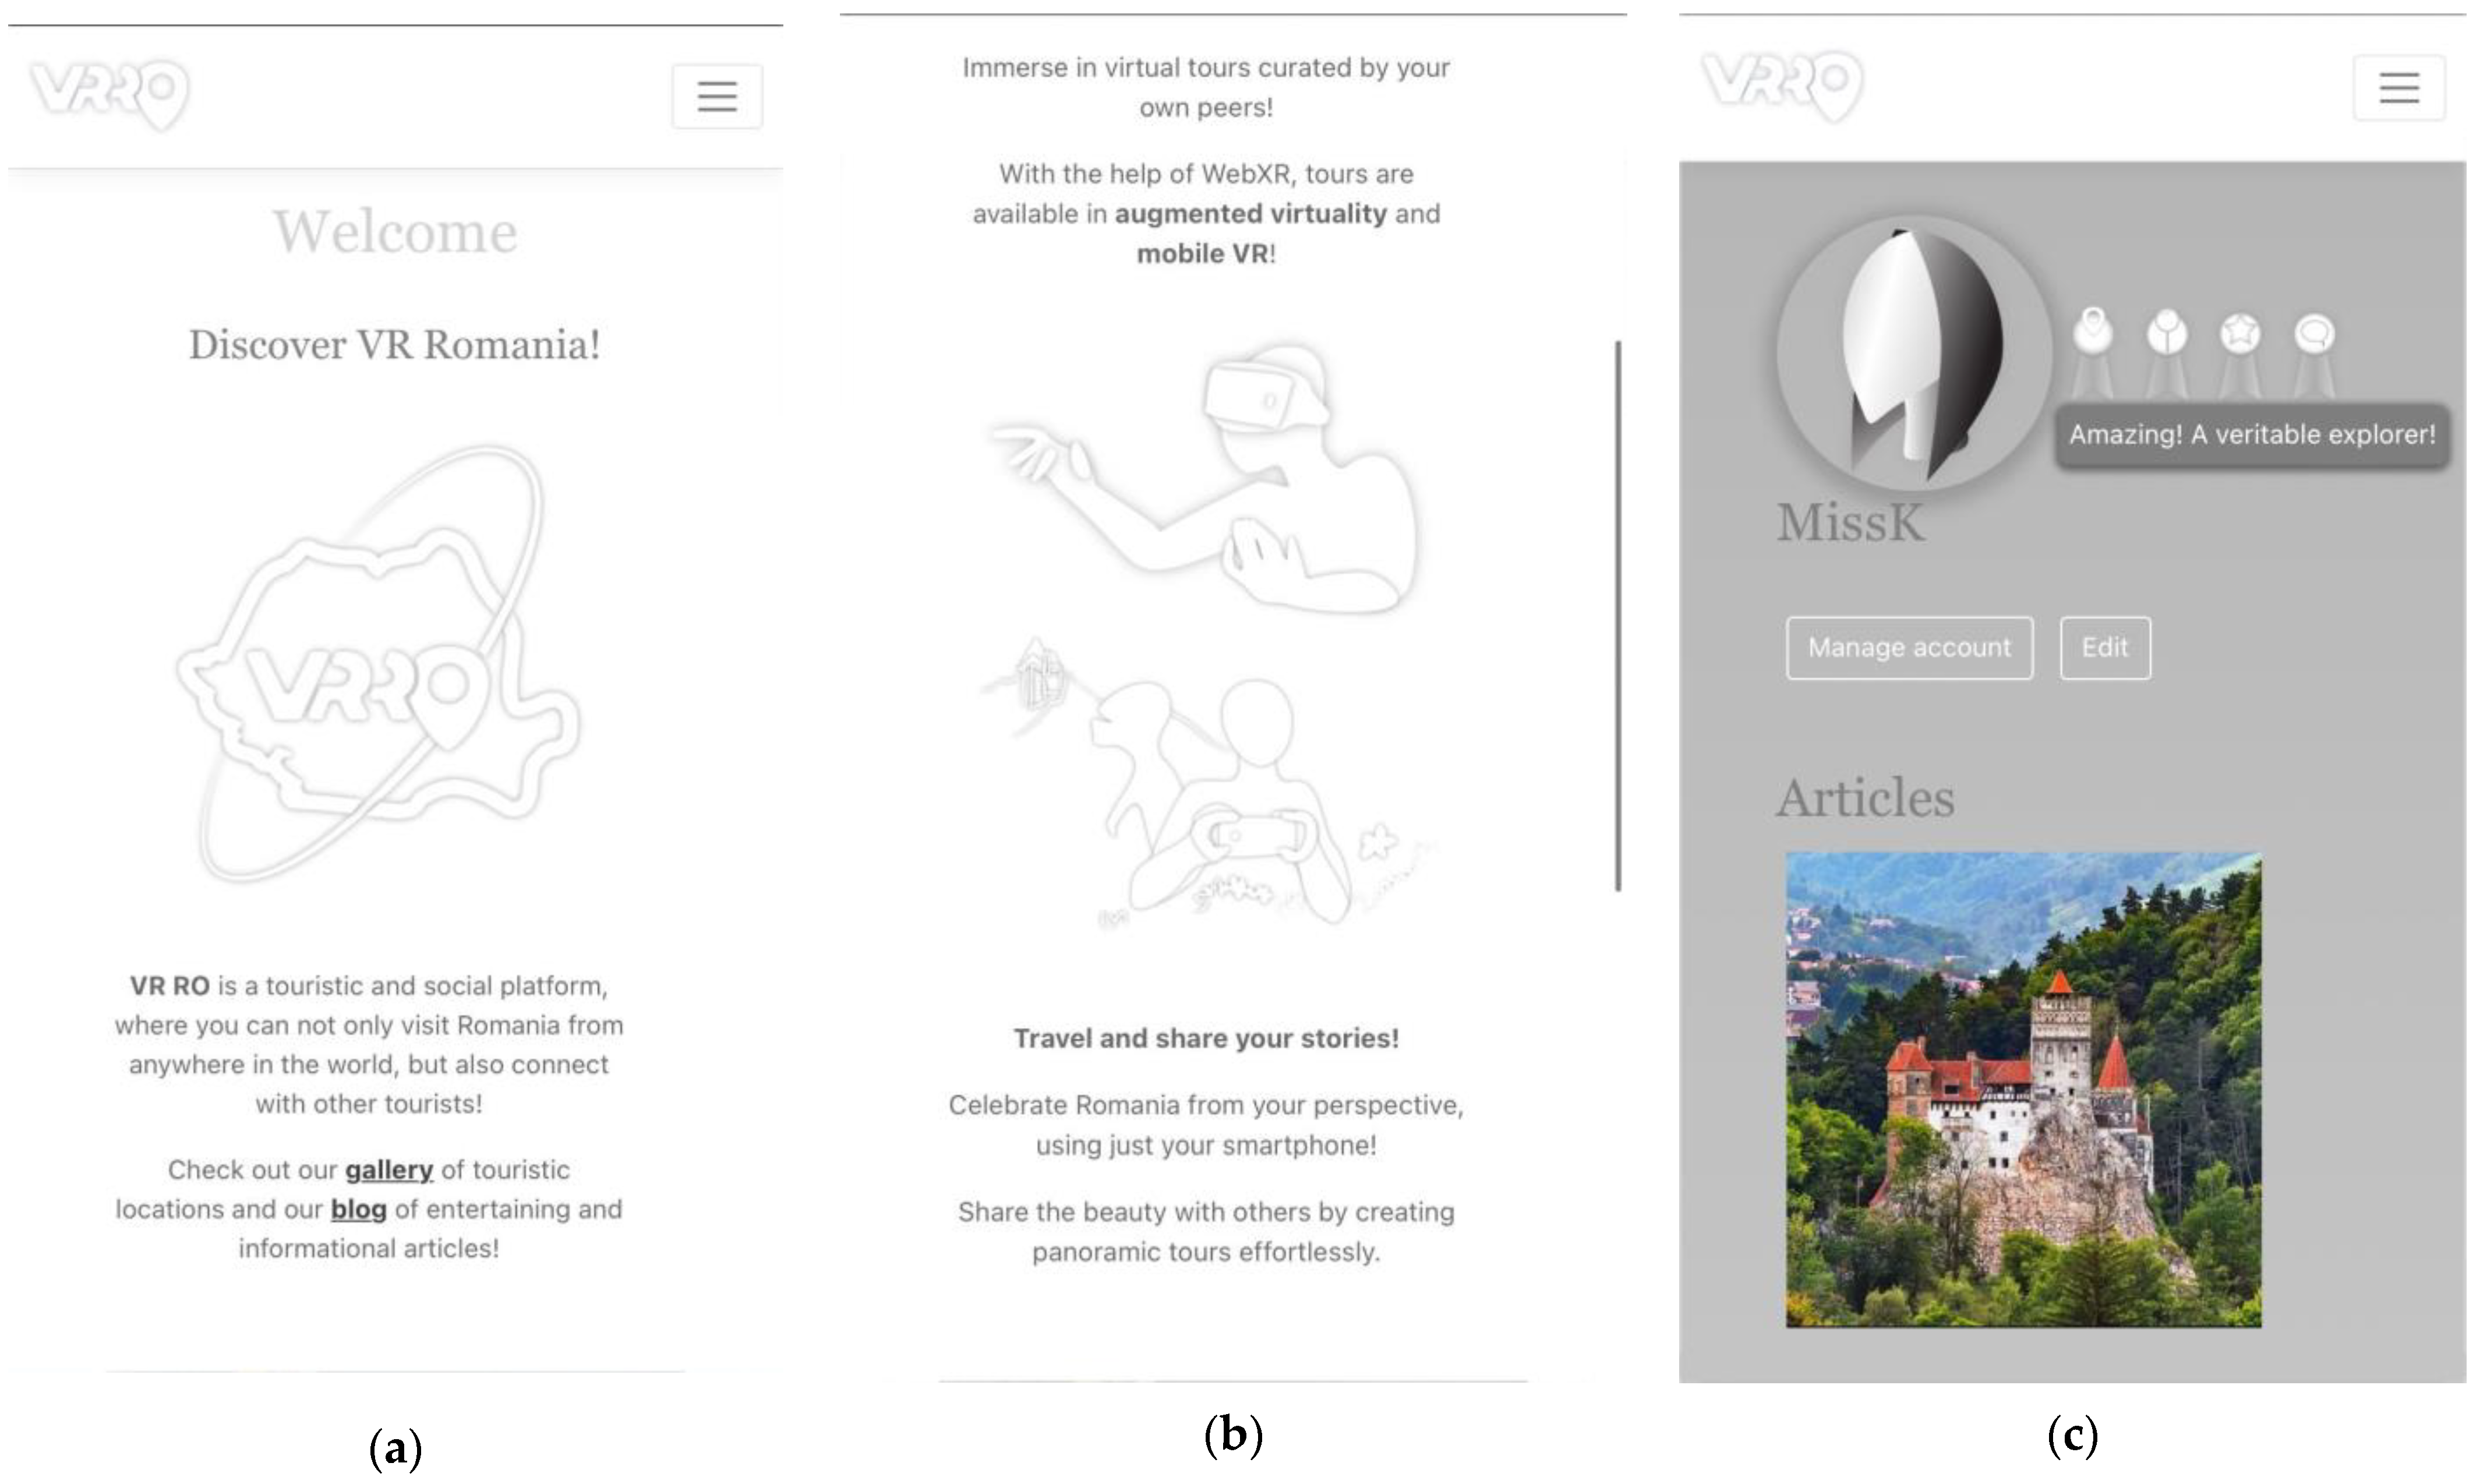
3. The VRRO Platform
3.1. Functionalities
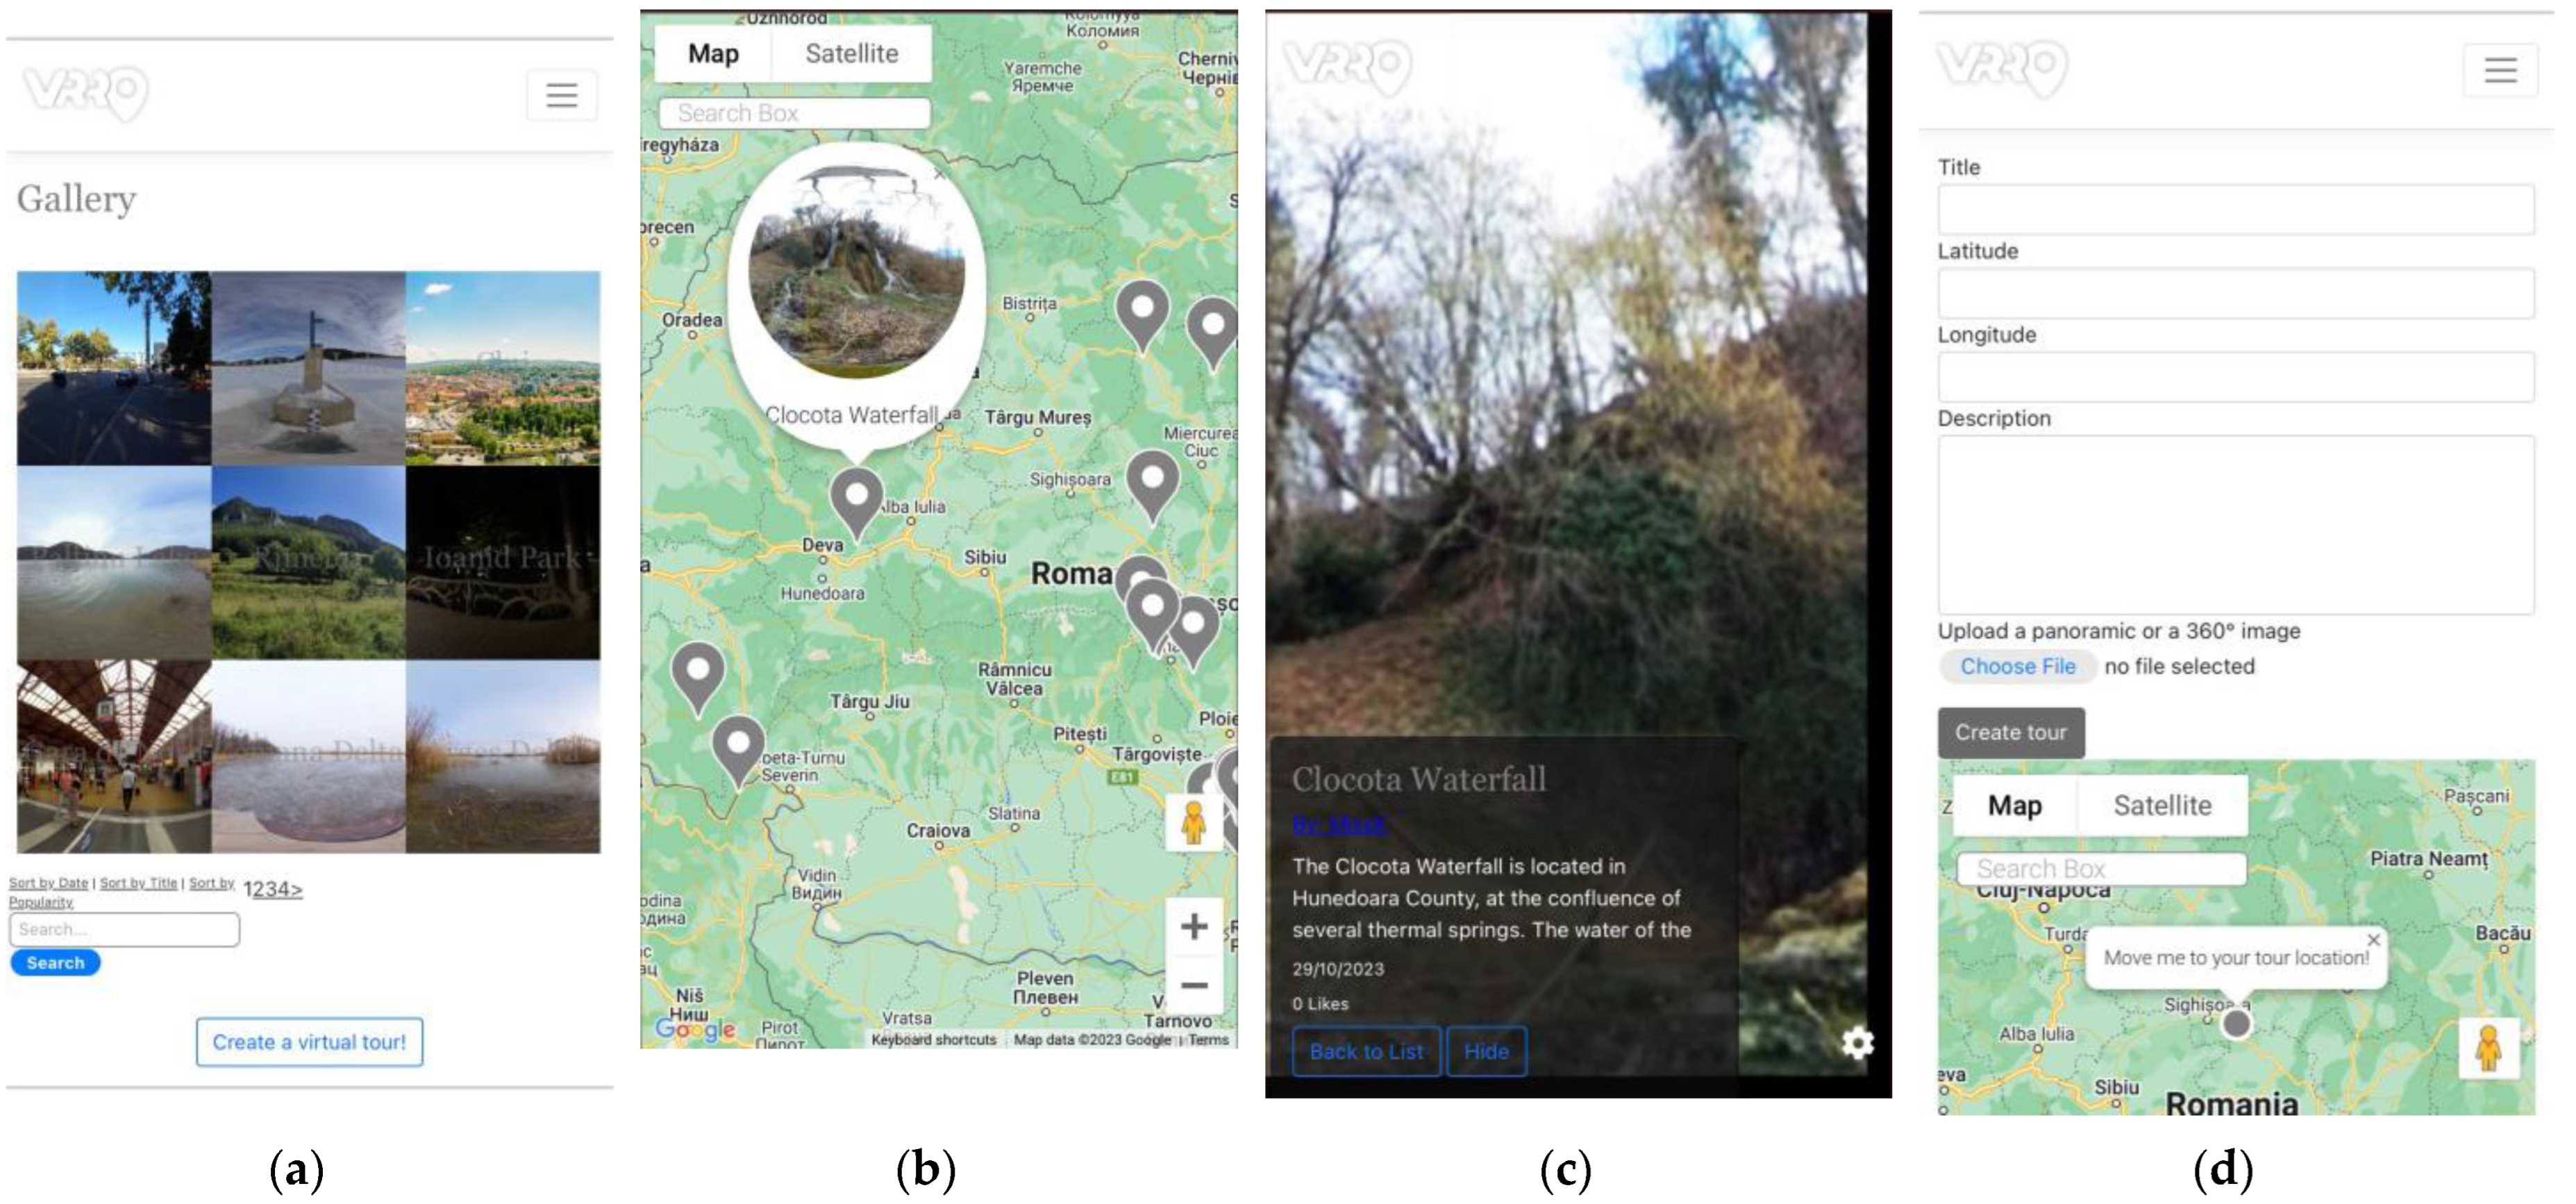
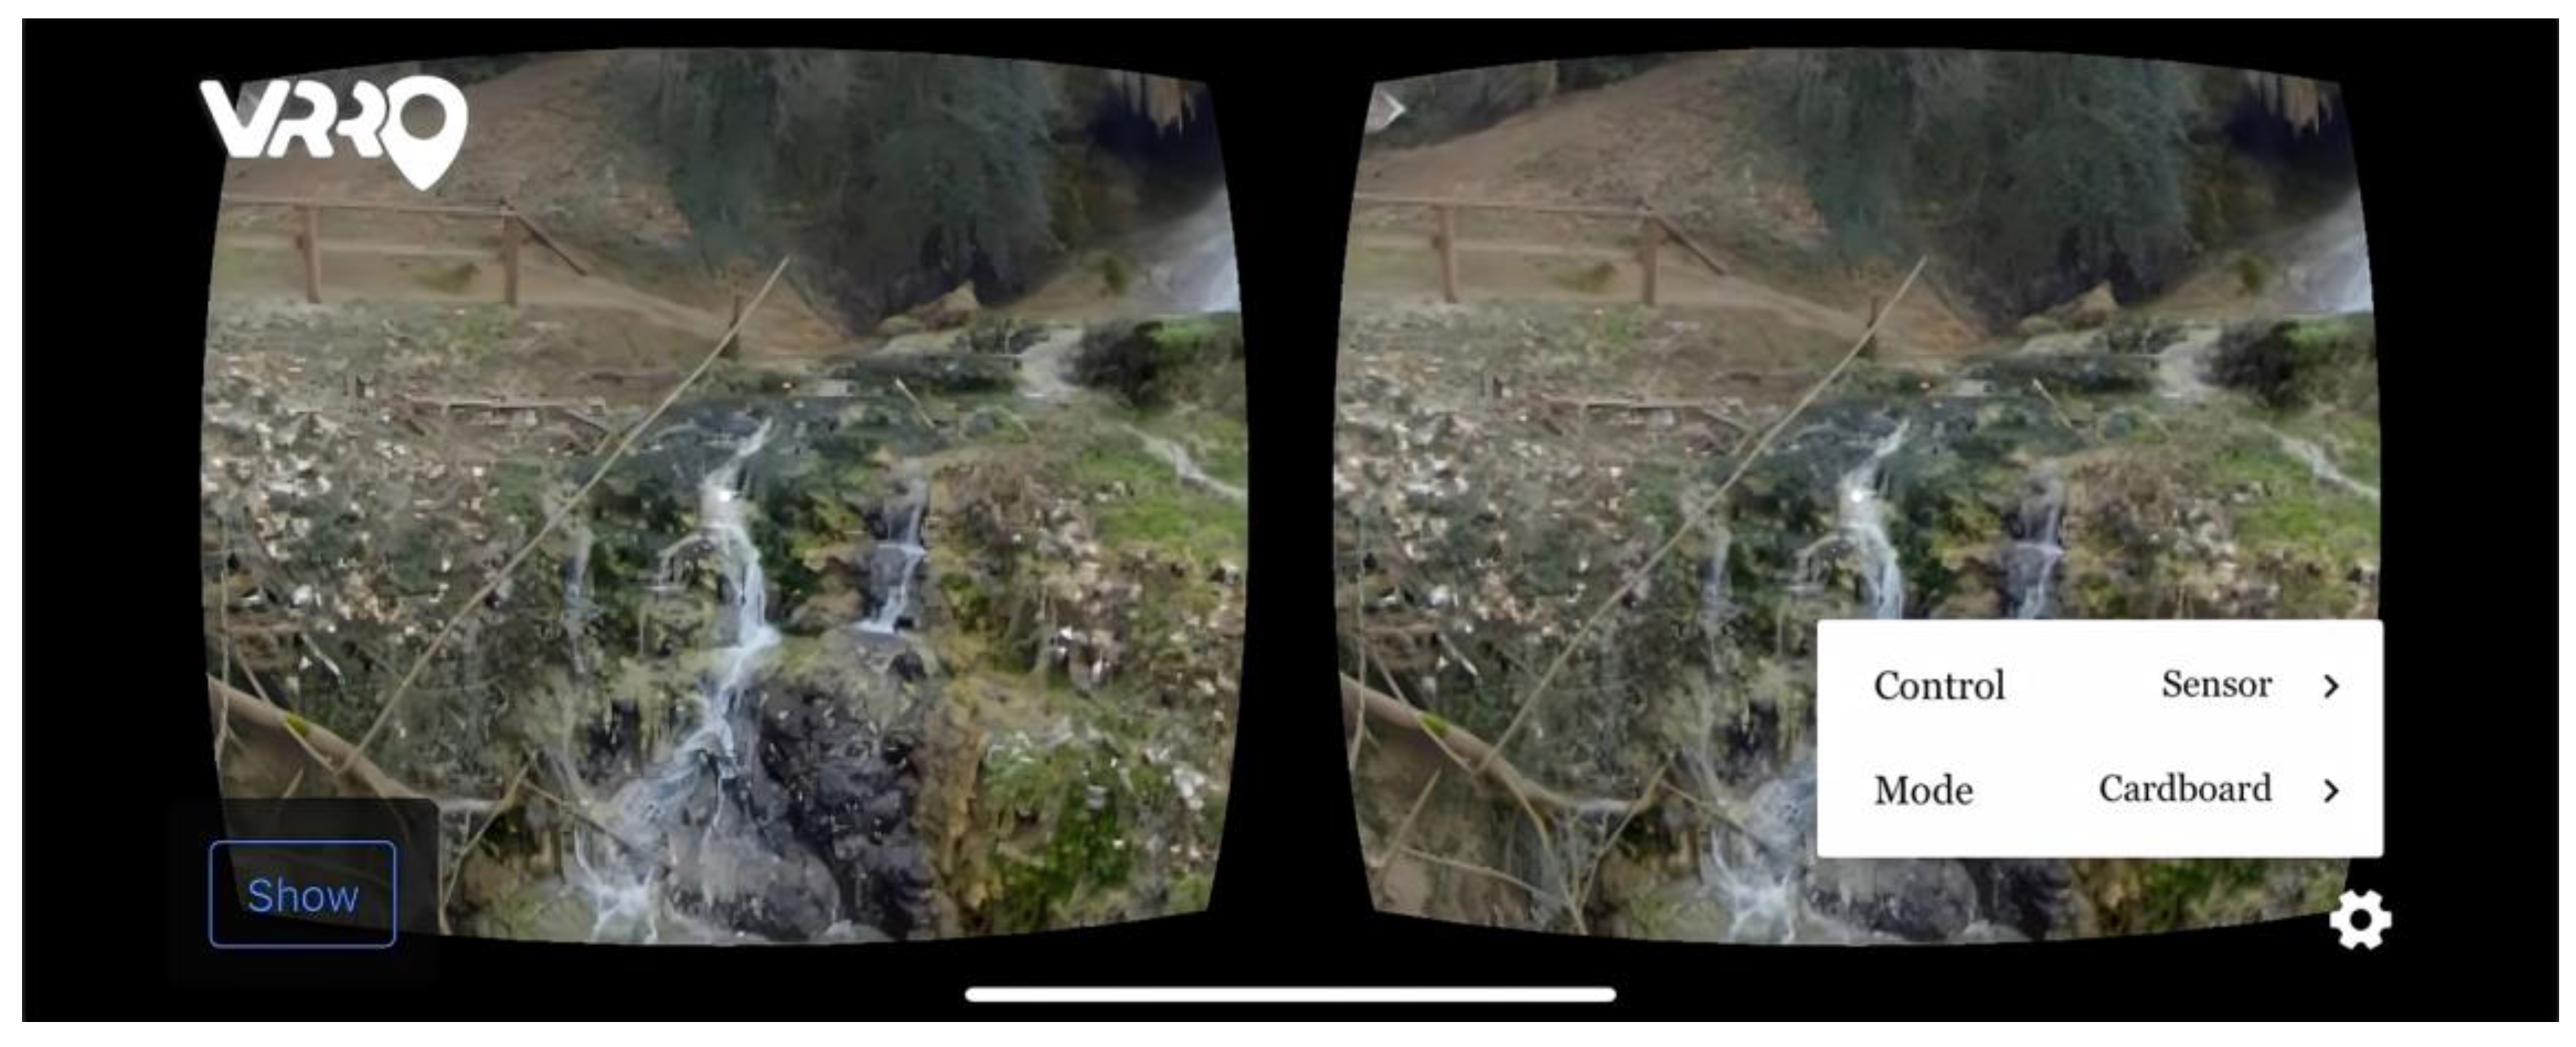
3.1.1. Virtual Tour Gallery
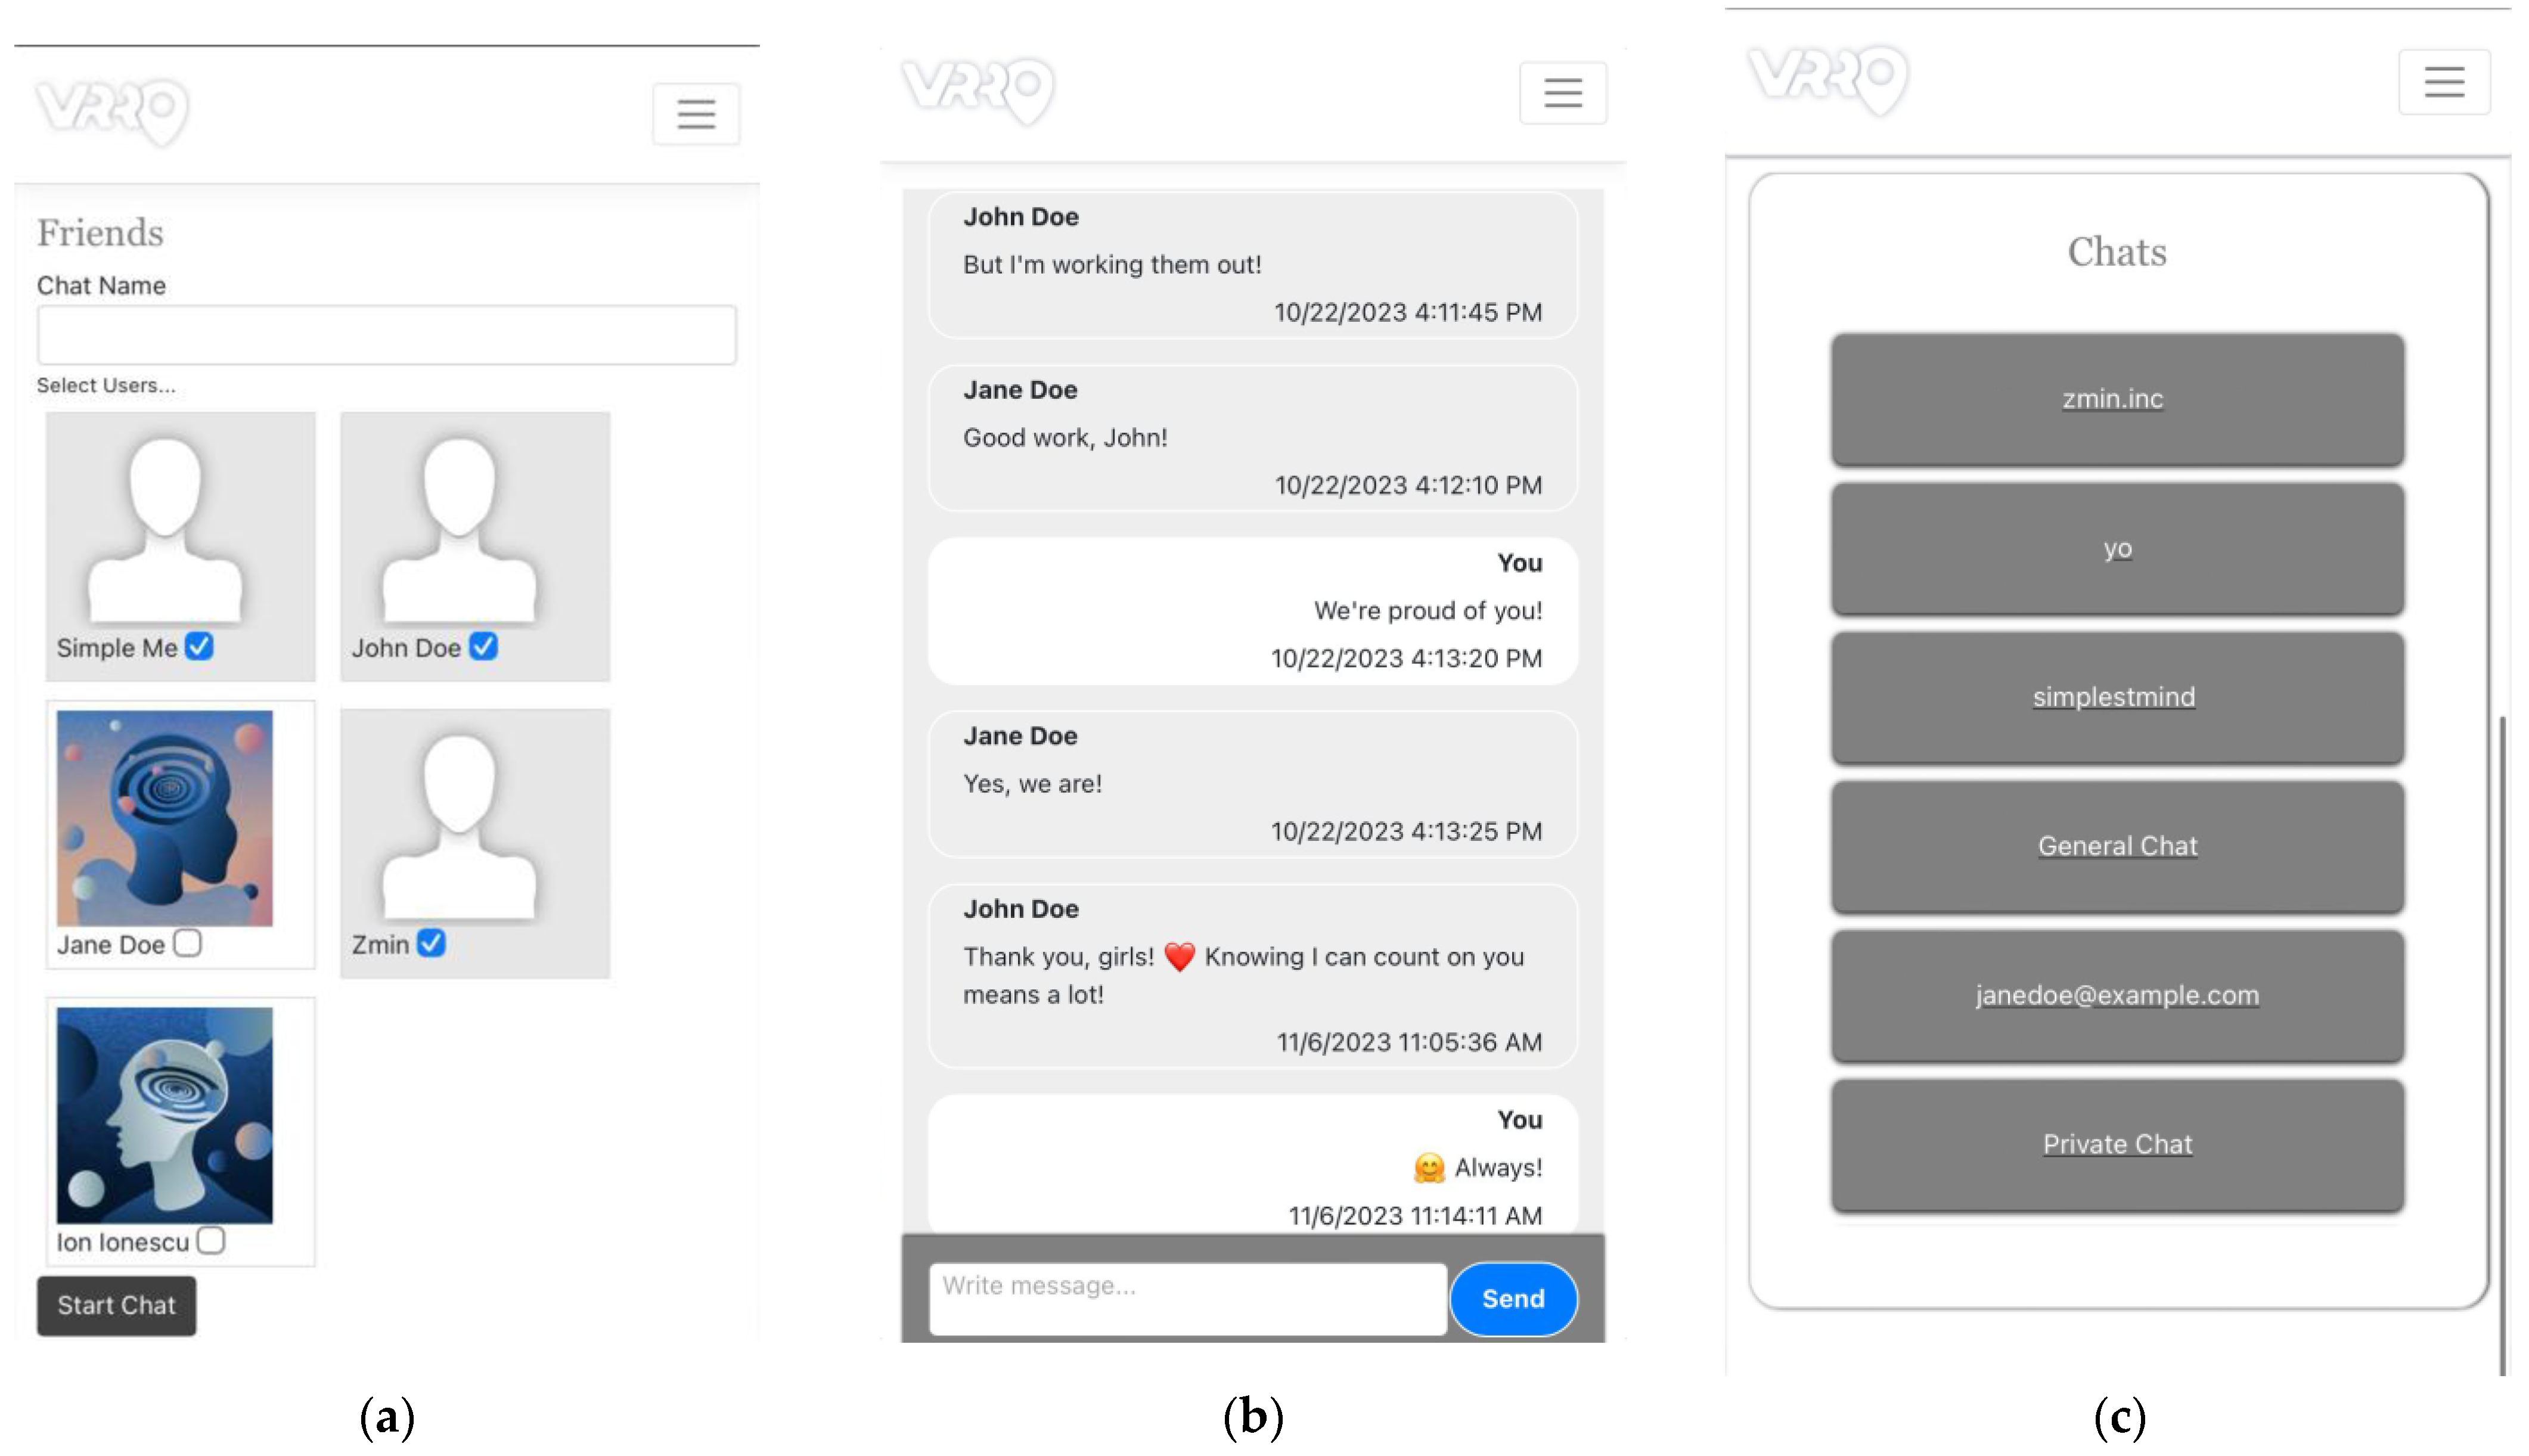
3.1.2. Social Module
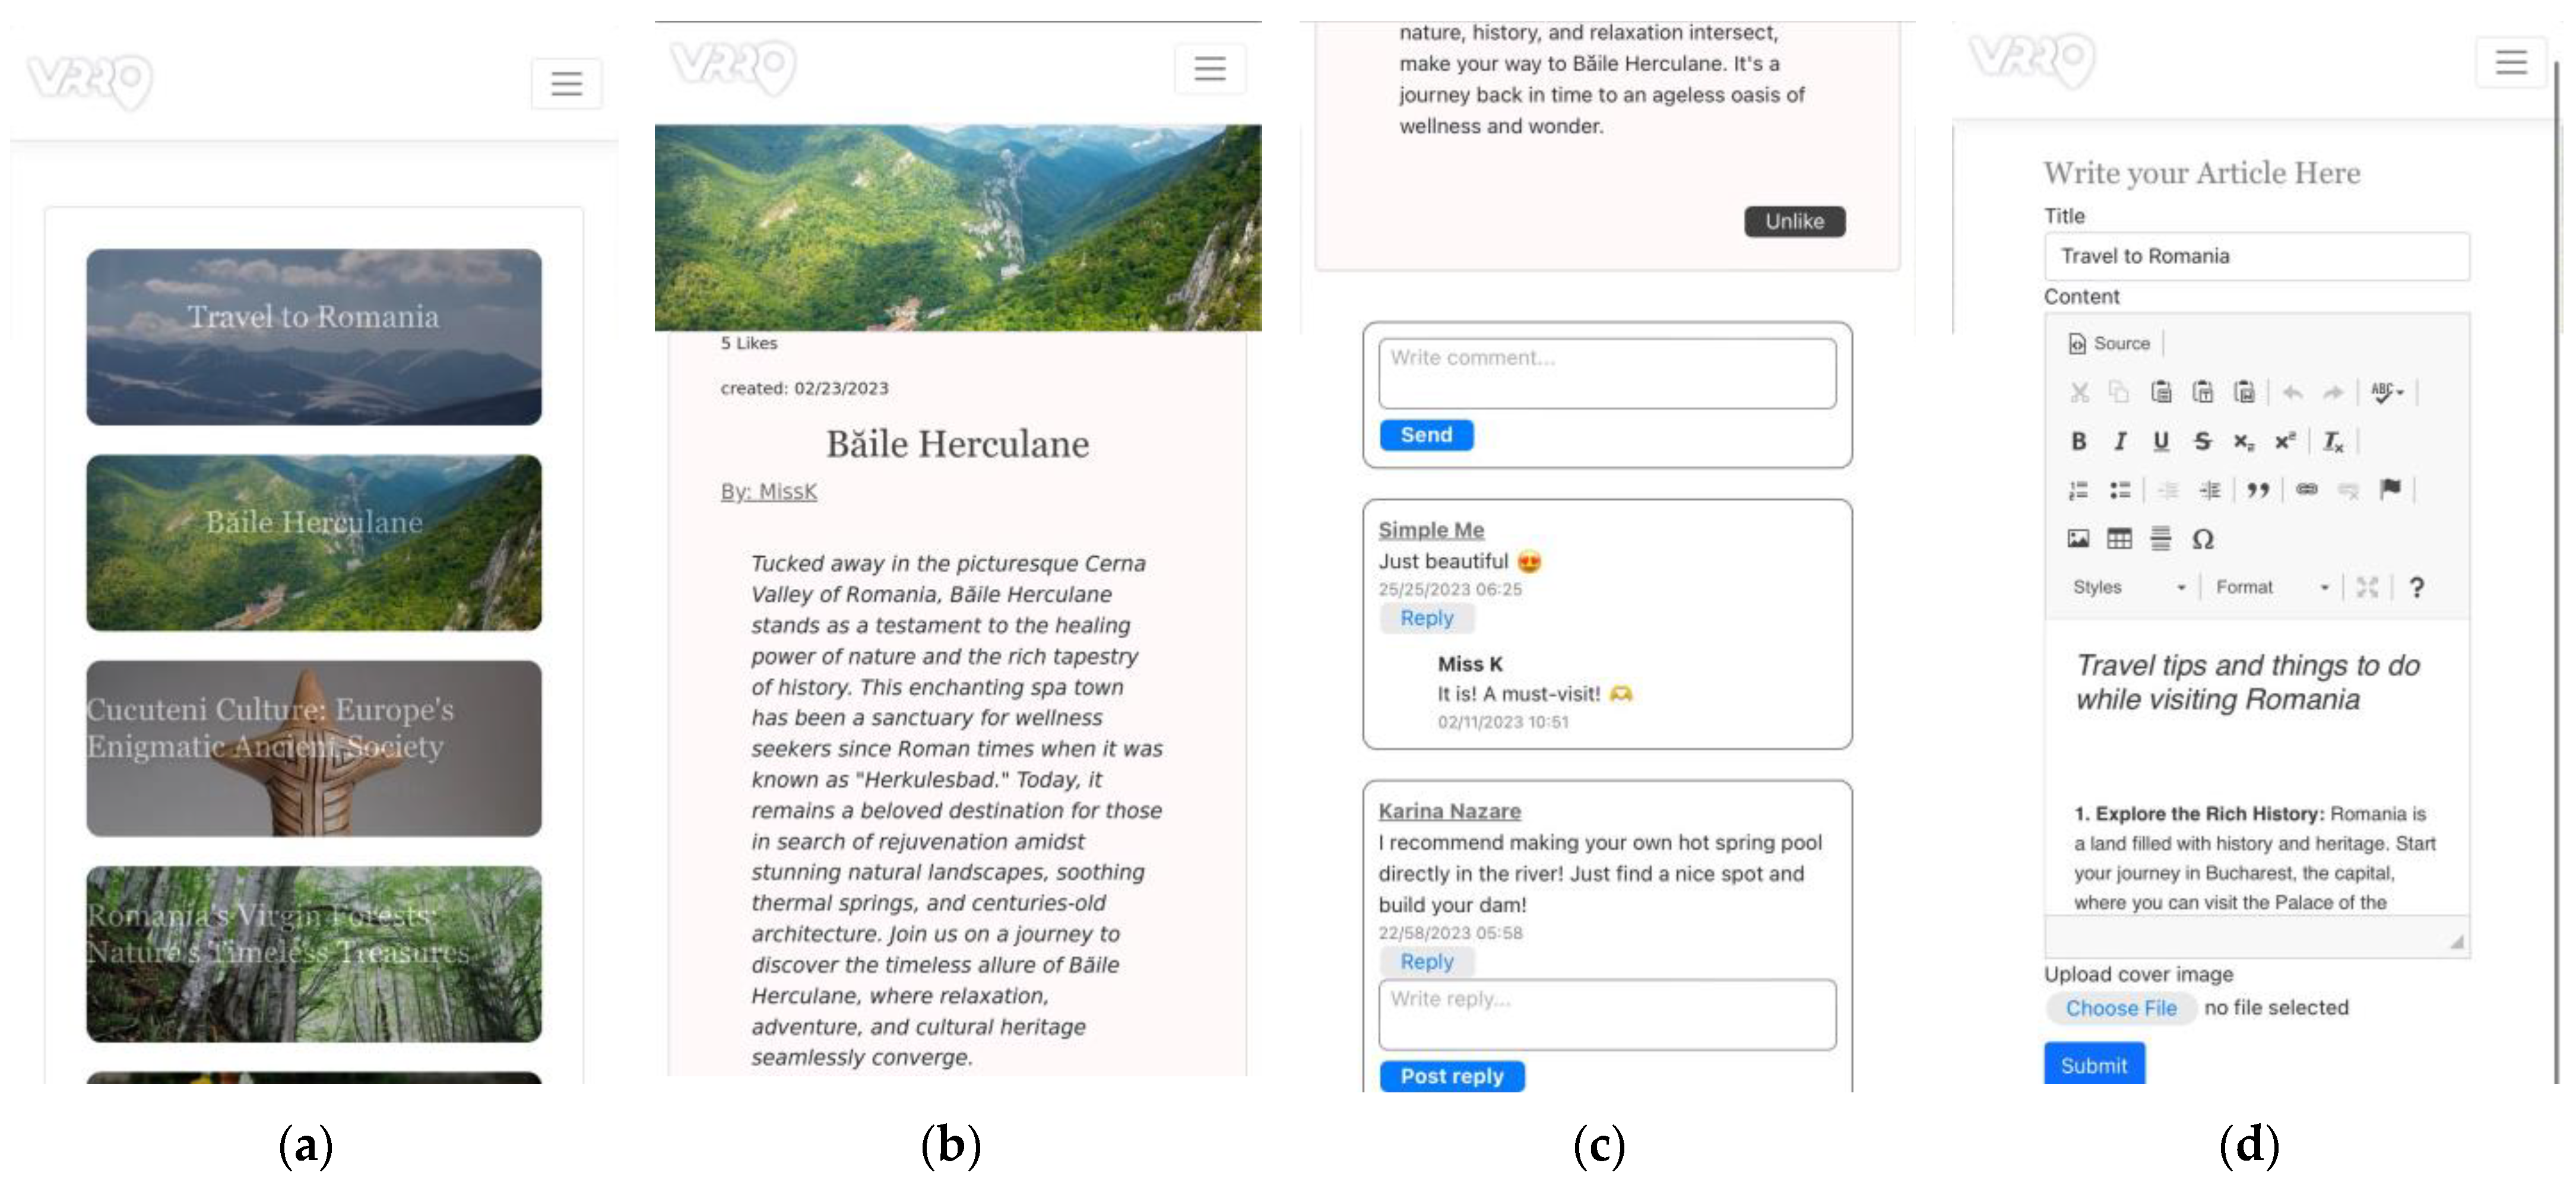
3.1.3. Blog
3.1.4. User Engagement
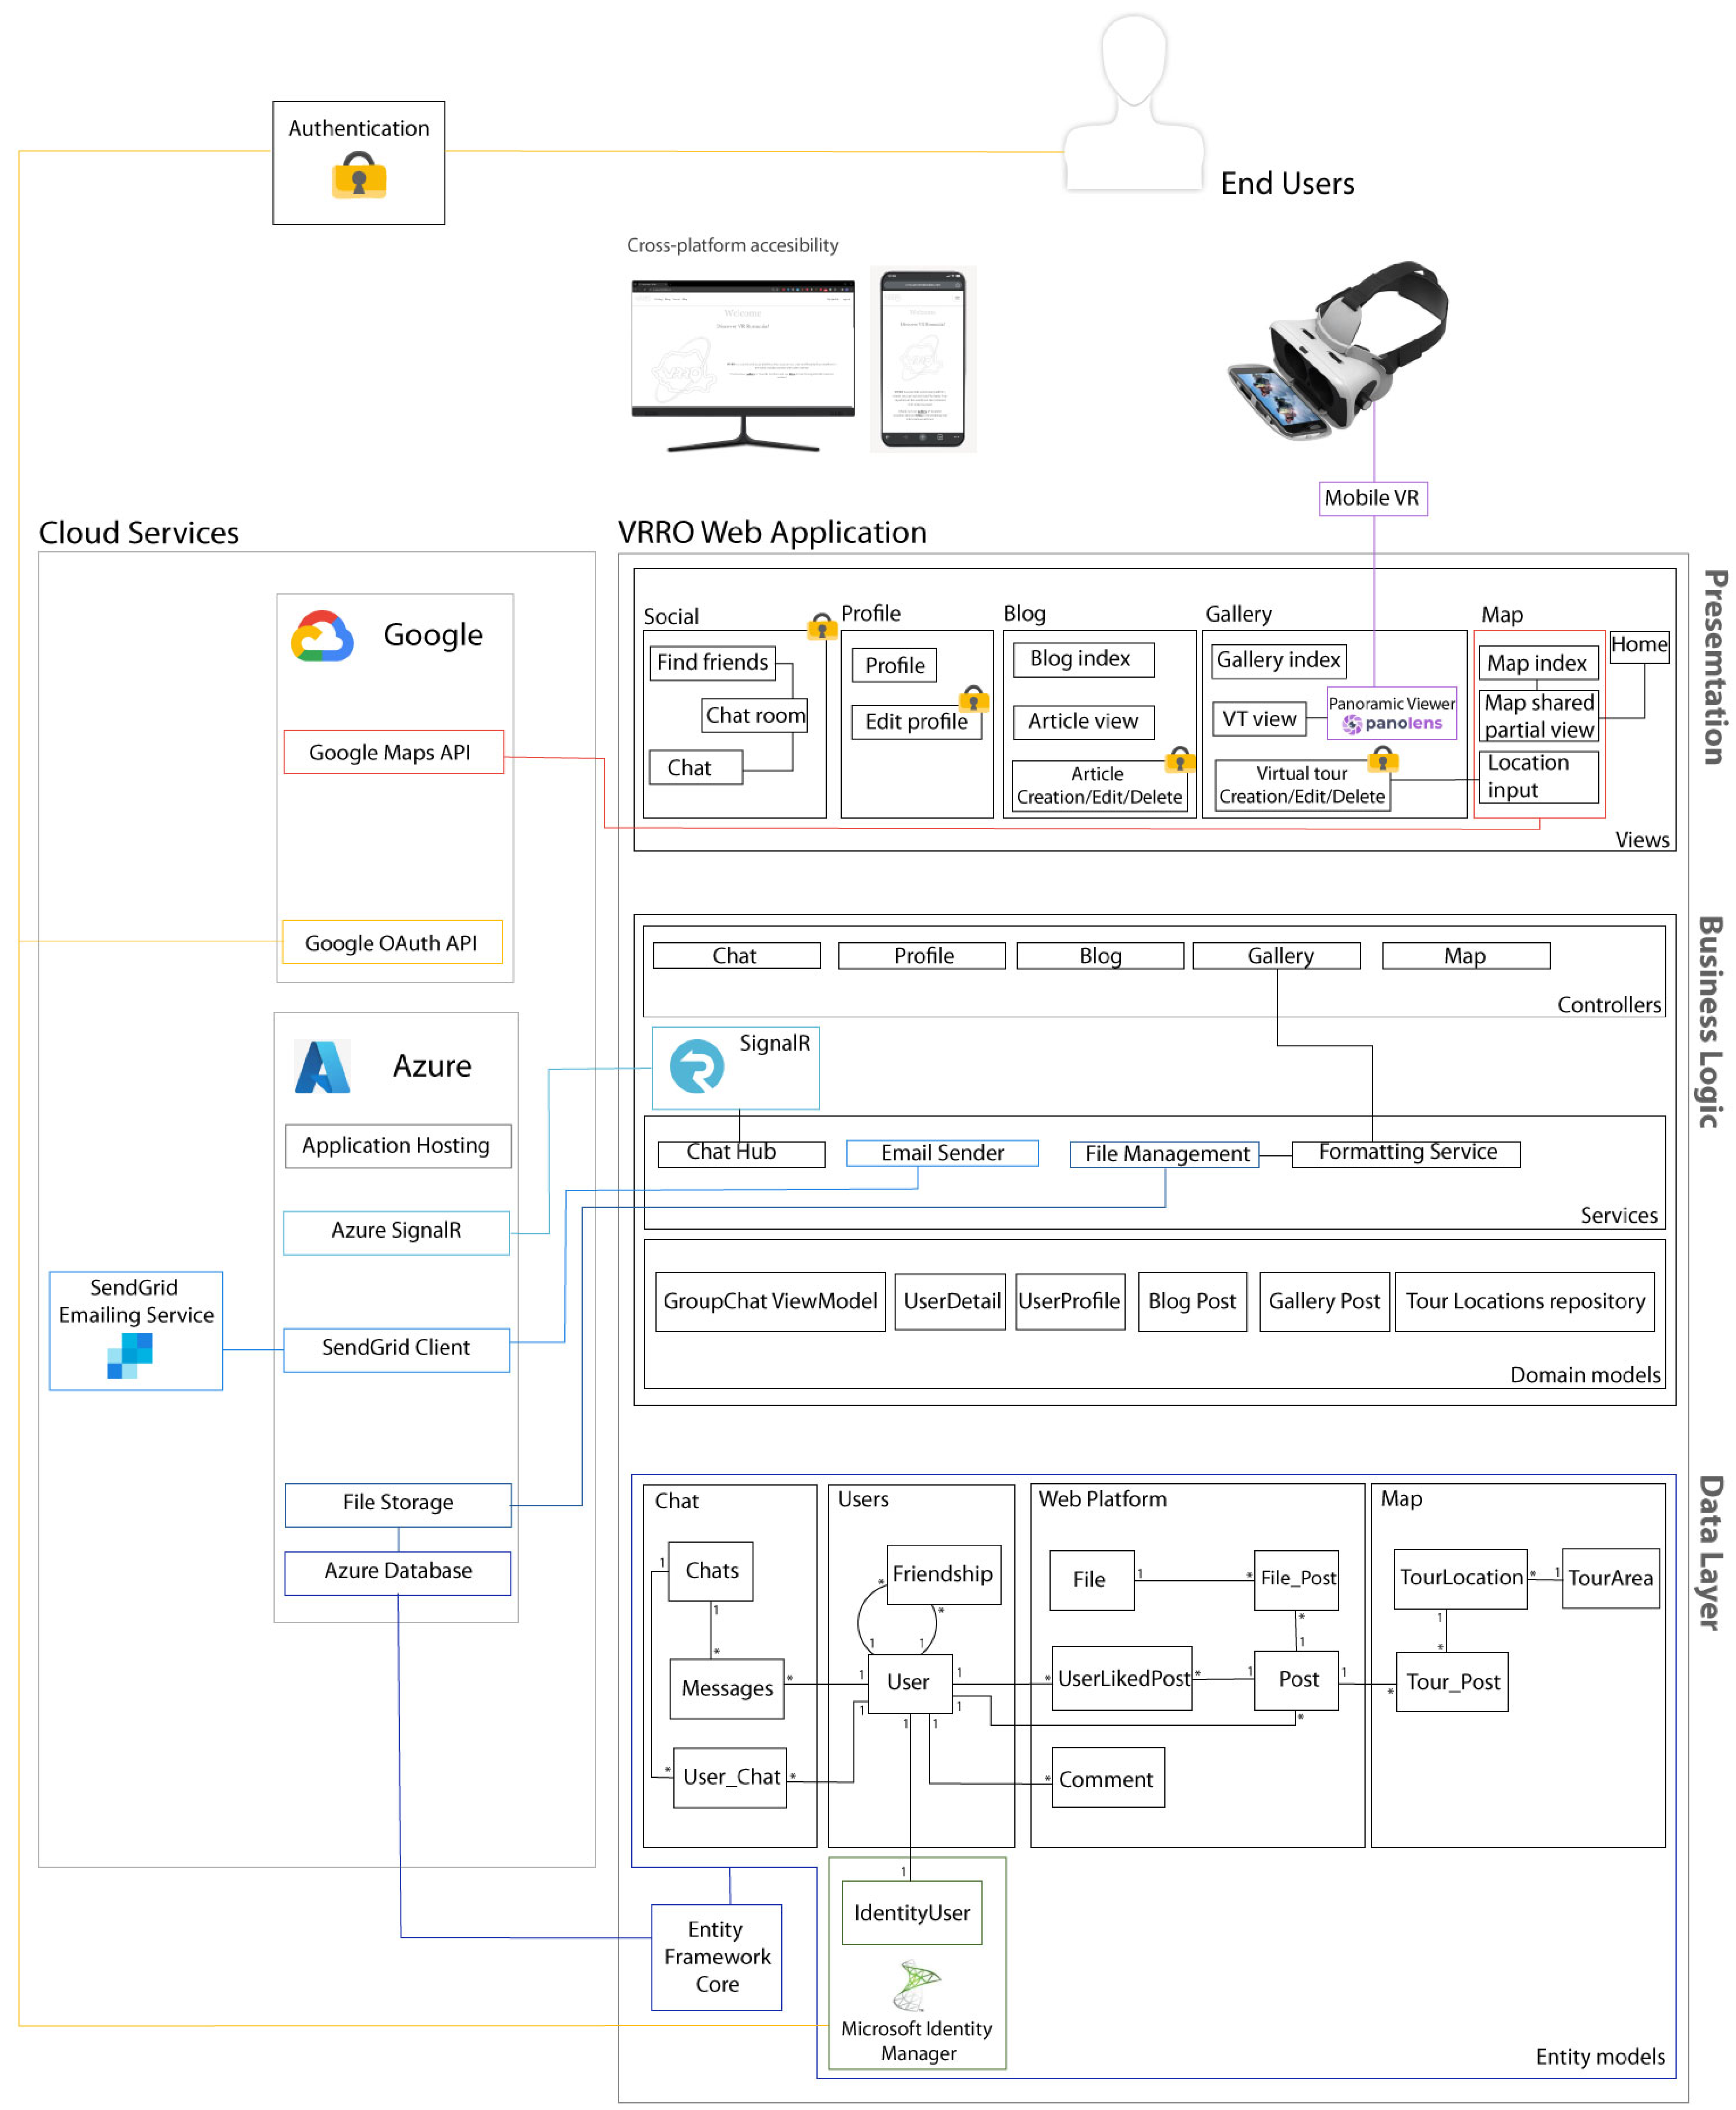
3.2. Architecture
3.2.1. Presentation Layer
3.2.2. Business Logic Layer
3.2.3. Data Layer
3.2.4. Cross-Layer Accessibility of Cloud Services
4. Empirical Study
4.1. Methodology
- Quantitative: The short form of the User Engagement Scale (UES) [31] was employed to gather numerical data on user engagement. Additionally, participant ratings of platform modules, self-assessed digital familiarity, and evaluations of future engagement intentions were included, offering a comprehensive view of user interaction and platform impact.
- Qualitative: Open-ended questions were used to collect qualitative data, providing deeper insights into users’ experiences and perceptions. This approach captured feedback on specific platform modules, suggestions for improvements, and challenges encountered during interaction. It also included aspects related to technology usage and participants’ self-evaluation of their activity on the platform.
- What kind of friends would you recommend this platform to?This question aims to identify the target audience for the VRRO platform based on user perceptions. It helps understand the platform’s appeal and potential user base from the perspective of current users.
- What did you feel this platform was missing?This question seeks to uncover gaps in the platform’s features and functionality, providing insights into areas for improvement and innovation.
- What was the most enjoyable part of the platform?Positive feedback helps to pinpoint the platform’s successful elements that can be emphasized and further developed. Understanding what users enjoy most can guide marketing strategies and the enhancement of key features that drive user engagement and satisfaction.
- What was the most annoying part of the platform?Identifying the negative aspects of the platform provides critical insights into user dissatisfaction and potential barriers to engagement.
- Please add any other observations you might want to share.This open-ended question allows users to provide additional feedback that may not have been covered by the other questions, ensuring that all relevant user experiences and insights are captured.
4.2. Results
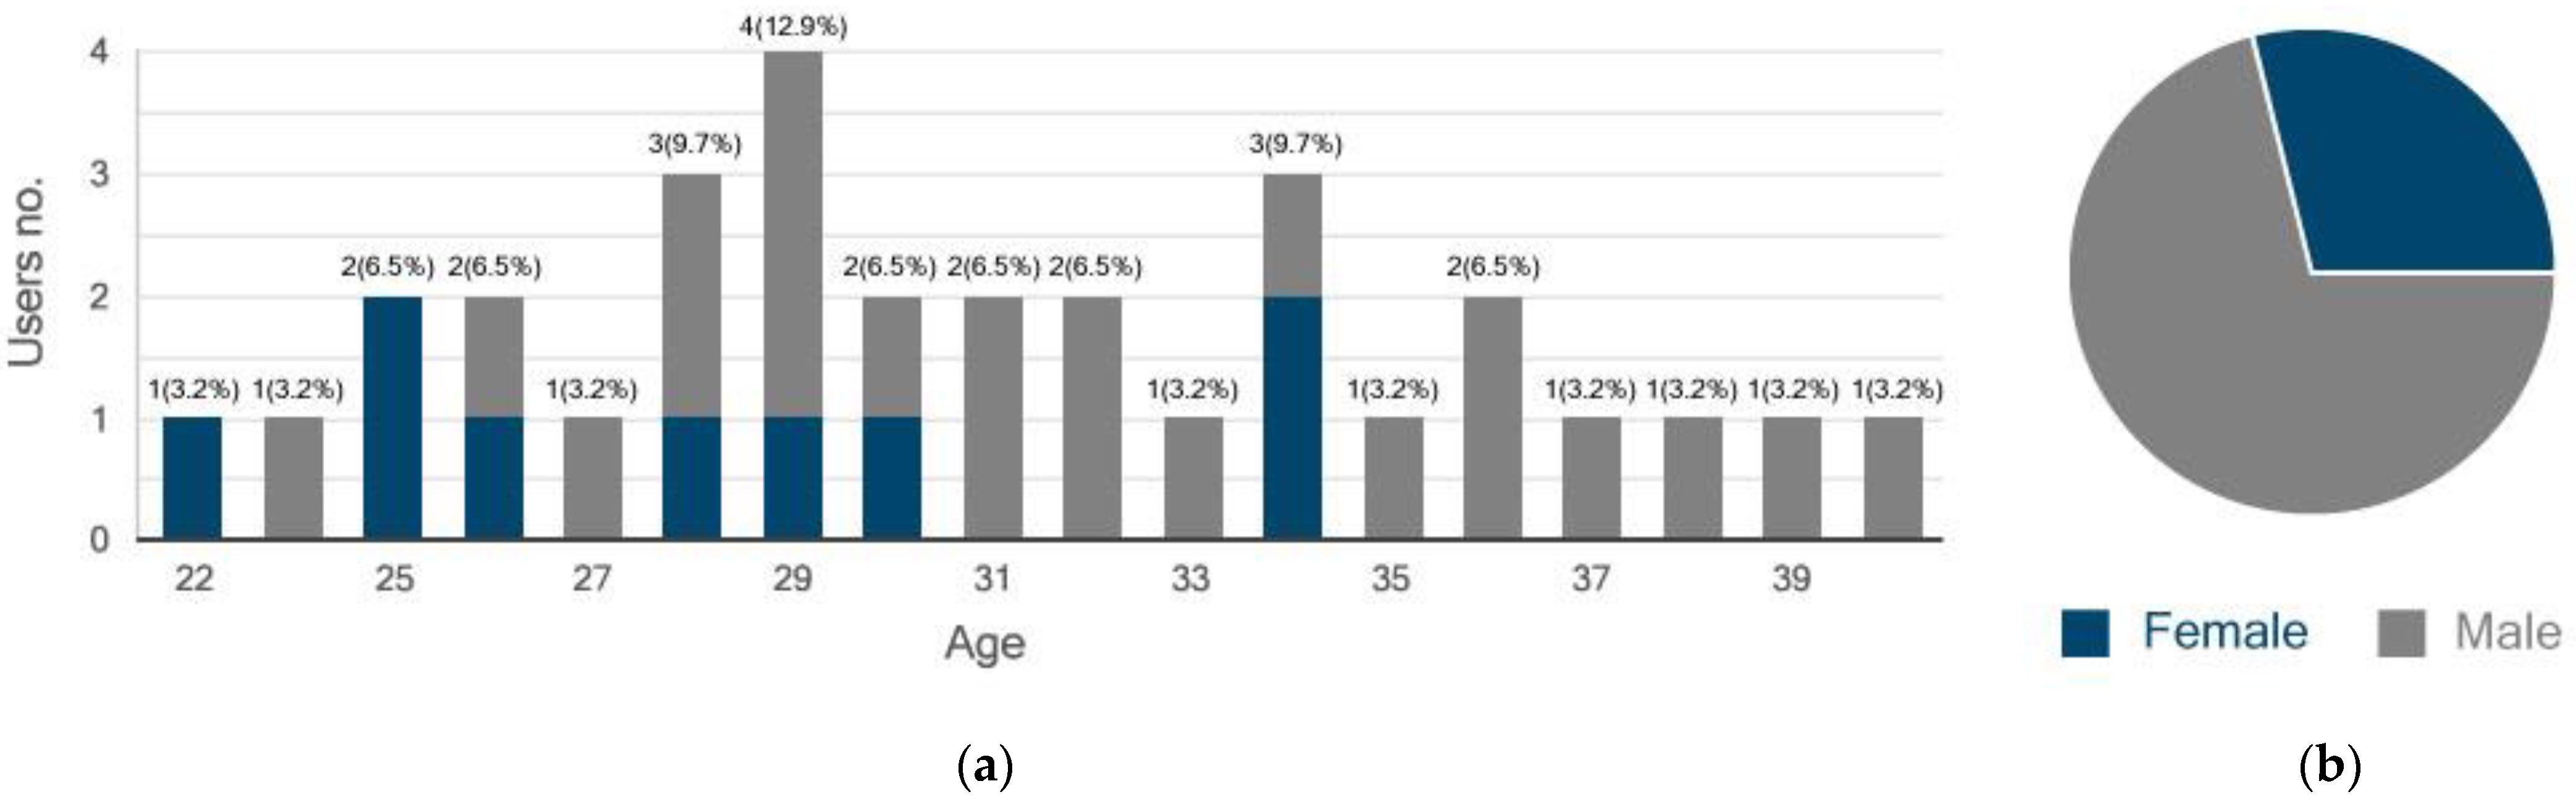
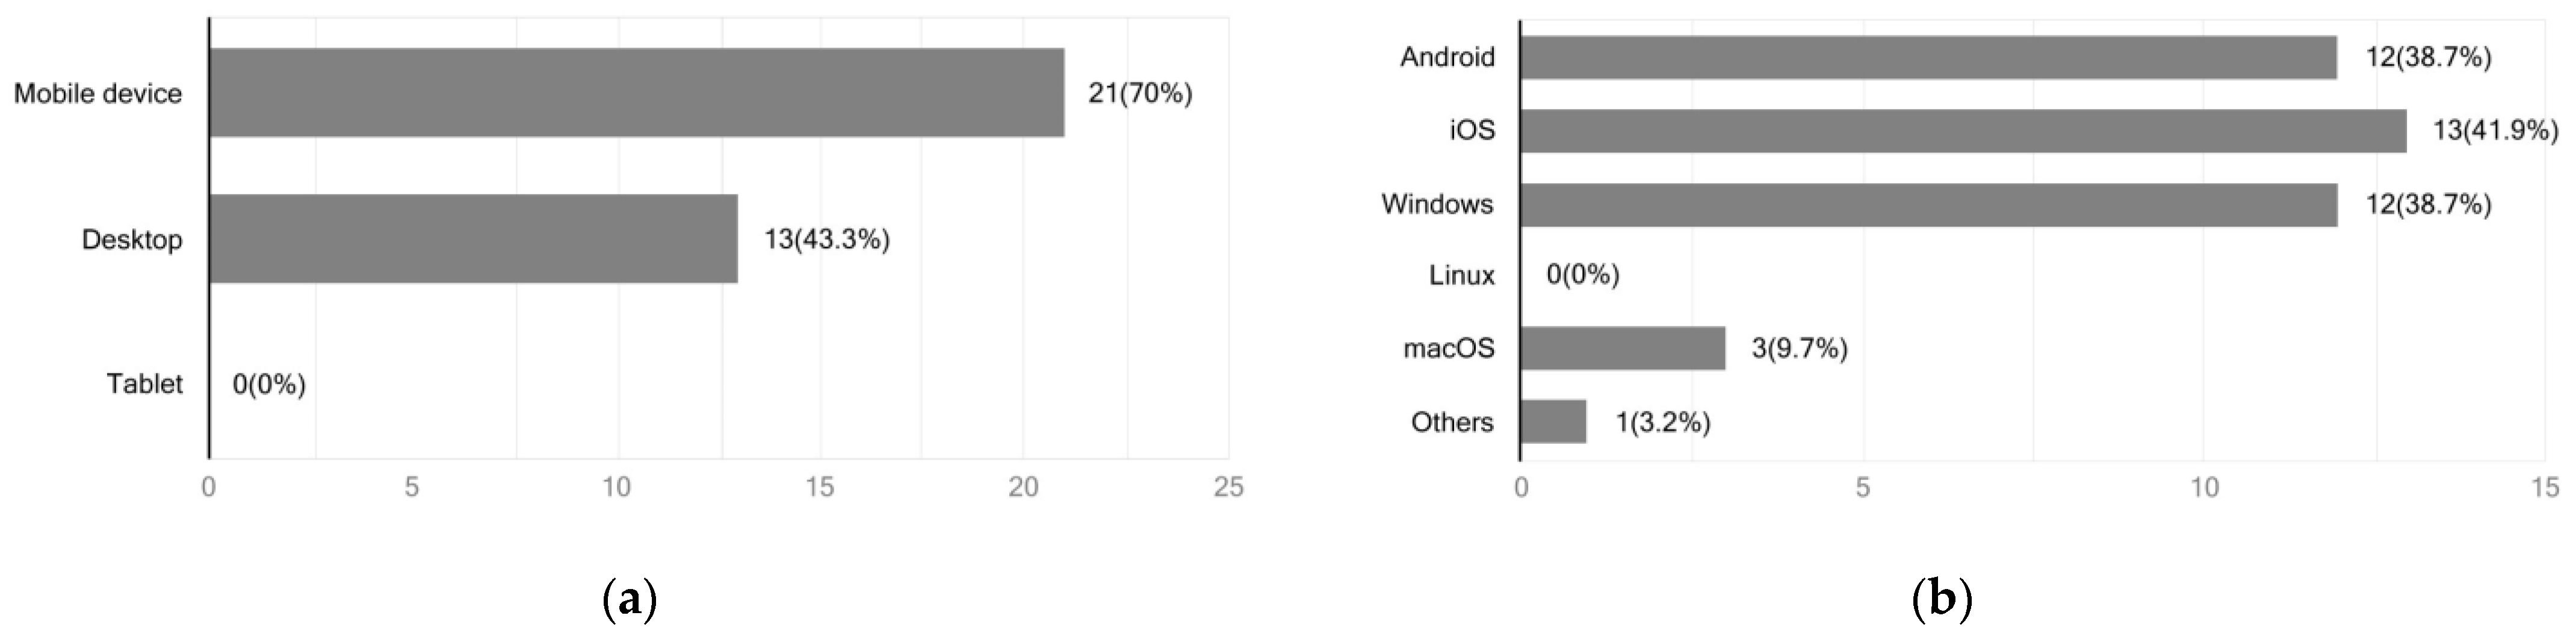
4.2.1. Activity
4.2.2. Engagement
4.2.3. The Influence of Digital Literacy on Experience
4.2.4. Qualitative Insights
4.3. Discussion
5. Conclusions and Broader Implications
5.1. Conclusions
5.2. Implications
5.2.1. Theoretical Implications
5.2.2. Practical Implications
5.3. Limitations and Future Research Directions
Author Contributions
Funding
Institutional Review Board Statement
Informed Consent Statement
Data Availability Statement
Acknowledgments
Conflicts of Interest
References
- Loureiro, S.M.C.; Nascimento, J. Shaping a View on the Influence of Technologies on Sustainable Tourism. Sustainability 2021, 13, 12691. [Google Scholar] [CrossRef]
- An EU Initiative to Reward Innovative and Smart Tourism in European Cities! Available online: https://smart-tourism-capital.ec.europa.eu/index_en (accessed on 15 October 2023).
- El-Said, O.; Aziz, H. Virtual Tours a Means to an End: An Analysis of Virtual Tours’ Role in Tourism Recovery Post COVID-19. J. Travel Res. 2022, 61, 528–548. [Google Scholar] [CrossRef]
- Bachiller, C.; Monzo, J.M.; Rey, B. Augmented and Virtual Reality to Enhance the Didactical Experience of Technological Heritage Museums. Appl. Sci. 2023, 13, 3539. [Google Scholar] [CrossRef]
- tom Dieck, D.; tom Dieck, M.C.; Jung, T.; Moorhouse, N. Tourists’ Virtual Reality Adoption: An Exploratory Study from Lake District National Park. Leis. Stud. 2018, 37, 371–383. [Google Scholar] [CrossRef]
- Mengjia, L.; Abu Bakar, A.Z.B.; Che Ishak, F.A.B.; Ab Karim, S. A Review on Social Media as a New Venue for Promoting Culinary Destinations. J. Gastron. Tour. 2023, 10, 181–194. [Google Scholar] [CrossRef]
- Kumar, P.; Mishra, J.M.; Rao, Y.V. Analysing Tourism Destination Promotion through Facebook by Destination Marketing Organizations of India. Curr. Issues Tour. 2021, 25, 1416–1431. [Google Scholar] [CrossRef]
- Garg, A.; Kumar, J. Social Media Marketing Influence on Boutique Hotel Customers’ Purchase Intention in Malaysia. Tour. Manag. Stud. 2021, 17, 51–62. [Google Scholar] [CrossRef]
- Boediman, S.F.; Hendriarto, P.; Satmoko, N.D.; Sulistiyani, S.; Sani, A. The Relevance of Using Social Media Applications Strategies to Increase Marketing Potential of Indonesian Maritime Tourism (Analytical Study of Tourism Journals and Online Marketing). Bp. Int. Res. Crit. Inst.-J. 2021, 4, 8791–8799. [Google Scholar]
- Tasse, D. How Geotagged Social Media Can Inform Modern Travelers. Ph.D. Thesis, Carnegie Mellon University, Pittsburgh, PA, USA, 2017. [Google Scholar]
- Chan, H.F.; Cho, H.J.; Lee, H.E. Examining the Use of Geotags on Instagram: Motivation, Satisfaction, and Location-Based Information Sharing in Hong Kong. Int. J. Internet Broadcast. Commun. 2022, 14, 64–77. [Google Scholar] [CrossRef]
- Kumar, P. Social Media as a Sustainable Tool for Tourism Marketing Communication. Saudi J. Bus. Manag. Stud. 2021, 6, 412–414. [Google Scholar] [CrossRef]
- Bosmos, F.; Tzallas, A.T.; Tsipouras, M.G.; Glavas, E.; Giannakeas, N. Virtual and Augmented Experience in Virtual Learning Tours. Information 2023, 14, 294. [Google Scholar] [CrossRef]
- Varelas, S. Virtual Immersive Platforms as a Strategic Innovative Destination Marketing Tool in the COVID-19 Era. Sustainability 2022, 14, 12867. [Google Scholar] [CrossRef]
- Loureiro, S.M.C.; Guerreiro, J.; Ali, F. 20 Years of Research on Virtual Reality and Augmented Reality in Tourism Context: A Text-Mining Approach. Tour. Manag. 2020, 77, 104028. [Google Scholar] [CrossRef]
- Yung, R.Y. The Future Is Now: Exploring the Effectiveness of Virtual Reality for Tourism Marketing Through Presence and Emotion. Ph.D. Thesis, Griffith Business School, Brisbane, Australia, 2021. [Google Scholar]
- Omran, W.; Ramos, R.F.; Casais, B. Virtual Reality and Augmented Reality Applications and Their Effect on Tourist Engagement: A Hybrid Review. J. Hosp. Tour. Technol. [CrossRef]
- Home Page-VR Ro. Available online: https://vrro.azurewebsites.net/ (accessed on 24 November 2023).
- Guttentag, D.A. Virtual Reality: Applications and Implications for Tourism. Tour. Manag. 2010, 31, 637–651. [Google Scholar] [CrossRef]
- Jokelainen, N. Bringing Singaporeans to See Northern Lights: How Can Virtual Reality Be Utilized in Travel Marketing? Master’s Thesis, Tampere University of Applied Sciences, Tampere, Finland, 2018. [Google Scholar]
- Lee, M.; Lee, S.A.; Jeong, M.; Oh, H. Quality of Virtual Reality and Its Impacts on Behavioral Intention. Int. J. Hosp. Manag. 2020, 90, 102595. [Google Scholar] [CrossRef]
- Nguyen, T.B.T.; Le, T.B.N.; Chau, N.T. How VR Technological Features Prompt Tourists’ Visiting Intention: An Integrated Approach. Sustainability 2023, 15, 4765. [Google Scholar] [CrossRef]
- Morrison, A.M.; Bag, S.; Mandal, K. Virtual Reality’s Impact on Destination Visit Intentions and the Moderating Role of Amateur Photography. Tour. Rev. 2023, 79, 355–377. [Google Scholar] [CrossRef]
- Ying, T.; Tang, J.; Ye, S.; Tan, X.; Wei, W. Virtual Reality in Destination Marketing: Telepresence, Social Presence, and Tourists’ Visit Intentions. J. Travel Res. 2021, 61, 1738–1756. [Google Scholar] [CrossRef]
- Adachi, R.; Cramer, E.M.; Song, H. Using Virtual Reality for Tourism Marketing: A Mediating Role of Self-Presence. Soc. Sci. J. 2022, 59, 657–670. [Google Scholar] [CrossRef]
- Anaya-Sánchez, R.; Rejón-Guardia, F.; Navarro Lucena, F.J.; Molinillo-Jiménez, S. Exploring the Impact of Virtual Reality Experiences on Intention to Visit Tourism Destinations: The Moderating Effect of Interactivity. In Proceedings of the AIRSI 2023–Metaverse Conference, Virtual, 16 May 2023. [Google Scholar] [CrossRef]
- Idris, I.; Adi, K.R.; Firmansyah, R.; Nadhianty, A.; Mobaroq, M.H.; Putri, P.G.; Pratama, A.S.; Wahono, E.R. Developing Smart Tourism Using Virtual Reality as A Tourism Promotion Strategy in Indonesia. Geo J. Tour. Geosites 2021, 35, 332–337. [Google Scholar] [CrossRef]
- Rueda Márquez de la Plata, A.; Cruz Franco, P.A.; Ramos Sánchez, J.A. Architectural Survey, Diagnostic, and Constructive Analysis Strategies for Monumental Preservation of Cultural Heritage and Sustainable Management of Tourism. Buildings 2022, 12, 1156. [Google Scholar] [CrossRef]
- Balakrishnan, J.; Dwivedi, Y.K.; Malik, F.T.; Baabdullah, A.M. Role of Smart Tourism Technology in Heritage Tourism Development. J. Sustain. Tour. 2021, 31, 2506–2525. [Google Scholar] [CrossRef]
- Caciora, T.; Herman, G.V.; Ilieş, A.; Baias, Ş.; Ilieş, D.C.; Josan, I.; Hodor, N. The Use of Virtual Reality to Promote Sustainable Tourism: A Case Study of Wooden Churches Historical Monuments from Romania. Remote Sens. 2021, 13, 1758. [Google Scholar] [CrossRef]
- Piechotka, A.P.; Lukasik, N.; Tryzno, A.O.; Piechotka, M.; Sawicka, K. Holistic Technical Solutions to Enhance Accessible Tourism in the UNESCO World Heritage Sites. In Handbook of Research on Holistic Optimization Techniques in the Hospitality, Tourism, and Travel Industry; IGI Global: Hershey, PA, USA, 2016; pp. 1–26. ISBN 9781522510550. [Google Scholar]
- Kakirala, A.K.; Singh, D.P. The Mediating Role of Social Media in Tourism: An EWOM Approach. J. Asian Financ. Econ. Bus. 2020, 7, 381–391. [Google Scholar] [CrossRef]
- Harshavardhini, N.A.P.; Nair, S.; Dileep Kumar, M.; Feston, N.; Govindarajo, N.S. Impact of E-WOM Message Characteristics on Its Perceived Usefulness in International Tourism. Int. J. Health Sci. 2022, 6, 7876–7889. [Google Scholar] [CrossRef]
- Chavez, L.; Ruiz, C.; Curras, R.; Hernandez, B. The Role of Travel Motivations and Social Media Use in Consumer Interactive Behaviour: A Uses and Gratifications Perspective. Sustainability 2020, 12, 8789. [Google Scholar] [CrossRef]
- Marinello, S.; Butturi, M.A.; Gamberini, R.; Martini, U. Indicators for Sustainable Touristic Destinations: A Critical Review. J. Environ. Plan. Manag. 2023, 66, 1–30. [Google Scholar] [CrossRef]
- Jiang, C.; Phoong, S.W. A Ten-Year Review Analysis of the Impact of Digitization on Tourism Development (2012–2022). Humanit. Soc. Sci. Commun. 2023, 10, 665. [Google Scholar] [CrossRef]
- Maietti, F. Heritage Enhancement through Digital Tools for Sustainable Fruition—A Conceptual Framework. Sustainability 2023, 15, 11799. [Google Scholar] [CrossRef]
- Gegung, E.M. International Tourism and The COVID-19 Pandemic: The Use of Virtual Reality to Increase Tourism Destination Sustainability and How Users Perceive The Authenticity of VR Experiences. J. Kepariwisataan Indones. J. Penelit. Dan Pengemb. Kepariwisataan Indones 2021, 15, 9–15. [Google Scholar] [CrossRef]
- Talwar, S.; Kaur, P.; Nunkoo, R.; Dhir, A. Digitalization and Sustainability: Virtual Reality Tourism in a Post Pandemic World. J. Sustain. Tour. 2023, 31, 2564–2591. [Google Scholar] [CrossRef]
- Folgado-Fernández, J.A.; Rojas-Sánchez, M.; Palos-Sánchez, P.R.; Casablanca-Peña, A.G. Can Virtual Reality Become an Instrument in Favor of Territory Economy and Sustainability? J. Tour. Serv. 2023, 14, 92–117. [Google Scholar] [CrossRef]
- Peštek, A.; Sarvan, M. Traveling before Traveling: Virtual Reality Marketing in Support of Greater Tourism Sustainability. Acta Tur. 2020, 32, 39–74. [Google Scholar] [CrossRef]
- Costa, J.; Montenegro, M.; Gomes, J. Sustainability as a Measure of Tourism Success: The Portuguese Promotional Tourism Boards’ View. Worldw. Hosp. Tour. Themes 2022, 14, 65–71. [Google Scholar] [CrossRef]
- Uppink, L.; Soshkin, M. Travel & Tourism Development Index 2021: Rebuilding for a Sustainable and Resilient Future, World Economic Forum. 2022. Available online: https://www.weforum.org/publications/travel-and-tourism-development-index-2021/ (accessed on 6 May 2024).
- Dozhdeva, V. Building a Sustainable and Resilient Tourism: The Role of Regional Policy, EoRPA Report 22/4, EoRPA Regional Policy Research, European Policies Research Centre, University of Strathclyde, Glasgow and EPRC Delft. 2022. Available online: https://eprc-strath.org/publication/building-a-sustainable-and-resilient-tourism-economy-the-role-of-regional-policy/ (accessed on 6 May 2024).
- Gidebo, H.B. Factors Determining International Tourist Flow to Tourism Destinations: A Systematic Review. J. Hosp. Manag. Tour. 2021, 12, 9–17. [Google Scholar] [CrossRef]
- Lee, H.; Chung, N.; Nam, Y. Do Online Information Sources Really Make Tourists Visit More Diverse Places?: Based on the Social Networking Analysis. Inf. Process. Manag. 2018, 56, 1376–1390. [Google Scholar] [CrossRef]
- Buranasing, W.; Meeklai, P.; Pattarathananan, P. Recommendation System for Lesser-Known Places to Visit in Thailand. In Proceedings of the ACM International Conference Proceeding Series, Xiamen, China, 19–21 November 2021; Association for Computing Machinery: New York, NY, USA, 2021; pp. 24–28. [Google Scholar] [CrossRef]
- Lau, P.L.; Koo, T.T.R. Online Popularity of Destinations in Australia: An Application of Polya Urn Process to Search Engine Data. J. Hosp. Tour. Manag. 2020, 42, 277–285. [Google Scholar] [CrossRef]
- Ozkaya, G.; Demirhan, A. Multi-Criteria Analysis of Sustainable Travel and Tourism Competitiveness in Europe and Eurasia. Sustainability 2022, 14, 15396. [Google Scholar] [CrossRef]
- Băbăț, A.F.; Mazilu, M.; Niță, A.; Drăguleasa, I.A.; Grigore, M. Tourism and Travel Competitiveness Index: From Theoretical Definition to Practical Analysis in Romania. Sustainability 2023, 15, 10157. [Google Scholar] [CrossRef]
- Mitrică, B.; Şerban, P.R.; Mocanu, I.; Damian, N.; Grigorescu, I.; Dumitraşcu, M.; Dumitrică, C. Developing an Indicator-Based Framework to Measure Sustainable Tourism in Romania. A Territorial Approach. Sustainability 2021, 13, 2649. [Google Scholar] [CrossRef]
- Ivasciuc, I.S.; Constantin, C.P.; Candrea, A.N.; Ispas, A. Digital Landscapes: Analyzing the Impact of Facebook Communication on User Engagement with Romanian Ecotourism Destinations. Land 2024, 13, 432. [Google Scholar] [CrossRef]
- Ban, O.; Hatos, A.; Droj, L.; Toderașcu, C. Investigating the Image of the Bihor Tourist Destination among Romanians in the Context of Increasing Economic Indicators of Tourist Activity. Sustainability 2021, 13, 9002. [Google Scholar] [CrossRef]
- Cecotti, H. Cultural Heritage in Fully Immersive Virtual Reality. Virtual Worlds 2022, 1, 82–102. [Google Scholar] [CrossRef]
- Bekele, M.K.; Champion, E. A Comparison of Immersive Realities and Interaction Methods: Cultural Learning in Virtual Heritage. Front. Robot. AI 2019, 6, 91. [Google Scholar] [CrossRef]
- Poux, F.; Valembois, Q.; Mattes, C.; Kobbelt, L.; Billen, R. Initial User-Centered Design of a Virtual Reality Heritage System: Applications for Digital Tourism. Remote Sens. 2020, 12, 2583. [Google Scholar] [CrossRef]
- Kersten, T.P.; Tschirschwitz, F.; Deggim, S.; Lindstaedt, M. Virtual Reality for Cultural Heritage Monument–from 3D Data Recording to Immersive Visualisation. In Proceedings of the Digital Heritage, Progress in Cultural Heritage: Documentation, Preservation, and Protection, Nicosia, Cyprus, 3 November 2018; Springer International Publishing: Cham, Switzerland; Nicosia, Cyprus, 2018; Volume 11197 LNCS, pp. 74–83. [Google Scholar] [CrossRef]
- Park, H.; Kim, J.; Bang, S.; Woo, W. The Effect of Applying Film-Induced Tourism to Virtual Reality Tours of Cultural Heritage Sites. In Proceedings of the 3rd Digital Heritage International Congress, Digital Heritage 2018-Held jointly with the 2018 24th International Conference on Virtual Systems and Multimedia, San Francisco, CA, USA, 26–30 October 2018; Institute of Electrical and Electronics Engineers Inc.: Piscataway, NJ, USA, 2018; pp. 1–4. [Google Scholar] [CrossRef]
- Tussyadiah, I.P.; Wang, D.; Jung, T.H.; tom Dieck, M.C. Virtual Reality, Presence, and Attitude Change: Empirical Evidence from Tourism. Tour. Manag. 2018, 66, 140–154. [Google Scholar] [CrossRef]
- Prodan, S.G.; Egresi, I. Virtual Reality in Destination Marketing: The Why, the Who and the When. Stud. Univ. Babeș-Bolyai Geogr. 2023, 68, 95–138. [Google Scholar] [CrossRef]
- Losada, N.; Jorge, F.; Teixeira, M.S.; Melo, M.; Bessa, M. Could Virtual Reality Substitute the ‘Real’ Experience? Evidence from a UNESCO World Heritage Site in Northern Portugal. Smart Innov. Syst. Technol. 2021, 209, 153–161. [Google Scholar] [CrossRef]
- Kurniasari, K.K.; Ayu, J.P.; Octavanny, V. Understanding Tourists’ Motivation in Virtual Tour. Int. J. Appl. Sci. Tour. Events 2022, 6, 31–41. [Google Scholar] [CrossRef]
- Singh, S.; Bashar, A. A Bibliometric Review on the Development in E-Tourism Research. Int. Hosp. Rev. 2021, 37, 71–93. [Google Scholar] [CrossRef]
- Guedes, A.; Faria, S.; Gouveia, S.; Rebelo, J. The Effect of Virtual Proximity and Digital Adoption on International Tourism Flows to Southern Europe. Tour. Econ. 2022, 29, 1643–1661. [Google Scholar] [CrossRef]
- Pratisto, E.H.; Thompson, N.; Potdar, V. Immersive Technologies for Tourism: A Systematic Review. Inf. Technol. Tour. 2022, 24, 181–219. [Google Scholar] [CrossRef]
- Spielmann, N.; Mantonakis, A. In Virtuo: How User-Driven Interactivity in Virtual Tours Leads to Attitude Change. J. Bus. Res. 2018, 88, 255–264. [Google Scholar] [CrossRef]
- Ionescu, A.M.; Sârbu, F.A. Exploring the Impact of Smart Technologies on the Tourism Industry. Sustainability 2024, 16, 3318. [Google Scholar] [CrossRef]
- Torabi, Z.A.; Pourtaheri, M.; Hall, C.M.; Sharifi, A.; Javidi, F. Smart Tourism Technologies, Revisit Intention, and Word-of-Mouth in Emerging and Smart Rural Destinations. Sustainability 2023, 15, 10911. [Google Scholar] [CrossRef]
- Balakrishnan, J.; Dwivedi, Y.K.; Mishra, A.; Malik, F.T.; Giannakis, M. The Role of Embodiment and Ergonomics in Immersive VR Tours in Creating Memorable Tourism Experiences. Int. J. Contemp. Hosp. Manag. [CrossRef]
- Garcia-Haro, M.A.; Martinez-Ruiz, M.P.; Martinez-Cañas, R.; Ruiz-Palomino, P. Benefits of Online Sources of Information in the Tourism Sector: The Key Role of Motivation to Co-Create. J. Theor. Appl. Electron. Commer. Res. 2021, 16, 2051–2072. [Google Scholar] [CrossRef]
- Liu, X.; Mehraliyev, F.; Liu, C.; Schuckert, M. The Roles of Social Media in Tourists’ Choices of Travel Components. Tour. Stud. 2020, 20, 27–48. [Google Scholar] [CrossRef]
- Filieri, R.; Alguezaui, S.; McLeay, F. Why Do Travelers Trust TripAdvisor? Antecedents of Trust towards Consumer-Generated Media and Its Influence on Recommendation Adoption and Word of Mouth. Tour. Manag. 2015, 51, 174–185. [Google Scholar] [CrossRef]
- Beck, J.; Rainoldi, M.; Egger, R. Virtual Reality in Tourism: A State-of-the-Art Review. Tour. Rev. 2019, 74, 586–612. [Google Scholar] [CrossRef]
- Panolens.Js. Available online: https://pchen66.github.io/Panolens/ (accessed on 20 October 2023).
- EUR-Lex-32016R0679-EN-EUR-Lex. Available online: https://eur-lex.europa.eu/eli/reg/2016/679/oj (accessed on 16 October 2023).
- What Is Azure SignalR Service?|Microsoft Learn. Available online: https://learn.microsoft.com/en-us/azure/azure-signalr/signalr-overview (accessed on 21 November 2023).
- WYSIWYG HTML Editor with Collaborative Rich Text Editing. Available online: https://ckeditor.com/ (accessed on 21 November 2023).
- NET (and.NET Core)-Introduction and Overview-.NET|Microsoft Learn. Available online: https://learn.microsoft.com/en-us/dotnet/core/introduction (accessed on 20 October 2023).
- Overview of Entity Framework Core-EF Core|Microsoft Learn. Available online: https://learn.microsoft.com/en-us/ef/core/ (accessed on 20 October 2023).
- Azure SQL Database–Managed Cloud Database Service|Microsoft Azure. Available online: https://azure.microsoft.com/en-gb/products/azure-sql/database (accessed on 21 November 2023).
- Web Content Accessibility Guidelines (WCAG) 2.1. Available online: https://www.w3.org/TR/WCAG21/ (accessed on 23 November 2023).
- Cloud Computing Services|Microsoft Azure. Available online: https://azure.microsoft.com/en-us (accessed on 21 November 2023).
- Google Maps Platform-Location and Mapping Solutions. Available online: https://mapsplatform.google.com/ (accessed on 20 October 2023).
- Authentication Methods at Google|Google Cloud. Available online: https://cloud.google.com/docs/authentication (accessed on 21 November 2023).
- SendGrid Email API and Email Marketing Campaigns|SendGrid. Available online: https://sendgrid.com/en-us (accessed on 6 May 2024).
- Microsoft Identity Platform Documentation|Microsoft Learn. Available online: https://learn.microsoft.com/en-us/entra/identity-platform/ (accessed on 21 November 2023).
- Nazare, K. Google Forms|VRRO User Experience Survey. Available online: https://docs.google.com/forms/d/e/1FAIpQLSfZDKQgXiUAwtduKjeBGHRuFr3RHTu__87rEjO2K2wnFjqLWg/viewform (accessed on 22 November 2023).
- Nazare, K. VRRO User Engagement Survey Data, Version 1; Mendeley Data: London, UK, 2023. [Google Scholar] [CrossRef]
- Rubin, J.; Chisnell, D. Handbook Of Usability Testing, 2nd ed.; Society for Technical Communication: Fairfax, VA, USA, 2008; ISBN 978-0-470-18548-3. [Google Scholar]
- Lalmas, M.; O’Brien, H.; Yom-Tov, E. Measuring User Engagement; Synthesis Lectures on Information Concepts, Retrieval, and Services; Springer International Publishing: Cham, Switzerland, 2014; ISBN 978-3-031-01161-0. [Google Scholar]
- Neuhofer, B.; Buhalis, D.; Ladkin, A. Technology as a Catalyst of Change: Enablers and Barriers of the Tourist Experience and Their Consequences. In Proceedings of the Information and Communication Technologies in Tourism, Lugano, Switzerland, 3–6 February 2015; Springer: Cham, Switzerland, 2015; pp. 789–802. [Google Scholar] [CrossRef]
- Neuhofer, B.; Buhalis, D.; Ladkin, A. Smart Technologies for Personalized Experiences: A Case Study in the Hospitality Domain. Electron. Mark. 2015, 25, 243–254. [Google Scholar] [CrossRef]


| Factor | Description | Affirmations |
|---|---|---|
| FA | Focused attention feeling absorbed in the interaction and losing track of time. | I lost myself in this experience. |
| The time I spent using VRRO just slipped away. | ||
| I was absorbed in this experience. | ||
| PU | Perceived usability, negative affect experienced in the interaction, and the degree of control and effort expended. | I felt frustrated while using VRRO. |
| I found VRRO confusing to use. | ||
| Using VRRO was taxing. | ||
| AE | Aesthetic appeal, the attractiveness and visual appeal of the interface. | VRRO was attractive. |
| VRRO was aesthetically appealing. | ||
| VRRO appealed to my senses. | ||
| RF | Reward factor, curiosity, interest, felt involvement, and the overall success of the interaction. | Using VRRO was worthwhile. |
| My experience was rewarding. | ||
| I felt interested in this experience. |
| Factor | Focused Attention | FA 1 | FA 2 | FA 3 | Perceived Usability | Aesthetic Appeal | Reward Factor | UES (Overall) |
|---|---|---|---|---|---|---|---|---|
| Score | 2.97 | 2.29 | 3.23 | 3.39 | 4.56 | 3.70 | 3.97 | 3.81 |
| Question Categories | Average Score |
|---|---|
| Commemorate Travels | 4.10 |
| Connect with Travelers | 3.65 |
| Pre-travel Information | 4.06 |
| Inform Other Travelers | 4.10 |
| Future Platform Use | 3.94 |
| Recommend to Friends | 4.23 |
| Drive Index | 3.98 |
| Endurability Index | 4.05 |
| Module | Map | VT Viewer | VT Creator | Article Viewer | Article Creator | Chat |
|---|---|---|---|---|---|---|
| Rating | 4.03 | 4.03 | 4.00 | 4.13 | 4.14 | 3.14 |
| Module | UES | Open Access Modules | Advanced Features | Endurability |
|---|---|---|---|---|
| Rating | 3.81 | 4.06 | 3.76 | 4.05 |
| Factor | All Participants | High Web Familiarity | High XR Familiarity | Low Web Familiarity | Low XR Familiarity |
|---|---|---|---|---|---|
| UES | 3.81 | 3.81 | 3.93 | 3.81 | 3.71 |
| VT Viewer | 4.03 | 4.00 | 4.11 | 4.11 | 3.92 |
| Article Viewer | 4.13 | 4.05 | 4.11 | 4.33 | 4.15 |
| Map | 4.03 | 3.95 | 4.11 | 4.22 | 3.92 |
| Variable | Shapiro–Wilk W | p-Value | Std. Deviation (S) | |
|---|---|---|---|---|
| UES | 0.9749 | 0.6616 | 3.8118 | 0.5137 |
| VT Viewer | 0.8253 | <0.001 | 4.0323 | 1.016 |
| Article Viewer | 0.7897 | <0.001 | 4.129 | 1.0565 |
| Map | 0.8174 | <0.001 | 4.0323 | 1.0796 |
| Web Familiarity | 0.5904 | <0.001 | 4.5484 | 0.85 |
| XR Familiarity | 0.875 | 0.0018 | 3.7097 | 1.1603 |
| Variable | Technology Familiarity | Mann–Whitney U | p-Value | Cohen’s d | Glass’s Delta | Hedges’ g |
|---|---|---|---|---|---|---|
| UES | Web | 91 | 0.7414 | 0.008 | 0.007 | 0.008 |
| Immersive | 102.5 | 0.3843 | 0.380 | 0.362 | 0.377 | |
| VT Viewer | Web | 95.5 | 0.89656 | 0.121 | 0.096 | 0.108 |
| Immersive | 110 | 0.79486 | 0.111 | 0.106 | 0.110 | |
| Article Viewer | Web | 91.5 | 0.76418 | 0.297 | 0.245 | 0.270 |
| Immersive | 107.5 | 0.71884 | 0.098 | 0.094 | 0.097 | |
| Map | Web | 94.5 | 0.86502 | 0.273 | 0.220 | 0.245 |
| Immersive | 106 | 0.67448 | 0.031 | 0.028 | 0.030 |
Disclaimer/Publisher’s Note: The statements, opinions and data contained in all publications are solely those of the individual author(s) and contributor(s) and not of MDPI and/or the editor(s). MDPI and/or the editor(s) disclaim responsibility for any injury to people or property resulting from any ideas, methods, instructions or products referred to in the content. |
© 2024 by the authors. Licensee MDPI, Basel, Switzerland. This article is an open access article distributed under the terms and conditions of the Creative Commons Attribution (CC BY) license (https://creativecommons.org/licenses/by/4.0/).
Share and Cite
Nazare, A.-K.; Moldoveanu, A.; Moldoveanu, F. Virtual Journeys, Real Engagement: Analyzing User Experience on a Virtual Travel Social Platform. Information 2024, 15, 396. https://doi.org/10.3390/info15070396
Nazare A-K, Moldoveanu A, Moldoveanu F. Virtual Journeys, Real Engagement: Analyzing User Experience on a Virtual Travel Social Platform. Information. 2024; 15(7):396. https://doi.org/10.3390/info15070396
Chicago/Turabian StyleNazare, Ana-Karina, Alin Moldoveanu, and Florica Moldoveanu. 2024. "Virtual Journeys, Real Engagement: Analyzing User Experience on a Virtual Travel Social Platform" Information 15, no. 7: 396. https://doi.org/10.3390/info15070396
APA StyleNazare, A.-K., Moldoveanu, A., & Moldoveanu, F. (2024). Virtual Journeys, Real Engagement: Analyzing User Experience on a Virtual Travel Social Platform. Information, 15(7), 396. https://doi.org/10.3390/info15070396