Abstract
Online platforms have become the primary means for travellers to search, compare, and book accommodations for their trips. Consequently, online platforms and revenue managers must acquire a comprehensive comprehension of these dynamics to formulate a competitive and appealing offerings. Recent advancements in natural language processing, specifically through the development of large language models, have demonstrated significant progress in capturing the intricate nuances of human language. On the other hand, knowledge graphs have emerged as potent instruments for representing and organizing structured information. Nevertheless, effectively integrating these two powerful technologies remains an ongoing challenge. This paper presents an innovative deep learning methodology that combines large language models with domain-specific knowledge graphs for classification of tourism offers. The main objective of our system is to assist revenue managers in the following two fundamental dimensions: (i) comprehending the market positioning of their accommodation offerings, taking into consideration factors such as accommodation price and availability, together with user reviews and demand, and (ii) optimizing presentations and characteristics of the offerings themselves, with the intention of improving their overall appeal. For this purpose, we developed a domain knowledge graph covering a variety of information about accommodations and implemented targeted feature engineering techniques to enhance the information representation within a large language model. To evaluate the effectiveness of our approach, we conducted a comparative analysis against alternative methods on four datasets about accommodation offers in London. The proposed solution obtained excellent results, significantly outperforming alternative methods.
1. Introduction
In the digital transformation era, online platforms have become the primary means for travellers to search, compare, and book travel accommodations. With the vast amount of information available, finding the most suitable option can be overwhelming for users. Moreover, travellers often have distinct preferences, such as location, amenities, price range, and specific interests. Consequently, online platforms and revenue managers (In the tourism domain, a person whose job is to optimize the performance of an accommodation is commonly referred to as a “revenue manager” or a “revenue optimization manager”) in the hospitality industry must acquire a comprehensive comprehension of these dynamics to formulate a competitive and appealing offering [1].
Recent advancements in Natural Language Processing (NLP), specifically through the development of large language models based on transformers, have demonstrated significant progress in capturing the intricate nuances of human language [2]. Transformer-based models have exhibited remarkable capabilities in diverse natural language understanding tasks, including language generation, sentiment analysis, and question answering [3,4,5,6]. A wide range of systems now rely on these technologies, including modern conversational agents [7,8], medical applications [9], translation systems [10], and even tools for literature reviews [11]. On the other hand, knowledge graphs have emerged as potent instruments for representing and organizing structured information in a semantic manner [12]. These knowledge bases effectively capture the relationships between entities and attributes, providing a machine-readable depiction of the domain to various intelligent services [13]. Typically, knowledge graphs structure information based on a domain ontology [14], which formally describes entity types and relationships while supporting reasoning processes. They can also be automatically refined by means of link prediction techniques, which aim to identify additional relationships between domain entities [15,16].
Nevertheless, effectively integrating these two powerful technologies remains an ongoing challenge, giving rise to several intriguing issues [17]. The primary challenges revolve around effectively combining information from unstructured and structured data sources, as well as appropriately encoding knowledge graph information [18].
This paper presents KGE-BERT (Knowledge Graph Enhanced BERT), an innovative deep learning methodology that combines large language models with domain knowledge graphs with the goal of classifying tourism offers. Our approach employs transformer models to acquire a comprehensive understanding of accommodation descriptions that are expressed as unstructured texts. This acquired knowledge is then seamlessly combined with a detailed depiction of the tourism domain obtained from a knowledge graph that we generated using Airbnb data, improving the classification capabilities of the system. The underlying knowledge graph (Tourism Knowledge Graph—London) describes over 65,000 accommodations modelled according to the Tourism Analytic Ontology (TAO) (see http://purl.org/tao/ns, accessed on 1 July 2024).
The main objective of our system is to assist revenue managers in the following two fundamental dimensions: (i) comprehending the market positioning of their accommodation offerings, taking into account price and availability, together with user reviews and demand, and (ii) optimizing their offerings on online platforms. This optimization can be achieved through improvements in the style and level of detail provided in the descriptions or through modifications to the accommodations themselves. For instance, introducing new amenities that are typically associated with better reviews can enhance the overall appeal of the offering.
More specifically, we focus on a set of classification tasks that were identified by collaborating with Linkalab S.R.L, an Italian company specialized in data science and data engineering, which has developed an industrial project about Tourism 4.0 called Data Lake Turismo (“Turismo” means tourism in Italian) that collects and analyzes tourism-related data from the web. Hospitality business strategy needs to be informed by a variety of information about the business audience’s consumer behaviour to maximize revenue ensure competitiveness. When it comes to revenue management, it is critical to create specific strategies and adapt them to the current conditions. Therefore, revenue managers need tools to analyze various aspects, such as pricing, availability, and distribution channels. Our system aims to provide additional support through the classification of offer positioning based on the following four predicted dimensions: (1) price range, (2) user interest, (3) relevance within a specific market, and (4) user appreciation after utilization. We describe each relevant classification task in detail in Section 4.
We evaluated our approach by comparing it to a BERT classifier and a baseline logistic regression classifier on a dataset of more than 15,000 accommodation offers for each classification task. We also performed a study on various combinations of feature types that highlighted how these have a significant impact on the performance of the models. The proposed solution obtains excellent results and significantly outperforms alternative methods, such as transformers models trained on the texts.
The main contributions of our work are summarized as follows:
- We propose a novel methodology that effectively integrates large language models and knowledge graphs in the context of the tourism domain.
- We provide a comprehensive evaluation demonstrating the advantages of the proposed solution compared to conventional transformer models.
- We conduct an in-depth analysis of feature engineering techniques to identify the most effective combination of features.
- We offer the full codebase (https://github.com/luca-secchi/kge-bert, accessed on 15 June 2024) of our methodology, which successfully addresses four classification tasks within the tourism domain.
This manuscript is structured as follows. In Section 2, we report previous related work. Section 3 presents the materials (e.g., ontology and knowledge graph) considered in our study. Section 4 discusses and formalizes the four tasks we tackle, while Section 5 describes, in detail, the dataset used for training of the machine learning models. Section 6 discusses a variety of alternative strategies for feature engineering. Section 7 presents the architecture of our system, and Section 8 reports the experimental evaluation. Section 9 discusses the obtained results. Finally, Section 10 discusses conclusions and future research directions.
2. Related Work
We devote this section to reviewing the literature according to the two main themes surrounding this research endeavour, namely (i) knowledge graphs in the tourism domain and (ii) knowledge injection into deep learning models.
2.1. Knowledge Graphs in the Tourism Domain
In recent years, several endeavours have been made to construct knowledge graphs in the tourism domain, typically by extracting information from websites and social media. Researchers introduced an approach and tools to support the entire knowledge graph life cycle, encompassing creation, hosting, curation, and deployment [19]. Their curation process focuses on maintaining the knowledge graph’s correctness and completeness. They provided process models and evaluated the developed tools using knowledge graphs in the tourism domain. Additionally, they shared insights and lessons learned from implementing this approach in both open and commercial settings across several use cases.
An example of a knowledge graph in the tourism domain was developed for Expo Milano 2015 by Troncy et al. [20]. They developed the 3cixty platform to establish comprehensive knowledge bases encompassing event and activity descriptions, places and landmarks, transportation facilities, and social activities. Another notable initiative, the Tourpedia platform, aimed to serve as the tourism equivalent of DBpedia and was developed within the OpeNER Project [21]. Various other projects demonstrate successful applications of semantic technologies and knowledge graphs in the tourism domain, extracting information from curated proprietary data sources. Noteworthy examples include the La Rioja Turismo Knowledge Graph [22], which integrates information on attractions, accommodations, tourism routes, activities, events, restaurants, and wineries from diverse management systems, and the Tyrolean Tourism Knowledge Graph [23], where data with Schema.org annotations are collected from destination management organizations (DMOs) and their IT service providers. State-of-the-art solutions also encompass the generation of tourism knowledge graphs in the Chinese language [24,25], where authors extract knowledge from existing encyclopedia knowledge graphs and unstructured web pages in Chinese. Knowledge graphs can accommodate all kinds of data and metadata in a flexible schema and can be easily extended and interconnected with existing linked open-data global space, leveraging other existing knowledge graphs like DBpedia (see Section 3.3). Thanks to these characteristics, they are often used as a source of curated information that can be used in conjunction with AI models to develop intelligent applications.
Xiao et al. [24] proposed a systematic framework for constructing a tourism-domain knowledge graph specifically for Hainan, a Chinese province. The authors addressed the challenges of multi-source and heterogeneous data by developing two distinct pipelines—one for semi-structured data using tourism InfoBox and another for unstructured data employing deep learning algorithms. This dual approach not only enhances the accuracy of entity and relation extraction from noisy travel notes but also ensures a more comprehensive integration of various data sources. The resulting TKG includes 13 entity types and 46 relation types. In their work, the authors of [25] constructed a Chinese knowledge graph focused on the tourism domain. They extracted knowledge from the existing Chinese encyclopedia knowledge graph and unstructured web pages. Additionally, they developed a storage scheme for RDF triples within a graph database and created a tourism knowledge application platform based on this infrastructure. Different authors proposed a German tourism knowledge graph that integrates tourism-related data from 16 federal states of Germany and various other sources to create a curated knowledge base for multiple applications [26]. Launched in May 2023, it is updated daily by the regional marketing organizations of each German state and is publicly accessible through GUIs and an API.
Other researchers developed a cultural perspective-based knowledge graph by fine tuning ERNIE 3.0 (FT-ERNIE) and ChatGPT to recognize cultural types, aiming to strengthen the link between tourism resources and cultures [27]. Using an annotated dataset of 2745 cultural tourism resources spanning 16 cultural types, they found that FT-ERNIE achieved an accuracy of 0.81 and a micro-F1 score of 0.93, outperforming ChatGPT, which had an accuracy of 0.12 and a micro-F1 score of 0.67. This highlights FT-ERNIE’s superior performance and ChatGPT’s limitations due to insufficient Chinese training data. They designed a novel ontology for CuPe-KG, incorporating elements such as cultural types, historical figures, events, and intangible cultural heritage, effectively addressing the information retrieval needs of cultural tourism visitors.
2.2. Knowledge Injection into Deep Learning Models
In the last few years, several attempts have been made to address the challenge of injecting structured knowledge into deep learning models to tackle various tasks. For example, Liu et al. [28] proposed K-BERT, which extends BERT with a knowledge-enabled language representation model, where knowledge graph triples are injected into sentences during fine tuning. However, K-BERT is not able to consistently beat baselines like BERT for simple classification tasks. Furthermore, Ostendorff et al. [29] proposed a method for book genre classification by combining knowledge graph embeddings of authors with book titles and other metadata features to efficiently tackle classification tasks. Ref. [30] introduced a novel approach incorporating entity-related knowledge into encoder–decoder large pre-trained language models (PLMs) through generative knowledge infilling objective during continued pre-training. In contrast, Emelin et al. [31] proposed injecting domain-specific knowledge before fine tuning task-oriented dialogue tasks using lightweight adapters. These adapters can be easily integrated with PLMs and serve as a repository for facts learned from different knowledge bases. Additionally, Moiseev et al. [32] described a method to integrate structured knowledge into LLMs by directly training T5 models on factual triples from knowledge graphs (KGs). Finally, Wang et al. [33] proposed a method that keeps the original parameters of the pre-trained model fixed and enables continuous knowledge infusion through a neural adapter for each type of infused knowledge, serving as a plug-in connected to the LLM. Nevertheless, these methods tend to concentrate on specific domains, employing domain-specific solutions and features that are not easily adaptable to the tasks addressed in this paper. Our proposed methodology integrates the advantages of previous approaches by incorporating knowledge graph information using an effective feature engineering strategy with the aim of improving the accuracy of four tasks related to revenue management in the context of the tourism domain. To the best of our knowledge, no previous attempts have been made to combine knowledge graphs and language models to solve classification tasks within the tourism domain.
3. Materials
In this section, we introduce the materials used to build the classification system for optimization of accommodation offers, namely the Tourism Analytic Ontology (TAO), the Tourism Knowledge Graph (TKG), DBpedia, and BERT (Bidirectional Encoder Representations from Transformers). We also discuss different knowledge injection strategies for transformers.
3.1. The Tourism Analytic Ontology
The Tourism Analytic Ontology (TAO), introduced in [34], is an ontology to describe the complex dynamics of the tourism domain and supports intelligent services in this space. It models various aspects of tourism, including lodging facilities (i.e., the physical place where actual accommodations are located), accommodations (i.e., units of the lodging facility that are offered for rental, such as hotel rooms), amenities (i.e., additional services, features, or facilities that are provided to guests), accommodation lease-out offerings, tourist destinations (i.e., a place that is central in a tourist’s decision to take the trip), tourist locations (i.e., geographic points or areas of interest), and tourist reviews and ratings. It was developed in the OWL Web Ontology Language [35] following a data-driven design methodology to support the creation of a knowledge graph focused on hospitality and tourist attractions. TAO builds on several other open ontologies, including the Accommodation Ontology (https://www.sti-innsbruck.at/results/ontologies, accessed on 15 June 2024), GoodRelations (https://www.heppnetz.de/projects/goodrelations/, accessed on 15 June 2024), and Schema.org (https://schema.org/, accessed on 15 June 2024). It also includes four taxonomies structured as hierarchies of OWL classes with respect to (i) amenities, (ii) lodging facilities, (ii) accommodations, and (iv) tourist locations. TAO is capable of modelling information from several commonly used data sources within the tourism domain, such as Booking.com (Booking.com is a digital travel company that specializes in providing information about accommodations and related offers such as hotels, B&Bs, and other types of hospitality. The website also allows users to share their opinions in the form of reviews) and Airbnb (Airbnb is a peer-to-peer company based in America that links hosts who offer their accommodation spaces, such as apartments and rooms, with travellers who are searching for a place to stay. Its website provides information on accommodations, as well as reviews from users).
3.2. Generation of a Tourism Knowledge Graph
Following the methodology introduced in [34], we built a tourism knowledge graph (TKG) based on TAO whose aim is to store and analyze information about tourism destinations and to support the creation of intelligent applications in collaboration with Linkalab. The version presented in this paper and used to produce the benchmark for the experiments focuses on 69 Kaccommodations in London. The knowledge graph stores information in the form of a data graph where nodes represent real objects (like accommodation, a tourism destination, or a tourist location) and edges represent specific relations among these entities or between an entity and its properties. The data graph is expressed in RDF (The RDF (Resource Description Framework) language is a framework for representing information about resources on the Semantic Web in a structured, machine-readable format) language to be fully compliant with W3C standards for the Semantic Web. All data from Airbnb are, thus, converted to RDF using the RDF Mapping Language (RML) (The RDF Mapping Language (RML) is a mapping language designed to define customized mapping rules for transforming heterogeneous data structures and serializations into RDF), which is used to transform tabular data into triples (subject, object, predicate). The produced triples are stored in RDF files that are loaded, using a batch procedure, into the triple store implemented using GraphDB (GraphDB is an enterprise-ready semantic graph database, compliant with W3C Standards. See https://graphdb.ontotext.com/, accessed on 15 June 2024) that can be queried using SPARQL (SPARQL Protocol and RDF Query Language).
TKG covers Airbnb’s London accommodations and was built reusing open data from the Inside Airbnb project (See http://insideairbnb.com/about, accessed on 15 June 2024). Inside Airbnb is a mission-driven project that provides data and advocacy about Airbnb’s impact on residential communities all over the world. For our analysis, we used the information about the accommodations and their hosts that was collected for London on the 10th of September 2022. The data contain 69,351 records with 75 fields (A data dictionary describing each field is available online at https://docs.google.com/spreadsheets/d/1iWCNJcSutYqpULSQHlNyGInUvHg2BoUGoNRIGa6Szc4, accessed on 15 June 2024) and describe specific accommodations (called listings in Airbnb) identified with unique listing IDs (“id” field). We can distinguish the following three types of information: the textual description of the accommodation (e.g., description), the categorical fields that describe the characteristic of the accommodation and the amenities (e.g., amenities), and other fields that can be treated as numbers or transformed into numbers and that specify some attributes of the accommodation (e.g., price). The initial file undergoes a series of dedicated data pipelines to transform its content into triples, generating the knowledge graph. Each field is processed in a distinct manner, depending on the nature of the information it holds. Specifically, the description field, which contains unstructured text, undergoes processing to identify semantic entities such as places, food, and amenities. These entities are then linked to DBpedia, as described in Section 3.3. Through the process of entity linking, new triples are generated, explicitly representing the previously unstructured information extracted from the text in the knowledge graph. The information in the categorical amenities field is also transformed by means of an ontology mapping process that substitutes the short text describing an amenity with the corresponding class in the TAO ontology. This process unifies the way amenities are described and allows us to refer to concepts instead of names. For instance, we use the specific TAO class Television in place of terms such as “tv”, “television”, “tv with standard cable”, “hdtv”, and “screen tv”. Numeric columns are encoded in the KG by generating triples where the subject is the accommodation, the predicate is the property represented by the column (e.g., price), and the object is a literal value found in the column (e.g., 100).
3.3. DBpedia
DBpedia [36] is a widely recognized and extensively curated knowledge graph that is often used to enhance textual information from structured data. It was generated by extracting structured information from Wikipedia and interlinking it with other knowledge graphs, providing a rich network of interconnected entities and relationships. In the last few years, DBpedia Spotlight [37] has emerged as a robust, multi-domain entity-linking tool. DBpedia Spotlight employs NLP techniques to identify mentions of entities in the text and link them to their corresponding DBpedia resources. This tool is often used to connect domain knowledge graphs in a variety of fields with a common base of concepts [38,39].
In our system, we leverage DBpedia Spotlight to extract supplementary information from the descriptions of Airbnb accommodations. This extracted information serves as additional features for our classifier and encompasses various aspects, including accommodation details, related named entities, and other relevant aspects conveyed by entities mentioned in the text. As an example, we report a description with words highlighted in bold, followed by a list of the corresponding DBpedia entities’ IRIs (Internationalized Resource Identifiers) (See https://datatracker.ietf.org/doc/html/rfc3987, accessed on 15 June 2024).
Description text: Perfectly situated within a short distance of Hampton Court Palace, Bushy Park, Kempton Park, Sandown and Twickenham Stadium. […] Featuring a high end kitchen, underfloor heating and luxury en suite bathroom.
Linked entities extracted from text: dbp:Hampton_Court_Palace (We use the prefix domain format for short where dbp:Enity_Name) corresponds to the IRI http://dbpedia.org/resource/Entity_Name, accessed on 15 June 2024,
- dbp:Bushy_Park, dbp:Kempton_Park_Racecourse,
- dbp:Sandown_Park_Racecourse, dbp:Twickenham_Stadium,
- dbp:Underfloor_heating.
3.4. BERT
BERT (Bidirectional Encoder Representations from Transformers) is a prominent language model capable of capturing comprehensive contextual representations of words and sentences [4]. One of the key applications of BERT is text classification [40]. By fine tuning BERT on labeled data specific to a particular classification task, it can effectively learn to predict the correct class labels for new, unseen text inputs. BERT’s bidirectional nature enables it to capture both the preceding and following context of each word, enabling a deeper understanding of the dependencies and relationships within the text. BERT has emerged as a state-of-the-art model for text classification [41], providing significant improvements in performance and the ability to handle complex linguistic patterns and contexts. The BERT base model consists of an encoder comprising 12 transformer blocks, each with 12 self-attention heads and a hidden size of 768. Before a text can be processed by BERT, it must be split into individual tokens. These tokens can represent words, subwords, or even characters, depending on the chosen tokenization strategy. BERT operates on input sequences of up to 512 tokens, generating a representation of the sequence. With regard to text classification, BERT employs the final hidden state (h) of the first token [CLS] as the representation for the entire sequence. To predict the probability (p) of a label (c), a pooling layer is implemented with a fully connected layer with a tanh activation function. The pooling layer’s output is subsequently fed into a sigmoid classifier, which is placed on top of BERT. This classifier utilizes the task-specific parameter matrix (W) to make predictions.
The parameters of BERT and W are fine-tuned together by maximizing the log probability of the correct label.
4. Task Formulation
We identified four classification tasks that can be used to optimize an accommodation offer. These were derived from discussions with stakeholders and revenue managers in the context of our collaboration with Linkalab.
We defined and labeled them as follows:
- Task 1
- Price value: Predict if the accommodation can be considered to be of high-value.
- Task 2
- User interest: Predict if potential customers would be interested in a specific accommodation.
- Task 3
- Relevance: Predict if the accommodation offer is competitive for the market.
- Task 4
- User appreciation: Predict if users would appreciate the accommodation after trying it.
We encode each of them as a binary classification task, enabling the use of the outcomes as practical checklists for revenue managers. This approach allows users of our systems to experiment with various options and observe how their decisions affect the predicted dimensions.
The price value classification task uses two labels, namely low and high. Low-valued accommodations have a single-night stay price that is lower than the median of the price for Airbnb accommodations in the destination after removing outliers (Prices that are too big are removed. We first calculate the mean () and the standard deviation () for all prices (p), then remove all prices, where ). If the opposite is true, the accommodation is labeled as high value. This categorization helps users comprehend the appropriate pricing to propose, whether it is an initial proposal or a response to market fluctuations.
For the user interest task, we use the number of reviews to measure user interest. Indeed, Airbnb’s review system mandates that users can only provide a review once they have actually stayed at a property. Consequently, the number of reviews can be perceived as an indirect indicator of the property’s occupancy and, correspondingly, the volume of booking requests received by the host. Even when the user gives a negative evaluation after trying it, it still means that the user has booked and stayed in the first place, thus manifesting a concrete interest in the offer. In this case, we define the following two classes: uninteresting and interesting. Uninteresting accommodations do not have any reviews in the last 12 months, while interesting accommodations have one or more reviews in the same interval of time.
To evaluate the relevance, we considered the availability calendar for 365 days in the future for each accommodation. We define the following two classes: high relevance if there is at least one date bookable in the next year and low relevance otherwise (Even if it is not possible to know why an accommodation is not available for booking on a specific date, it is very unlikely that it is booked for all days in the following year). If an accommodation becomes unavailable for booking for long periods (365 days) we suppose that this happens because it is not competitive for the market and that this can be related to what it offers and how. Thus this classification works like an alert about the relevance of the offering in the long run.
Finally, we evaluated user appreciation by using the average review score. In Airbnb, each user must give six different review scores about specific aspects of their experience, namely accuracy, cleanliness, check-in, communication, location, and value. The average review score is a number from 1 to 5 calculated as the average of these six scores. We define the following two classes: highly appreciated if the average review score is higher than 4.5 and normally appreciated otherwise.
5. The Datasets
We used TKG, introduced in Section 3, to produce all the data to train and evaluate our model on the four classification tasks.
Because TKG is stored in a triple-store database (We used the free version of GraphDB, an enterprise-ready semantic graph database that is compliant with W3C standards; see https://graphdb.ontotext.com/, accessed on 15 June 2024), we could extract all relevant data using the SPARQL language. The extraction process is illustrated in the A block of Figure 1. The data extraction process produces the following three different datasets (i, ii, and iii in the diagram) that are then used for feature engineering: (i) a dataset where each accommodation is associated with its description text and with all its properties expressed as numbers, dates, or true/false flags (e.g., number of rooms, first review date, and instantly bookable flag); (ii) a dataset where each accommodation is associated with all the included amenities expressed by TAO classes; and (iii) a dataset where each accommodation is associated with all related DBpedia entities expressed as IRIs.
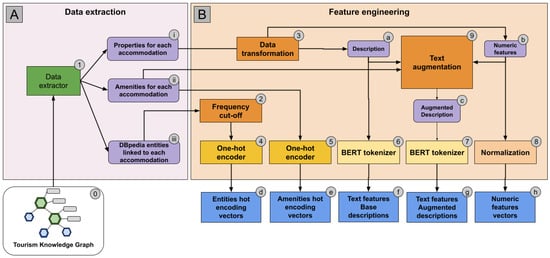
Figure 1.
Data extraction from the knowledge graph and feature engineering. (A) shows how data is extracted from the knowledge graph to produce three different datasets. (B) shows the feature engineering processes.
6. Feature Engineering
The datasets extracted from TKG were processed to produce the following four types of features: (i) textual features, which constitute a natural input for transformer models such as BERT; (ii) numerical features; (iii) categorical features; and (iv) linked entities, i.e., DBpedia entities extracted from the descriptions. The process is illustrated in the B block of Figure 1.
The process includes the following steps. First, accommodation properties (i) are processed by a data transformation process (3) to preprocess the textual descriptions (a), which are then transformed into text features expressed as tokens (f) by a BERT tokenizer (6). The same data transformation also produces a vector of numeric values (b) that is normalized by a dedicated process (8) to produce a vector of numeric features (h). Amenities (ii) are transformed into numeric vectors (e) using a one-hot encoding process (5). DBpedia entities (iii) are reduced to a manageable number by discarding the ones associated with fewer than 100 accommodations (2), then transformed into numeric vectors (d) using a one-hot encoding process (4). Finally, we use a text augmentation process (9) to generate an augmented version of the descriptions that also include numeric features and amenities (c). This is processed by a BERT tokenizer (7) and transformed into another set of text features (g) that will be used to evaluate the ability of transformers to directly process structured features.
The longest textual description in our dataset consists of 198 words, with an average length of 114 words. Consequently, these descriptions can be conveniently processed by BERT, which accommodates texts with a maximum token limit of 512. Additionally, we have ample “room” within this limit to incorporate supplementary features in text format.
The numerical features encompass a range of metrics already in numeric format, including the number of bedrooms and beds, the number of bathrooms, minimum night stays, and so on. All dates (e.g., the first review date) are expressed as the number of days in the past with respect to the day the original data were retrieved from Airbnb (in our case, 10 September 2022). Finally, the true/false flag values, like instantly bookable flags, are transformed into numeric values of 1 or 0. Concatenating the numerical features, we produce an n-dimensional vectorwhose length differs slightly for each task, as we exclude the predicted variables specific to that task as well as all correlated values. For example, for the user interest classification task, we hide all metrics about the number of reviews (e.g., number_of_reviews, first_review, and last_review) or those related to review scores (e.g., review_scores_rating, review_scores_accuracy, and so on). Similarly, for the relevance classification task, we hide all variables about availability (e.g., availability_30, availability_60, availability_90, and availability_365). As a final step, we performed unity-based normalization on this vector, aiming to scale all values within the range of [0, 1]. This normalization process ensures a standardized representation of the vector, facilitating comparisons and analysis across different variables.
Information Injection as Text
In order to enhance the classification process, transformers such as BERT can be provided with additional information by extending the description texts with injected knowledge in the form of key terms and numbers. This can be considered a form of prompt addition as described by [42]. To assess this methodology, we produced the augmented descriptions (g) depicted in Figure 1. We did so by appending numeric and categorical features after the accommodation description. Entities extracted from the description in the previous steps are excluded to avoid redundancy.
More specifically, we used the following approach: (i) numeric properties’ values were incorporated as text, with each value separated by spaces; (ii) TAO amenities were included by adding their corresponding labels, separated by spaces. Regarding numeric value injection as text, previous works [43,44] have proven that BERT can handle numeric values expressed as text.
What follows is an example of an accommodation description text extended with the list of amenities (in bold) and the numerical features (in underlined text).
“This beautifully decorated two-bedroom serviced apartment is conveniently located in the vibrant Shoreditch area […] dishes and silverware cable tv cooking basics bathtub carbon monoxide alarm smoke alarm heating lockbox first aid kit […] 1 2.0 3.0 4.0 […]”.
In this example, we list four numeric properties associated with the accommodation whose meanings are based on their positions in the sequence, namely the host-is-super-host binary flag (value 1), the number of bedrooms (value 2.0), the number of beds (value 3.0), and the minimum nights bookable (value 4.0).
7. Architecture
We propose an approach, labelled in the following as KGE-BERT (Knowledge Graph Enhanced BERT), that integrates a transformer model for textual data processing and a Multi-Layer Perceptron (MLP) for incorporation of other types of features. Figure 2 illustrates the architecture. The model supports knowledge injection from TKG by combining the four types of features discussed in Section 6, namely textual, numeric, categorical, and linked entities.
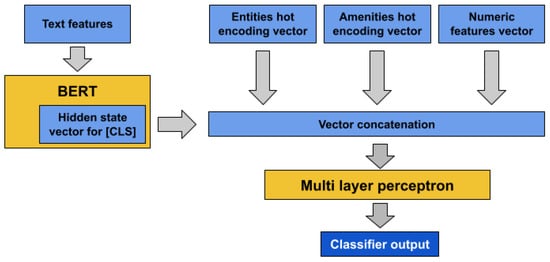
Figure 2.
KGE-BERT model architecture.
During the model-training phase, we conduct an end-to-end optimization process for each classification task. This process involves two distinct operations. First, the BERT transformer is fine-tuned on the set of descriptions. Second, the MLP component is trained from scratch on the features. By combining these two operations, our approach achieves a comprehensive training procedure that maximizes the potential of both the fine-tuned BERT transformer and the newly trained MLP.
The tokenized text is processed by BERT (using the English uncased model; see the Hugging Face repository https://huggingface.co/bert-base-uncased, accessed on 15 June 2024). As BERT output, we adopt the hidden vector state associated with the first character of the input, which is represented by the [CLS] token. The tanh output of the pooling layer attached to BERT is scaled from 0 to 1 in order to be in the same range as other non-textual feature vectors. The numerical features are encoded as vectors of real numbers normalized from 0 to 1, while categorical and linked entities’ features are expressed as hot encoding.
The four resulting vectors are concatenated and used as input for the MLP, which has two layers with 1024 units each and uses ReLu as the activation function. All the MLP layers are subject to a dropout process with default probability of p = 0.1 during the training phase to prevent over-fitting. The MLP output layer is a sigmoid layer that provides the probability output for the classification.
To support research practitioners in implementing our proposed methodology, we have released all necessary software components as open-source (https://github.com/luca-secchi/kge-bert, accessed on 15 June 2024). This includes tools to apply KG-BERT to specific tourist destinations. Key features include the following:
- Data acquisition and transformation: We provide a Python notebook with supporting scripts for entity linking, enabling users to produce the training dataset.
- Training and evaluation: The complete Python code to implement the training and evaluation phases described in our work is also available.
With these tools, users can train KG-BERT on a new destination by following the following simplified procedure:
- Identify the tourist destination: Download all relevant data about Airbnb listings.
- Entity linking: Use the entity-linking tool to map each Airbnb listing to relevant DBpedia entities.
- Data engineering: Run the data engineering tool to create the training, development, and test datasets.
- Model training: Train the KG-BERT model on the target destination using the training dataset with the provided tools.
- Model testing: Test the performance of KG-BERT on the test dataset to validate the model.
8. Evaluation
In order to assess the validity of our system, we compared it against several baselines for the four tasks defined in Section 4.
8.1. Evaluation Protocol
We created a different balanced dataset for each of the four classification tasks, starting from the complete datasets defined in Section 5. We split the balanced dataset of each task into the following three parts: training, validation, and test sets. Subsequently, starting from the complete training set, we produced four distinct training sets for each task, progressively increasing in size to 3000, 6000, 9000, and 12,000 accommodations. The objective of this process was to evaluate the influence of varying data quantities on the performance of the classification tasks. This holds particular significance for real-world applications where acquiring a substantial training set may pose challenges. We used the same validation and test sets for each task, with a fixed size of 1800 elements in order to obtain comparable results. We used the validation sets to perform hyperparameter tuning for the classification threshold. Because the sigmoid layer of the model produces the probability () that the predicted label is 1 and () that the predicted label is 0, instead of using a fixed classification threshold of 0.5 to decide the output class, we chose it with a hyperparameter search using the validation dataset by exploring all possible values of the threshold from 0.1 to 0.9 with increments of 0.1. The best threshold was then used as part of the model during the final evaluation of the test set.
We adopted the macro averages of precision, recall, and F1 score as performance metrics.Specifically, we repeated training and hyperparameter tuning (using the evaluation set) five times, producing five versions of the trained model for each experiment. Then, we evaluated each version of the model on the test set and computed the mean value of each metric (macro-average F1 score, recall, and precision). Indeed, it has been shown in previous works that when fine tuning a BERT-based model multiple times on the same dataset with only the random seed being changed, significant fluctuation in the accuracy can be produced [4,45].
8.2. Approaches
We ran our experiments using the following seven approaches, which are also summarized in Table 1:

Table 1.
Experimental descriptions.
- Logistic regression: A simple logistic regression classifier that we adopted as a baseline was implemented as a network with one hidden layer of one unit, ReLu activation functions, and a final sigmoid layer to produce the binary classification probability. Since it could not process text, it was fed with only numerical, categorical, and linked entity features.
- BERT: The BERT-based uncased model was trained on text features. It is worth noting that BERT produces a classification for each accommodation, uniquely considering the original description in English (The BERT model’s pooled output is fed to a last inner layer with one unit and a final sigmoid layer).
- BERT-injected: A variation of the previous approach was adopted that uses the technique for knowledge injection described in Section 6, also including numerical, categorical, and linked entity features in the text. The BERT approach differs from the BERT-injected approach because in the latter, the accommodation description is enriched by appending additional information to the original text before it is fed to the BERT model for classification. The information is incorporated as text, including amenities mapped to TAO classes and numeric properties (like the number of bedrooms).
- KGE-BERT-1hot: As described in Section 7, KGE-BERT-1hot uses only accommodation descriptions and the one-hot encoding of the categorical entities from TAO and linked entities from DBpedia.
- KGE-BERT-num: KGE-BERT-num uses only accommodation descriptions and numerical features
- KGE-BERT-full: KGE-BERT-full uses the complete set of features.
- KGE-BERT-injected-full: KGE-BERT-injected-full uses the complete set of features and also injects the textual descriptions with additional information, as described in Section 6.
All BERT models were fine-tuned by adapting the original hyperparameters proposed in the seminal BERT paper [4], namely a batch size of 8 (to support our GPU limitations and to obtain better results during training), a learning rate of 2−5, Adam as the optimization method, a dropout probability of 0.1, and five training epochs.
We ran all experiments on a workstation with the following characteristics: CPU, INTEL CORE I9-7900X 3.3 G (4.3 G TURBO) 10 CORE; GPU, Nvidia GTX1080 TI 11 GB VRAM; SSD, 1 TB; RAM, 65 GB.
8.3. Results
In the following four subsections, we discuss the results for each classification task. To enhance readability, all results for macro-averages of F1-score, precision, and recall are presented in percentage points.
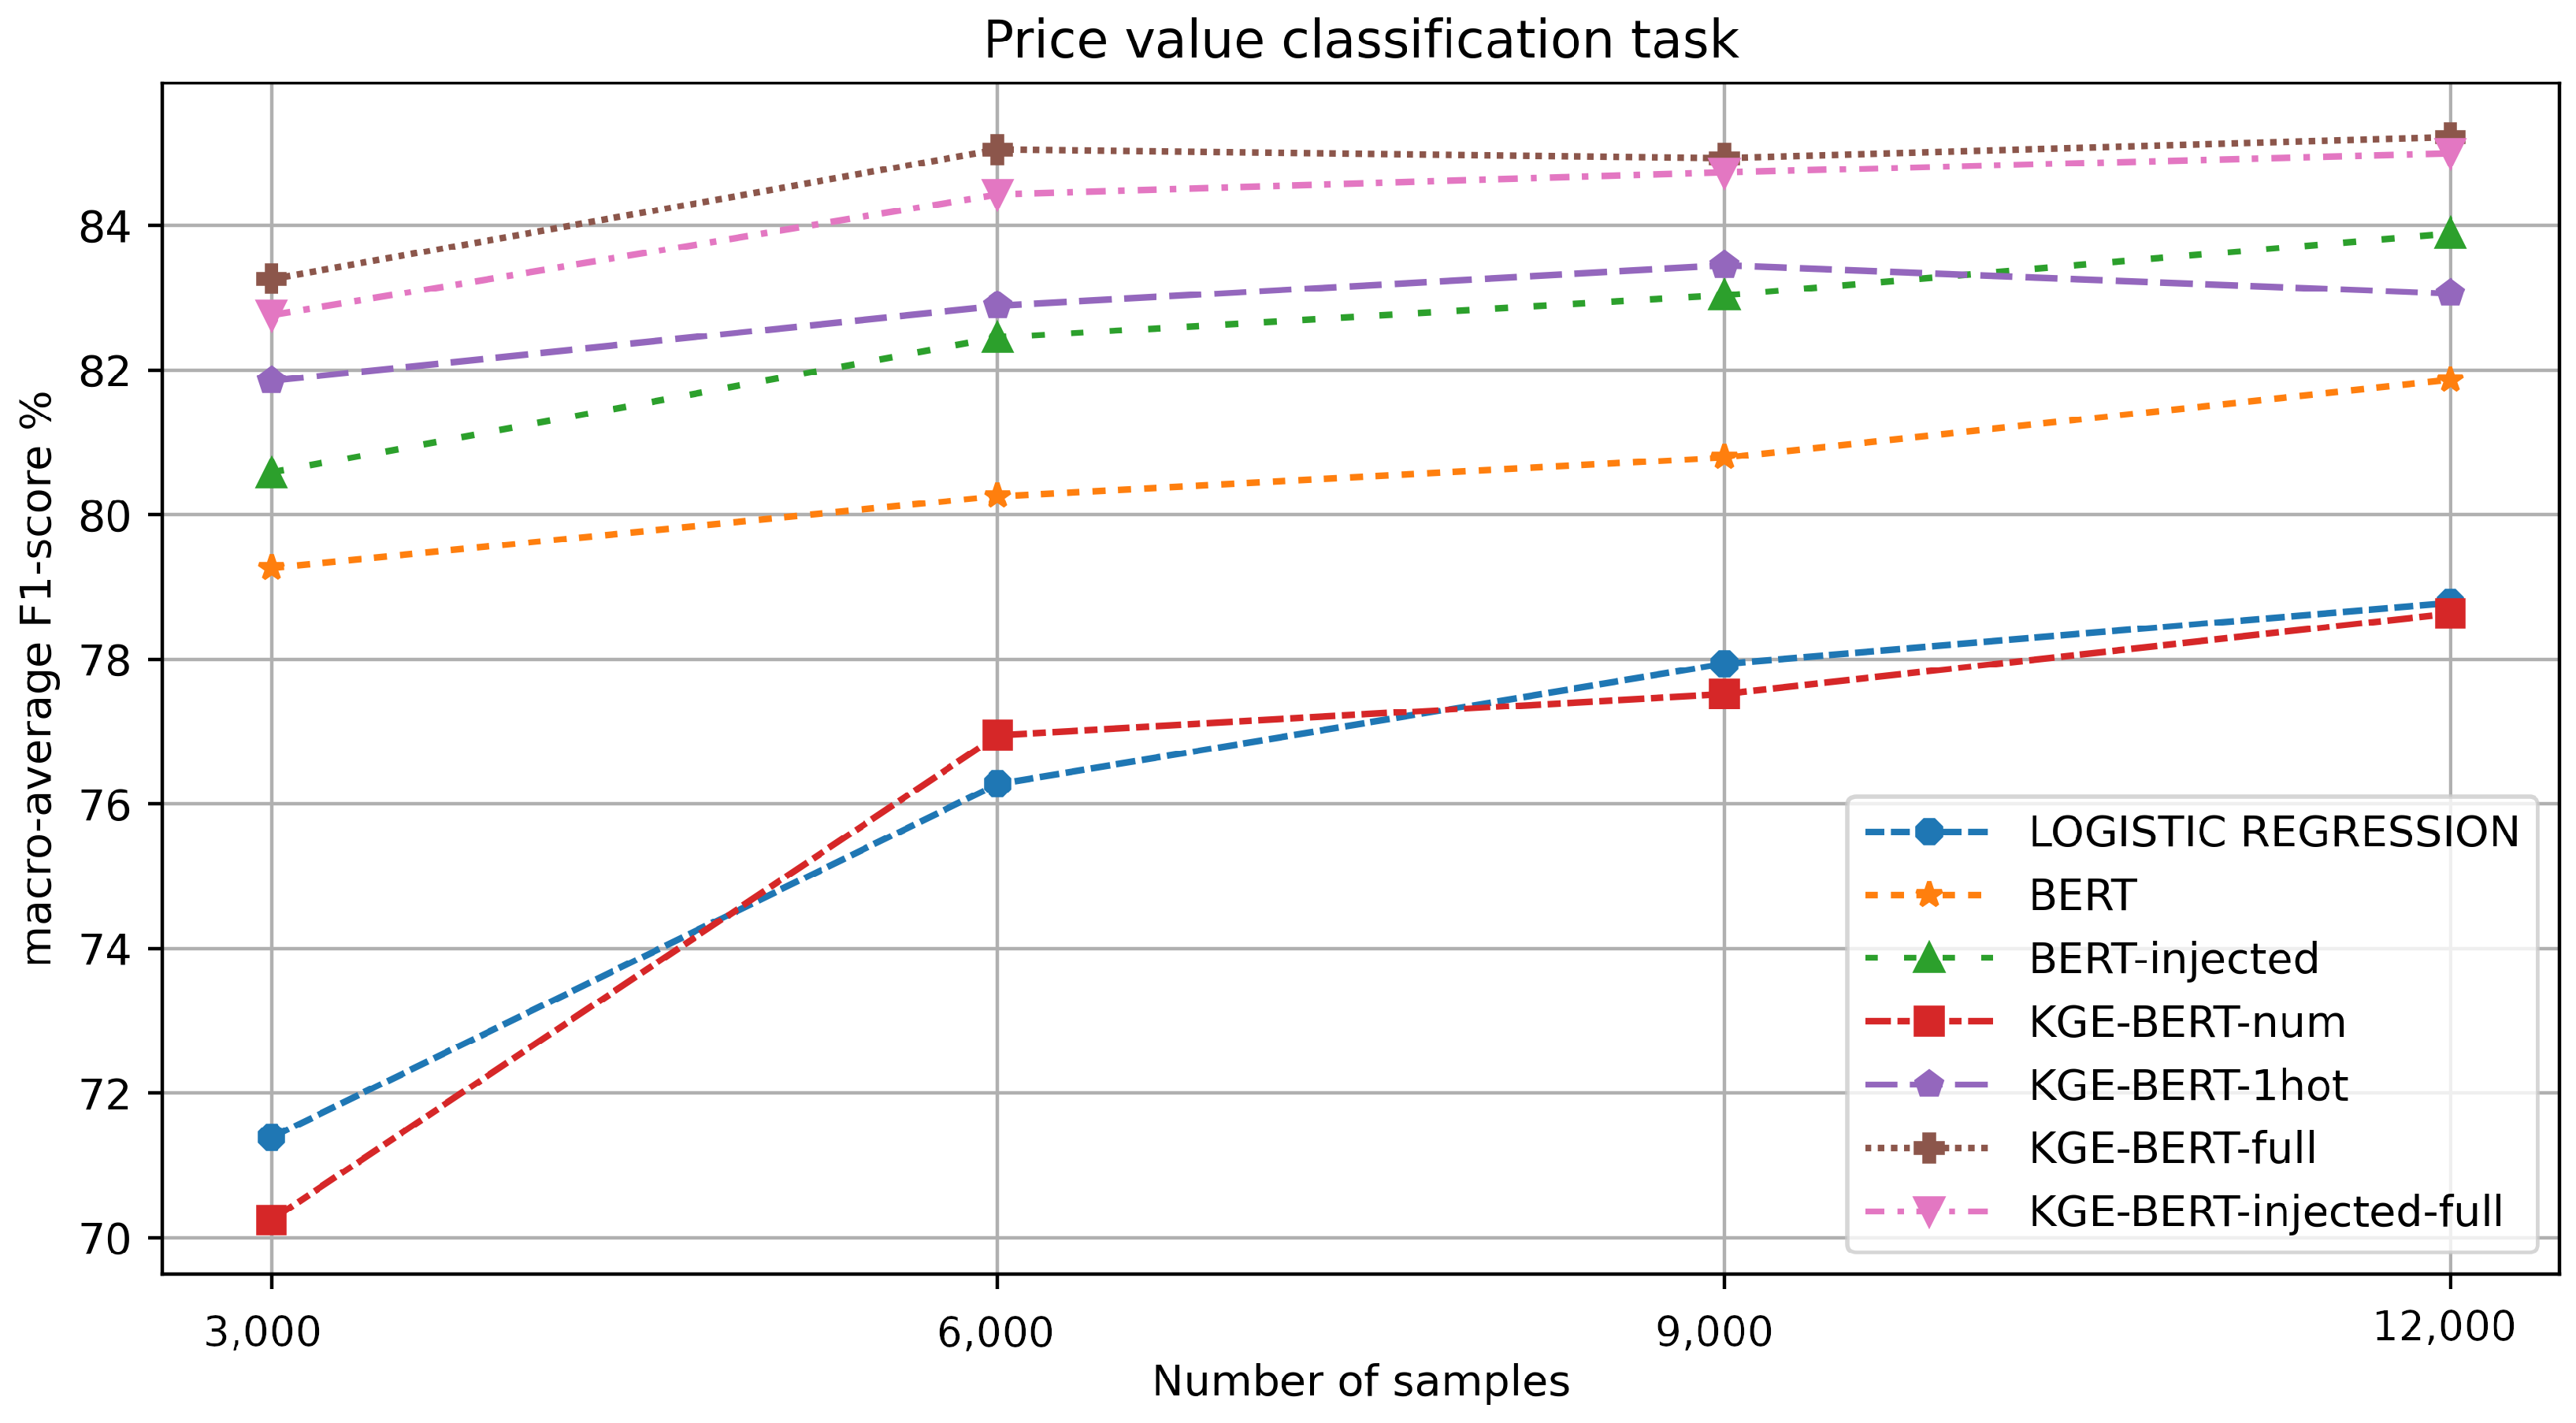
8.3.1. Price Value Classification
Table 2 reports the results, while Figure 3 shows a multi-line chart for a more immediate interpretation.
Table 2.
Price value classification task: macro-average values for F1 score, precision, and recall.
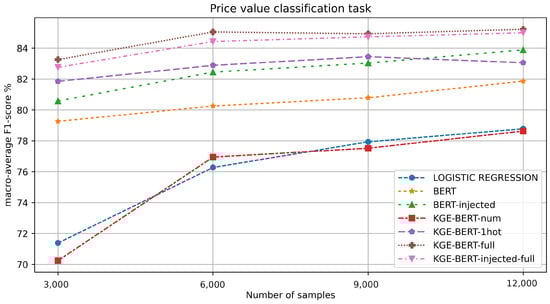
Figure 3.
F1-value macro-average results for each experiment in the value classification task.
KGE-BERT-full outperforms all the other methods, thanks to its ability to integrate different features. KGE-BERT-injected-full is the second best, suggesting that injecting features both as vectors and in the text can sometimes reduce the performance. However, BERT-injected performs better than BERT, highlighting the value of incorporating a set of diverse features in the model.
Perhaps surprisingly, the use of numerical features alone (KGE-BERT-num) seems to have a negative effect on performance for this task.
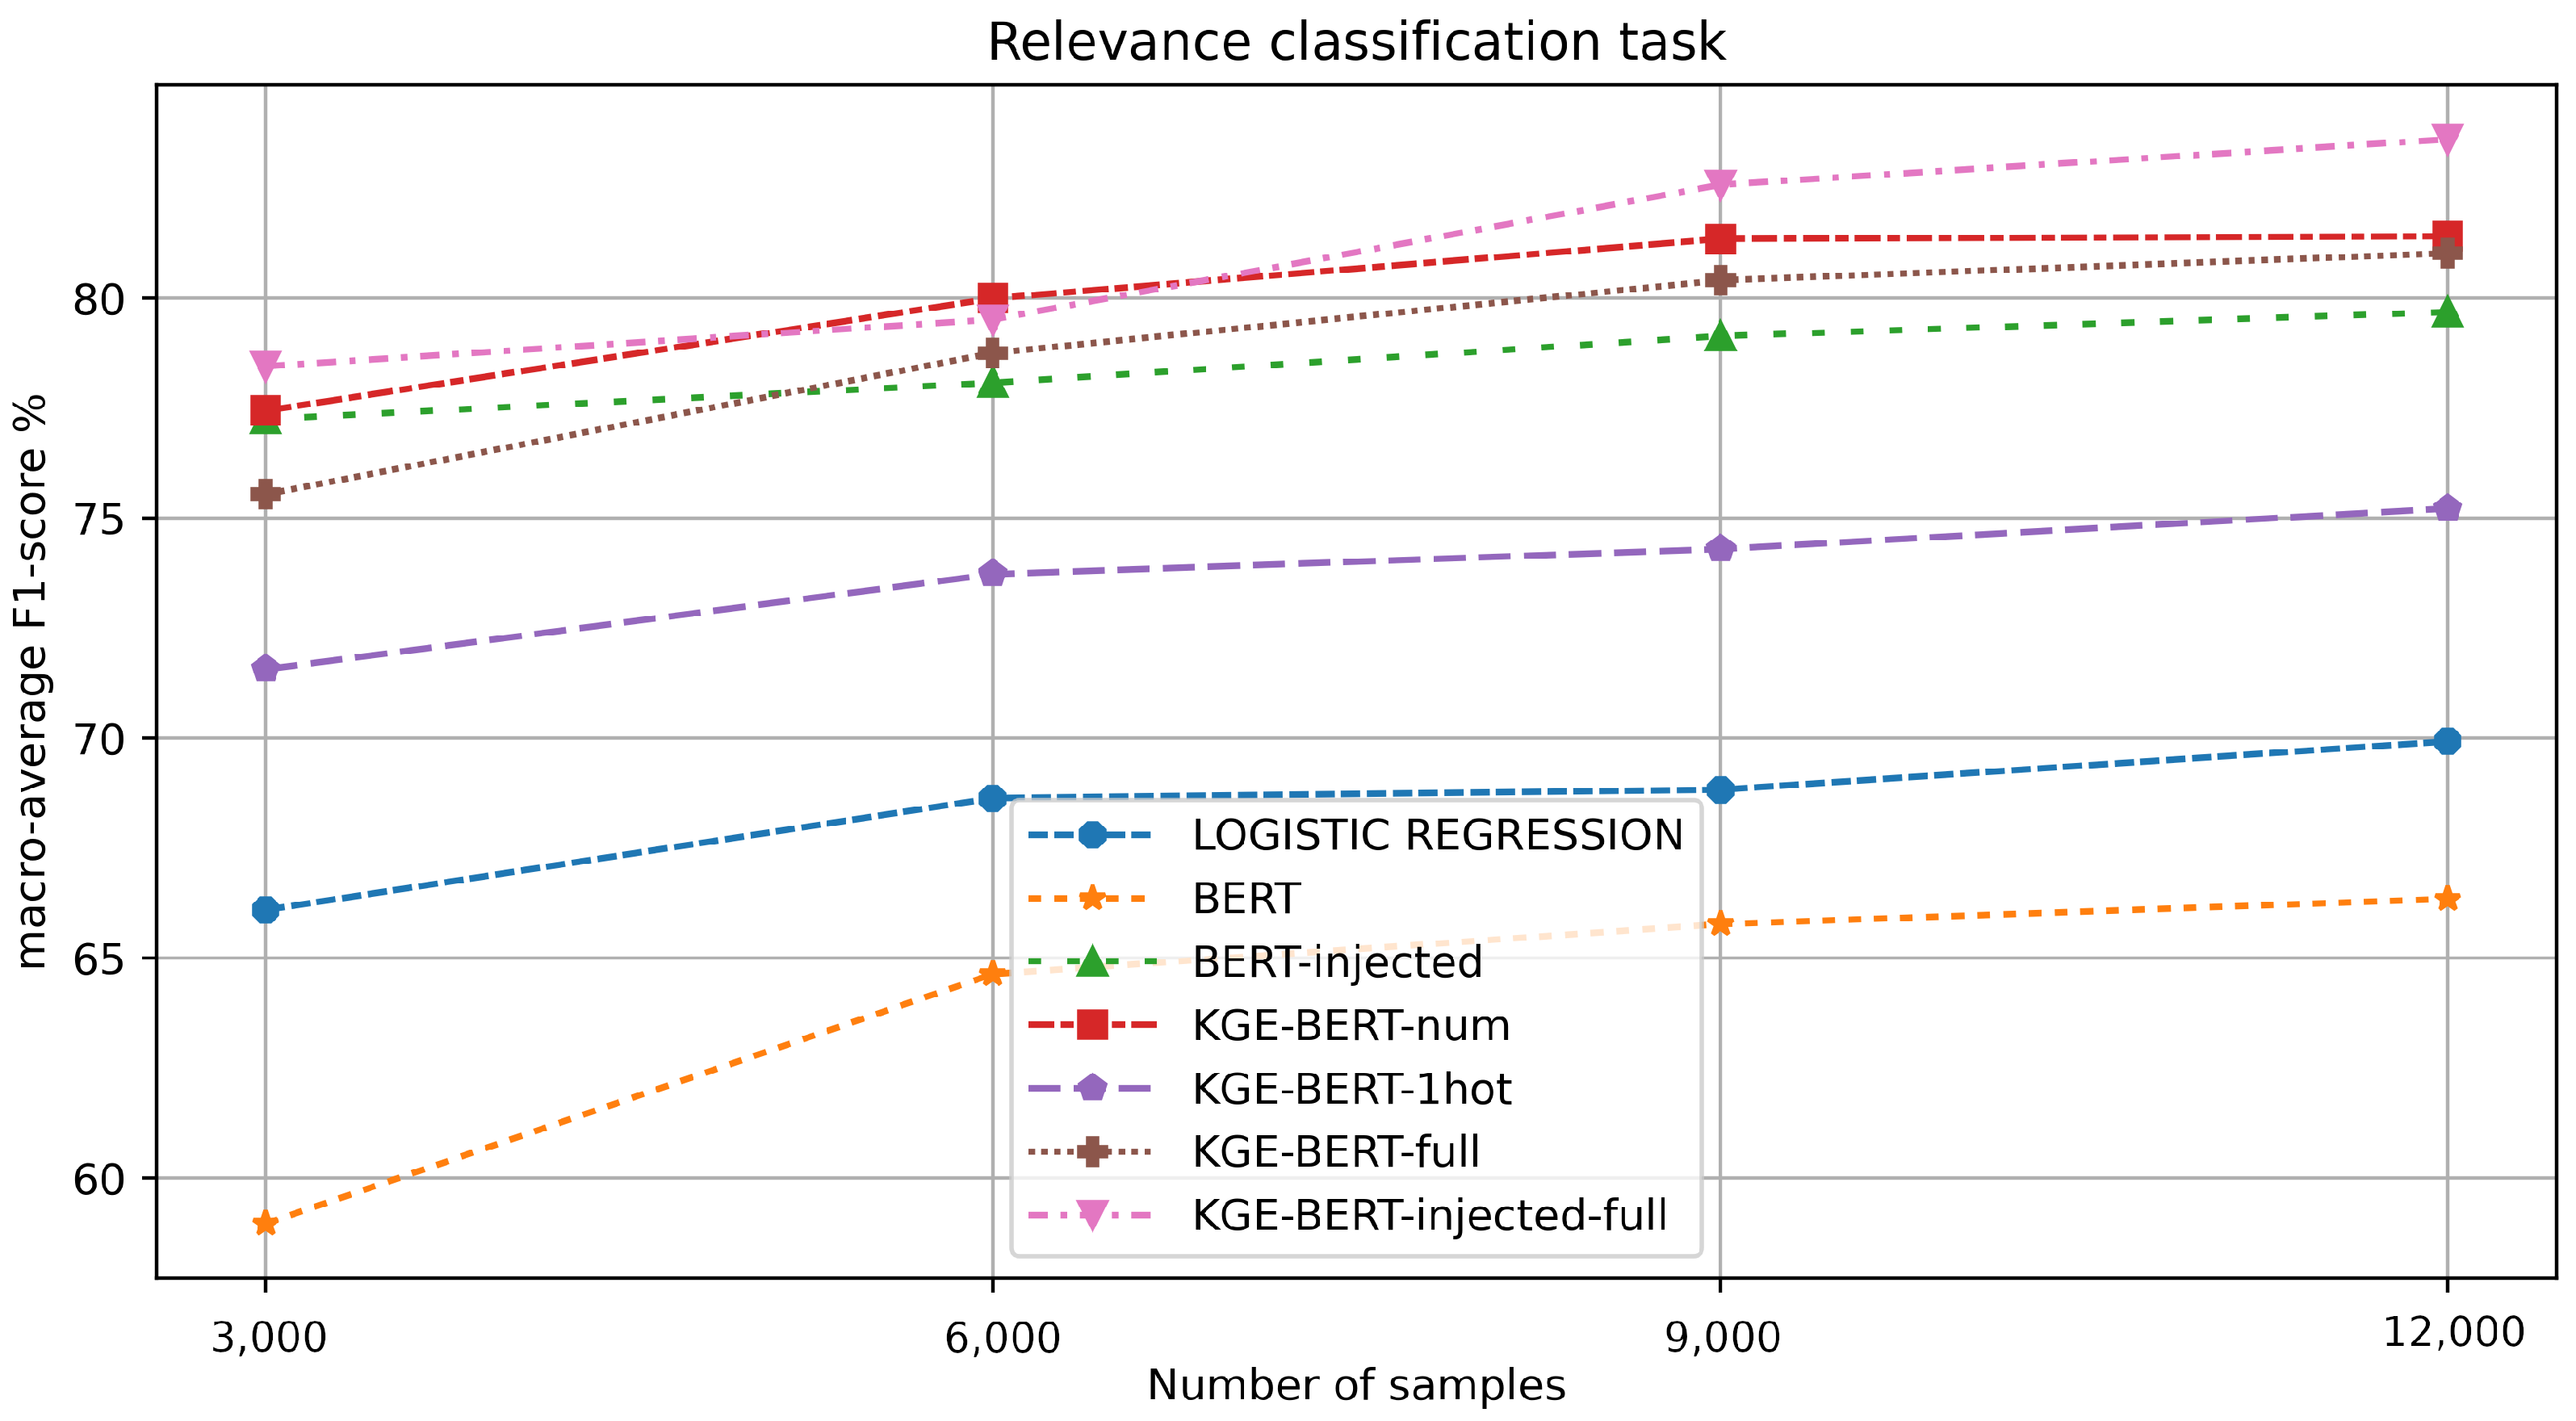
8.3.2. Relevance Classification
Table 3.
Relevance classification task: macro-average values for F1 score, precision, and recall.
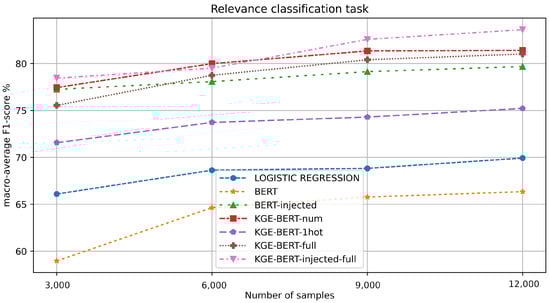
Figure 4.
F1-value macro-average results for each experiment in the relevance classification task.
KGE-BERT-injected-full obtains the best results here, showing that injecting features both as vectors and in the text can lead to better performance. For this task, BERT performs poorly (F1 score of <67%), and it is even outperformed by the linear regression baseline. This suggests that accommodation descriptions may not be the best predictors of relevance. Conversely, numerical features appear to hold the greatest significance. Indeed, KGE-BERT-num achieves outstanding results.
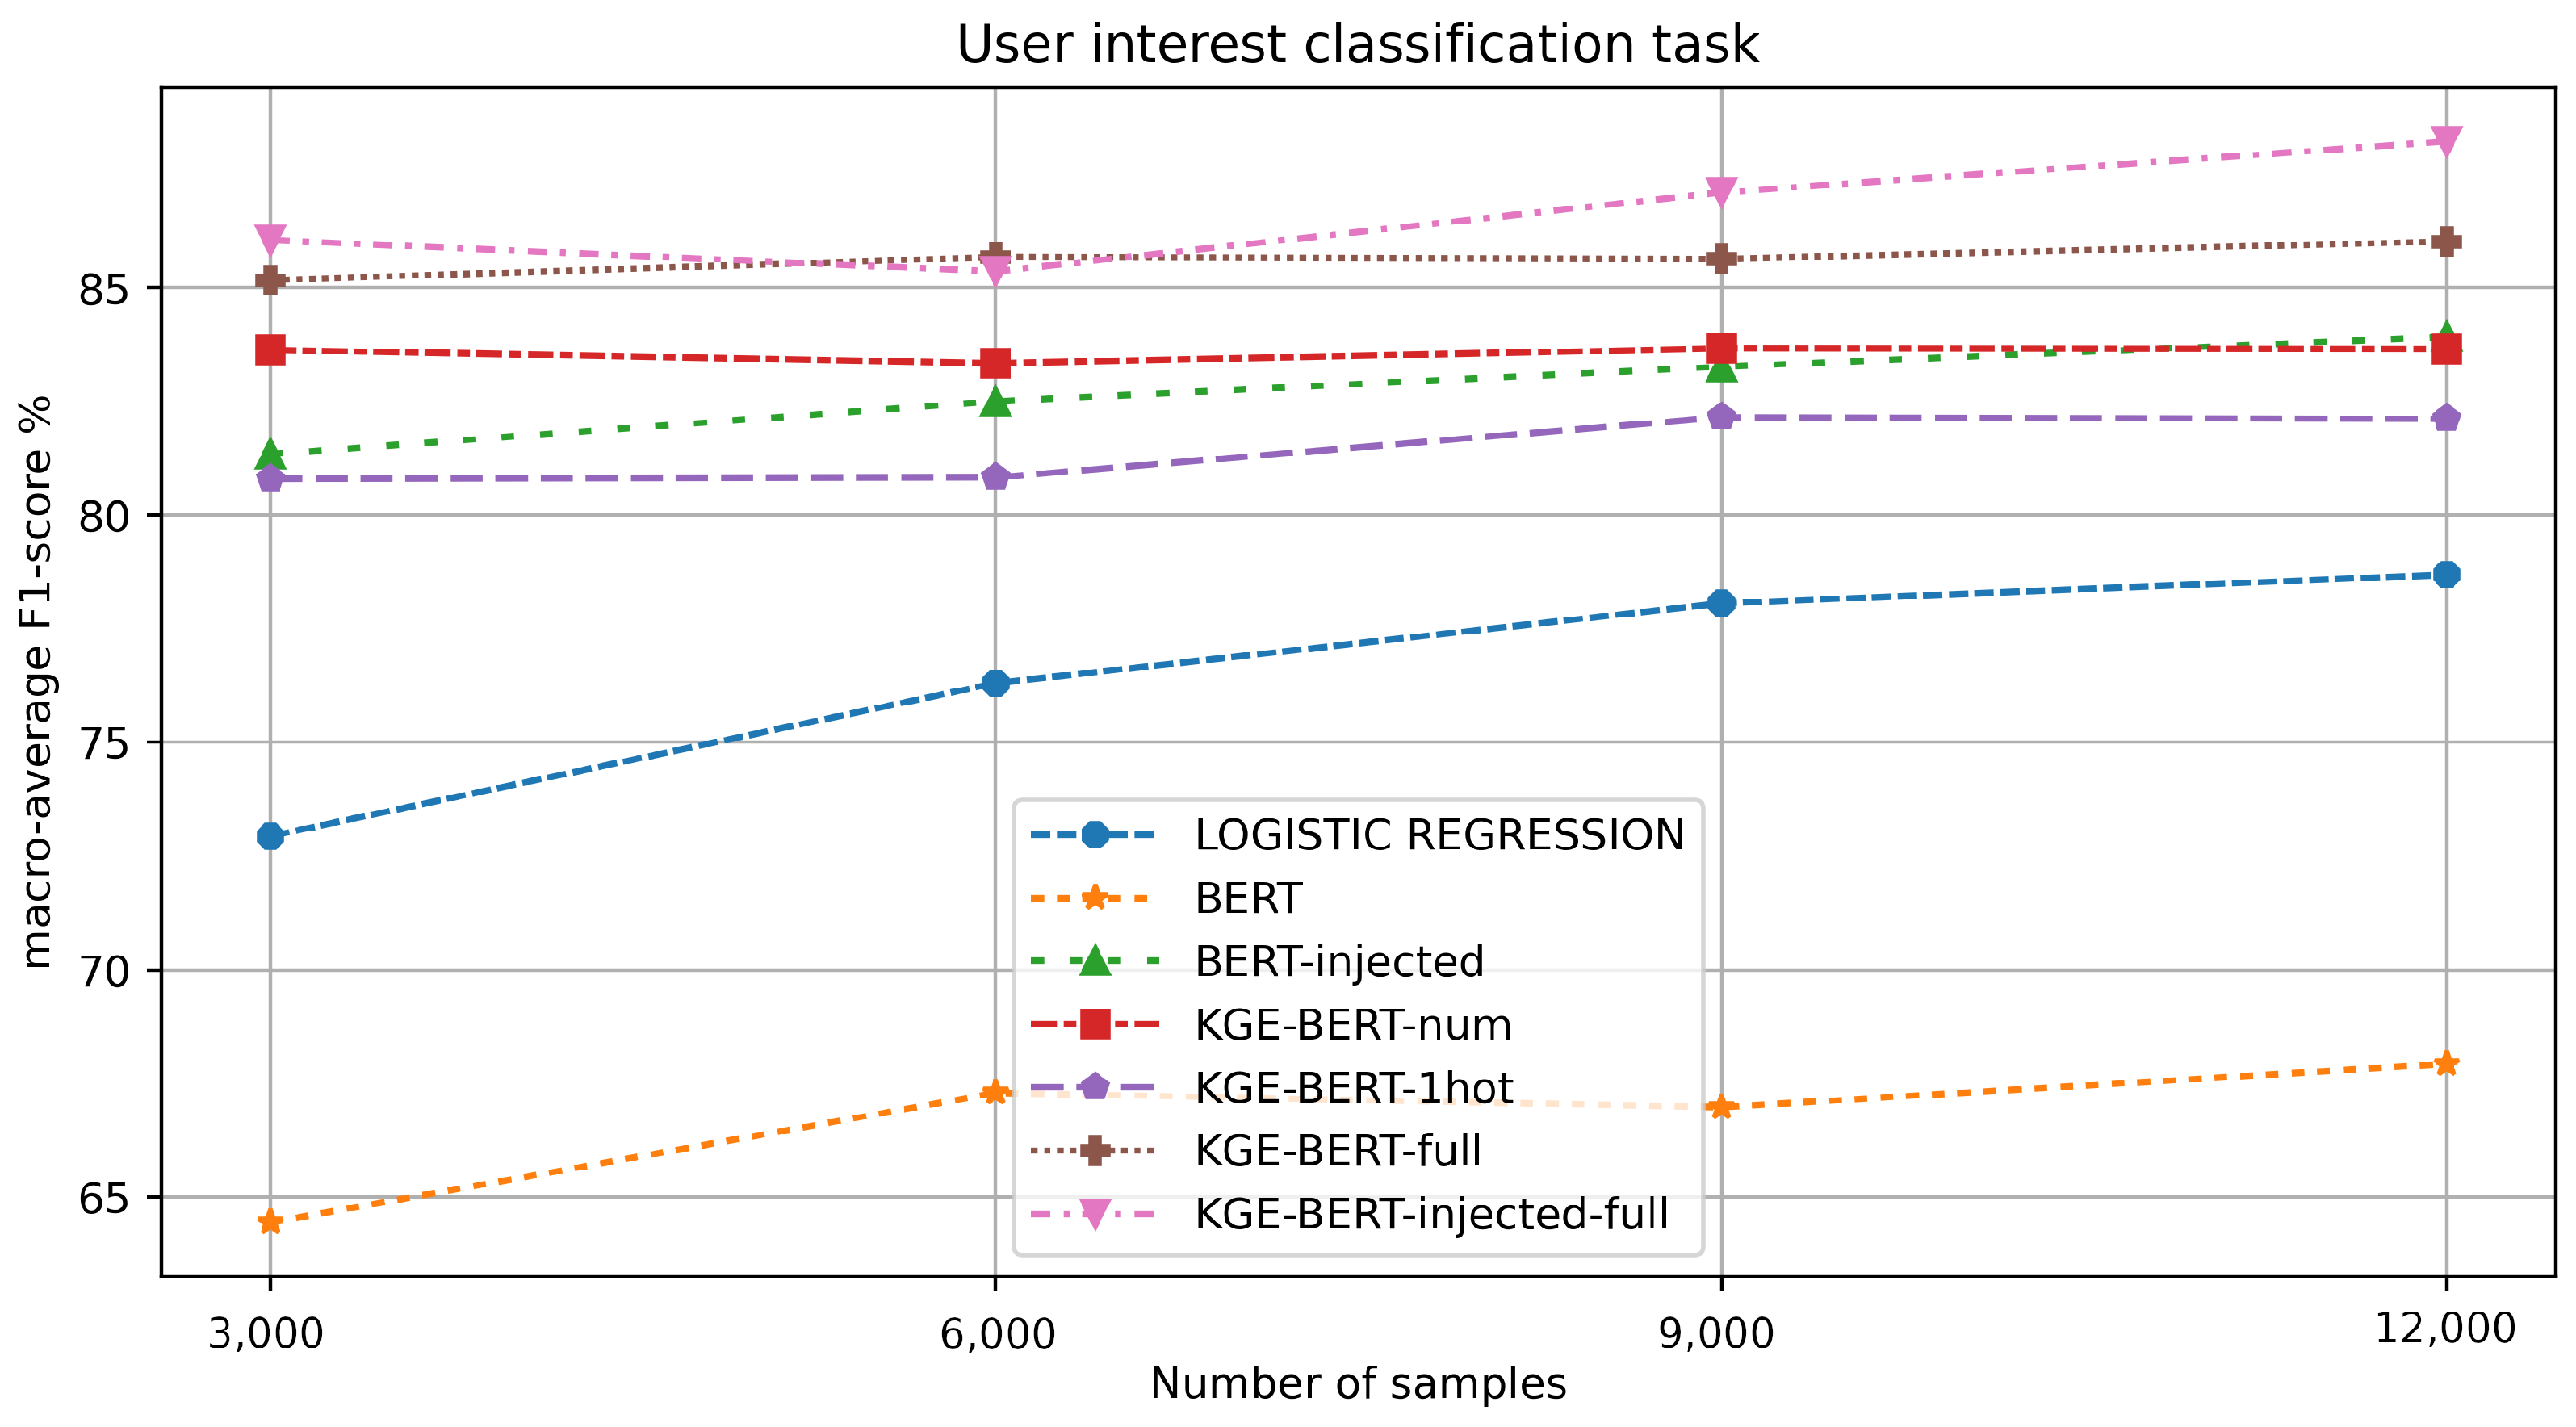
8.3.3. User Interest Classification
The results for this task are reported in Table 4 and in Figure 5. KGE-BERT-injected-full, again, yields the best results, especially with regard to the experiments using high numbers of training samples (9000 and 12,000). KGE-BERT-full is competitive, obtaining the best F1 score on 6000 training samples. As before, BERT-injected outperforms BERT.
Table 4.
User interest classification task: macro-average values for F1 score, precision, and recall.
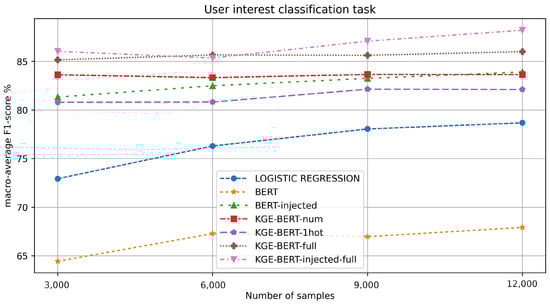
Figure 5.
F1-value macro-average results for each experiment in the user interest classification task.
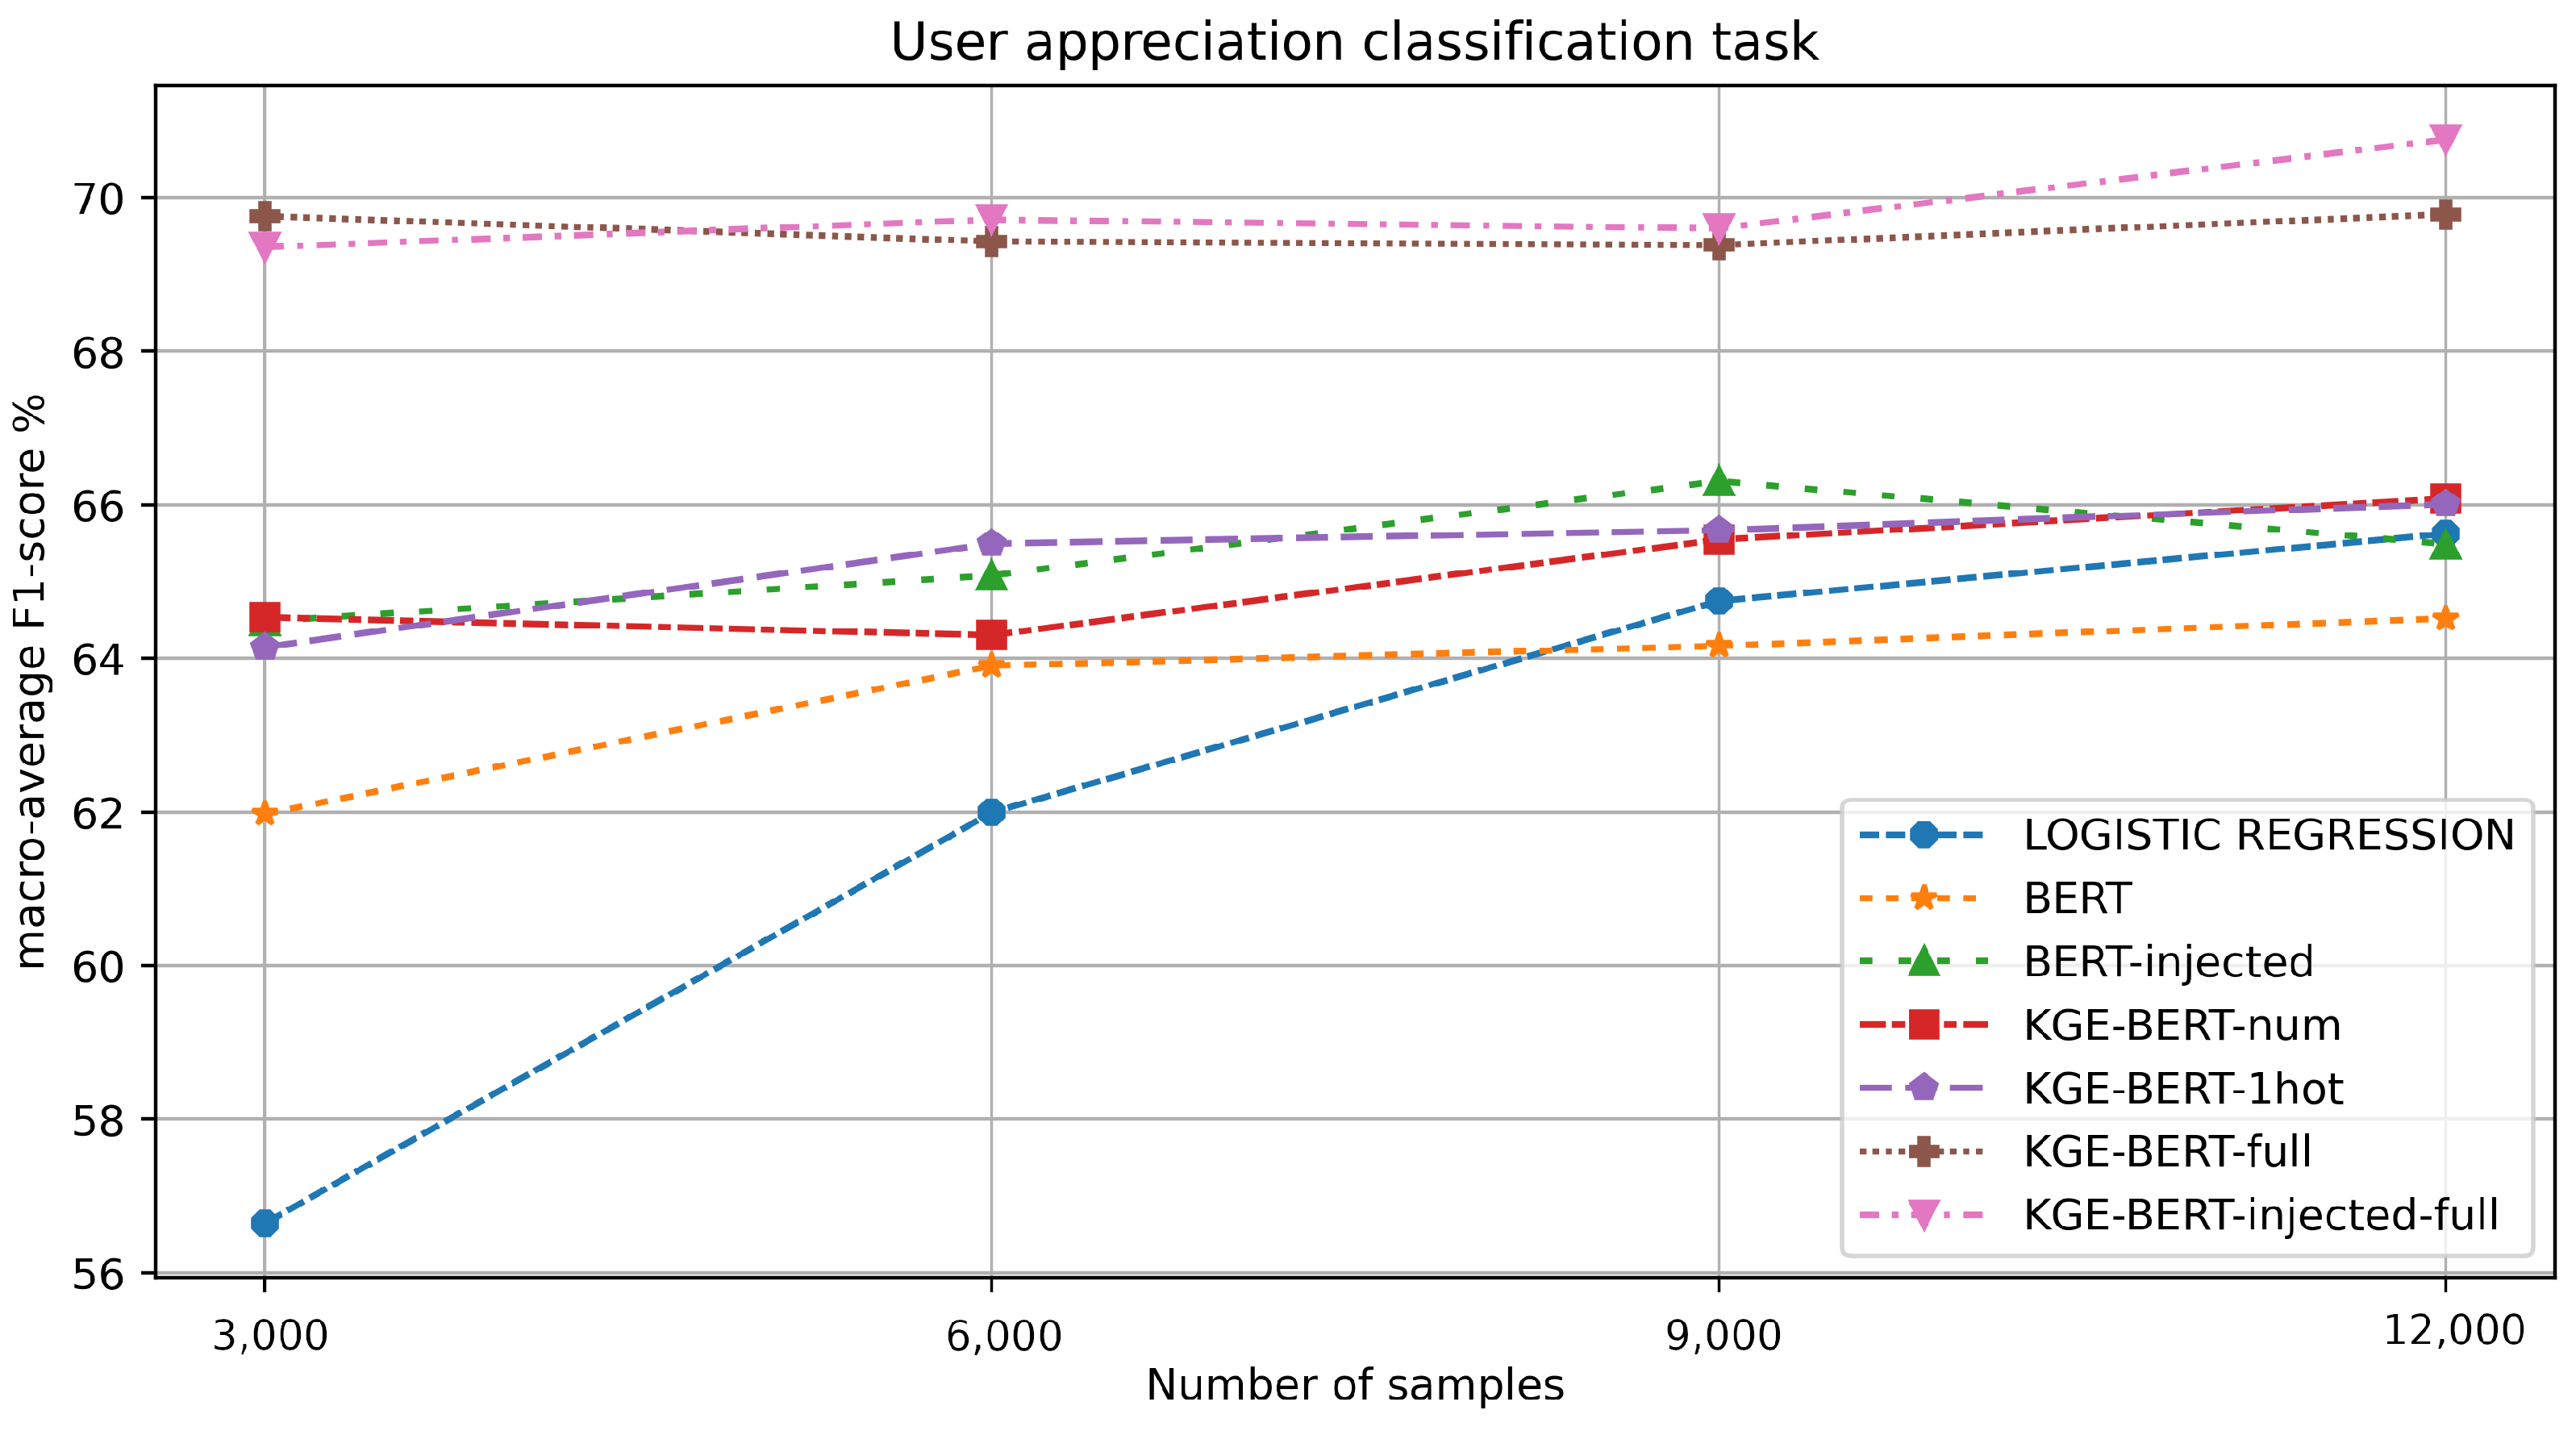
8.3.4. User Appreciation Classification
The results for this task are reported in Table 5 and in Figure 6. This seems to be the most challenging of the four classification tasks, as highlighted by the relatively low F1 scores. This is due to the fact that user reviews are given after the visit and are influenced by what is actually experienced by the user, which is hard to predict starting from the accommodation information available to the model.
Table 5.
User appreciation classification task: macro-average values for F1-score, precision, and recall.
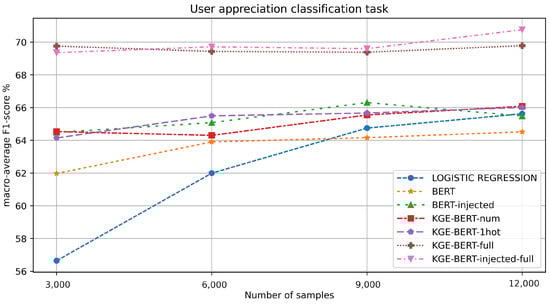
Figure 6.
F1-value macro-average results for each experiment in the user appreciation classification task.
KGE-BERT-injected-full and KGE-BERT-full yield similar results, clearly outperforming all the other methods. The other variations of KGE-BERT also perform better than BERT, in line with BERT-injected. This suggests, again, that combining multiple features has clear value.
9. Discussion
The experimental results demonstrate that the KGE-BERT approach confers notable advantages when compared to conventional transformer methods. In all the tested combinations, we measured better F1-score values for the two KGE-BERT variations using all available features (textual, numerical, categorical, and linked entities). KGE-BERT-injected-full and KGE-BERT-full produced comparable results. The first approach may be best-suited when the texts to be processed are shorter than the maximum number of tokens allowed for the transformer so that the extra space can be used to also inject knowledge as text. The second approach can be employed even with longer texts and uses less computation power during training and inference.
Overall, our experiments show the clear advantage of combining textual, categorical, and numerical features in this complex domain.
To further highlight the difference between the standard BERT and KGE-BERT-injected-full approaches (0), we indicate, in Table 6, the increment of F1 score. The values shown in the table were calculated with the following formula:
Table 6.
F1—increments of F1 score for BERT-KG-injected-full compared to BERT.
The observed maximum gain demonstrates a notable improvement of over 21 percentage points. In the context of price value classification, where the BERT model exhibits the best performance, the introduction of knowledge injection still yields a significant enhancement of more than three percentage points. This finding implies that even when BERT performs well, there is still room for improvement through knowledge injection.
As far as the proposed methodology is concerned, it can be easily extended to other tourist destinations, whether a city or an entire region, wherever appropriate data are available. In [34], we demonstrated that a tourism knowledge graph could be created from Airbnb data for both London and the Sardinia region. This shows that diverse destinations can be successfully modeled using the TAO ontology and DBpedia entities and described as a knowledge graph containing all the necessary information to support the feature engineering phase and the subsequent training phase for the KG-BERT neural model.
The widespread and consistent nature of Airbnb listings worldwide ensures the proposed methodology’s generality. In 2023, there were 7.7 million active Airbnb listings across 220+ countries, covering over 110,000 cities and towns, which means nearly every country in the world has an Airbnb presence (https://news.airbnb.com/about-us/, accessed on 15 June 2024). All Airbnb listings are characterized by a common set of metadata (numeric features for KG-BERT) and presented with textual descriptions following a standardized set of best practices and writing rules (text features for KG-BERT).
We provided a notebook that allows users to easily reproduce our methodology with similar data. It is designed to be adaptable for use with any destination (https://github.com/luca-secchi/kge-bert, accessed on 15 June 2024).
Thanks to this common framework, any tourist destination can be modeled and represented in a suitable form for the KG-BERT model to be trained and used for predictions by following the methodology introduced in this paper.
10. Conclusions
In this paper, we presented a hybrid system that supports the optimization of accommodation offers by combining large language models and knowledge graphs in the tourism domain. We applied our method to four classification tasks that are crucial to optimizing how accommodation offerings can be positioned in terms of price value, relevance, user interest, and user appreciation. For this purpose, we introduced a knowledge injection approach that leverages a knowledge graph to provide numeric data, categorical information, and linked entities to improve standard transformer models for classification. We also evaluated an alternative knowledge injection strategy that reiterates the injected knowledge using the above approach by including the same information directly as text. Our approach using this solution (KGE-BERT-injected-full) clearly outperformed the standard BERT model, obtaining a mean F1-score increment of 11.7 percentage points (varying from a minimum of 3.1 to a maximum of 20.6, depending on the task). When the combined injection strategy cannot be applied due to constraints on the maximum number of tokens, it is possible to use the other injection approach. This solution (KGE-BERT-full) also outperformed BERT, with a mean increase of 11.0 in F1 score (varying from a minimum of 3.4 to a maximum of 20.7).
The methodology presented in the paper was evaluated using a dataset of accommodation offers in London. However, it is a general methodology that can be easily applied to any accommodation characterized by the same metadata. Therefore, the resulting approach can be used for any other tourist destination (e.g., a city or an entire region) where the appropriate data are available. To further support our statement, we have provided a notebook that allows users to easily reproduce our methodology with similar data (https://github.com/luca-secchi/kge-bert, accessed on 15 June 2024).
A compelling avenue for future research involves enhancing the system to facilitate multi-class classification and regression, enabling more fine-grained outcomes for each dimension. Additionally, an extension of the current work could involve examining the extent to which a classifier trained for a particular tourist destination (e.g., London) can be applied to another destination (e.g., Rome), and exploring the potential for transfer learning. Furthermore, we are investigating methods to deliver explanations to users and provide tailored suggestions for how to modify accommodation descriptions and characteristics. To accomplish this, we intend to utilize explainable AI techniques [46] and generative language models [2], which offer a promising approach. The ultimate goal is to offer transparent and interpretable insights, empowering users to make well-informed decisions and enhance the quality of accommodation offers.
Author Contributions
Conceptualization, F.O., D.R.R. and L.S.; methodology, L.S., V.D.L., A.C. (Alessandro Chessa) and A.S.; software, V.D.L., L.S. and A.C. (Andrea Cadeddu); validation, A.C. (Alessandro Chessa), V.D.L. and L.S.; formal analysis, E.M. and F.O.; investigation, G.F. and D.R.R.; resources, G.F.; data curation, A.C. (Andrea Cadeddu), A.S., L.S. and V.D.L.; writing—original draft preparation, L.S., A.S., F.O. and D.R.R.; writing—review and editing, A.C. (Alessandro Chessa), G.F., E.M., F.O. and D.R.R.; visualization, L.S.; supervision, G.F., F.O. and D.R.R.; project administration, G.F. and E.M.; funding acquisition, G.F. and A.C. (Alessandro Chessa). All authors have read and agreed to the published version of the manuscript.
Funding
We acknowledge financial support under the National Recovery and Resilience Plan (NRRP), Mission 4 Component 2 Investment 1.5—Call for tender No. 3277 published on 30 December 2021 by the Italian Ministry of University and Research (MUR) funded by the European Union—NextGenerationEU. Project Code ECS0000038—Project Title eINS Ecosystem of Innovation for Next Generation Sardinia—CUP F53C22000430001—Grant Assignment Decree No. 1056 adopted on 23 June 2022 by the Italian Ministry of University and Research (MUR).
Institutional Review Board Statement
Not applicable.
Informed Consent Statement
Not applicable.
Data Availability Statement
To support the present work, we used a dataset that covers Airbnb’s London accommodations downloaded from the Inside Airbnb project (see http://insideairbnb.com/about, accessed on 15 June 2024). We also leveraged the TAO (Tourism Analytics Ontology), which is publicly accessible online (see http://purl.org/tao/ns, accessed on 15 June 2024). Restrictions may apply to the availability of some data. The main data were obtained from InsideAirbnb and are available at https://insideairbnb.com/ (accessed on 15 June 2024) with the permission of InsideAirbnb. In addition, we employed the Tourism Accommodation Ontology (TAO) for fine-grained organization of data within InsideAirbnb, which is openly available at http://purl.org/tao/ns (accessed on 15 June 2024). Finally, to ensure reproducibility, the complete code used in our experiments is accessible at https://github.com/luca-secchi/kge-bert (accessed on 15 June 2024).
Conflicts of Interest
Authors Andrea Cadeddu, Alessandro Chessa, Vincenzo De Leo and Luca Secchi were employed by the Linkalab s.r.l. The remaining authors declare that the research was conducted in the absence of any commercial or financial relationships that could be construed as a potential conflict of interest.
Abbreviations
The following abbreviations are used in this manuscript:
| BERT | Bidirectional Encoder Representations from Transformers Publishing Institute |
| KGE-BERT | Knowledge Graph Enhanced BERT |
| MLP | Multi-Layer Perceptron |
| TAO | Tourism Analytics Ontology |
| OWL | Web Ontology Language |
| TKG | Tourism Knowledge Graph |
References
- González-Serrano, L.; Talón-Ballestero, P. Revenue Management and E-Tourism: The Past, Present and Future. In Handbook of e-Tourism; Xiang, Z., Fuchs, M., Gretzel, U., Höpken, W., Eds.; Springer International Publishing: Cham, Switzerland, 2020; pp. 1–28. [Google Scholar] [CrossRef]
- OpenAI. GPT-4 Technical Report. arXiv 2023, arXiv:2303.08774. [Google Scholar]
- Mariani, M.M.; Hashemi, N.; Wirtz, J. Artificial intelligence empowered conversational agents: A systematic literature review and research agenda. J. Bus. Res. 2023, 161, 113838. [Google Scholar] [CrossRef]
- Devlin, J.; Chang, M.W.; Lee, K.; Google, K.T.; Language, A.I. BERT: Pre-training of Deep Bidirectional Transformers for Language Understanding. arXiv 2018, arXiv:1810.04805. [Google Scholar]
- Buscaldi, D.; Dessí, D.; Motta, E.; Murgia, M.; Osborne, F.; Recupero, D.R. Citation prediction by leveraging transformers and natural language processing heuristics. Inf. Process. Manag. 2024, 61, 103583. [Google Scholar] [CrossRef]
- Angioni, S.; Consoli, S.; Dessí, D.; Osborne, F.; Recupero, D.R.; Salatino, A. Exploring environmental, social, and governance (esg) discourse in news: An ai-powered investigation through knowledge graph analysis. IEEE Access 2024, 12, 77269–77283. [Google Scholar] [CrossRef]
- Schöbel, S.; Schmitt, A.; Benner, D.; Saqr, M.; Janson, A.; Leimeister, J.M. Charting the evolution and future of conversational agents: A research agenda along five waves and new frontiers. Inf. Syst. Front. 2024, 26, 729–754. [Google Scholar] [CrossRef]
- Meloni, A.; Angioni, S.; Salatino, A.; Osborne, F.; Recupero, D.R.; Motta, E. Integrating Conversational Agents and Knowledge Graphs within the Scholarly Domain. IEEE Access 2023, 11, 22468–22489. [Google Scholar] [CrossRef]
- Kalyan, K.S.; Rajasekharan, A.; Sangeetha, S. AMMU: A survey of transformer-based biomedical pretrained language models. J. Biomed. Inform. 2022, 126, 103982. [Google Scholar] [CrossRef] [PubMed]
- Kano, T.; Sakti, S.; Nakamura, S. Transformer-based direct speech-to-speech translation with transcoder. In Proceedings of the 2021 IEEE Spoken Language Technology Workshop (SLT), Shenzhen, China, 19–22 January 2021; pp. 958–965. [Google Scholar]
- Bolanos, F.; Salatino, A.; Osborne, F.; Motta, E. Artificial intelligence for literature reviews: Opportunities and challenges. arXiv 2024, arXiv:2402.08565. [Google Scholar]
- Peng, C.; Xia, F.; Naseriparsa, M.; Osborne, F. Knowledge graphs: Opportunities and challenges. Artif. Intell. Rev. 2023, 56, 13071–13102. [Google Scholar] [CrossRef]
- Dessí, D.; Osborne, F.; Reforgiato Recupero, D.; Buscaldi, D.; Motta, E. CS-KG: A large-scale knowledge graph of research entities and claims in computer science. In Proceedings of the Semantic Web–ISWC 2022: 21st International Semantic Web Conference, Virtual Event, 23–27 October 2022; Springer: Berlin/Heidelberg, Germany, 2022; pp. 678–696. [Google Scholar]
- Hitzler, P. A review of the semantic web field. Commun. ACM 2021, 64, 76–83. [Google Scholar] [CrossRef]
- Kumar, A.; Singh, S.S.; Singh, K.; Biswas, B. Link prediction techniques, applications, and performance: A survey. Phys. Stat. Mech. Its Appl. 2020, 553, 124289. [Google Scholar] [CrossRef]
- Nayyeri, M.; Cil, G.M.; Vahdati, S.; Osborne, F.; Rahman, M.; Angioni, S.; Salatino, A.; Recupero, D.R.; Vassilyeva, N.; Motta, E.; et al. Trans4E: Link prediction on scholarly knowledge graphs. Neurocomputing 2021, 461, 530–542. [Google Scholar] [CrossRef]
- Yang, J.; Xiao, G.; Shen, Y.; Jiang, W.; Hu, X.; Zhang, Y.; Peng, J. A Survey of Knowledge Enhanced Pre-trained Models. arXiv 2021, arXiv:2110.00269. [Google Scholar] [CrossRef]
- Cadeddu, A.; Chessa, A.; De Leo, V.; Fenu, G.; Motta, E.; Osborne, F.; Recupero, D.R.; Salatino, A.; Secchi, L. A comparative analysis of knowledge injection strategies for large language models in the scholarly domain. Eng. Appl. Artif. Intell. 2024, 133, 108166. [Google Scholar] [CrossRef]
- Simsek, U.; Angele, K.; Kärle, E.; Opdenplatz, J.; Sommer, D.; Umbrich, J.; Fensel, D.A. faphs. In Proceedings of the KGCW@ESWC, Virtual, 6 June 2021. [Google Scholar]
- Troncy, R.; Rizzo, G.; Jameson, A.; Corcho, O.; Plu, J.; Palumbo, E.; Ballesteros Hermida, J.C.; Spirescu, A.; Kuhn, K.D.; Barbu, C.; et al. 3cixty: Building comprehensive knowledge bases for city exploration. J. Web Semant. 2017, 46–47, 2–13. [Google Scholar] [CrossRef]
- Gazzè, D.; Duca, A.L.; Marchetti, A.; Tesconi, M. An overview of the tourpedia linked dataset with a focus on relations discovery among places. ACM Int. Conf. Proc. Ser. 2015, 16-17-Sept, 157–160. [Google Scholar] [CrossRef]
- Alonso-Maturana, R.; Alvarado-Cortes, E.; López-Sola, S.; Martínez-Losa, M.O.; Hermoso-González, P. La Rioja turismo: The construction and exploitation of a queryable tourism knowledge graph. In Proceedings of the Current Trends in Web Engineering: ICWE 2018 International Workshops, MATWEP, EnWot, KD-WEB, WEOD, TourismKG, Cáceres, Spain, 5 June 2018; Revised Selected Papers 18; 11153 LNCS. pp. 213–220. [Google Scholar] [CrossRef]
- Kärle, E.; Şimşek, U.; Panasiuk, O.; Fensel, D. Building an ecosystem for the tyrolean tourism knowledge graph. In Current Trends in Web Engineering; Springer: Berlin/Heidelberg, Germany, 2018. [Google Scholar] [CrossRef]
- Xiao, D.; Wang, N.; Yu, J.; Zhang, C.; Wu, J. A Practice of Tourism Knowledge Graph Construction Based on Heterogeneous Information. In Lecture Notes in Computer Science (Including Subseries Lecture Notes in Artificial Intelligence and Lecture Notes in Bioinformatics), Proceedings of the Chinese Computational Linguistics: 19th China National Conference, CCL 2020, Hainan, China, 30 October–1 November 2020; Springer: Berlin/Heidelberg, Germany, 2020; 12522 LNAI; pp. 159–173. [Google Scholar] [CrossRef]
- Zhang, W.; Cao, H.; Hao, F.; Yang, L.; Ahmad, M.; Li, Y. The Chinese Knowledge Graph on Domain-Tourism. In Advanced Multimedia and Ubiquitous Engineering; Park, J.J., Yang, L.T., Jeong, Y.S., Hao, F., Eds.; Springer: Singapore, 2020; pp. 20–27. [Google Scholar]
- Serles, U.; Kärle, E.; Hunkel, R.; Fensel, D. German Tourism Knowledge Graph. In Proceedings of the ESWC, Hersonissos, Greece, 26–30 May 2024. [Google Scholar]
- Fan, Z.; Chen, C. CuPe-KG: Cultural perspective–based knowledge graph construction of tourism resources via pretrained language models. Inf. Process. Manag. 2024, 61, 103646. [Google Scholar] [CrossRef]
- Liu, W.; Zhou, P.; Zhao, Z.; Wang, Z.; Ju, Q.; Deng, H.; Wang, P. K-BERT: Enabling Language Representation with Knowledge Graph. arXiv 2019, arXiv:1909.07606v1. [Google Scholar] [CrossRef]
- Ostendorff, M.; Bourgonje, P.; Berger, M.; Schneider, J.M.; Rehm, G.; Gipp, B. Enriching BERT with Knowledge Graph Embeddings for Document Classification. arXiv 2019, arXiv:1909.08402. [Google Scholar]
- Xu, Y.; Namazifar, M.; Hazarika, D.; Padmakumar, A.; Liu, Y.; Hakkani-Tür, D. KILM: Knowledge Injection into Encoder-Decoder Language Models. arXiv 2023, arXiv:2302.09170v1. [Google Scholar]
- Emelin, D.; Bonadiman, D.; Alqahtani, S.; Zhang, Y.; Mansour, S. Injecting Domain Knowledge in Language Models for Task-Oriented Dialogue Systems. arXiv 2022, arXiv:2212.08120v1. [Google Scholar]
- Moiseev, F.; Dong, Z.; Alfonseca, E.; Jaggi, M. SKILL: Structured Knowledge Infusion for Large Language Models. In Proceedings of the 2022 Conference of the North American Chapter of the Association for Computational Linguistics: Human Language Technologies, Seattle, DC, USA, 10–15 July 2022; pp. 1581–1588. [Google Scholar] [CrossRef]
- Wang, R.; Tang, D.; Duan, N.; Wei, Z.; Huang, X.; Ji, J.; Cao, G.; Jiang, D.; Zhou, M. K-Adapter: Infusing Knowledge into Pre-Trained Models with Adapters. arXiv 2021, arXiv:2002.01808. [Google Scholar]
- Chessa, A.; Fenu, G.; Motta, E.; Osborne, F.; Reforgiato Recupero, D.; Salatino, A.; Secchi, L. Data-Driven Methodology for Knowledge Graph Generation Within the Tourism Domain. IEEE Access 2023, 11, 67567–67599. [Google Scholar] [CrossRef]
- Bechhofer, S.; Van Harmelen, F.; Hendler, J.; Horrocks, I.; McGuinness, D.L.; Patel-Schneider, P.F.; Stein, L.A. OWL web ontology language reference. W3C Recomm. 2004, 10, 1–53. [Google Scholar]
- Lehmann, J.; Isele, R.; Jakob, M.; Jentzsch, A.; Kontokostas, D.; Mendes, P.N.; Hellmann, S.; Morsey, M.; Van Kleef, P.; Auer, S.; et al. DBpedia—A large-scale, multilingual knowledge base extracted from Wikipedia. Semant. Web 2015, 6, 167–195. [Google Scholar] [CrossRef]
- Mendes, P.N.; Jakob, M.; García-Silva, A.; Bizer, C. DBpedia spotlight: Shedding Light on the Web of Documents. In Proceedings of the 7th International Conference on Semantic Systems—I-Semantics ’11, New York, NY, USA, 7–9 September 2011; pp. 1–8. [Google Scholar] [CrossRef]
- Abu-Salih, B. Domain-specific knowledge graphs: A survey. J. Netw. Comput. Appl. 2021, 185, 103076. [Google Scholar] [CrossRef]
- Angioni, S.; Salatino, A.; Osborne, F.; Recupero, D.R.; Motta, E. AIDA: A knowledge graph about research dynamics in academia and industry. Quant. Sci. Stud. 2021, 2, 1356–1398. [Google Scholar] [CrossRef]
- Sun, C.; Qiu, X.; Xu, Y.; Huang, X. How to Fine-Tune BERT for Text Classification? In Lecture Notes in Computer Science (Including Subseries Lecture Notes in Artificial Intelligence and Lecture Notes in Bioinformatics), Proceedings of the Chinese Computational Linguistics: 18th China National Conference, CCL 2019, Kunming, China, 18–20 October 2019; Proceedings 18; Springer: Berlin/Heidelberg, Germany, 2019; 11856 LNAI; pp. 194–206. [Google Scholar] [CrossRef]
- González-Carvajal, S.; Garrido-Merchán, E.C. Comparing BERT against traditional machine learning text classification. arXiv 2020, arXiv:2005.13012v2. [Google Scholar]
- Liu, P.; Neubig, G.; Yuan, W.; Fu, J.; Jiang, Z.; Hayashi, H.; Neubig, G. Pre-train, Prompt, and Predict: A Systematic Survey of Prompting Methods in Natural Language Processing. ACM Comput. Surv. 2023, 55, 1–46. [Google Scholar] [CrossRef]
- Askari, A.; Abolghasemi, A.; Pasi, G.; Kraaij, W.; Verberne, S. Injecting the BM25 Score as Text Improves BERT-Based Re-rankers. arXiv 2023, arXiv:2301.09728v1. [Google Scholar]
- Wallace, E.; Wang, Y.; Li, S.; Singh, S.; Gardner, M. Do NLP Models Know Numbers? Probing Numeracy in Embeddings. arXiv 2019, arXiv:1909.07940v2. [Google Scholar]
- Dodge, J.; Ilharco, G.; Schwartz, R.; Farhadi, A.; Hajishirzi, H.; Smith, N. Fine-Tuning Pretrained Language Models: Weight Initializations, Data Orders, and Early Stopping. arXiv 2020, arXiv:2002.06305v1. [Google Scholar]
- Ribeiro, M.T.; Singh, S.; Guestrin, C. “Why Should I Trust You?”: Explaining the Predictions of Any Classifier. In Proceedings of the 22nd ACM SIGKDD International Conference on Knowledge Discovery and Data Mining, New York, NY, USA, 13–17 August 2016; KDD ’16. pp. 1135–1144. [Google Scholar] [CrossRef]


Disclaimer/Publisher’s Note: The statements, opinions and data contained in all publications are solely those of the individual author(s) and contributor(s) and not of MDPI and/or the editor(s). MDPI and/or the editor(s) disclaim responsibility for any injury to people or property resulting from any ideas, methods, instructions or products referred to in the content. |
© 2024 by the authors. Licensee MDPI, Basel, Switzerland. This article is an open access article distributed under the terms and conditions of the Creative Commons Attribution (CC BY) license (https://creativecommons.org/licenses/by/4.0/).