
A Method for Maintaining a Unique Kurume Kasuri Pattern of Woven Textile Classified by EfficientNet by Means of LightGBM-Based Prediction of Misalignments


Abstract
1. Introduction
2. Related Research Works
3. Proposed Method
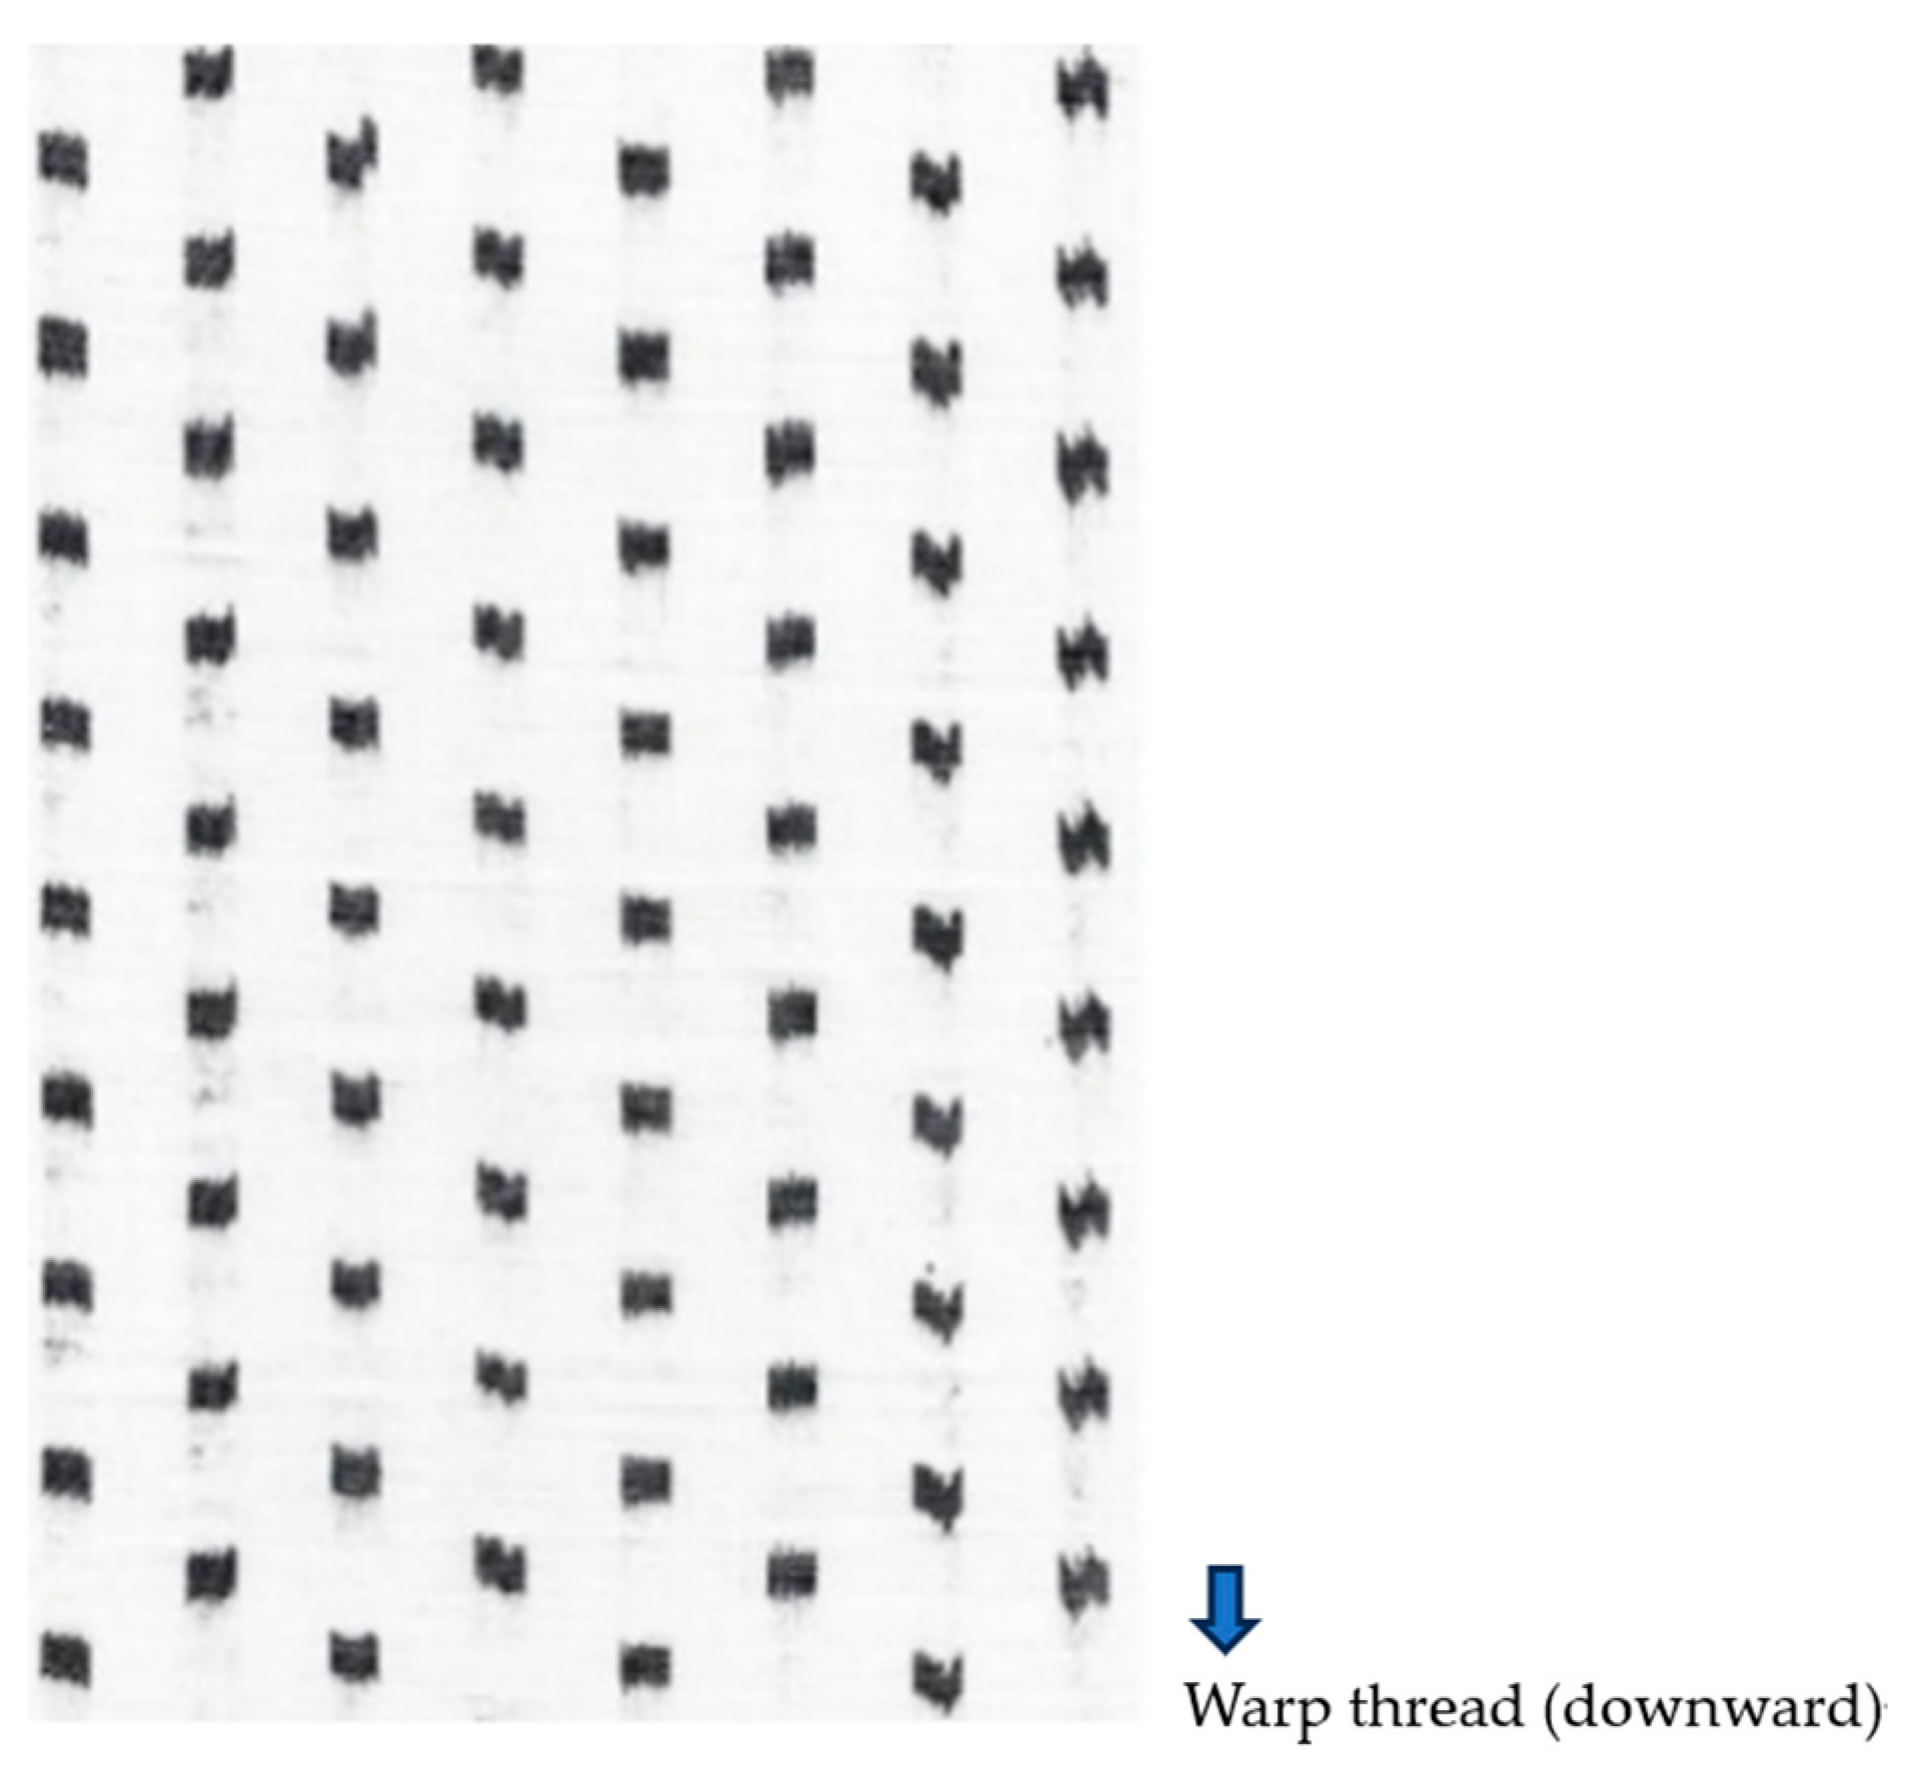
3.1. Example of Kurume Kasuri
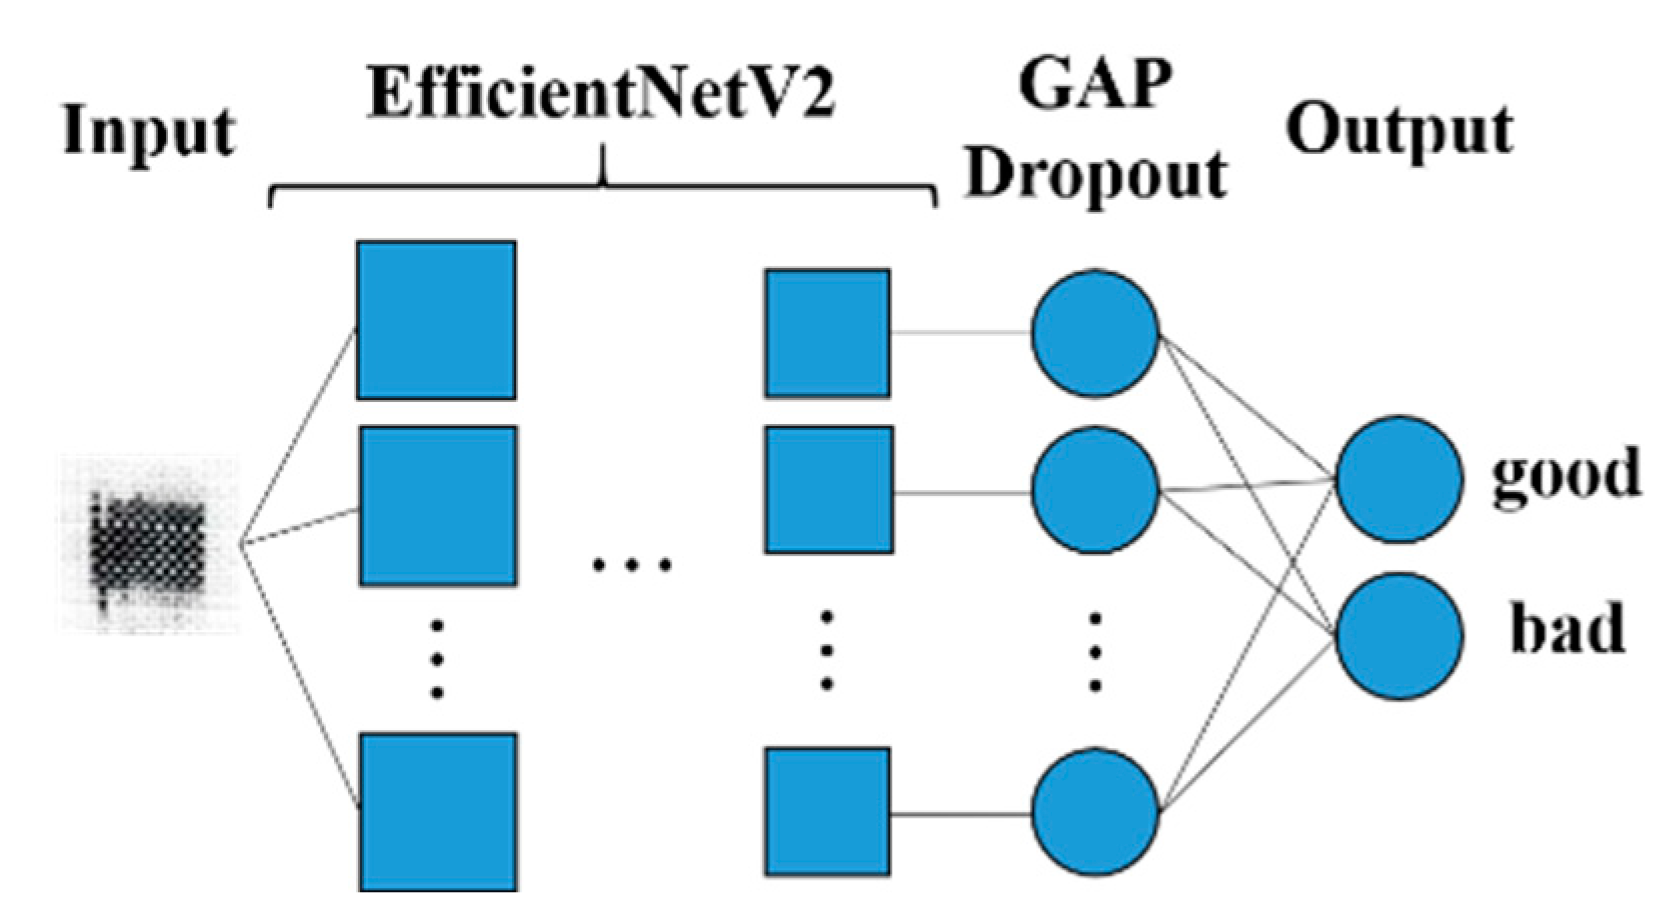
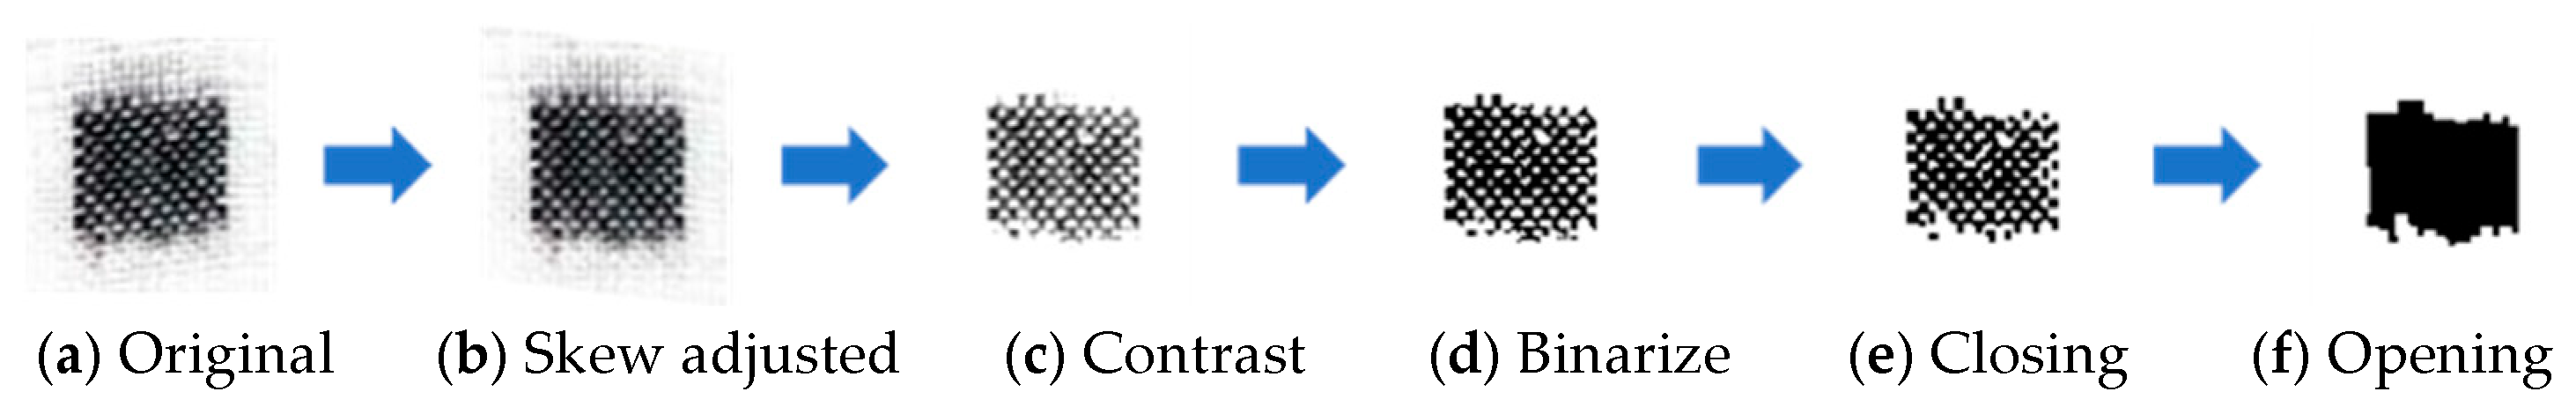
3.2. Classification Method
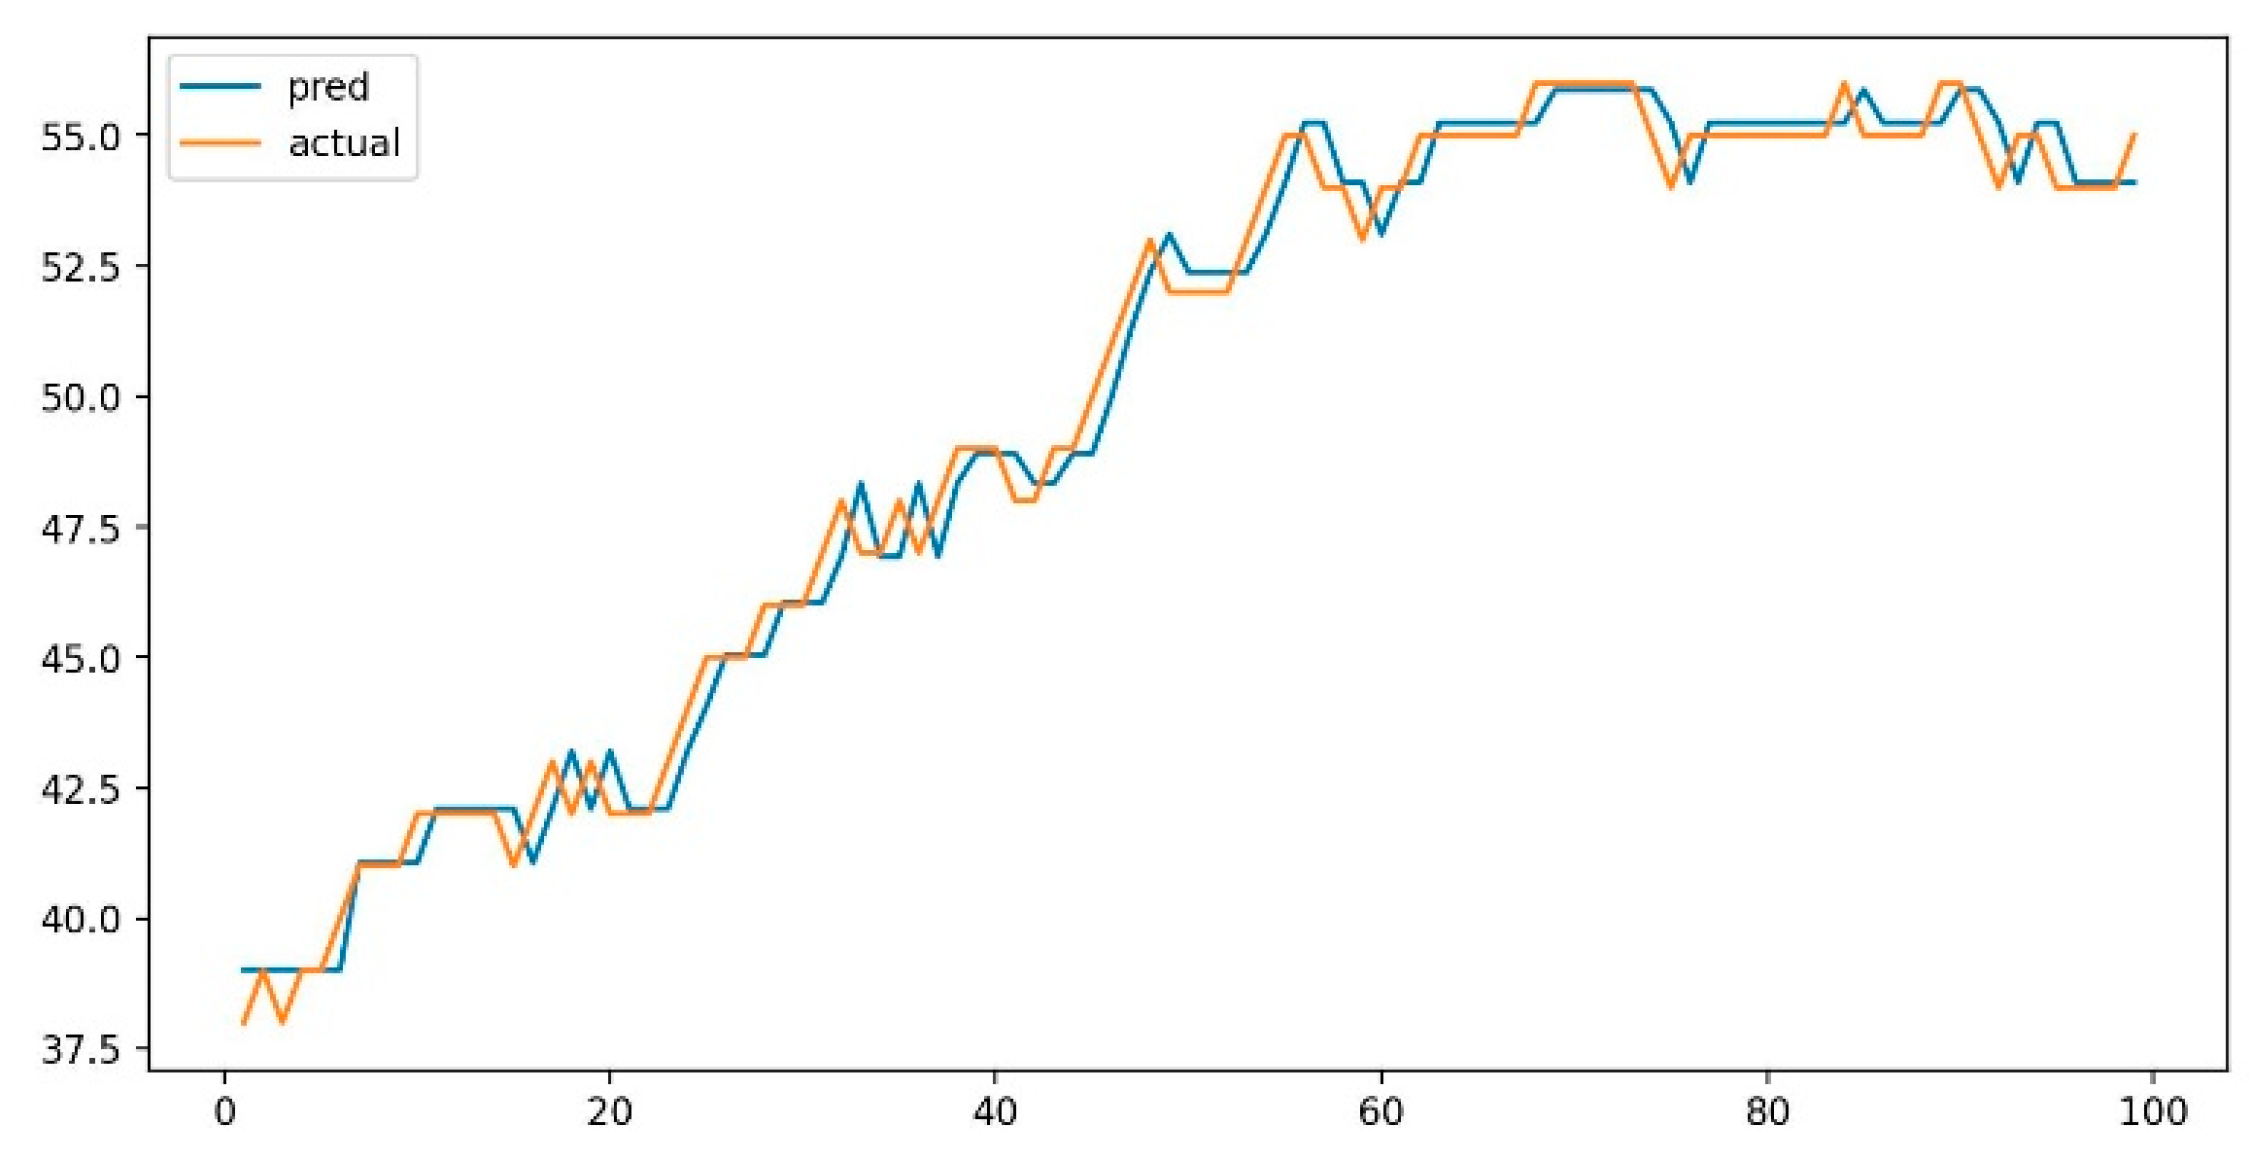
3.3. Prediction Method
4. Experiment
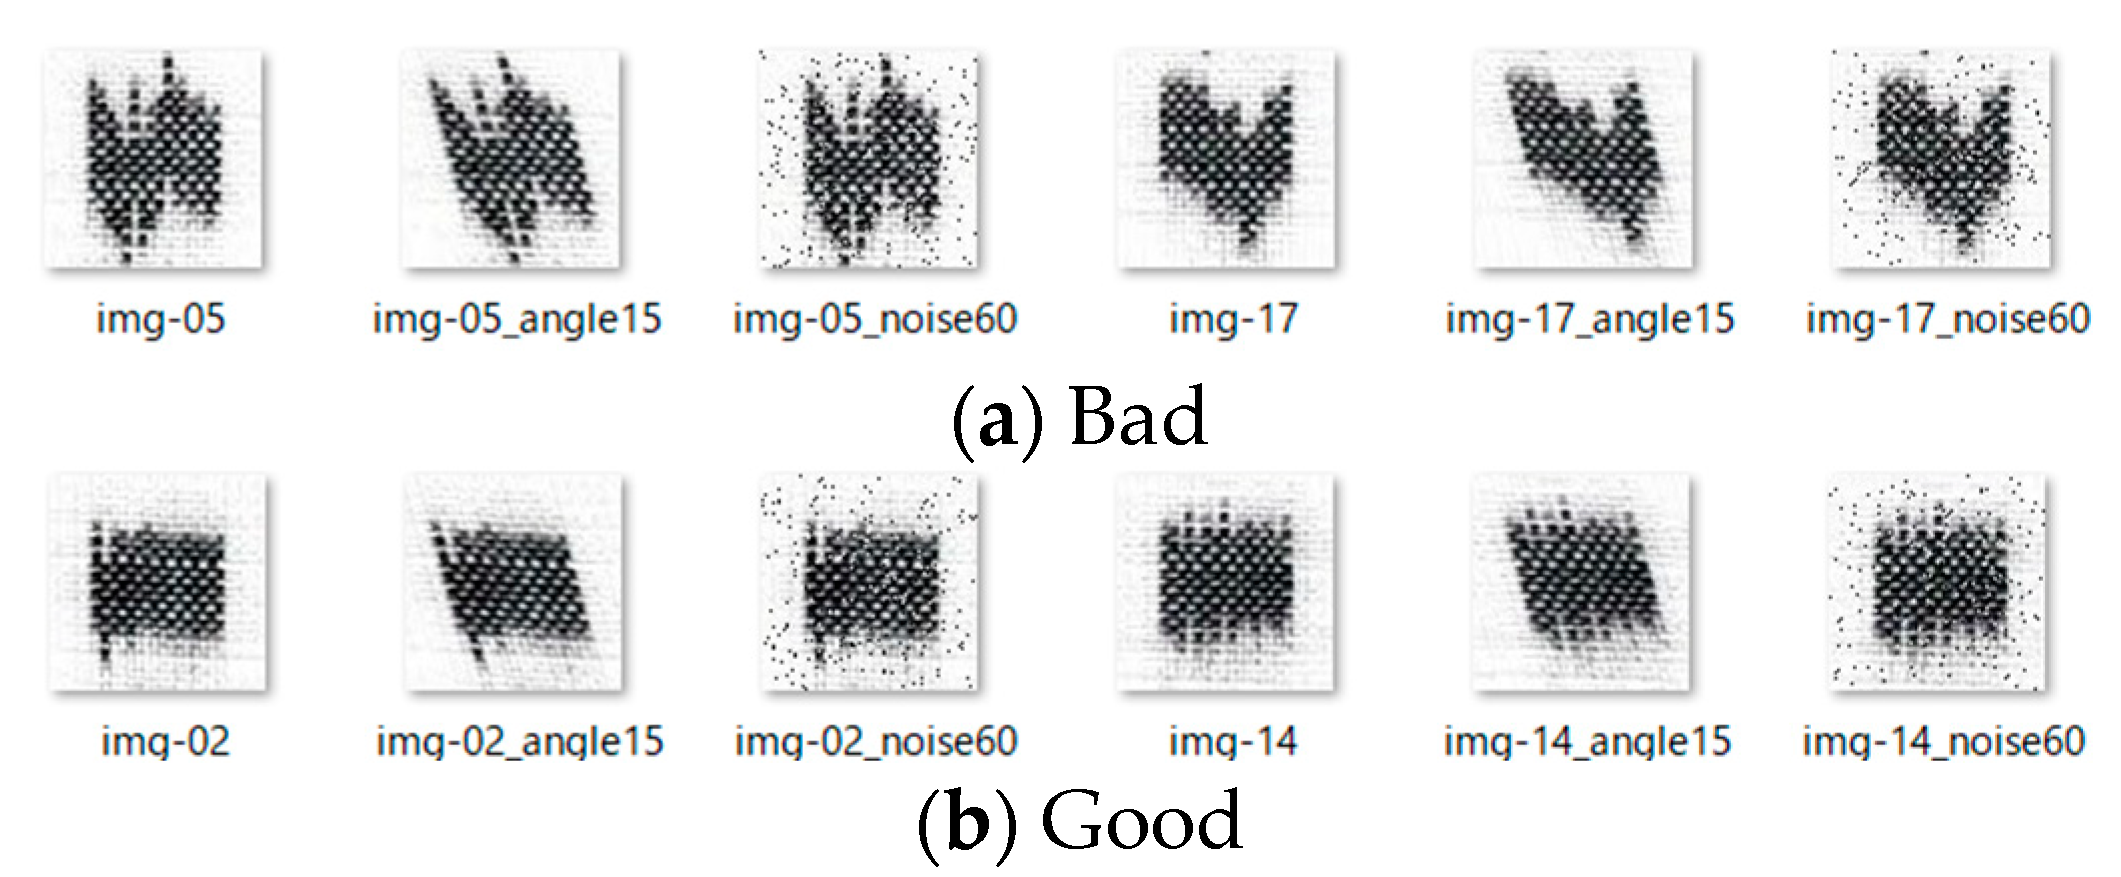
4.1. Data Used
4.2. Results
- (1)
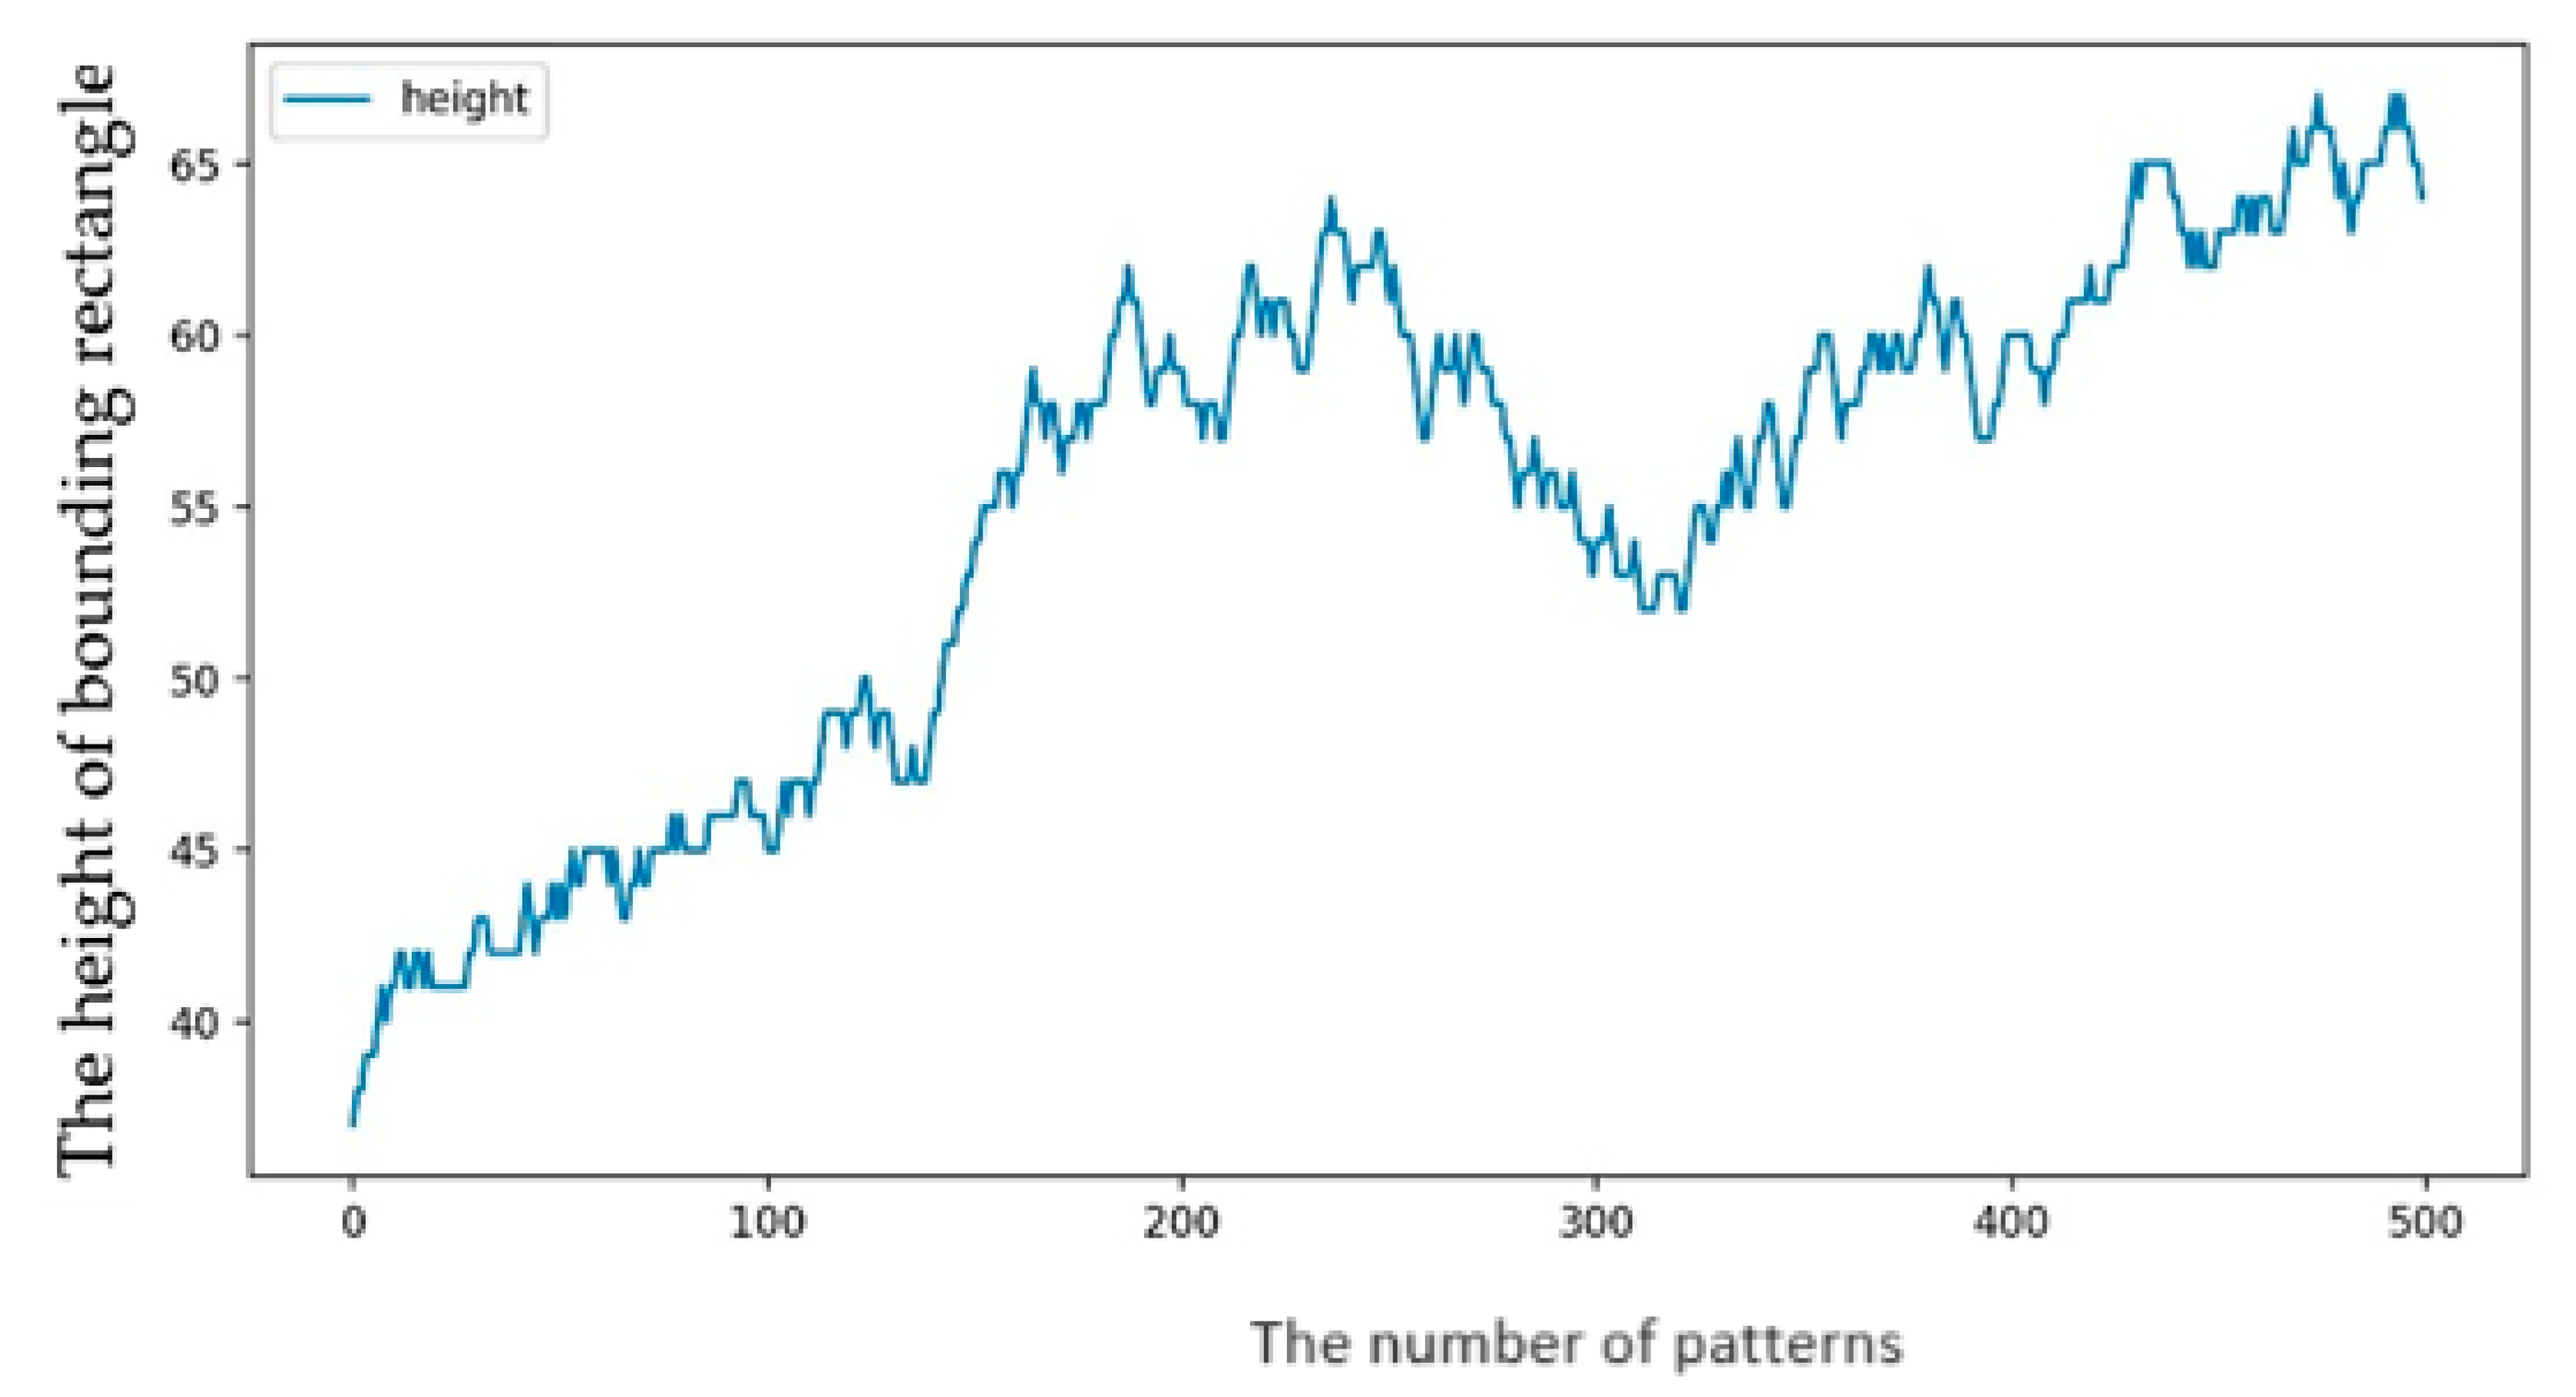
- Set the initial threshold value to the height of the actual pattern obtained from the data used: 36 pixels + 10 = 46 pixels;
- (2)
- Create a pattern, determine the height of the circumscribed rectangle, and perform one-step-ahead prediction using the LightGBM model;
- (3)
- If the predicted value is greater than or equal to the threshold:
- (4)
- If the height of the circumscribed rectangle of the pattern created in step (3) exceeds the current threshold three times in total:
- (5)
- Repeat the above process 500 times and use the threshold value at which the threshold no longer decreases as the final threshold.
- (1)
- Set the threshold to 41;
- (2)
- Create a pattern and determine the height of the circumscribed rectangle;
- (3)
- If the height of the circumscribed rectangle is greater than or equal to the threshold:
- (4)
- Repeat the above process 100 times.
- (1)
- Set the threshold to 41;
- (2)
- Create a pattern, determine the height of the circumscribed rectangle, and perform one-step-ahead prediction using the LightGBM model;
- (3)
- If the predicted value is greater than or equal to the threshold:
- (4)
- Repeat the above process 100 times.
5. Conclusions
6. Future Research Works
Author Contributions
Funding
Institutional Review Board Statement
Informed Consent Statement
Data Availability Statement
Acknowledgments
Conflicts of Interest
References
- Nakamura, K. History of Kurume Kasuri. J. Jpn. Inst. Text. Technol. 2005, 61, 152–156. [Google Scholar]
- Uchiyama, T. Demand structure analysis of traditional craft Kurume Kasuri. Economics 2020, 24, 33–52. [Google Scholar]
- Shimazoe, J.; Arai, K.; Oda, M.; Oh, J. Method for 1/f Fluctuation Component Extraction from Images and Its Application to Improve Kurume Kasuri Quality Estimation. Int. J. Adv. Comput. Sci. Appl. 2022, 13, 465–471. [Google Scholar] [CrossRef]
- Mori, T. Visual evaluation of lace patterns using neural networks. J. Jpn. Soc. Home Econ. 2000, 51, 147–156. [Google Scholar]
- Alex, K.; Sutskever, I.; Hinton, G.E. ImageNet classification with deep convolutional neural networks. In Proceedings of the Advances in Neural Information Processing Systems 25 (NIPS 2012), Lake Tahoe, NV, USA, 3–6 December 2012. [Google Scholar]
- Karen, S.; Zisserman, A. Very deep convolutional networks for large-scale image recognition. arXiv 2014, arXiv:1409.1556. [Google Scholar]
- Szegedy, C.; Liu, W.; Jia, Y.; Sermanet, P.; Reed, S.; Anguelov, D.; Erhan, D.; Vanhoucke, V.; Rabinovich, A. Going deeper with convolutions. In Proceedings of the IEEE Conference on Computer Vision and Pattern Recognition, Boston, MA, USA, 7–12 June 2015. [Google Scholar]
- James, B.; Yamins, D.; Cox, D.D. Hyperopt: A python library for optimizing the hyperparameters of machine learning algorithms. In Proceedings of the 12th Python in Science Conference, Austin, TX, USA, 9–24 June 2013. [Google Scholar]
- Authors, T.G. GPyOpt: A Bayesian Optimization Framework in Python. 2016. Available online: http://github.com/SheffieldML/GPyOpt (accessed on 23 July 2024).
- Ali, M. PyCaret: An Open Source, Low-Code Machine Learning Library in Python. Available online: https://www.pycaret.org (accessed on 23 July 2024).
- Akiba, T.; Sano, S.; Yanase, T.; Ohta, T.; Koyama, M. Optuna: A next generation hyperparameter optimization framework. In Proceedings of the the 25th ACM SIGKDD International Conference on Knowledge Discovery & Data Mining, Anchorage, AK, USA, 4–8 August 2019. [Google Scholar]
- Arai, K.; Shimazoe, J.; Oda, M. Method for Hyperparameter Tuning of Image Classification with PyCaret. Int. J. Adv. Comput. Sci. Appl. 2023, 14, 276–282. [Google Scholar] [CrossRef]
- Shashank, S.; Bansode, A.; Salim, A. A comparative study of hyper-parameter optimization tools. In Proceedings of the 2021 IEEE Asia-Pacific Conference on Computer Science and Data Engineering (CSDE), Brisbane, Australia, 8–10 December 2021. [Google Scholar]
- Chen, T.; Guestrin, C. Xgboost: A scalable tree boosting system. In Proceedings of the 22nd ACM SIGKDD International Conference on Knowledge Discovery and Data Mining, San Francisco, CA, USA, 13–17 August 2016. [Google Scholar]
- Ke, G.; Meng, Q.; Finley, T.; Wang, T.; Chen, W.; Ma, W.; Ye, Q.; Liu, T.Y. Lightgbm: A highly efficient gradient boosting decision tree. In Proceedings of the Advances in Neural Information Processing Systems 30 (NIPS 2017), Long Beach, CA, USA, 4–9 December 2017. [Google Scholar]
- Zhang, Y.; Zhu, C.; Wang, Q. LightGBM-based model for metro passenger volume forecasting. IET Intell. Transp. Syst. 2020, 14, 1815–1823. [Google Scholar] [CrossRef]
- Cao, Q.; Wu, Y.; Yang, J.; Yin, J. Greenhouse Temperature Prediction Based on Time-Series Features and LightGBM. Appl. Sci. 2023, 13, 1610. [Google Scholar] [CrossRef]
- Makridakis, S.; Spiliotis, E.; Assimakopoulos, V. M5 accuracy competition: Results, findings, and conclusions. Int. J. Forecast. 2022, 38, 1346–1364. [Google Scholar] [CrossRef]
- Otsu, N. Automatic threshold selection method based on discriminant and least squares criterion. IEICE Trans. Fundam. Electron. Commun. Comput. Sci. 1980, 63, 349–356. [Google Scholar]
- Zhang, H.; Cisse, M.; Dauphin, Y.N.; Lopez-Paz, D. mixup: Beyond empirical risk minimization. arXiv 2017, arXiv:1710.09412. [Google Scholar]
- Goodfellow, I.; Pouget-Abadie, J.; Mirza, M.; Xu, B.; Warde-Farley, D.; Ozair, S.; Courville, A.; Bengio, Y. Generative Adversarial Nets. In Proceedings of the Advances in Neural Information Processing Systems 27 (NIPS 2014), Montreal, QC, Canada, 8–13 December 2014. [Google Scholar]
- Shimazoe, J.; Arai, K.; Oda, M.; Oh, J. Classification of pattern deviation in Kurume Kasuri using convolutional neural network. Kurume Inst. Technol. Res. Rep. 2022, 45, 87–94. [Google Scholar]
- Tan, M.; Le, Q. EfficientnetV2: Smaller models and faster training. Int. Conf. Mach. Learn. PMLR 2021, 139, 10096–10106. [Google Scholar]
- Lin, M.; Chen, Q.; Yan, S. Network in network. arXiv 2013, arXiv:1312.4400. [Google Scholar]
- Shimazoe, J.; Arai, K.; Oda, M. Method for Hyperparameter Tuning of EfficientNetV2-based Image Classification by Deliberately Modifying Optuna Tuned Result. Int. J. Adv. Comput. Sci. Appl. 2023, 14, 463–468. [Google Scholar] [CrossRef]


| Manual | Optuna 1 | |
|---|---|---|
| Dropout Rate | 0.5 | 0.129 [0~0.5] |
| Batch Size | 16 | 32 [16, 32, 64] |
| Accuracy | 76.67% | 90% |
| Manual | Optuna 1 | |
|---|---|---|
| Dropout Rate | 0.5 | 0.124 [0~0.5] |
| Learning Rate | 0.001 | 0.001 [0.001, 0.0005, 0.0001] |
| Epoch (Transfer Learning) | 10 | 15 [10, 15, 20] |
| Batch Size (Transfer Learning) | 16 | 32 [16, 32] |
| Batch Size (Fine-Tuning) | 16 | 32 [16, 32] |
| Accuracy | 50% | 80% |
| Good | Bad | |
|---|---|---|
| Non-prediction | 98 | 2 |
| Prediction | 100 | 0 |
Disclaimer/Publisher’s Note: The statements, opinions and data contained in all publications are solely those of the individual author(s) and contributor(s) and not of MDPI and/or the editor(s). MDPI and/or the editor(s) disclaim responsibility for any injury to people or property resulting from any ideas, methods, instructions or products referred to in the content. |
© 2024 by the authors. Licensee MDPI, Basel, Switzerland. This article is an open access article distributed under the terms and conditions of the Creative Commons Attribution (CC BY) license (https://creativecommons.org/licenses/by/4.0/).
Share and Cite
Arai, K.; Shimazoe, J.; Oda, M. A Method for Maintaining a Unique Kurume Kasuri Pattern of Woven Textile Classified by EfficientNet by Means of LightGBM-Based Prediction of Misalignments. Information 2024, 15, 434. https://doi.org/10.3390/info15080434
Arai K, Shimazoe J, Oda M. A Method for Maintaining a Unique Kurume Kasuri Pattern of Woven Textile Classified by EfficientNet by Means of LightGBM-Based Prediction of Misalignments. Information. 2024; 15(8):434. https://doi.org/10.3390/info15080434
Chicago/Turabian StyleArai, Kohei, Jin Shimazoe, and Mariko Oda. 2024. "A Method for Maintaining a Unique Kurume Kasuri Pattern of Woven Textile Classified by EfficientNet by Means of LightGBM-Based Prediction of Misalignments" Information 15, no. 8: 434. https://doi.org/10.3390/info15080434
APA StyleArai, K., Shimazoe, J., & Oda, M. (2024). A Method for Maintaining a Unique Kurume Kasuri Pattern of Woven Textile Classified by EfficientNet by Means of LightGBM-Based Prediction of Misalignments. Information, 15(8), 434. https://doi.org/10.3390/info15080434