Article

Bullying Detection Solution for GIFs Using a Deep Learning Approach

by
Razvan Stoleriu
1,
Andrei Nascu
2,
Ana Magdalena Anghel
1 and
Florin Pop
1,3,4,*
1
Computer Science and Engineering Department, National University of Science and Technology Politehnica Bucharest, 060042 Bucharest, Romania
2
Department of Informatics, University of Craiova, 200585 Craiova, Romania
3
National Institute for Research and Development in Informatics—ICI Bucharest, Digital Transformation and Governance Department, 011455 Bucharest, Romania
4
Academy of Romanian Scientists, 050044 Bucharest, Romania
*
Author to whom correspondence should be addressed.
Information 2024, 15(8), 446; https://doi.org/10.3390/info15080446
Submission received: 8 July 2024 / Revised: 23 July 2024 / Accepted: 26 July 2024 / Published: 30 July 2024
(This article belongs to the Special Issue Emerging Research in Optimization Algorithms in the Era of Big Data)

Abstract

:
Nowadays, technology allows people to connect and communicate with each other even from miles away, no matter the distance. With the increased use of social networks that were rapidly adopted in human beings’ lives, they can chat and share different media files. While the intent for which they have been created may be positive, they can be abused and utilized in a negative way. One form in which they can be maliciously used is represented by cyberbullying. This is a form of bullying where an aggressor shares, posts, or sends false, harmful, or negative content about someone else by electronic means. In this paper, we propose a solution for bullying detection in GIFs. We employ a hybrid architecture that comprises a Convolutional Neural Network (CNN) and three Recurrent Neural Networks (RNNs). For the feature extractor, we used the DenseNet-121 model that was pre-trained on the ImageNet-1k dataset. The obtained results give an accuracy of 99%.

1. Introduction

The digital world provides unlimited ways of communication people can be involved in [1] and a lot of opportunities for learning, research, and exploration [2]. Although there are many benefits that arise from virtual interactions, like knowledge sharing, social support, and cross-cultural exchange [3], there are risks for young people, specifically the potential for bullying [4], as the youth spend much more time online these days than in the past [5].
Students who are cyberbullied report feeling anxious and afraid. They are not able to focus on and be attentive at school [6]. Moreover, they have difficulties as regards socialization, and they can start drinking alcohol, using drugs, or eating at irregular hours [7]. It has been observed that the victims tend to abandon school, receive detention, or even come with a weapon to school [8]. According to the following study [9], a person who is involved in a cyberbullying activity, either as a victim or aggressor, will have problems concerning their quality of life with regard to well-being and belonging.
According to Pew Research Center [10], nearly half (46%) of teens aged 13–17 have been bullied or harassed online in 2022. Many studies in the field have outlined that individuals who are bullied might feel negative psychological consequences [11,12], such as depression, anxiety, or lower self-esteem.
Bullying may be defined as somebody abusing, harassing, threatening, or frightening another person. Cyberbullying achieves the same things as the previous statement but with the help of electronic means [13]. Though anyone could be a victim of cyberbullying, teenagers, and specifically students, are more likely to be its target [14]. According to [15], there are multiple forms of cyberbullying. They could be provocation, disparagement, masquerade, deception, segregation, cyberstalking, and cyberterrorization [16]. Unfortunately, victims of cyberbullying often choose not to report it to anyone, including their parents and any agency that could take appropriate measures [17].
To improve our understanding of the phenomenon, it is required to define it in a way it can be identified correctly, that is, as “an aggressive, intentional act carried out by a group or individual, using electronic forms of contact, repeatedly and over time against a victim who cannot easily defend him or herself” [18]. It is important to identify the characteristics, such as aggressor and victim anonymity, the digital channel of interaction, aggression persistence, and intention to cause harm [19]. Considering that the occurrence rate ranges from 6 to 57.5%, based on 63 different studies [20], it has become an expanding behavior, affecting our society and especially young age groups. To reflect on recent years, it is necessary to bring into the discussion the effect of the COVID-19 crisis. Due to the stress factors related to infection, symptoms, and protective measure enforcement, it natural to assume that the cyberbullying rate increased based on the overall psycho-emotional impact. However, it is notable that support groups had an increased prevalence as well, and social distancing measures resulted in better supervision in public areas from organizations and in private areas through family interactions. One meta-analysis paper concluded that the effect of digital aggression was reduced, considering the high priority of physical and mental health [21]. Even so, the assessment formats were not identical; participants were tested under different conditions, which results in non-equivalent comparison between the data samples.
Many researchers have studied the consequences of cyberbullying on teenagers [22,23], and different solutions have been developed to automatically detect this behavior [24,25]. However, these systems also have to consider the new aspects of social media platforms, whose landscape has changed a lot in recent years. For instance, recent studies [26] showed that social media applications like Facebook or Instagram and limited-time message apps such as Snapchat are widely used by teenagers. As over 70% of all web traffic is represented by both image and video content [27], their significant usage has been noted in cyberbullying activities [28]. One of the things that came to our attention while doing some research concerning this subject was the fact that there is an increasing prevalence of image/video content in cyberbullying [29].
To our knowledge, at the time of writing, there are no other proposed solutions in the literature that treat the problem of bullying content in Graphics Interchange Format (GIF) files. As these are widely used due to their animation and short sizes, a system for the identification of malicious content should be designed. In comparison with other multimedia file types (e.g., AVI, MP4), GIF files have a shorter duration and the resolution is lower. This means that during the model training, we can analyze a larger number of frames of a lower quality (we reduce the training time). Also, the inference time for the analysis of a GIF file will be lower compared to that of other types of multimedia files.
In this paper, we propose a bullying detection solution for GIFs. We employ a hybrid architecture that comprises a CNN and three RNNs.
The key contributions of our paper are outlined below:
  • Created a dataset of bullying GIFs.
  • Proposed a model based on the Convolutional Neural Network–Recurrent Neural Network (CNN-RNN) architecture that receives as input the GIFs and generates the classification result at the output (non-bullying or bullying).
  • For the feature extractor, we used the DenseNet-121 model that was pre-trained on the ImageNet-1k dataset. The accuracy of our proposed solution is 99%.
The paper is structured as follows. In Section 1, we present a short overview of the bullying phenomenon in our society. Section 2 presents a critical analysis of similar papers that deal with the detection of cyberbullying material. Moreover, in Section 3 we present our proposed solution, and in Section 4 we present the experimental setup and analyze the obtained experimental results. In Section 5, we discuss the potential limitations of our solution. Finally, in Section 6, we draw conclusions regarding the results of the solution and identify future research opportunities.

2. Related Work

Cyberbullying belongs to the category of malicious Internet behavior, and it can be of many types, like trolling, hate speech, cyberaggression, and offensive language [30,31]. In this section, we discuss some work carried out by other researchers in the field concerning cyberbullying detection. This section is divided into multiple subsections, depending on the material type used: (i) text, (ii) image, (iii) both image and text, (iv) both emoji and text, and (v) video. Table 1 summarizes the scientific papers presented in this section.

2.1. Text-Based Cyberbullying Detection

In [32], the authors proposed a solution for cyberbullying detection using machine learning algorithms (ML). They collected the data from the Formspring.me platform and labeled it using Amazon’s Mechanical Turk. They obtained a dataset of 2696 posts for training and 1219 for testing. The authors have utilized the following machine learning algorithms implemented in Weka: J48, JRIP, K-nearest neighbors, and Support Vector Machine (SVM). The highest accuracy, 78.5%, was obtained by using the J48 and K-nearest neighbors algorithms.
The authors of [33] propose a cyberbullying detection solution based on machine learning (ML). In their study, they employ a variant of Denoising Autoencoder that is semantically enhanced. Concerning the dataset, they use Twitter-labeled data, collected from Kaggle. It is split into 80% for training and 20% for testing. The researchers use various ML algorithms, and the highest accuracy is obtained for the SVM (i.e., 86.5%).
In another study [34], the authors propose a supervised ML model for cyberbullying detection in posts from the MySpace platform. They employ an SVM classifier that considers language features specific to each gender (i.e., male, female). They use Weka for the implementation of the machine learning (ML) model. Concerning the dataset, they utilize 2200 MySpace posts. A total of 34% of them were written by females, while 66% were written by males. The obtained results show that the features related to the gender-specific language improved the baseline accuracy as follows. The recall increased by 6%, the F-measure was improved by 15%, and the precision increased by 39%.
A machine learning (ML)-based solution for cyberbullying detection in a social media platform (i.e., Twitter) is proposed in [35]. They use two datasets collected from Kaggle. One has 11004 tweets, and another has 24783. There are many more non-offensive than offensive instances for each of the datasets. To set up the experimental environment, they use the Anaconda3-2021 version, with Conda 4.7.12 and Python 3.9. As a text editor, they utilize Jupyter Notebook. They employ the following ML classifiers: Bagging, SGD, Decision Tree, Random Forest, and K-Neighbors. They obtain the highest accuracy for SGD (i.e., 92.9%) and the highest precision for Bagging (i.e., 96.7%). However, they do not mention the features used by the ML algorithms.
The authors of [36] propose a cyberbullying detection solution based on machine learning (ML) algorithms. Their study focuses on Hinglish Facebook posts. In the conversion process of words into numerical values for natural language processing, the researchers have used Term Frequency–Inverse Document Frequency (TF-IDF). They have chosen several algorithms for classification: Naïve Bayes, Random Forest, SVM, Decision Tree, and linear regression. The highest accuracy has been obtained for SVM, at 87.53%.
In [37], the authors propose a cyberbullying detection and prevention solution based on supervised machine learning models. Their method contains three main steps: preprocessing, feature extraction, and classification. To extract the features of the input data, they use TF-IDF. Further, the Text Blob library is used for the extraction of the sentences’ polarity. Moreover, the proposed approach uses NGram for handling various word combinations. For classification, the researchers employ SVM and Neural Networks (NNs). The dataset contains 1608 instances from the Formspring platform. A total of 80% is used for training, while 20% is used for testing. The highest accuracies were obtained for SVM with 4-Gram: 90.3% and for NN with 3-Gram: 92.8%.
Another paper [38] describes a cyberbullying detection and prevention solution based on supervised machine learning algorithms. The proposed approach employs SVM and Logistic Regression classifiers. The features the authors selected and analyzed are TF-IDF, sentiment analysis, profanity expressions, and the percentage of words related to cyberbullying in a sentence. The dataset contains tweets from the Internet Archive. The authors used SVM to train the model and Logistic Regression to select the best combination of features. The highest accuracy (i.e., 75.17%) was obtained when TF-IDF was used along with sentiment analysis techniques.

2.2. Image-Based Cyberbullying Detection

The authors of [39] propose a solution for cyberbullying detection in real-world images. They first collected a dataset with 19,300 pictures. These were labeled with the help of users from Amazon Mechanical Turk. Further, they tested five solutions for cyberbullying detection from the market (i.e., DeepAI, Google API, Amazon Rekognition, etc.), and they observed these obtained poor detection rates. Thus, the authors proposed a system that could improve the accuracy and fill the detection gaps of the previous solutions. They identified features that could bring more efficacy (e.g., facial expression, body position, gestures). The researchers employed four classifiers for cyberbullying detection. The highest accuracy, 93.36%, has been obtained by the multimodal classifier. It takes as input both the image and the identified features.

2.3. Image- and Text-Based Cyberbullying Detection

In their work [40], the authors propose a multi-modal cyberbullying detection solution. The system is designed to handle multilingual users and takes as input memes that contain both text and images. The authors create their own dataset based on Reddit and Twitter platforms. Besides cyberbullying detection, they want to recognize emotions, analyze sentiments, and detect sarcasm in meme posts. To achieve these, the researchers implement the following two frameworks: CLIP-CentralNet and BERT+ResNET-Feedback. They use 70% of the data for training, 10% for validation, and 20% for testing. Experimental results indicate an accuracy of 74.17% for CLIP-CentralNet and 66.74% for BERT+ResNET-Feedback models. The Inter-modal Attention modality was used along with these classifiers.
In [41], the authors design a cyberbullying detection solution that considers both the textual and visual features. Concerning the first category, the researchers used Linguistic Inquiry and Word Count (LIWC), which provides services such as informal language identification, word count and categorization, and punctuation frequency. For the visual features, the authors utilize Microsoft’s Project Oxford, which identifies the image type, existence of pornographic or racist content, and many other attributes. The dataset has 699 media sessions from Instagram, and it contains the following: the image, caption, and associated comments. A total of 66% of the data has been used for training, while the rest was used for testing. For classification, the researchers used the Bagging algorithm from Weka. The highest accuracy, 81.4%, was obtained when both the textual and visual features were considered.
The authors of [42] proposed a multi-modal solution for cyberbullying detection. The dataset has 2100 images along with the associated comments. It was collected from different social media platforms (i.e., Instagram, Twitter, Facebook) and Google searches. The authors employ a CNN. They use Term Frequency–Inverse Document Frequency (TF–IDF) to transform the text words into a vector. The image convolution is represented in two dimensions. Thus, among the available variants, the most efficient solution was to transform the word vector into a matrix with two dimensions. The best results were obtained for a CNN with one layer and a filter of 2048. In this situation, the Recall for the bullying class was 74%.
Table 1. Research papers for cyberbullying and cyberaggression detection.
Data TypeML AlgorithmsBenefitsDrawbacks
TextJ48, JRIP, K-nearest neighbors, SVM [32]Took into account the prevalence of words related to cuss and insult.The number of instances used for training is small. They did not take into account information related to context.
TextDecision tree, Random Forest, Naive Bayes, SVM [33]Reported results are goodConsidered only content-based features
TextSVM [34]They utilized as features information related to age and gender.The obtained results related to precision are not high.
TextBagging, SGD, Decision Tree, Random Forest, K-Neighbors [35]Obtained results are goodTheir dataset is not balanced.
TextSVM, Logistic Regression, Naive Bayes, Decision Tree, Bagging, Random Forest [36]Multilingual considerationTheir solution can be applied only to text written in Hinglish.
Image and textBagging Classifier [41]They use both textual and visual features for cyberbullying predictionThe training dataset is very small
TextSVM and Neural Network each of them with 2, 3 and 4 Gram [37]They use TFIDF and sentiment analysis techniquesConsidered only content-based features
ImageBaseline Model, Factors-only Model, Fine-tuned Pre-trained model, Multimodal Model [39]They propose a method for the image dataset collection, evaluate 5 state-of-the-art solutions for cyberbullying detection, identify new factors for cyberbullying in imagesThe dataset is heavily unbalanced: 4719 cyberbullying images and 14,581 for the other category
Image and textMulti-layered CNN model [42]They use a 2-D representation of both the text and image for the CNN. They use a unified approach that combines both text and image.Pretty poor results
TextSVM and Logistic Regression [38]They use TFIDF and sentiment analysis techniquesConsidered only content-based features
Text and emojiBidirectional GRU + CNN + Attention layer [43]They propose a deep learning model that has high accuracy.They do not mention the size of the dataset
Image and text (Memes)BERT + ResNet-Feedback and CLIP-CentralNet [40]Their research brings improvements in terms of accuracy and precision in comparison to other solutions that consider just images or text.The dataset is unbalanced and the results are pretty poor
Image and textCNN + Binary Particle Swarm Optimization (BPSO) + Random Forest [44]They use the BPSO algorithm that takes just the most important features.Pretty poor results
Image and textOpenCV + CNN [45]They use various Apache technologies for storing and processing data.They do not mention the accuracy or other performance metrics of the proposed solution.
VideoCNN based on EfficientNet-B7 + BiLSTM  [46]Obtained results are goodThey do not consider textual or audio features.
VideoGenerative Adversarial Networks [47]They utilize Mel-frequency cepstral coefficients to obtain the audio featuresThe obtained results are poor.
In [45], the authors propose a multimodal solution for harmful content detection. The researchers leverage text- and image-based features, and they utilize a crawler to obtain the necessary data. They use OpenCV and a Convolutional Neural Network (CNN) to extract the visual features. The gathered data are collected and processed by various Apache technologies. The authors do not mention the accuracy or other performance metrics of the system.

2.4. Video-Based Harmful Content Detection

The authors of [46] propose a harmful content detection system for YouTube videos. Their dataset contains videos that belong to various categories: benign, pornography, and violence. For feature extraction, the researchers use a Convolutional Neural Network (CNN) based on the EfficientNet-B7 model. All of the video frames were rescaled to a dimension of 224 × 224. For classification, the authors used Bidirectional Long Short-Term Memory (BiLSTM). The highest accuracy, 95.66%, has been obtained when using BiLSTM with 128 hidden units.
In [47], the authors propose a solution for harmful content detection. It is intended to make a safer environment for children and prevent them from viewing content that could disturb them. Their dataset contains 2000 YouTube videos. A total of 80% of the data is used for training, 10% for testing, and 10% for validation purposes. Their proposed system achieves an accuracy of 74% by using Generative Adversarial Networks (GANs).
The authors of [44] present a multi-modal cyberaggression detection solution. They employ a framework built on Binary Particle Swarm Optimization (BPSO) and a CNN to classify posts into different levels of aggressiveness. The dataset contains 3600 images along with the associated comments. For feature extraction from images, the researchers leverage a pre-trained VGG-16, while as regards the text, they utilize a CNN with three layers. The Random Forest algorithm was used to evaluate the accuracy of the system. It reached an F1-Score of 74%.

2.5. Emoji- and Text-Based Cyberbullying Detection

The authors of [43] propose a cyberbullying detection solution for comments that might contain both texts and emojis. Their system is made of multiple layers: BiGRU, the attention layer, CNN, the full connection layer, and the classification layer. The text dataset was gathered from Kaggle, while the emoji one was crawled from social networks. The emojis included in the comments are converted to their corresponding CLDR Short Name according to the Unicode Consortium. The results show that the classification accuracy of the model is 91.07%. The authors used the Scrapy framework to crawl comments from social media.

3. Solution Design and Implementation

In this section, we describe the data we collected for this study first, and then, we present the architecture of the proposed system.

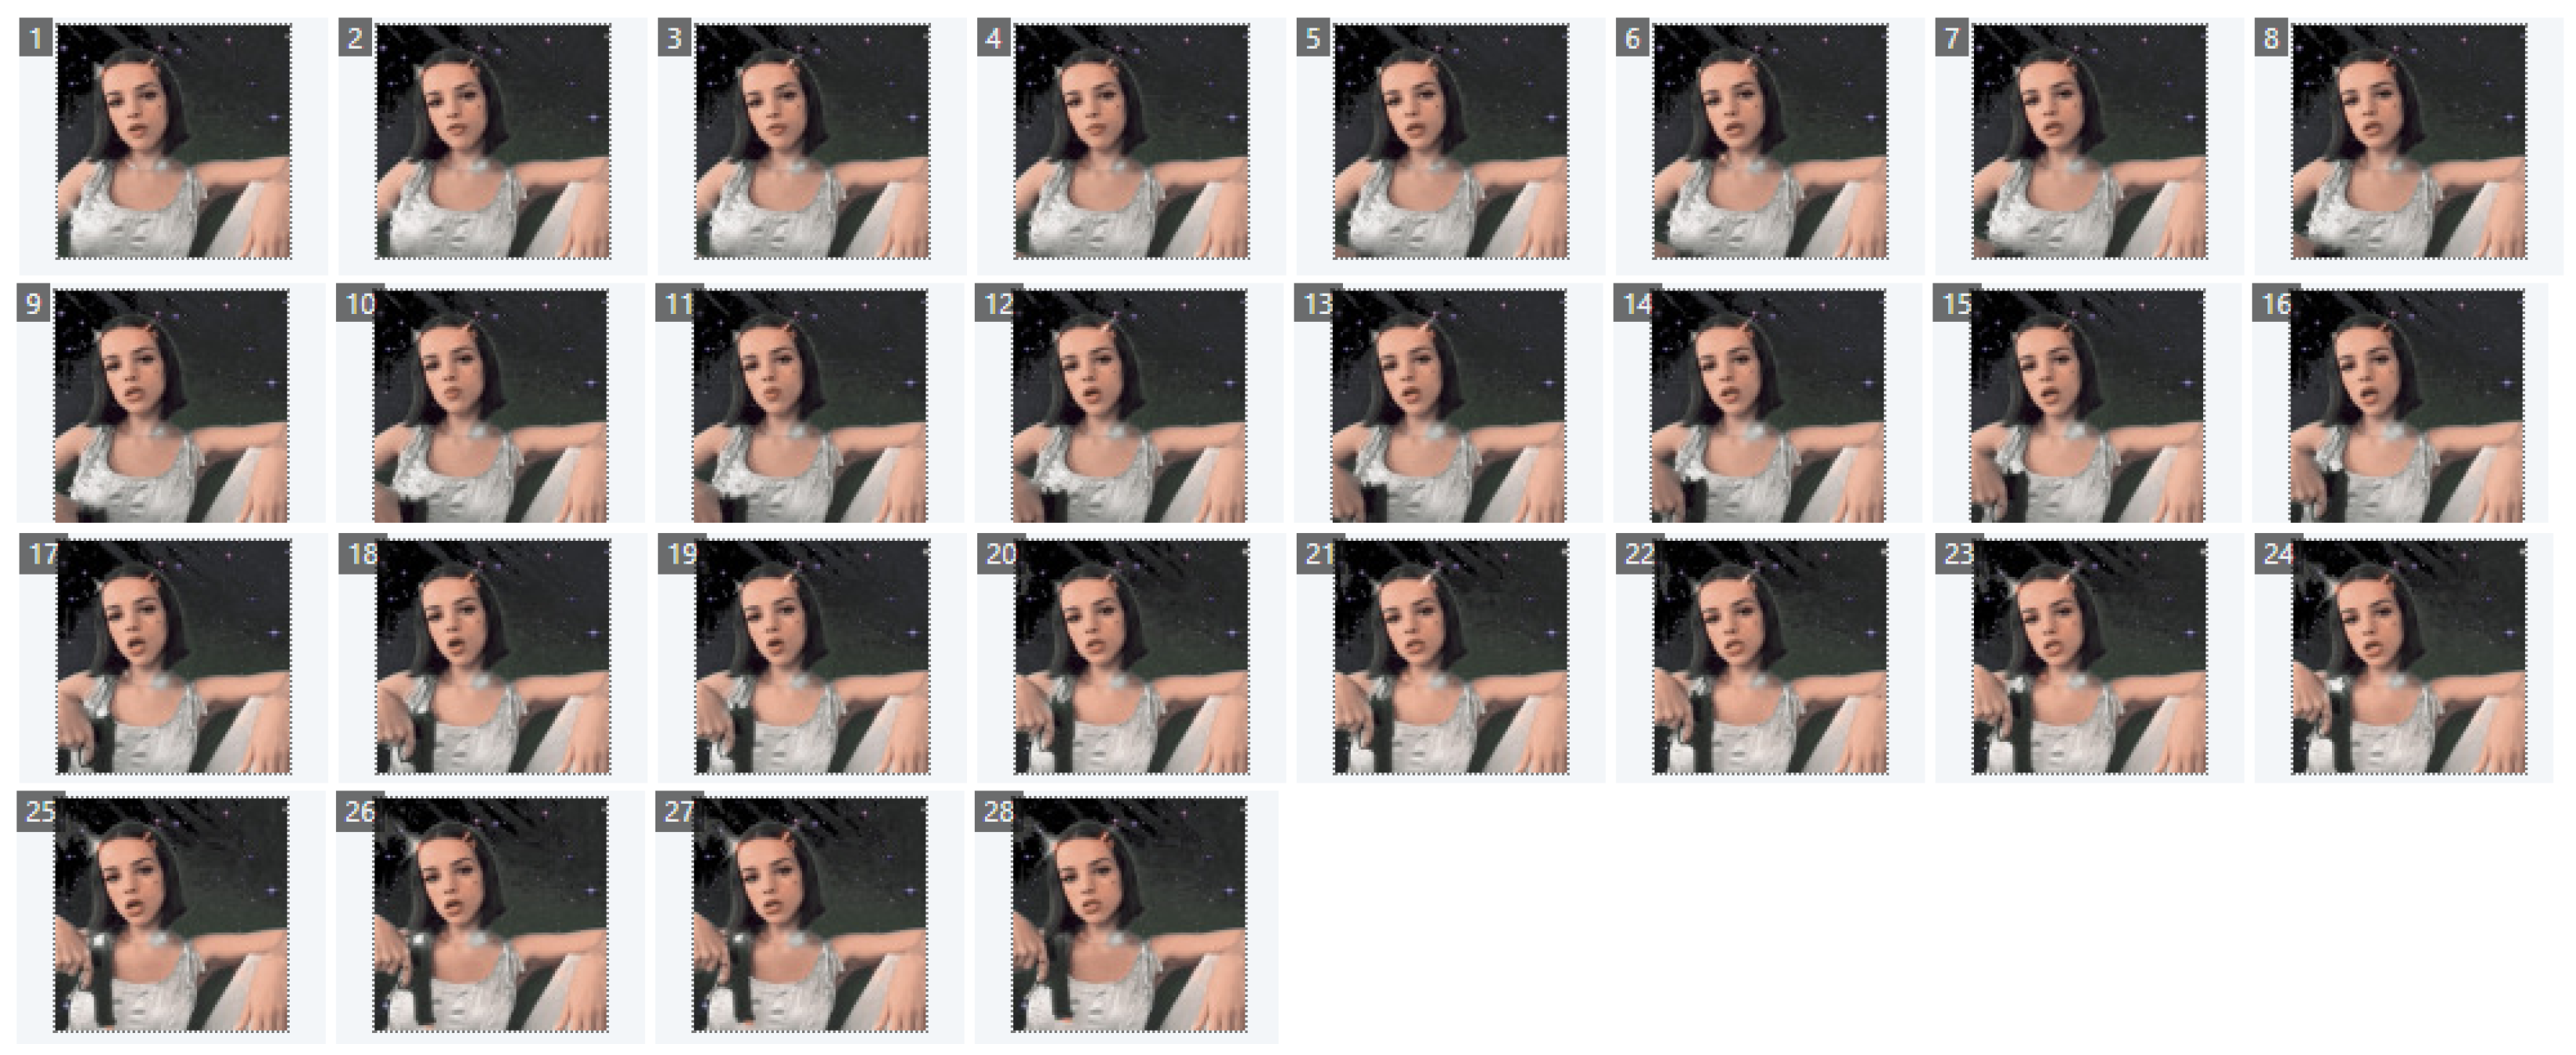
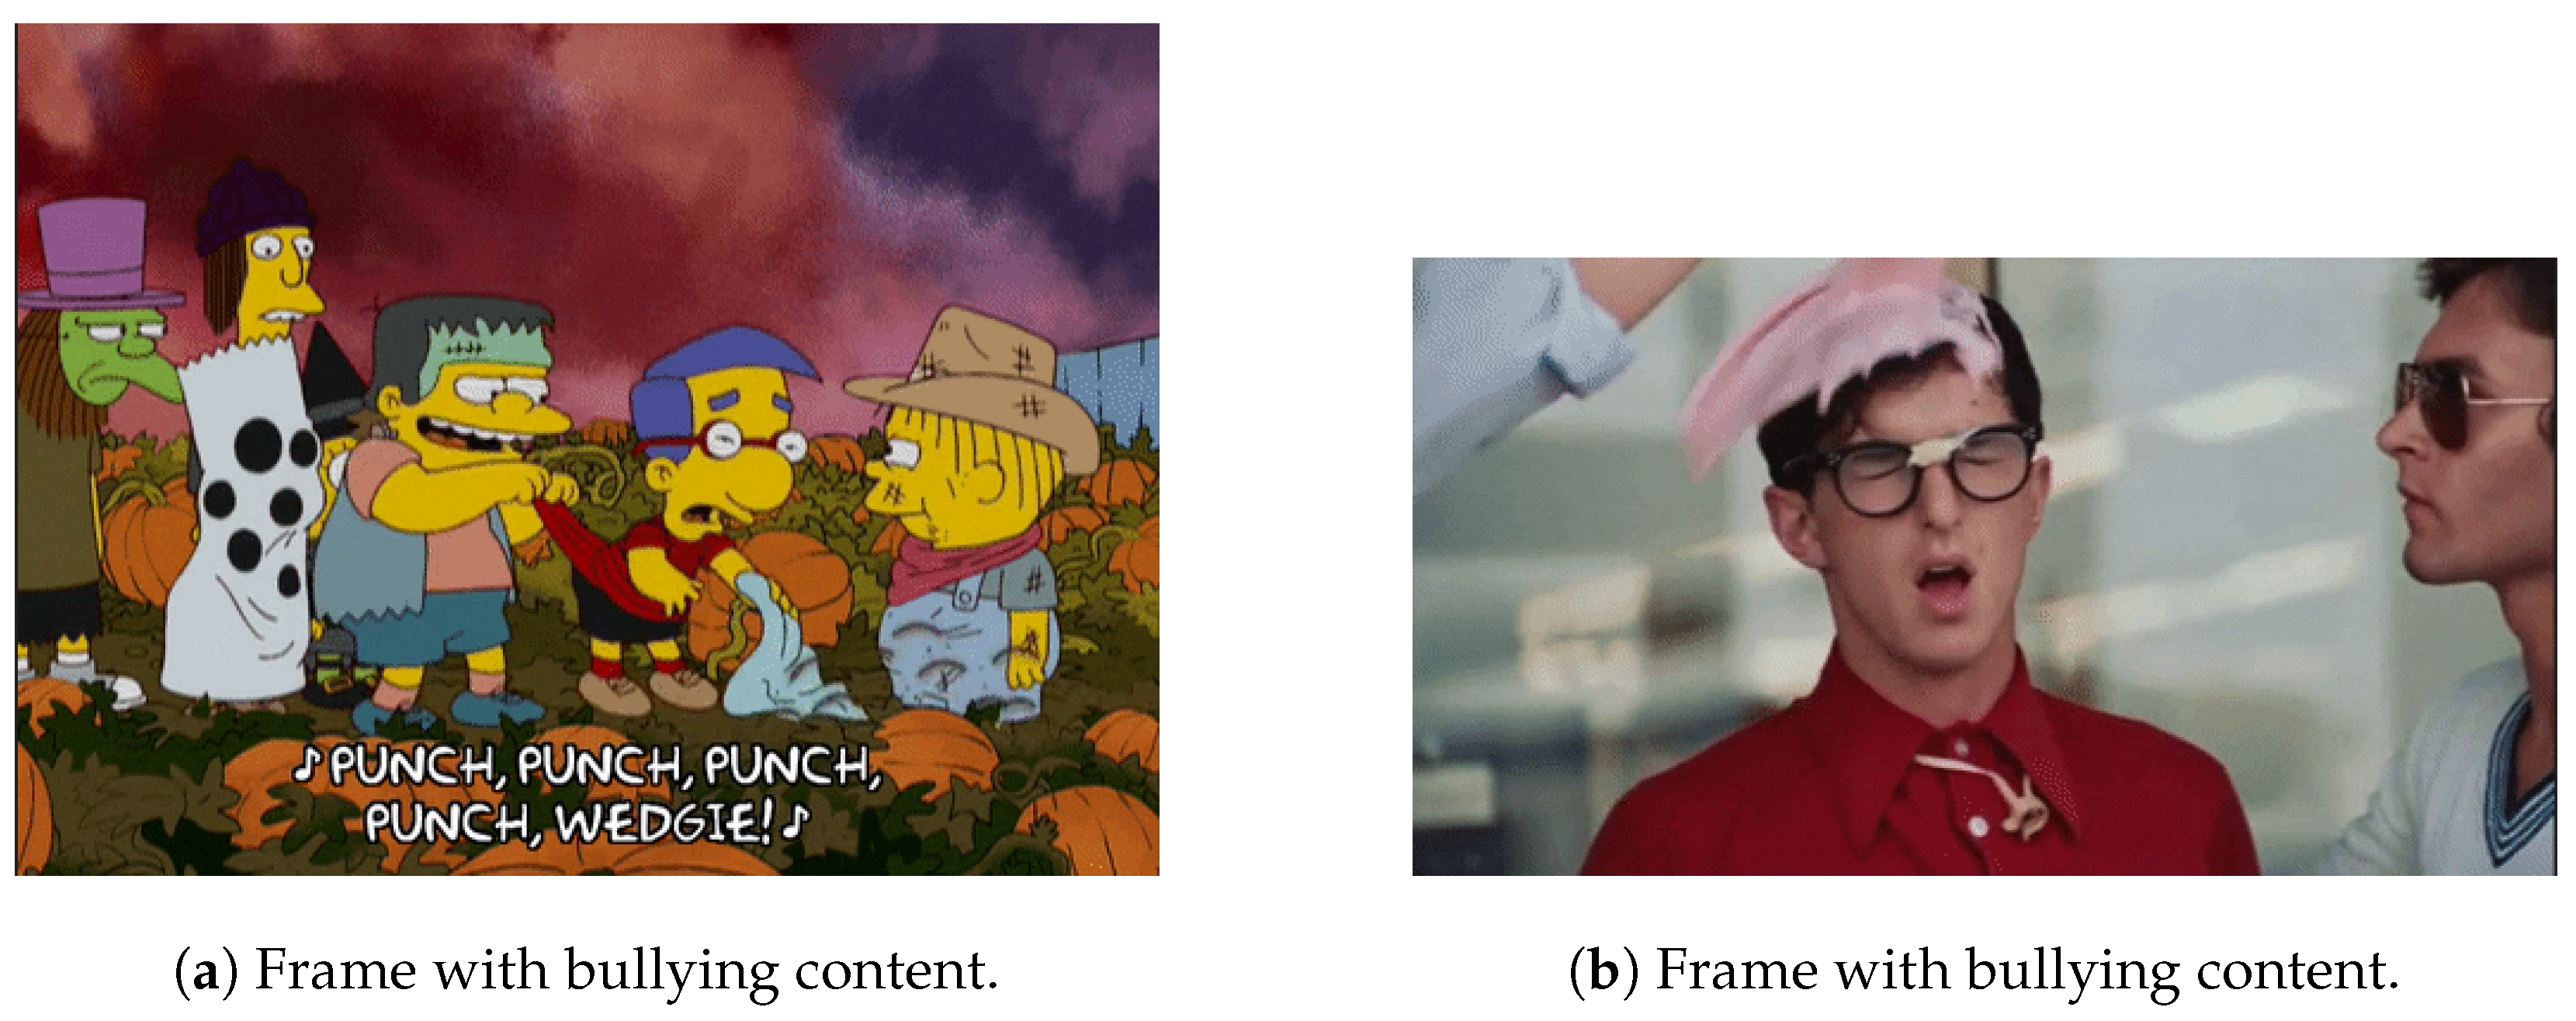
3.1. Data Collection and Processing

To create our dataset, we first used the UCF101 dataset (www.crcv.ucf.edu, accessed on 29 July 2024), which is an action recognition set of videos collected from YouTube that has 101 action categories. Given the resource constraints (i.e., storage, processing, memory), we have taken videos just from the following categories: Handstand Pushups, Pull Ups, Rowing, and Kayaking. We have combined the Handstand Pushups and Pull Ups categories under Bodybuilding, while the Rowing and Kayaking ones are combined under Water sports. These videos represent normal human activities, and they can be categorized as non-bullying materials.
As regards the bullying media files, we have used the GIPHY Scraper from Scrapera (https://github.com/DarshanDeshpande/Scrapera, accessed on 29 July 2024) to obtain GIFs that are associated with bullying activities. This script allowed us to search for GIFs on the Giphy platform (https://giphy.com, accessed on 29 July 2024) by specifying a keyword (or query), such as bullying. In this research, we utilize dynamic GIF files. They are images represented in the form of an animation.
Our dataset comprises 512 media files we collected from the previously mentioned sources: the UCF101 dataset and Giphy. We have used 80% of the data for training and 20% for testing. Table 2, Table 3 and Table 4 describe the number of files in each class used for training and testing for all RNN models.
The labeling for the non-bullying media files was automatic since they were taken from the UCF101 dataset, which contains already-labeled videos for various human actions. The labeling for the bullying media files was manually performed by the authors of this paper and an outside expert. Each video was analyzed by every author, who gave a certain label: either bullying or one of the non-bullying categories. In the end, the greatest number of votes for a label of a certain category decided the final label.
Figure 1 shows a non-bullying GIF file that has been removed from the dataset after four people voted that it is non-bullying, and just one person considered it bullying.
As far as we know, there are no publicly available datasets for the highlighted problem. Therefore, we had to create one that we utilized to train and evaluate the model we proposed. As some of the obtained GIF files did not truly depict bullying behavior, we had to manually filter them out and select just the appropriate ones. Some examples of such files with anti-bullying content are presented in Figure 2. Some examples of GIF files with bullying content are presented in Figure 3.
Table 5 and Table 6 present dataset details.

3.2. Overview of Proposed Approach

The proposed hybrid architecture learns the GIFs’ representation to classify them into one of the following categories: bullying and non-bullying. Below, we discuss the architecture’s main components, and then, we present how it works.

3.2.1. Input Preparation

The proposed system takes GIFs as input. After reading each media file, we extract the frames and insert them in a tensor of three dimensions. Since the number of frames may vary from video to video, we employ the following method as a baseline:
  • Read the video frames.
  • Take the frames from the video until the maximum number of frames is reached.
  • If the number of frames in the video is less than the maximum frame count, then the video is padded with frames filled with zeros.
We set the maximum frame count to 20. In our approach to bullying detection, we considered the action represented in a GIF file. This action can be categorized as bullying or non-bulling. To analyze and determine the action type in each video, we used 20 consecutive frames, considering that most of our files have 30 frames/s. Therefore, twenty consecutive frames are analyzed in about 0.667 s. Here, a trade-off must be ensured between the number of frames explored by the algorithm and the total training time of the model. Using the empirical method of trial and error, we concluded that a value of 20 frames gives very good results, as we present in Section 4 as performance metrics. The training time was not extremely long. The more frames are analyzed from a GIF, the better the model will identify the action that is represented. Figure 4 shows a cyberbullying GIF decomposed into frames.
Before loading the train/test data into the model, we first build a feature extractor based on DenseNet-121 (www.tensorflow.org, accessed on 29 July 2024), and it was trained on the Imagenet dataset. Concerning the feature extractor, we apply global average pooling to the output of the last convolutional block. As video frames represent the input of the model, their width and height are resized to 169 pixels, and then, they are inserted into a matrix of 169 × 169 × 3 size, where 3 represents the number of channels in a color image.
As neural networks understand numbers, we convert the labels of the videos from string format to numerical representation. To do that, we use StringLookup, a preprocessing layer from TensorFlow that maps string features to integer indices. To read the frames from videos, we used the OpenCV’s VideoCapture() method (docs.opencv.org, accessed on 29 July 2024).
In the proposed architecture, the CNN is responsible for the feature extraction process for the input media files, while the RNN models are used for classification. The CNN is based on DenseNet-121.

3.2.2. The Convolutional Neural Network

Convolutional Neural Networks have evolved very much in a relatively short period. The first step in AI was taken by Frank Rosenblatt with a neural network that had only one layer, the Perceptron, in 1958. Then, in the 1980s, the idea appeared of hidden layers between the input layer and the output layer in the architecture of the Multilayer Perceptron. In 1998, a new big step was taken in the evolution of AI by Yann LeCun, who introduced the LeNet5 model, which can recognize handwritten digits. Moving into the 21st century, progress has been established by further complicated models, like AlexNet, VGGNet, ResNet, and in 2017, DenseNet121. The last model, the one that we used in our experiments, was proposed by Gao Huang et al., and it is composed of two major structures:
  • Dense Block;
  • Transition Block.
The architecture of DenseNet121 uses four Dense Blocks and three transition layers between the Dense Blocks. One of the main problems that arises when the CNN becomes too deep and has many hidden layers is the vanishing gradient. This phenomenon appears at the first layers of the network when the gradient that makes the corrections to the weights becomes too small. These small gradients lead to a poor rate of convergence and a problem with the training process, which becomes extremely slow, or in the worst-case scenario, it can even stop by entering a suboptimal solution, a local minimum of the loss function. To solve this issue, the authors of DenseNet propose the idea of dense connectivity, which means that each layer in a Dense Block should be connected to all of the layers that follow it. To implement this architecture, the input of any layer in the block is concatenated with the output of the layer, an approach that comes with the restriction of maintaining the same dimensions of the feature maps between all the layers of the Dense Block. To manage the increasing size of feature maps generated by a Dense Block, the Transition Block was implemented, which is composed of two major elements:
  • a 1 × 1 convolution layer which reduces the number of feature maps (the depth);
  • a pooling layer that downsamples the dimension of each feature map by half.
In our model of bullying detection, we used DenseNet121, which was trained on the large visual database Imagenet. This database contains over 14 million images from over 20,000 classes. The weights obtained by training on this database were frozen in the training process of our three CNN-RNN models to save time and computational resources.

3.2.3. The Recurrent Neural Networks

RNNs represent a type of neural network where the output of the previous layer is the input for the current one. As in traditional neural networks, the input and output values are independent of each other; in the case of RNNs, there is a relationship between them. The most important component in RNNs is the hidden state. It knows information about a sequence such as the input of the previous layer. In an RNN, the input parameters are the same for all layers since the same tasks are performed on all inputs.
RNNs are made of neurons. They work together to accomplish an established task. RNNs have input, output, and hidden layers. The input layer receives the information, while the output one generates the result. The hidden layers are responsible for data processing, analysis, and prediction.
RNNs have, for each time step, an activation function unit. Every unit has a hidden state that keeps information about the state of the network from the past until that specific time step. The mathematical formula for computing the current state is defined below:
h i d d e n _ s t a t e t = f ( h i d d e n _ s t a t e t 1 , i n p u t t )
  • h i d d e n _ s t a t e t represents the current state of the network;
  • h i d d e n _ s t a t e t 1 represents the previous state of the network;
  • i n p u t t represents the input of the current state.
Table 7 presents the hyper-parameters of the RNNs we used.

3.2.4. System General Architecture

Figure 5 presents the general architecture of the system.
First of all, a feature extractor is built to obtain the characteristics from each frame of a video. It is based on a DenseNet-121 network. Second of all, each video file in the dataset is decomposed into frames that pass through the feature extractor so that their characteristics are obtained. These are stored in a matrix of 1024 columns and 20 rows. The first dimension, 1024, represents the number of features it uses, while the other size, 20, represents the number of frames it takes from each video. This matrix represents the input to the first RNN model that was trained on the entire dataset, which comprises videos from the bullying, Water sports, and Bodybuilding categories. If the highest probability is P 2 , then the evaluated video file is classified as bullying. Otherwise, if the highest probability is P 1 , then the feature matrix is further used as input for the second RNN model that was trained on the Water sports group. In this case, the output of the model will be an array that contains two probabilities that correspond to the Rowing and Kayaking categories. On the other hand, if the highest probability is P 3 , then the feature matrix is further used as input for the third RNN model that was trained on the Bodybuilding group. For this situation, the output of the model will be an array of two probabilities that correspond to the Handstand Pushups and Pull Ups.

4. Experimental Results and Analysis

In this section, we discuss the obtained results while classifying media files as bullying or non-bullying. Our proposed system consists of a CNN and three RNNs. It takes as input a GIF file, processes it, extracts the features, and classifies it. Our dataset contains 100 files belonging to the bullying category, and 412 that are part of the non-bullying one. A total of 80% of the dataset is used for training, while 20% is used for testing purposes. For each RNN model, we have used a dropout layer of 0.4 between the second GRU layer and the first Dense layer to prevent overfitting. An alternative for the dropout layer would be the training of more neural networks that have different architectures such that the final result is a weighted average of all predictions of the analyzed neural networks. However, this approach is much more costly as regards the execution time and the computational power. The dropout layer simulates the training of more neural networks without having the previously mentioned disadvantages that the other approach would have.

4.1. Experimental Setup

The code of our proposed solution for bullying detection in GIFs using a deep learning approach is based on the following implementation from GitHub (https://github.com/keras-team/keras-io, accessed on 29 July 2024). We came up with the following contributions and improvements to the code:
  • We have implemented a functionality at the beginning of the program that randomly chooses files from the dataset and puts 80% of them in the directory used for training and 20% of them in the folder used for testing.
  • We have used three RNNs instead of one, as the author used. In our scenario, the first RNN is used for classifying a media file into Water sports, Bodybuilding, and bullying categories. If the file belongs to the Water sports category, then the second RNN is utilized to further classify it into Rowing or Kayaking. If the file belongs to the Bodybuilding category, then the third RNN is employed to further classify it into Handstand Pushups or Pull Ups.
  • We have decreased the number of pixels from the side of a square that is cropped from the frames of the video. The variable is called IMG_SIZE, and we reduced it from 224 to 169.
  • We have used more epochs. Initially, there were 10, but we increased the number to 50.
The source code of our solution and other related files can be found on our GitHub repository (https://github.com/Razvan96/GIFs_Bullying_detection/tree/master, accessed on 29 July 2024). To be reproduced, the project can be downloaded from that URL, which redirects to the master branch. All the necessary files for reproducing the project are there. The project from GitHub contains both the source code of the Python scripts (e.g., for classification, the confusion matrix) and the dataset with the media files (i.e., GIF files for the bullying class and video files for the non-bullying classes).
The pseudocode of our solution is displayed in Algorithm 1. In the beginning, there are declared variables that refer to the number of frames from a GIF that are analyzed, the number of features from a GIF that are processed by the CNN model, and the size of a square side that is cropped from each video frame. Then, the feature extractor function is initialized with the DensetNet121 model. Each video is loaded, and its frames are extracted, cropped, and sent to the future extraction process. Afterward, the three RNN models are generated, and these are finally used for video classification.
Algorithm 1 The pseudocode of our solution.
  • M A X _ S E Q _ L E N G T H 20
  • N U M _ F E A T U R E S 1024
  • I M G _ S I Z E 169
  • f e a t u r e E x t r a c t o r D e n s e N e t 121 ( )
  • t r a i n D a t a [ ] [ ]          ▹ initialize an empty array of lists for the RNN models
  • t r a i n L a b e l s [ ] [ ]          ▹ initialize an empty array of lists for the RNN models
  • for each  v i d e o P a t h v i d e o P a t h s  do▹ iterate through the video paths that are specific to each RNN model
  •      v i d e o l o a d V i d e o ( v i d e o P a t h )
  •      t r a i n L a b e l s [ v i d e o P a t h . i n d e x ] . a p p e n d ( e x t r a c t N a m e ( v i d e o P a t h ) )
  •      f r a m e s [ ]                   ▹ initialize empty lists
  •      v i d e o F e a t u r e s [ ]           ▹ initialize empty lists
  •     for each  f r a m e v i d e o  do
  •          f r a m e s . a p p e n d ( c r o p C e n t e r I m a g e ( I M G _ S I Z E , I M G _ S I Z E ) )
  •         if  l e n g t h ( f r a m e s ) = = M A X _ S E Q _ L E N G T H  then
  •             b r e a k
  •         end if
  •     end for
  •     if  l e n g t h ( f r a m e s ) < M A X _ S E Q _ L E N G T H  then
  •          f r a m e s . c o n c a t e n a t e ( b l a c k F r a m e , M A X _ S E Q _ L E N G T H l e n g t h ( f r a m e s ) )
  •     end if
  •     for each  f r a m e f r a m e s  do
  •          v i d e o F e a t u r e s . a p p e n d ( f e a t u r e E x t r a c t o r ( f r a m e ) )
  •     end for
  •      t r a i n D a t a [ v i d e o P a t h . i n d e x ] . a p p e n d ( v i d e o F e a t u r e s )
  • end for
  • R N N _ m o d e l _ 1 = G R U ( M A X _ S E Q _ L E N G T H , N U M _ F E A T U R E S )
  • R N N _ m o d e l _ 1 . f i t ( t r a i n D a t a [ 0 ] , t r a i n L a b e l s [ 0 ] )     ▹ Generate the RNN model for the bullying, Water sports, and Bodybuilding classes
  • R N N _ m o d e l _ 2 = G R U ( M A X _ S E Q _ L E N G T H , N U M _ F E A T U R E S )
  • R N N _ m o d e l _ 2 . f i t ( t r a i n D a t a [ 1 ] , t r a i n L a b e l s [ 1 ] )     ▹ Generate the RNN model for the Water sports class
  • R N N _ m o d e l _ 3 = G R U ( M A X _ S E Q _ L E N G T H , N U M _ F E A T U R E S )
  • R N N _ m o d e l _ 3 . f i t ( t r a i n D a t a [ 2 ] , t r a i n L a b e l s [ 2 ] )     ▹ Generate the RNN model for the Bodybuilding class
  • if  R N N _ m o d e l _ 1 . p r e d i c t = = b u l l y i n g   then
  •      R N N _ m o d e l _ 1 . p r i n t P r o b a b i l i t i e s ( )   ▹ Print probability values for bullying, Water sports, and Bodybuilding classes
  • else if  R N N _ m o d e l _ 1 . p r e d i c t = = W a t e r s p o r t s  then
  •      R N N _ m o d e l _ 2 . p r i n t P r o b a b i l i t i e s ( )   ▹ Print probability values for the Water sports class
  • else if  R N N _ m o d e l _ 1 . p r e d i c t = = B o d y b u i l d i n g   then
  •      R N N _ m o d e l _ 3 . p r i n t P r o b a b i l i t i e s ( )   ▹ Print probability values for the Bodybuilding class
  • end if
For the experimental setup, we use a virtual machine having the specifications described in Table 8. On the Windows virtual machine, we install PyCharm IDE [48]. There, we developed our system based on deep learning models. We used TensorFlow and Keras, as other authors utilize in their implementations [48]. The former is a platform that helps create and run different machine learning models. The latter is used in implementing neural networks. To capture the frames of a video, we used the VideoCapture() method from OpenCV.

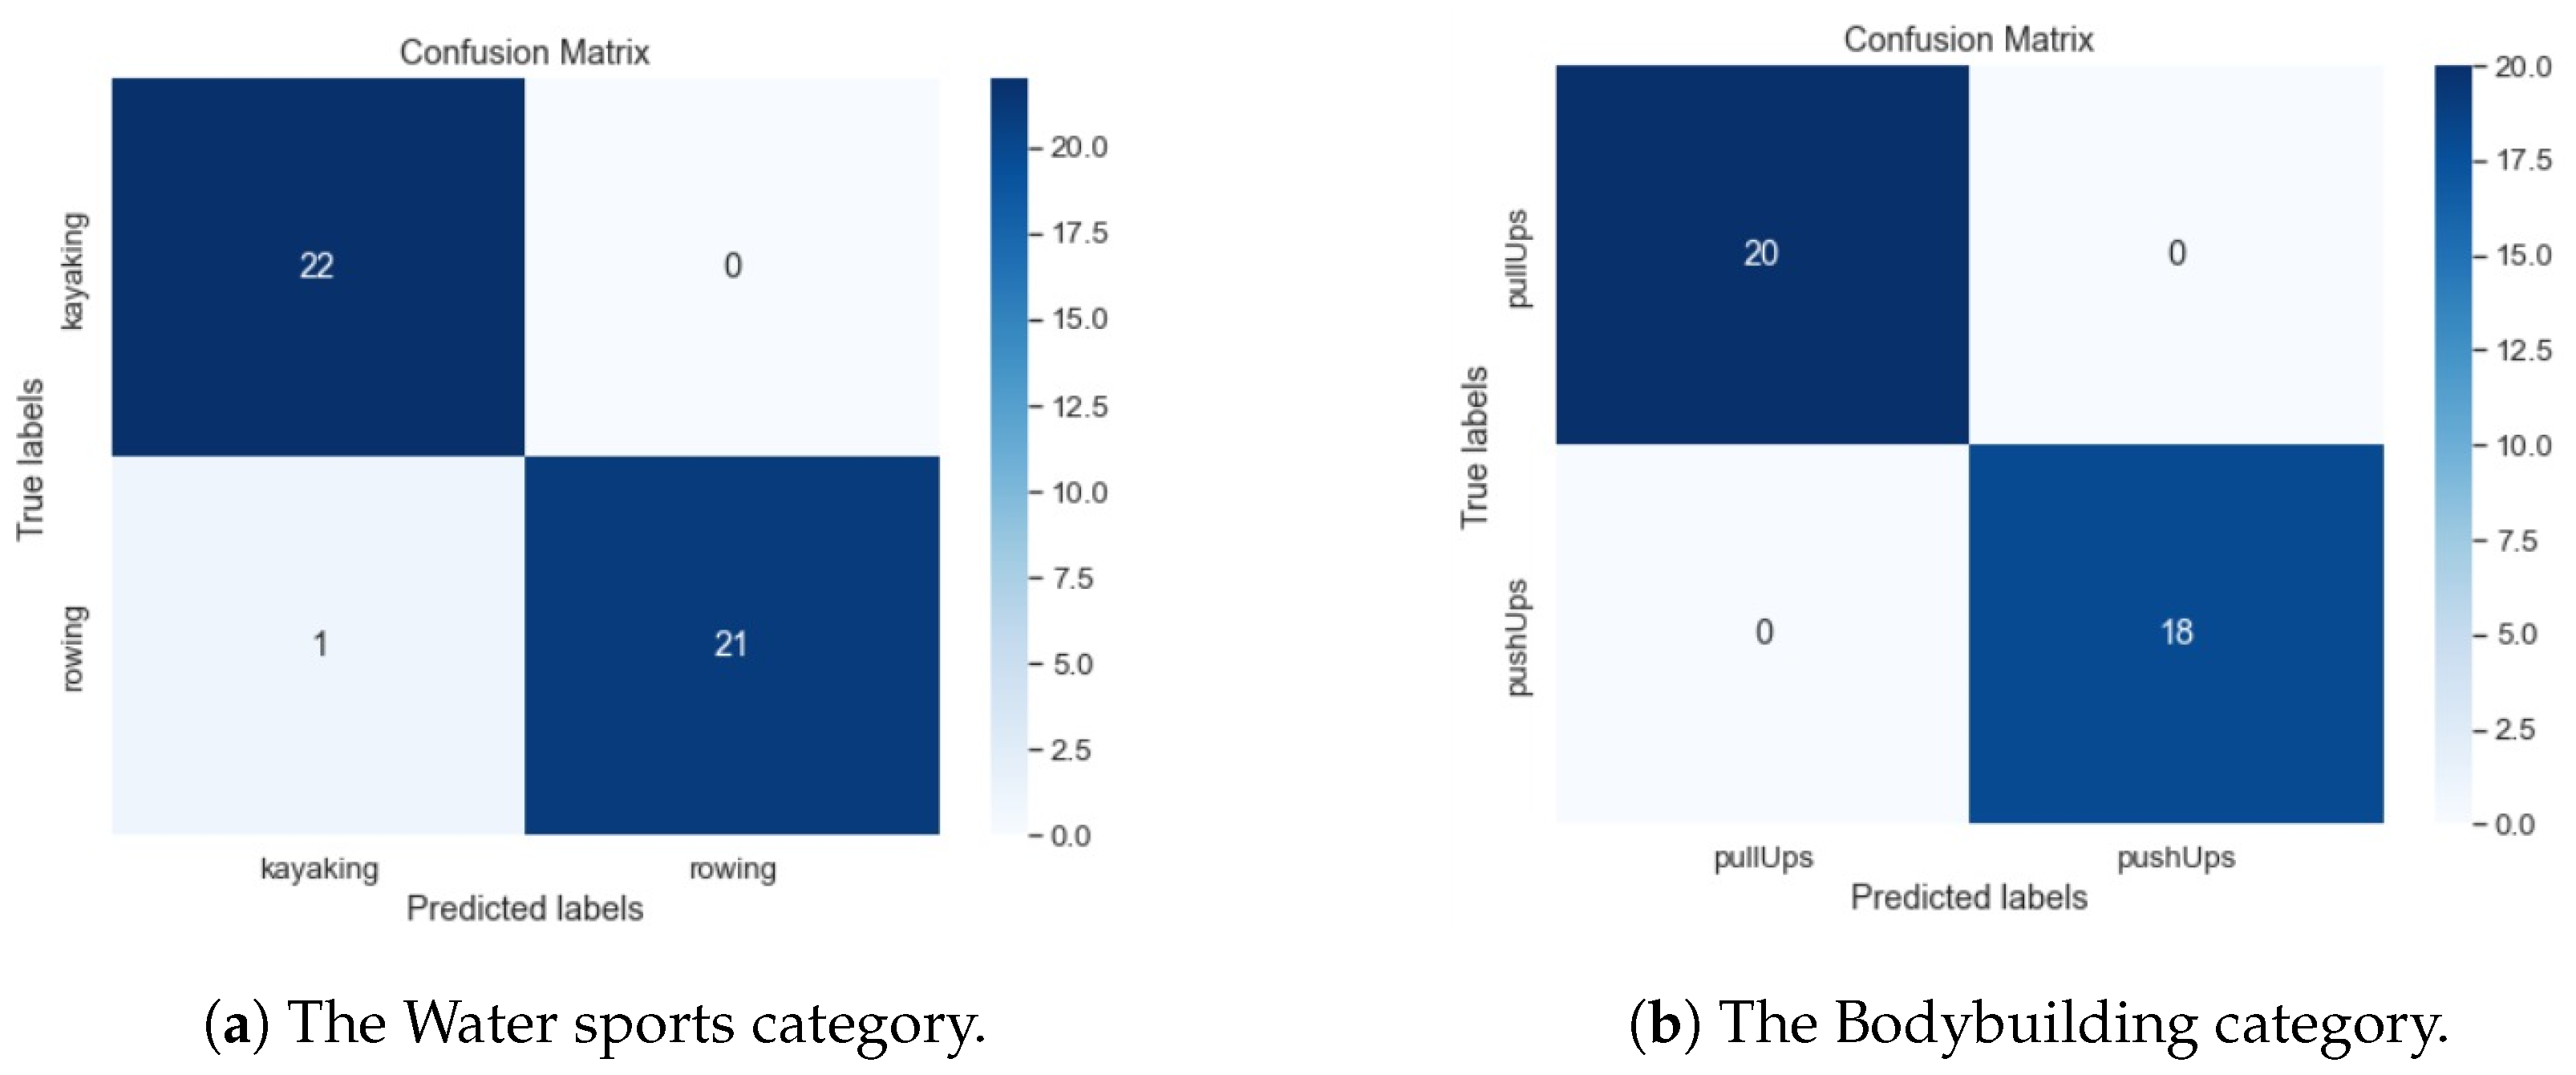
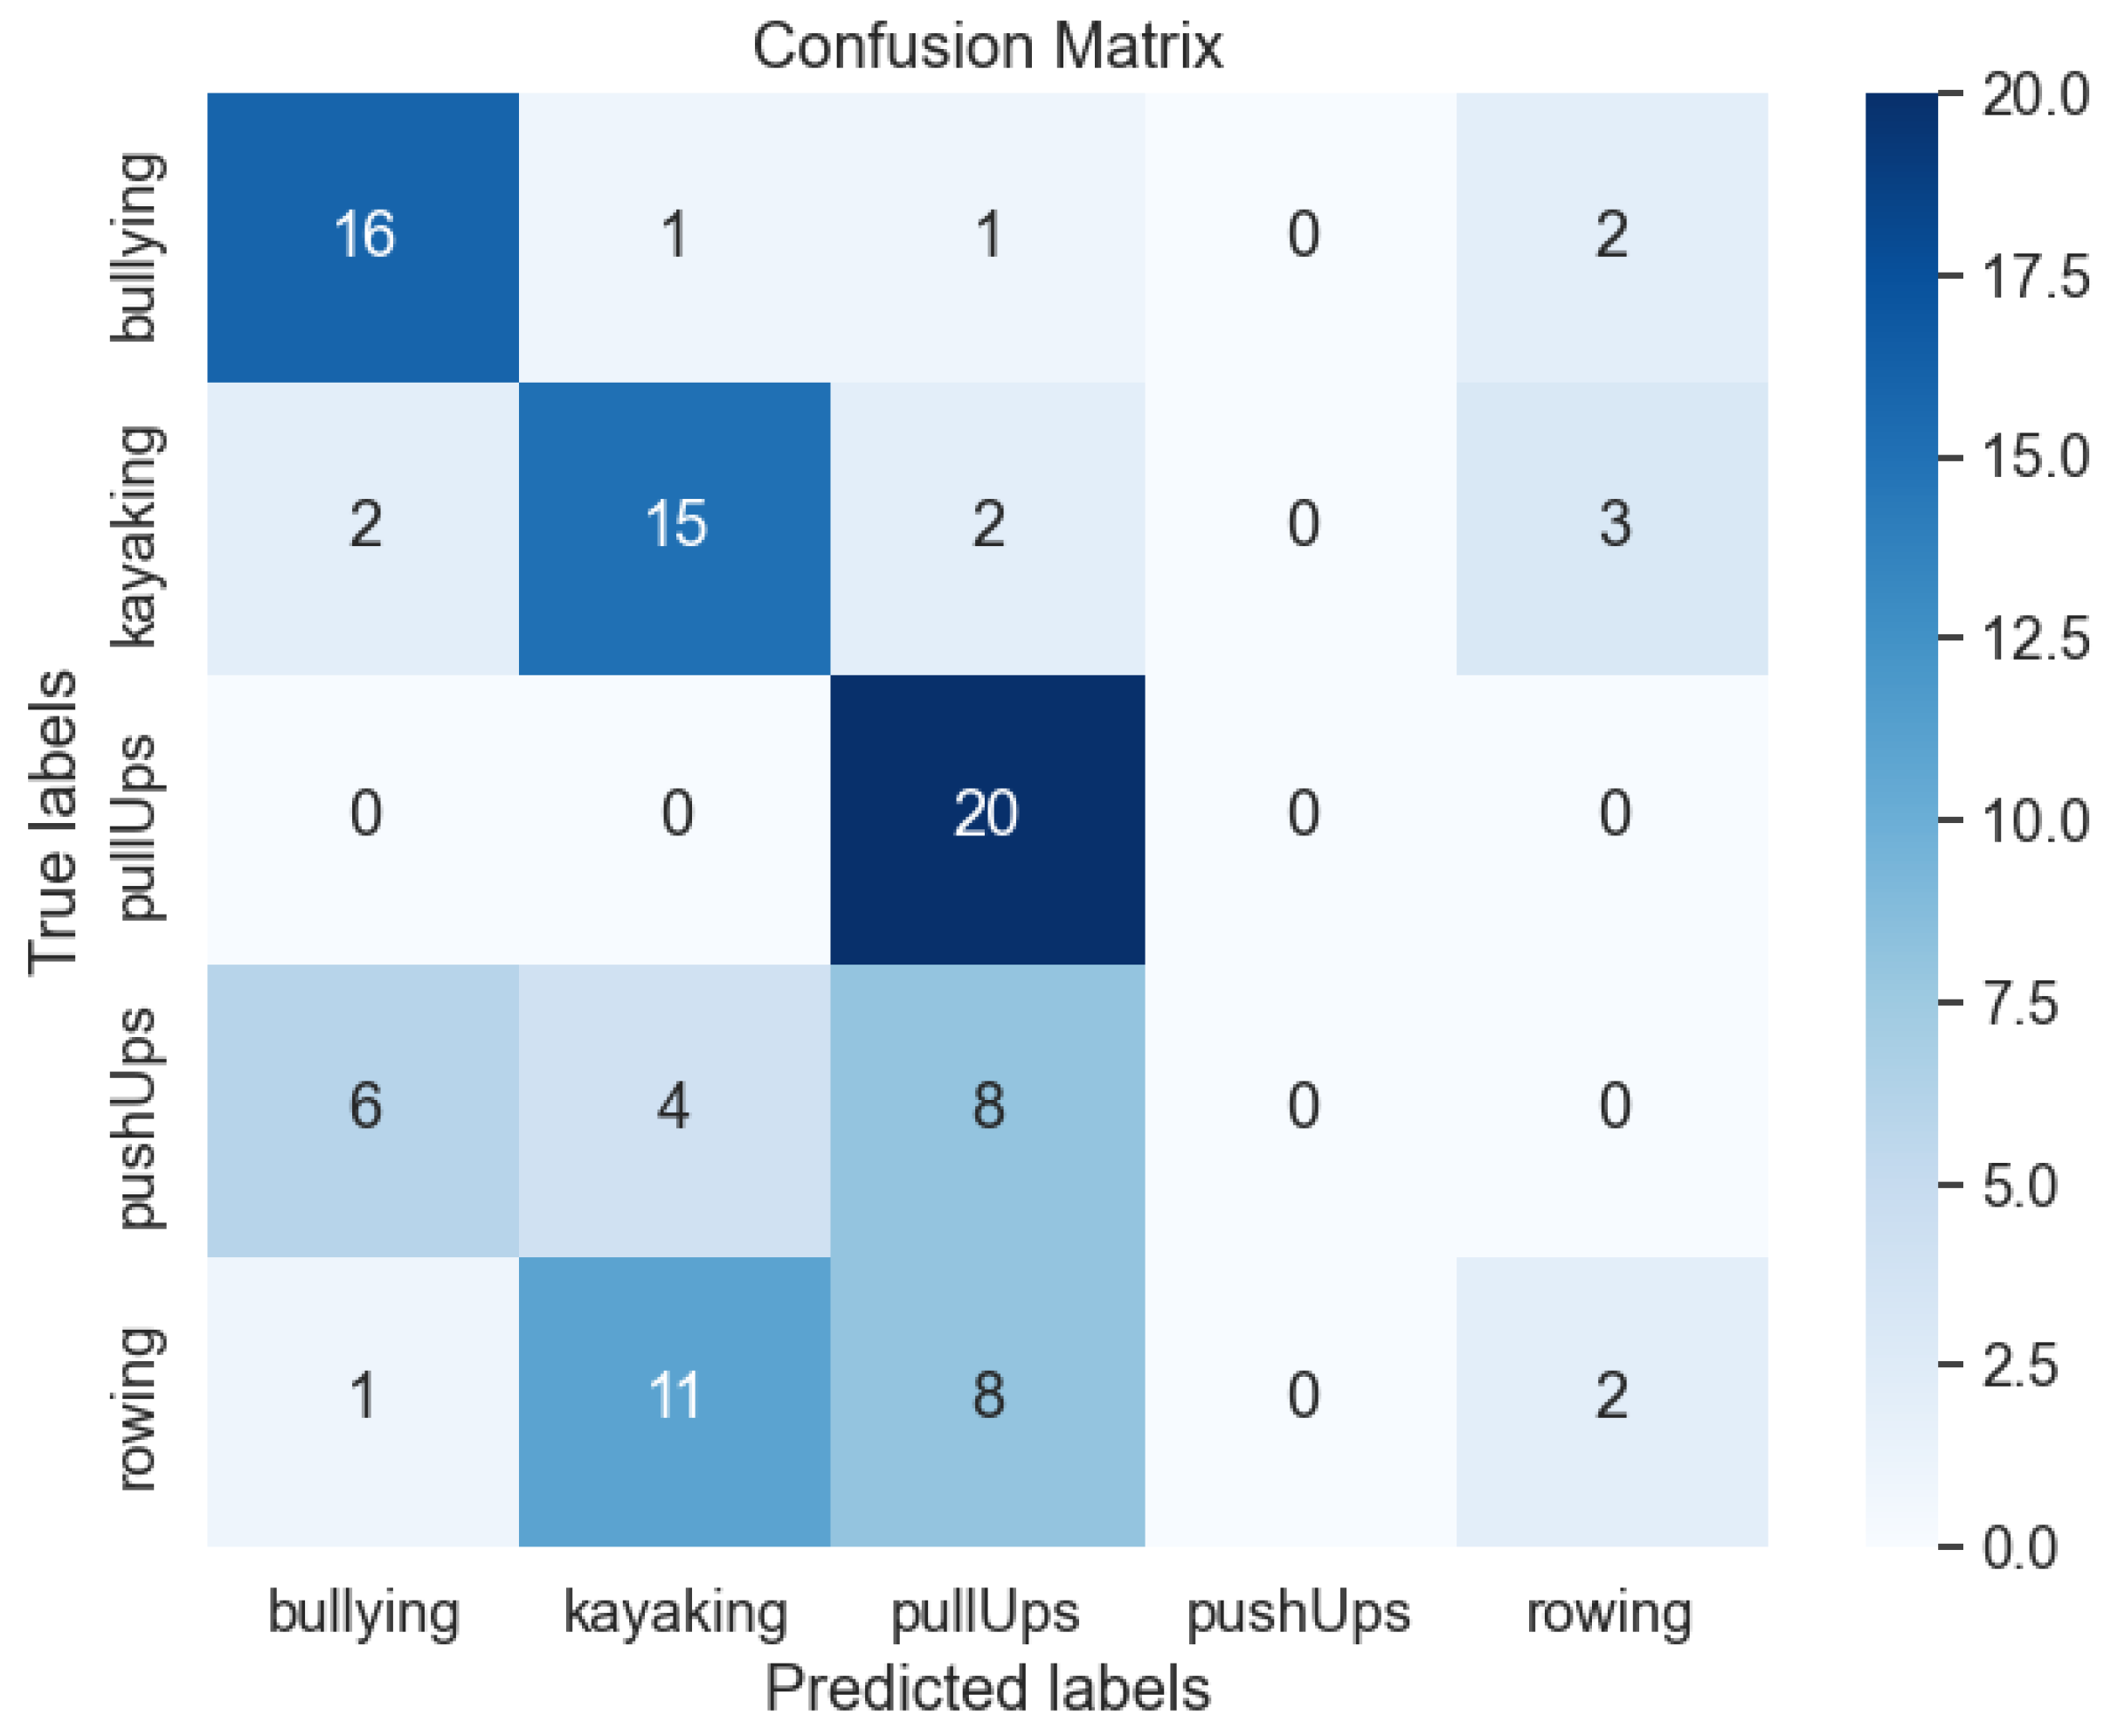
4.2. Classification Results

We proposed a system for bullying detection in GIFs using a deep learning-based approach. Our solution uses a hybrid architecture that is made of a CNN and three Recurrent Neural Networks (RNNs). The first RNN model classifies the GIF into one of the following categories: Water sports, Bodybuilding, and bullying. If it belongs to the first category, then the second RNN model is considered, which further classifies the GIF into Rowing or Kayaking. If the GIF is part of the second category, then the third RNN model is run, which classifies the GIF into Handstand Pushups or Pull Ups. If the GIF is classified as bullying, the program ends.
We compared the proposed solution, which has one CNN and three RNN models, with the one that has one CNN and one RNN model. Table 9 highlights how the solution we designed is much more efficient than the other we compared with, in terms of different performance metrics. In the table, we assigned the name of each category to a symbol, as follows: Bullying to (B), Bodybuilding to (BB), Water sports to (WS), Kayaking to (K), Rowing to (R), Pull Ups to (Pull), and Handstand Pushups to (Push). Moreover, in the table, first there are the performance metrics for the three proposed RNN models (i.e., Proposed RNN model no. 1, Proposed RNN model no. 2, Proposed RNN model no. 3), and finally, the results for the model that uses one single RNN model (i.e., Simple RNN) are described. The architecture that employs one CNN and one RNN model has the following five classes: Bullying, Kayaking, Rowing, Pull Ups, and Handstand Pushups.
Table 10 presents the obtained results when a test video was classified as belonging to the Pull Ups category. Here, we used the proposed architecture that employs one CNN and three RNN models.
Another way of evaluating the performance of our system is by using confusion matrices. Figure 6 displays the confusion matrix for the entire system where all classification categories are implied. We can observe from there that just one video was wrongly classified. It was of type Bodybuilding, but the system classified it as belonging to the bullying category.
Figure 7a displays the confusion matrix for the Water sports category. We can observe that just one video was wrongly classified. It was of the Rowing type, but the system classified it as being Kayaking. Figure 7b displays the confusion matrix for the Bodybuilding category. We can observe that all of the videos were correctly classified.
Figure 8 displays the confusion matrix for the architecture that uses just one RNN model.

5. Limitations

In our research for bullying detection, the proposed architecture does not consider multimodal techniques, relying only on the processing of GIF images. Aspects such as text and sound are not taken into account, thus resulting in a loss of multimedia information.
The architecture we designed represents a proof of concept for the proposed solution. In the real world, there are many more classes than the ones we considered in this research. Our bullying class is heterogeneous in comparison with the other two classes of model one (i.e., WaterSports and Bodybuilding). Thus, we can suppose that various GIF files belonging to other categories that were not considered in this study have a greater chance of being classified as bullying.
For instance, we tested our proposed solution against a GIF file containing a dog that jumps. As our dataset does not have a class related to jumping, the model has not been trained on GIF files that contain this action. Moreover, our dataset for bullying is very heterogeneous in comparison with the other classes where the files are similar to the others. Taking all of these into account, our solution classified the GIF as bullying.
Figure 9 displays a test of the proposed solution against a GIF file related to jumping. The classification results are described in Table 11.

6. Conclusions and Future Work

In this paper, we propose a novel bullying detection solution for GIFs using a deep learning approach. To our knowledge, at the time of writing, there is no other solution in the literature that detects bullying content in GIFs. The main contributions of this research can be summarized as follows.
Firstly, we create a dataset of bullying GIFs. With the help of a web scraping tool, we took GIFs related to bullying from the GIPHY platform and filtered them until the most relevant ones remained. Secondly, we create a system with a hybrid approach. The accuracy of the proposed system is 99%. It can classify GIFs into bullying, Bodybuilding, and Water sports. Moreover, our solution can further classify the files of the last two categories. The former can be further classified into Pull Ups or Handstand Pushups, while the latter can be classified into Rowing or Kayaking.
We can conclude that our solution is one step forward in the research and development of security systems, especially for the mitigation of bullying attacks via GIFs. Our design outperforms the majority of classical video classification systems by using a hybrid architecture.
Possible use cases that might benefit from our proposal include the detection of online bullying or harassment in public or private environments, such as universities, hospitals, hotels, or corporate buildings. Our proposal adds value to Internet users by providing advanced capabilities for bullying detection in GIFs.
In terms of future work, we intend to extend the dataset with both a higher number of classes and more GIF files for each of them. We also propose to elaborate a clustering algorithm that can split the dataset into a specific number of classes based on the similarity degree of videos. Further, we intend to develop an architecture that quantifies the impact of both the sound and text of the video in the bullying identification tasks.

Author Contributions

Conceptualization, R.S. and F.P.; methodology, R.S. and F.P.; software, R.S. and A.N.; validation, R.S., A.N. and F.P.; formal analysis, F.P. and A.M.A.; investigation, R.S.; resources, R.S.; data curation, A.N.; writing—original draft preparation, R.S., A.N. and A.M.A.; writing—review and editing, R.S. and F.P.; visualization, R.S.; supervision, F.P.; project administration, F.P.; funding acquisition, F.P. All authors have read and agreed to the published version of the manuscript.

Funding

This research received no funding.

Institutional Review Board Statement

Not applicable.

Informed Consent Statement

Not applicable.

Data Availability Statement

The original contributions presented in the study are included in the article, further inquiries can be directed to the corresponding author.

Acknowledgments

The work presented in this paper was supported by the Core Program within the National Research Development and Innovation Plan 2022–2027, financed by Ministry of Research, Innovation and Digitalization of Romania, project no 23380601. This work is partially supported by the Research Grant no. 94/11.10.2023 Modern Distributed Platform for Educational Applications in Cloud Edge Continuum Environments GNAC-ARUT-2023. We would also like to thank the reviewers for their time and expertise, constructive comments, and valuable insight.

Conflicts of Interest

The authors declare no conflicts of interest.

Abbreviations

The following abbreviations are used in this manuscript:
BPSOBinary Particle Swarm Optimization
CNNConvolutional Neural Network
CNN-RNNConvolutional Neural Network–Recurrent Neural Network
GIFGraphics Interchange 67 Format
LIWCLinguistic Inquiry and Word Count
MLMachine Learning
RNNRecurrent Neural Network
SVMSupport Vector Machine
TF-IDFTerm Frequency–Inverse Document Frequency

References

  1. Cassidy, W.; Jackson, M.; Brown, K.N. Sticks and stones can break my bones, but how can pixels hurt me? Students’ experiences with cyber-bullying. Sch. Psychol. Int. 2009, 30, 383–402. [Google Scholar] [CrossRef]
  2. Blais, J.J.; Craig, W.M.; Pepler, D.; Connolly, J. Adolescents online: The importance of Internet activity choices to salient relationships. J. Youth Adolesc. 2008, 37, 522–536. [Google Scholar] [CrossRef]
  3. Jackson, L.A.; Von Eye, A.; Biocca, F.A.; Barbatsis, G.; Zhao, Y.; Fitzgerald, H.E. Does home internet use influence the academic performance of low-income children? Dev. Psychol. 2006, 42, 429. [Google Scholar] [CrossRef]
  4. Mostfa, A.A.; Yaseen, D.S.; Sharkawy, A.N. A Systematic Review of the Event-Driven Activities in Social Applications. SVU-Int. J. Eng. Sci. Appl. 2023, 4, 225–233. [Google Scholar] [CrossRef]
  5. Li, Q. New bottle but old wine: A research of cyberbullying in schools. Comput. Hum. Behav. 2007, 23, 1777–1791. [Google Scholar] [CrossRef]
  6. Beran, T.; Li, Q. Cyber-harassment: A study of a new method for an old behavior. J. Educ. Comput. Res. 2005, 32, 265. [Google Scholar]
  7. Dehue, F.; Bolman, C.; Völlink, T. Cyberbullying: Youngsters’ experiences and parental perception. CyberPsychol. Behav. 2008, 11, 217–223. [Google Scholar] [CrossRef]
  8. Ybarra, M.L.; Mitchell, K.J. Prevalence and frequency of Internet harassment instigation: Implications for adolescent health. J. Adolesc. Health 2007, 41, 189–195. [Google Scholar] [CrossRef]
  9. Blais, J.; Craig, W. Chatting, Befriending, and Bullying: Adolescent Internet Experiences and Associated Psychosocial Outcomes. Ph.D. Thesis, Department of Psychology, Queen’s University, Kingston, ON, Canada, 2008. [Google Scholar]
  10. Vogels, E.A. Teens and Cyberbullying 2022; Pew Research Center: Washington, DC, USA, 2022. [Google Scholar]
  11. Alhujailli, A.; Karwowski, W.; Wan, T.T.; Hancock, P. Affective and stress consequences of cyberbullying. Symmetry 2020, 12, 1536. [Google Scholar] [CrossRef]
  12. Rao, T.S.; Bansal, D.; Chandran, S. Cyberbullying: A virtual offense with real consequences. Indian J. Psychiatry 2018, 60, 3–5. [Google Scholar]
  13. Dinakar, K.; Jones, B.; Havasi, C.; Lieberman, H.; Picard, R. Common sense reasoning for detection, prevention, and mitigation of cyberbullying. ACM Trans. Interact. Intell. Syst. (TiiS) 2012, 2, 1–30. [Google Scholar] [CrossRef]
  14. Hashmi, M.N.; Kureshi, N. Cyberbullying: Perceptions, Effects and Behaviours among teenagers. J. Strategy Perform. Manag. 2020, 8, 136–141. [Google Scholar]
  15. Scheithauer, H.; Schultze-Krumbholz, A.; Pfetsch, J.; Hess, M. Types of cyberbullying. Wiley Blackwell Handb. Bullying Compr. Int. Rev. Res. Interv. 2021, 1, 120–138. [Google Scholar]
  16. Bauman, S. Types of cyberbullying. In Cyberbullying: What Counselors Need to Know; John Wiley & Sons: Hoboken, NJ, USA, 2015; pp. 53–58. [Google Scholar]
  17. Young, R.; Tully, M. ‘Nobody wants the parents involved’: Social norms in parent and adolescent responses to cyberbullying. J. Youth Stud. 2019, 22, 856–872. [Google Scholar] [CrossRef]
  18. Smith, P.K.; Mahdavi, J.; Carvalho, M.; Fisher, S.; Russell, S.; Tippett, N. Cyberbullying: Its nature and impact in secondary school pupils. J. Child Psychol. Psychiatry 2008, 49, 376–385. [Google Scholar] [CrossRef] [PubMed]
  19. Aboujaoude, E.; Savage, M.W.; Starcevic, V.; Salame, W.O. Cyberbullying: Review of an old problem gone viral. J. Adolesc. Health 2015, 57, 10–18. [Google Scholar] [CrossRef] [PubMed]
  20. Zhu, C.; Huang, S.; Evans, R.; Zhang, W. Cyberbullying among adolescents and children: A comprehensive review of the global situation, risk factors, and preventive measures. Front. Public Health 2021, 9, 634909. [Google Scholar] [CrossRef] [PubMed]
  21. Huang, N.; Zhang, S.; Mu, Y.; Yu, Y.; Riem, M.M.; Guo, J. Does the COVID-19 pandemic increase or decrease the global cyberbullying behaviors? A systematic review and meta-analysis. Trauma Violence Abus. 2024, 25, 1018–1035. [Google Scholar] [CrossRef]
  22. Hinduja, S.; Patchin, J.W. School Climate 2.0: Preventing Cyberbullying and Sexting One Classroom at a Time; Corwin Press: Thousand Oaks, CA, USA, 2012. [Google Scholar]
  23. Tokunaga, R.S. Following you home from school: A critical review and synthesis of research on cyberbullying victimization. Comput. Hum. Behav. 2010, 26, 277–287. [Google Scholar] [CrossRef]
  24. Dadvar, M.; Trieschnigg, D.; Ordelman, R.; De Jong, F. Improving cyberbullying detection with user context. In Proceedings of the Advances in Information Retrieval: 35th European Conference on IR Research, ECIR 2013, Moscow, Russia, 24–27 March 2013; Proceedings 35. Springer: Berlin/Heidelberg, Germany, 2013; pp. 693–696. [Google Scholar]
  25. Fati, S.M.; Muneer, A.; Alwadain, A.; Balogun, A.O. Cyberbullying detection on twitter using deep learning-based attention mechanisms and continuous Bag of words feature extraction. Mathematics 2023, 11, 3567. [Google Scholar] [CrossRef]
  26. Pater, J.A.; Miller, A.D.; Mynatt, E.D. This digital life: A neighborhood-based study of adolescents’ lives online. In Proceedings of the 33rd Annual ACM Conference on Human Factors in Computing Systems, Seoul, Republic of Korea, 18–23 April 2015; pp. 2305–2314. [Google Scholar]
  27. Wu, D.; Hou, Y.T.; Zhu, W.; Zhang, Y.Q.; Peha, J.M. Streaming video over the Internet: Approaches and directions. IEEE Trans. Circuits Syst. Video Technol. 2001, 11, 282–300. [Google Scholar]
  28. Seiler, S.J.; Navarro, J.N. Bullying on the pixel playground: Investigating risk factors of cyberbullying at the intersection of children’s online-offline social lives. Cyberpsychol. J. Psychosoc. Res. Cyberspace 2014, 8, 37–52. [Google Scholar] [CrossRef]
  29. Singh, V.K.; Radford, M.L.; Huang, Q.; Furrer, S. “They basically like destroyed the school one day” On Newer App Features and Cyberbullying in Schools. In Proceedings of the 2017 ACM Conference on Computer Supported Cooperative Work and Social Computing, Portland, OR, USA, 25 February–1 March 2017; pp. 1210–1216. [Google Scholar]
  30. Mladenović, M.; Ošmjanski, V.; Stanković, S.V. Cyber-aggression, cyberbullying, and cyber-grooming: A survey and research challenges. ACM Comput. Surv. (CSUR) 2021, 54, 1–42. [Google Scholar] [CrossRef]
  31. Jakubowicz, A. Alt_Right White Lite: Trolling, hate speech and cyber racism on social media. Cosmop. Civ. Soc. Interdiscip. J. 2017, 9, 41–60. [Google Scholar] [CrossRef]
  32. Reynolds, K.; Kontostathis, A.; Edwards, L. Using machine learning to detect cyberbullying. In Proceedings of the 2011 10th International Conference on Machine Learning and Applications and Workshops, Honolulu, HI, USA, 18–21 December 2011; IEEE: Piscataway, NJ, USA, 2011; Volume 2, pp. 241–244. [Google Scholar]
  33. Siddhartha, K.; Kumar, K.R.; Varma, K.J.; Amogh, M.; Samson, M. Cyber Bullying Detection Using Machine Learning. In Proceedings of the 2022 2nd Asian Conference on Innovation in Technology (ASIANCON), Ravet, India, 26–28 August 2022; IEEE: Piscataway, NJ, USA, 2022; pp. 1–4. [Google Scholar]
  34. Dadvar, M.; de Jong, F.M.; Ordelman, R.; Trieschnigg, D. Improved cyberbullying detection using gender information. In Proceedings of the Proceedings of the Twelfth Dutch-Belgian Information Retrieval Workshop (DIR 2012), Ghent, Belgium, 24 February 2012; Universiteit Gent: Ghent, Belgium, 2012; pp. 23–25. [Google Scholar]
  35. Jain, V.; Saxena, A.K.; Senthil, A.; Jain, A.; Jain, A. Cyber-bullying detection in social media platform using machine learning. In Proceedings of the 2021 10th International Conference on System Modeling & Advancement in Research Trends (SMART), Moradabad, India, 10–11 December 2021; IEEE: Piscataway, NJ, USA, 2021; pp. 401–405. [Google Scholar]
  36. Singla, S.; Lal, R.; Sharma, K.; Solanki, A.; Kumar, J. Machine learning techniques to detect cyber-bullying. In Proceedings of the 2023 5th International Conference on Inventive Research in Computing Applications (ICIRCA), Coimbatore, India, 3–5 August 2023; IEEE: Piscataway, NJ, USA, 2023; pp. 639–643. [Google Scholar]
  37. Hani, J.; Nashaat, M.; Ahmed, M.; Emad, Z.; Amer, E.; Mohammed, A. Social media cyberbullying detection using machine learning. Int. J. Adv. Comput. Sci. Appl. 2019, 10, 703–707. [Google Scholar] [CrossRef]
  38. Perera, A.; Fernando, P. Accurate cyberbullying detection and prevention on social media. Procedia Comput. Sci. 2021, 181, 605–611. [Google Scholar] [CrossRef]
  39. Vishwamitra, N.; Hu, H.; Luo, F.; Cheng, L. Towards understanding and detecting cyberbullying in real-world images. In Proceedings of the 2020 19th IEEE international conference on machine learning and applications (ICMLA), Virtual Event, 14–17 December 2020. [Google Scholar]
  40. Maity, K.; Jha, P.; Saha, S.; Bhattacharyya, P. A multitask framework for sentiment, emotion and sarcasm aware cyberbullying detection from multi-modal code-mixed memes. In Proceedings of the 45th International ACM SIGIR Conference on Research and Development in Information Retrieval, Madrid, Spain, 11–15 July 2022; pp. 1739–1749. [Google Scholar]
  41. Singh, V.K.; Ghosh, S.; Jose, C. Toward multimodal cyberbullying detection. In Proceedings of the 2017 CHI Conference Extended Abstracts on Human Factors in Computing Systems, Denver, CO, USA, 6–11 May 2017; pp. 2090–2099. [Google Scholar]
  42. Kumari, K.; Singh, J.P.; Dwivedi, Y.K.; Rana, N.P. Towards Cyberbullying-free social media in smart cities: A unified multi-modal approach. Soft Comput. 2020, 24, 11059–11070. [Google Scholar] [CrossRef]
  43. Luo, Y.; Zhang, X.; Hua, J.; Shen, W. Multi-featured cyberbullying detection based on deep learning. In Proceedings of the 2021 16th International Conference on Computer Science & Education (ICCSE), Lancaster, UK, 17–21 August; IEEE: Piscataway, NJ, USA, 2021; pp. 746–751. [Google Scholar]
  44. Kumari, K.; Singh, J.P.; Dwivedi, Y.K.; Rana, N.P. Multi-modal aggression identification using convolutional neural network and binary particle swarm optimization. Future Gener. Comput. Syst. 2021, 118, 187–197. [Google Scholar] [CrossRef]
  45. Do, P.; Pham, P.; Phan, T. Some research issues of harmful and violent content filtering for social networks in the context of large-scale and streaming data with Apache Spark. In Recent Advances in Security, Privacy, and Trust for Internet of Things (IoT) and Cyber-Physical Systems (CPS); Chapman and Hall: London, UK, 2020; pp. 249–272. [Google Scholar]
  46. Yousaf, K.; Nawaz, T. A deep learning-based approach for inappropriate content detection and classification of youtube videos. IEEE Access 2022, 10, 16283–16298. [Google Scholar] [CrossRef]
  47. Vishal, Y.; Bhaskar, J.U.; Yaswanthreddy, R.; Vyshnavi, C.; Shanti, S. A Novel Approach for Inappropriate Content Detection and Classification of Youtube Videos using Deep Learning. In Proceedings of the 2024 3rd International Conference on Applied Artificial Intelligence and Computing (ICAAIC), Salem, India, 5–7 June 2024; IEEE: Piscataway, NJ, USA, 2024; pp. 539–545. [Google Scholar]
  48. Feng, J.; Gomez, V. Continual Learning on Facial Recognition Using Convolutional Neural Networks. U.P.B. Sci. Bull. Ser. C 2023, 85, 239–248. [Google Scholar]
Figure 1. Non-bullying GIF removed from dataset.
Information 15 00446 g001
Figure 2. GIF files with anti-bullying content (giphy.com, accessed on 29 July 2024).
Information 15 00446 g002
Figure 3. GIF files with bullying content (giphy.com, accessed on 29 July 2024).
Information 15 00446 g003
Figure 4. Cyberbullying GIF decomposed to frames.
Information 15 00446 g004
Figure 5. Overview of the proposed approach.
Information 15 00446 g005
Figure 6. Confusion matrix for all classification categories.
Information 15 00446 g006
Figure 7. Confusion matrix.
Information 15 00446 g007
Figure 8. Confusion matrix for the architecture that uses just one RNN model.
Information 15 00446 g008
Figure 9. Test GIF file related to jumping.
Information 15 00446 g009
Table 2. Training and validation processes for RNN model 1.
BodybuildingBullyingWater Sports
Nr. video train15480176
Nr. video test382044
Total192100220
Table 3. Training and validation processes for RNN model 2.
KayakingRowing
Nr. video train8888
Nr. video test2222
Total110110
Table 4. Training and validation processes for RNN model 3.
Pull UpsPushups
Nr. video train8074
Nr. video test2018
Total10092
Table 5. Description of non-bullying dataset.
GroupCategoryNo. of Media Files
BodybuildingHandstand Pushups100
Pull Ups92
Water sportsRowing110
Kayaking110
Total-412
Table 6. Description of dataset.
ClassNo. of Media Files
Non-bullying412
Bullying100
Total512
Table 7. Hyper-parameter settings for RNN model.
DescriptionValue
Activation functionsReLU, softmax
Dropout rate0.4
Learning rate0.001
Loss functionSparse categorical crossentropy
OptimizerAdam
Epoch50
Table 8. System specifications.
System TypeOSArchitectureCPUMemory
Virtual MachineWin. 1064-bit4 cores4 GB RAM
HostWin. 1064-bitIntel-i932 GB RAM
Table 9. Performance metrics for the RNN models.
RNN Model No.AccuracyPrecisionRecallF1-Score
Proposed RNN model no. 199.02%95.24% (B)100% (B)97.56% (B)
100% (BB)97.37% (BB)98.66% (BB)
100% (WS)100% (WS)100% (WS)
Proposed RNN model no. 297.7%95.65% (K)100% (K)97.77% (K)
100% (R)95.45% (R)97.67% (R)
Proposed RNN model no. 3100%100% (Pull)100% (Pull)100% (Pull)
100% (Push)100% (Push)100% (Push)
Simple RNN51.96%64% (B)80% (B)71% (B)
48.39% (K)68.18% (K)56.61% (K)
51.28% (Pull)100% (Pull)67.8% (Pull)
0% (Push)0% (Push)0% (Push)
28.57% (R)10% (R)14.82% (R)
Table 10. Classification results for a test video using the proposed solution.
RNN Model NumberCategoryAccuracy
1Bodybuilding99.74%
Bullying0.16%
Water sports0.10%
2Pull Ups98.21%
Handstand Pushups1.79%
Table 11. Classification results for a test GIF related to jumping.
RNN Model NumberCategoryAccuracy
1Bullying96.60%
Water sports2.07%
Bodybuilding1.34%
Disclaimer/Publisher’s Note: The statements, opinions and data contained in all publications are solely those of the individual author(s) and contributor(s) and not of MDPI and/or the editor(s). MDPI and/or the editor(s) disclaim responsibility for any injury to people or property resulting from any ideas, methods, instructions or products referred to in the content.

