Article

Deep Learning to Authenticate Traditional Handloom Textile

by
Anindita Das
1,
Aniruddha Deka
1,
Kishore Medhi
1 and
Manob Jyoti Saikia
2,3,*
1
Computer Science and Engineering, Assam down town University, Guwahati 781026, India
2
Department of Electrical Engineering, University of North Florida, Jacksonville, FL 32224, USA
3
Biomedical Sensors & Systems Lab, University of North Florida, Jacksonville, FL 32224, USA
*
Author to whom correspondence should be addressed.
Information 2024, 15(8), 465; https://doi.org/10.3390/info15080465 (registering DOI)
Submission received: 3 June 2024 / Revised: 17 July 2024 / Accepted: 2 August 2024 / Published: 4 August 2024
(This article belongs to the Special Issue Intelligent Image Processing by Deep Learning)

Abstract

:
Handloom textile products play an essential role in both the financial and cultural landscape of natives, necessitating accurate and efficient methods for authenticating against replicated powerloom textiles for the protection of heritage and indigenous weavers’ economic viability. This paper presents a new approach to the automated identification of handloom textiles leveraging a deep metric learning technique. A labeled handloom textile dataset of 25,166 images was created by collecting handloom textile samples of six unique types, working with indigenous weavers in Assam, Northeast India. The proposed method achieved remarkable success by acquiring biased feature representations that facilitate the effective separation of different fiber types in a learned feature space. Through extensive experimentation and comparison with baseline models, our approach demonstrated superior efficiency in classifying handloom textiles with an accuracy of 97.8%. Our approach not only contributes to the preservation and promotion of traditional textile craftsmanship in the region but also highlights its significance.

1. Introduction

Handloom textiles hold immense cultural and artistic value because of their intricate weaves, vibrant colors, and rich textures. Different nations shares the pride and commitment to preserve their handloom histories. Handloom customs are valued for their exquisite workmanship and age-old methods that constitute an integral element of a country’s cultural identity and history. Assam, located in the northeastern part of India, boasts a rich cultural heritage deeply intertwined with its handloom industry [1]. It becomes an integral part of the cultural heritage, contributing significantly to the region’s socioeconomic landscape. The looms Figure 1a are used as a textile apparatus that is designed to mechanize the weaving process by intertwining two sets of threads, known as warps and wefts. Assam has a significant impact on the textile sector, accounting for 15% of country’s industrial production and approximately 30% of global exports from India [2]. According to the 4th National Handloom Census conducted in 2019–2020, Assam’s handloom industry employs 1.28 million household weavers and over 1.16 million handloom workers. According to department records of 2017 [3], 4012 handloom weaver cooperative societies are regulating around 0.211 million active independent operating looms. Indeed, it represents the second-largest employer after the agricultural sector. A traditional weaving loom, along with a textile sample, is shown in Figure 1. Assam handloom cloth encompasses a diverse range of textures and appearances with its own unique characteristics [4].
In the handloom market, native handloom products are fighting an existential battle with the counterfeit producers for their variety. Due to this, consumers are deceived into spending significantly more on these replicas. The existence of uniqueness becomes a challenging factor for comparable products with similar structural and raw material specifications to emulate. For the handloom industry [5] to survive, it is therefore imperative to accurately identify different handloom textiles for quality assurance, product authentication, and market competitiveness. Conventional identification approaches are also known for their time-consuming nature and susceptibility to subjective human biases, as well as the physical and psychological strain they impose due to their manual nature. Moreover, they often suffer from inefficiencies. The constrained are limited to ensure stability, and fault tolerance in textile identification remains a challenge. “Sualkuchi: textile center of Assam” [6] is situated about 35 km from the state capital of Guwahati, Assam. Its strategic location on the banks of the mighty Brahmaputra river has historically facilitated trade and transportation, contributing to its growth as a prominent center for silk weaving. The town is renowned for its production of Muga silk, the golden silk indigenous to Assam, as well as Eri silk and Pat silk. During our visit to this place for survey and data collection, we found that there is only one testing lab, which led to slowing down the entire process. Therefore, there is a growing need for automated identification solutions that can leverage advanced technologies to streamline the process while upholding the integrity and authenticity of handloom textiles.
With advancements in technology, particularly in computer vision, machine learning, and spectroscopy, automated and semiautomated techniques for textile classification have emerged as promising alternatives. In recent years, Deep Learning (DL) has emerged as a transformative force in various fields, revolutionizing the way we approach complex pattern recognition and image analysis tasks. We are utilizing the capability of a DL model to handle the difficulties of manually identifying handloom textiles using our own labeled image dataset. Although there are many state-of-the-art methods available for fabric classification, there is still a crucial need for a new approach specifically designed for handloom fabrics. Some existing traditional techniques such as Discrete Wavelet Transform [7], LS-SVM [8], and many others have notable drawbacks, including the loss of spatial information and high computational costs for hyperparameter tuning, and are limited by noise data and potential biasness. Some of the approaches struggle with capturing intricate patterns and texture variations effectively. Deep learning models, such as DCNNs [9], Faster-RCNN [10], and FabricNet [11] lack explicit control over feature weights, as well as face computational inefficiencies and challenges in selecting key features. Given the unique and diverse nature of handloom fabric patterns, a specialized classification method is needed for classifying different handloom fabrics to overcome these limitations. Such an approach would enhance accuracy, efficiency, and robustness in classification, thus preserving cultural heritage and contributing to advancements in textile technology. The following is a summary of the main contributions made by our work:
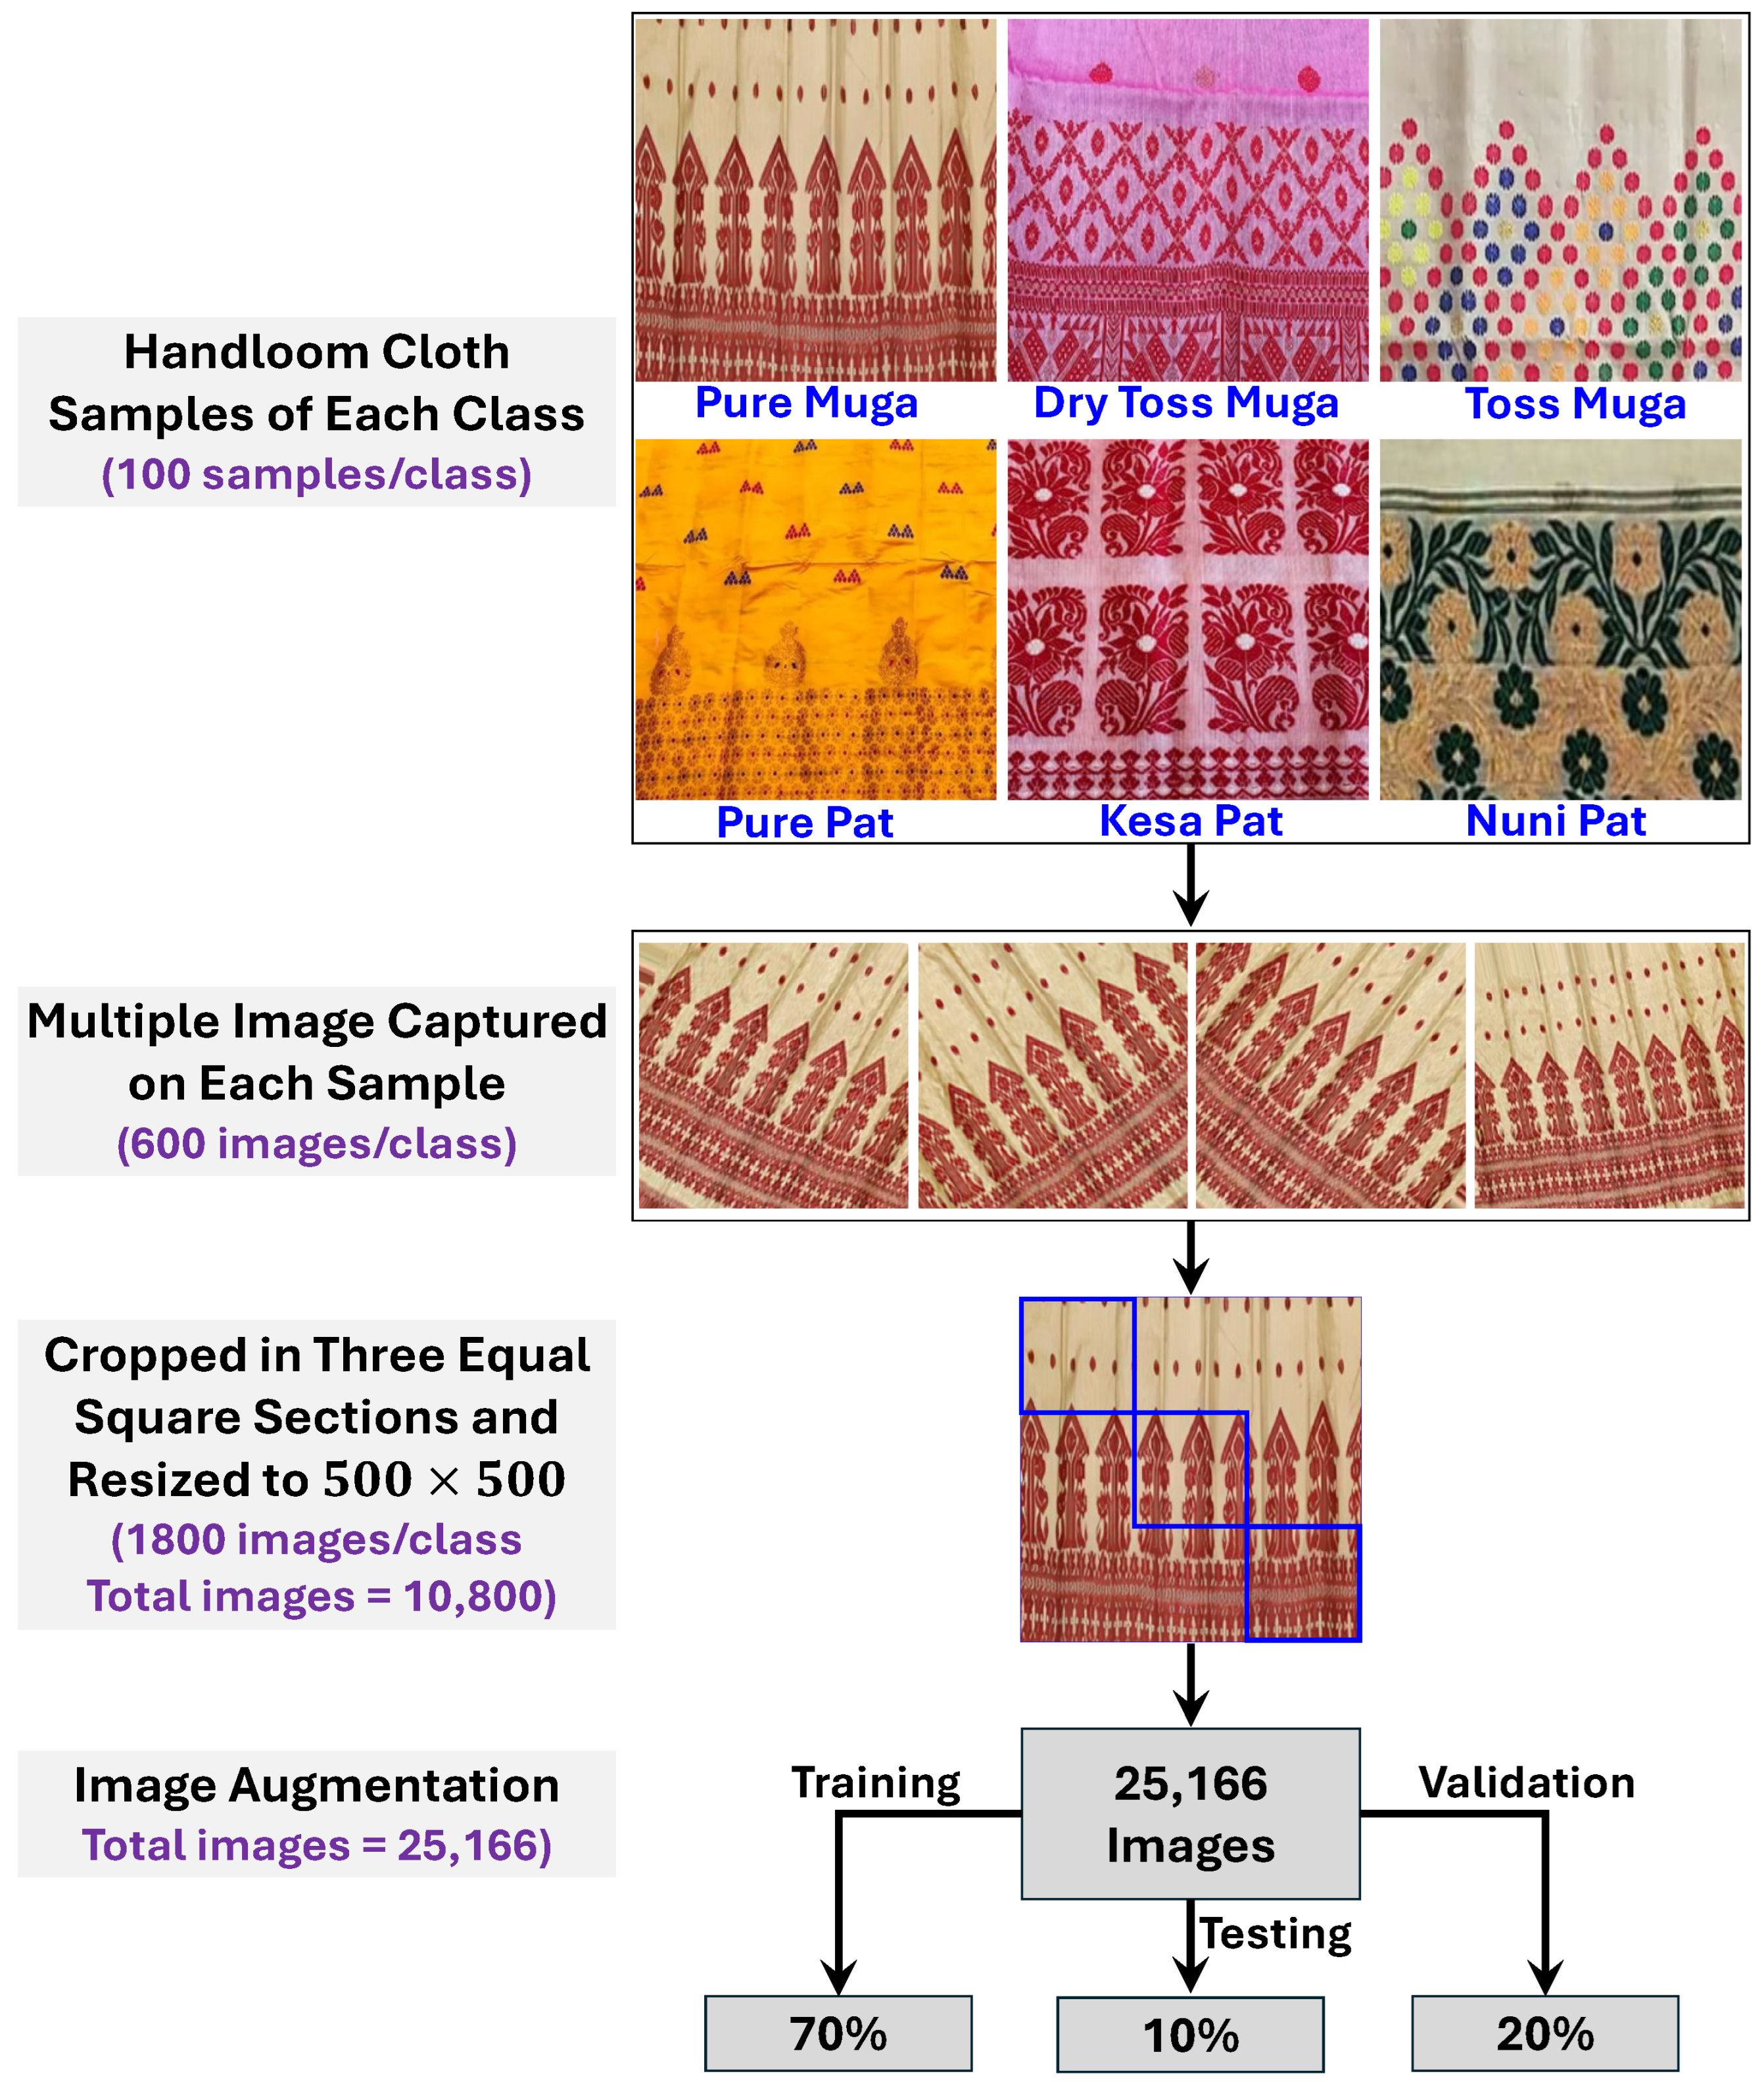
  • We are the first to create our own labeled handloom textile image dataset consisting of six classes, i.e., Pure Pat, Kesa Pat, Nuni Pat, Pure Muga, Toss Muga, and Dry Toss Muga.
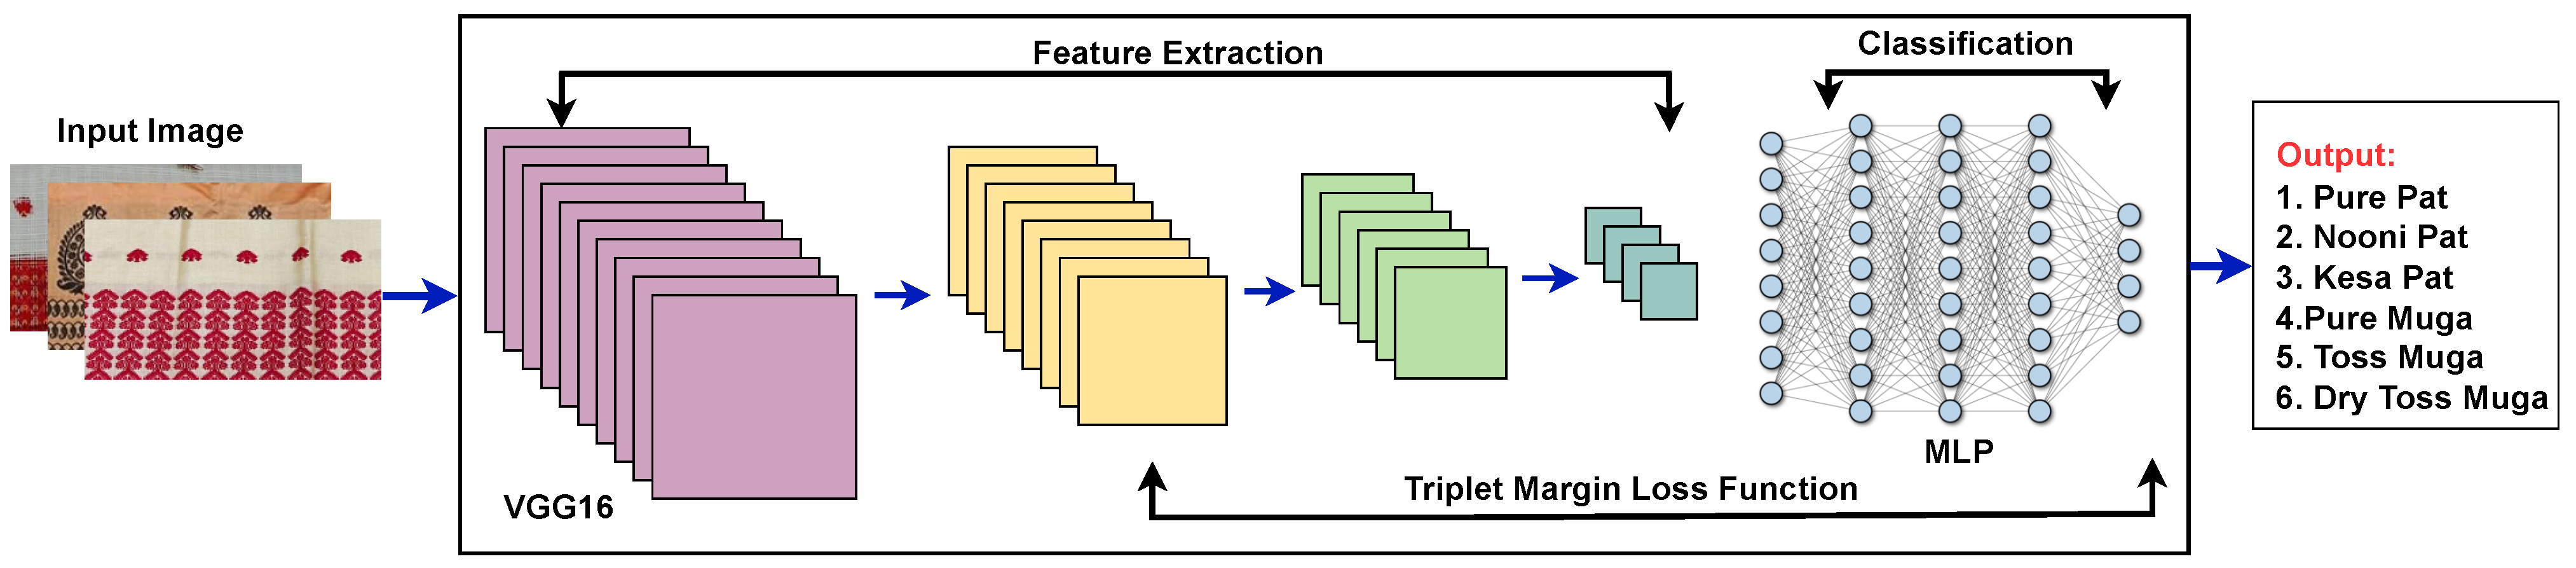
  • We have developed a modified deep matric learning model to extract in a combined manner the features from the input sample, enabling them to capture subtle variations in handloom textures and patterns and classify them to their labeled classes.
  • We compared our proposed method with the state-of-the-art techniques in-terms of precision, recall, F1-score, and accuracy.
The paper is organized as follows: a literature review of various existing methods and their limitations is described in Section 2. Section 3 provides a brief description of the proposed method, including dataset development details. The explanation of experimental results and their visualization are in Section 4. At last, the paper is concluded in Section 5.

2. Literature Survey

Although artificial intelligence (AI) is widely used in many industries, the implementation of AI in the textile manufacturing industry is limited. According to observations, the initial stage of work began in 2005 [12], when 30 microscopic photographs of cotton materials with a plain weave were taken to calculate porosity. Scientists found that the more important pore dimensions of unfastened textiles resulted in higher light transparency relative to tighter ones when assessing textile porosity through the utilization of image analysis techniques. In the following work, which was published in 2010 [7], researchers applied the discrete wavelet transform (DWT) to generate and store first-order statistical data like mean and standard deviation. To identify any type of textile, the resultant output was examined with the value of the reference image. Here, the study used image analysis tools to locate and detect faults in a handloom textile. A survey of existing computer vision technology in 2011 was done to analyze textile texture [13].
In another study [14], machine learning (ML) was applied in order to distinguish various items depending on surface texture, including wood, sponge, tiles, carpet, flooring vinyl, and PVC woven mesh. A number of ML methods, including decision trees, naive Bayes, and naive Bayes trees were trained to discriminate between textures detected by an artificial finger that was inspired by biology. The authors furthered the development [15], which was published in 2014, creating a revolutionary transform method using fabric yarn patterns dataset. The edge-based method was implemented on the warp and weft of three different types of yarn-dyed cotton using twenty-four microscopic picture samples. It outperformed the gray projection method, particularly in cases where the fabric surface had long hairiness. In 2015 [16], 450 distinct textured photos of various cloth materials with varied designs were used to further demonstrate the texture features of textile image categorization. Moment invariant (MI), local binary pattern, and GLCM feature extraction techniques were employed by the researchers. Next, PCA was used for feature reduction, and SVM was used for classification. A percentage of 74.15% accuracy was attained. A paradigm to integrate learning methods for handloom textile identification was proposed using least-square SVM (LS-SVM) [8] and edge identification.
Jing et al. [17] used the TILDA database to work on fabric, extracting features using Gabor filters and then reducing them using the feature reduction kernel (PCA). To calculate the similarity matrix, the Euclidean normal and OTSU were utilized. The measured results for sensitivity, specificity, and identification success rate range were from 90% to 96%. Both the specificity and detection success rate for different kinds of issues were greater than 96% and 93%, respectively. Another cutting-edge biologically inspired technique was introduced in 2017 [18], which used RGB inputs to invariantly identify the yarn color and the fabric weave texture. The HMAX model, which was motivated by the visual cortex’s hierarchy, served as the foundation for the fabric weave pattern label that the authors suggested. The opponent color channel, which takes impetus from the traditional opponent color theory of vision, was the foundation of the color descriptor. During the categorization stage in 2018, a learning model with various layers was used. Researchers [19] also studied the use of learning techniques for fleece textile grading using pilling assessment.
In 2018 [20], Praveen Kumar et al. introduced another work on computer vision method for handloom fabric identification. This method effectively classified different types of handloom fabrics. They investigated a variety of image processing approaches, feature extraction methods, and machine learning algorithms. To identify the distinctive qualities of various handloom textiles and create classification algorithms, they relied on feature extraction techniques such as Gabor filters and local binary patterns (LBPs) [21]. Three hundred and twenty typical samples each consisting of eighty samples were taken from fabrics and categorized into grades 2, 3, 4, or 5. The resulting grayscale images were filtered using two techniques: smoothing using Gaussian filtering in conjunction with the DFT approach. Both SVM and ANN were employed in classification. The overall efficiency of the Daubechies wavelet, ANN, and SVM were adoptable. Researchers looked into the application of a learning method for handloom textile identification in 2020. Convolutional neural networks (CNNs) [9] were employed to automatically identify and extract discriminative elements from images of handloom textiles. Their study showed how well deep learning works for precisely recognizing handloom textiles. Methods of texture analysis for handloom textile identification were the subject of some research. To describe the distinctive patterns and textures seen in handloom textiles, the authors investigated a variation in texture descriptors and statistical aspects. These chosen traits served as the foundation for the network they built.
One more work [22] included an overview of the use of ML and data mining in the textile sector. A methodology [23] that utilized a library of 7200 photos from both handlooms and powerlooms, along with an ML classifier, yielded an impressive performance of an automated handloom recognition in 2022. Using a t-test, significant features could be determined, texture features were extracted, and all feature combinations were used for training. Recall rates were high, while precision rates were good. Notably, there was no validation in the study, and it was limited to digital camera photographs. A paradigm integrating ML and image processing for handloom textile identification was proposed in 2022 [11]. They took pictures of loom cloth and extract features from them using techniques including edge identification, color analysis, and texture analysis. Next, different ML techniques were used to classify data. Proximal support vector machines (PSVMs) [24] were used to distinguish handloom and powerloom goods based on attributes extracted from gray-level photos of both materials using the plain woven textile database. An approach known as k-fold crossvalidation was employed to rate accuracy. The best classifier had a lot less tendency to overfit than its rivals because of its robustness, speed of execution, accuracy, and ease of use of the algorithm.
A planar substance made of textile fibers is called a textile. One of the first methods for recognizing textile fibers from images was FabricNet [25], which was built with a unique class of class-based ensemble CNN architecture. Faster R-CNN, SSD, Resnet50, and Resnet101 algorithms were used to implement the deep learning way of correctly identifying fibers using fabric datasets. For this problem, Faster R-CNN was found to be the optimal solution. A study [10] revealed that the pulse-coupled neural network (PCNN) approach outperformed the other techniques and called for more investigation in the warp knitted fabric database. Due to its laborious visual examination process, textile recognition has historically presented a number of difficulties. The residual network (ResNet) was used in the paper’s implementation of a model based on data augmentation and transfer learning method for classification and characteristics extraction. The majority of these works were carried out to identify handloom and powerloom clothes. Some existing studies are listed in Table 1.
The analysis of various methodologies for fabric classification reveals several common limitations that impact their effectiveness. Some traditional techniques like the DWT and HMAX models mainly suffer from spatial information loss as they decompose images into finer scales, which can lead to inaccuracies in representing intricate textile patterns. Similarly, methods like LS-SVM and LBP also require significant computational resources to achieve optimal hyperparameter tuning, making them impractical for real-world applications that require efficiency. These models also struggle with capturing complex pattern dependencies and variations in texture, limiting their ability to distinguish between different fabric types accurately. Deep learning approaches, such as DCNNs, often lack precise control over feature weights, which affects their ability to adapt to the diverse textures present in fabrics. Furthermore, challenges related to dataset size, generalization across different fabric types, and noise in training data further hinder the performance of methods. These collective limitations underscore the urgent need for ongoing research to develop more robust and efficient fabric classification methods. Moreover, the limitations of existing handloom fabric datasets contribute to the challenge of classification. Handloom fabric datasets often suffer from limited sample sizes, which may not adequately represent the full diversity of handloom fabrics across different regions and cultures. This can lead to biased or incomplete model training, impacting the generalization and accuracy of classification algorithms.

3. Methodology

The methodology of the proposed work is divided into two subsections such as dataset creation and development of an efficient learning model. Detailed descriptions of the dataset development and designed network are presented in Section 3.1 and Section 3.2, respectively. Our approach focuses on classifying handloom fabric images by predicting their respective category labels. This is achieved through a learning framework that maps each fabric image to its corresponding class. The framework, as shown in Figure 2, is designed to learn the hidden features from the input image, ensuring that images within the same class are closer in the learned feature space, while images from different classes are more distant. The proposed deep learning framework encompasses a series of interconnected stages, beginning with a dataset preparation. This initial phase involved gathering of relevant samples with their respective labels, preprocessing, and splitting the data. Following the data preparation, a model architecture was designed by modifying the CNN structure for the specific task. The schematic workflow of the designed network is demonstrated in Figure 3. With the architecture in place, the model underwent training, during which it learned to make efficient predictions. Finding the predictions, the loss function was estimated and compared to a margin value (threshold). Hyperparameter tuning was then conducted to optimize model performance loss, followed by evaluation of split testing data to assess their generalization ability.

3.1. Dataset Development

Datasets play a crucial role in the proper training and testing of an accurate deep learning-based model. It was discovered that few regional handloom textile datasets [26] were produced with low-quality and low-resolution samples, which impacted the identification process. Microsoft COCO [27], TILDA Fabric [28], and ImageNet [29] datasets were also recommended in certain works; however, the outcomes in terms of accurate identification are very limited. To overcome these challenges, we created our own high-resolution images segment dataset from different handloom Pat and Muga silk images. As shown in Figure 4, we captured images of 600 counts, with a similar allocation of 100 textile samples of each class containing Pure Pat, Kesa Pat, Nuni Pat, Pure Muga, Toss Muga, and Dry Toss Muga. Smartphone devices of two varieties (iPhone 11 and OnePlus Nord CE 3) were employed. While taking images, external elements like focus, illumination, and distortion were considered while keeping a 5–10 cm distance between the textile and comprehensive camera specifications.
Figure 4 shows the example of six handloom textile types. Pure Pat, known for its fine craftsmanship, boasts a smooth and glossy surface. Its appearance is characterized by a subtle sheen and intricate designs, often featuring motifs inspired by nature and traditional Assamese culture. Kesa Pat, on the other hand, stands out with its bold and vibrant colors, along with geometric patterns that create a visually striking effect. The texture of Kesa Pat is slightly coarser compared to Pure Pat, with a more pronounced weave that adds depth and texture to the textile. Nuni Pat, renowned for its delicate embroidery work, features intricate thread work that lends it a tactile richness and dimensionality. The Nuni Pat is soft and supple, with the raised embroidery creating a subtle texture that invites exploration by hand. Toss Muga and Dry Toss Muga, both made from the rare Muga silk, exhibit a natural golden hue that sets them apart. While Toss Muga has a soft and lustrous feel, Dry Toss Muga has a slightly rougher texture due to its untreated nature, offering a more rustic appeal. Pure Muga epitomizes luxury with its unparalleled softness and exquisite appearance. Its smooth surface and natural sheen make it a delight to touch, while its rich golden color exudes opulence and elegance.
For training and validating the model effectively, we ensured that all pertinent sample attributes were considered. We visited the handloom textile production facility and gathered a variety of weaving samples that were verified by specialists in the Directorate of Handloom & Textile, Government of Assam, guaranteeing trustworthy and ground truth. To illustrate various features of each category, a number of photographs were taken from collected cloth samples. To provide varying viewpoints, we cropped each image into three equal-sized cropped images: center, top left, and bottom right of the images Figure 4. Following resizing to 500 × 500 pixels (model parameters), we obtained 1800 images for each class. In the decision to standardize dataset images to 500 × 500 pixels for uniform dimension, variability in image resolution is minimized, ensuring consistency across the dataset and facilitating robust model performance. The 500 × 500 pixel resolution provides sufficient spatial information to capture the nuanced textures and patterns characteristic of handloom fabrics. Further image augmentation was implemented to improve model generalization and variety. With that, there were 4210 images for each class except the Kesa Pat class. Due to limitations in our Kesa Pat textile samples, such as the transparent nature of the textile, we could only generate 4116 images. Hence, the final dataset consisted of 25,166 images. The data processing steps of the collected images are shown in Figure 4, and detailed image distribution is listed in Table 2. The dataset was preprocessed using edge-adaptive total variation model for noise removal. We grouped the data samples per class: 70% for training, 20% for validation, and the remaining 10% images were kept separately for testing.

3.2. Proposed Network

As shown in Figure 5, in this experiment, we implemented an architecture of a Deep Metric Learning (DML) Network tailored for classification of various handloom clothes. This learning network was efficient for the classification of various handloom textiles due to its ability to learn discriminative representations in a high-dimensional space. While metric learning is traditionally used for matching problems, where the goal is to determine if two patterns match, we have innovatively applied DML to enhance the classification of handloom fabrics. Therefore, although our method employs a DML architecture, it is tailored specifically to improve classification performance, effectively bridging the gap between matching and classification tasks. This approach allows us to leverage the strengths of DML for more robust and precise classification of diverse handloom fabrics. This method is employed specifically to improve classification performance, effectively bridging the gap between matching and classification tasks.
Unlike traditional deep learning methods that focus solely on minimizing classification error, DML networks aim to optimize the embedding space so that similar samples are closer together while dissimilar samples are farther apart. This method is especially beneficial for capturing the differences in texture, color, and weave patterns. Our approach integrates a VGG16 network as a feature extractor. A pretrained VGG16 model [30] was utilized as the backbone of CNN, leveraging its hierarchical structure to extract meaningful features from input images. VGG16 is an established convolutional neural network (CNN) architecture renowned for its simplicity and effectiveness in various image analysis techniques like image generation and recognition. VGG16 has become a benchmark model due to its straightforward architecture, which consists of 16 weight layers, including convolutional and fully connected layers. This simplicity has made it widely adopted in applications ranging from image classification to object detection and segmentation. It has a relatively low computational cost compared to deeper and more complex models. Additionally, VGG16 supports layerwise feature extraction, allowing researchers and practitioners to leverage intermediate features for transfer learning. It typically culminates in several deep connected layers, facilitating high-level feature learning and classification. VGG16 offers a stack of 3 × 3 convolutional layers, which is effective for capturing intricate details and patterns present in handloom fabrics. It facilitates easier fine-tuning, which is critical for ensuring robust performance on our dataset. While more recent architectures like ResNet and DenseNet may offer deeper or more intricate feature hierarchies, VGG16 strikes a balance by providing a strong baseline performance without excessive computational demands. This model also supports a manageable number of parameters [31], making it suitable for implementation, and it also provides efficient accuracy. Given the complexities inherent in deep metric learning, where the emphasis is on learning discriminative feature representations, VGG16’s architecture provides a stable platform to build upon and optimize for our classification task.
Each convolutional layer applies a collection of learning filters to the training samples, progressively extracting hierarchical abilities that record ever-more intricate patterns and structures. Max pooling layers reduce spatial dimensions while retaining salient features, enhancing the network’s translational invariance. ReLU activation functions introduce nonlinearity, aiding in feature representation learning. By removing the fully connected layers of the VGG model, we utilized the Multilayer Perceptron (MLP) [32] for feature map extraction based on the dimensionality reduction concept.
The extracted features were thus fed into an MLP, which consists of an input layer, one or more hidden layers, and an output layer. The input layer of the MLP received the feature vectors from VGG, and nonlinear changes were carried out via the hidden layers to learn complex patterns from the data using the softmax activation function. Softmax function takes the raw scores (logits) from the previous layer and normalizes them into a probability distribution. Finally, output layer of the MLP predicts the probabilities of the input belonging to six classes each. The MLP network compresses the feature vectors into a lower-dimensional space, facilitating efficient representation learning while preserving discriminative information relevant to the classification task. We leveraged Triplet Margin Loss [33] as the primary loss function to facilitate the learning of discriminative feature representations. To train, we employed triplet margin loss, a commonly used loss function in deep metric learning.
Triplet margin loss encourages the network to learn embeddings such that the distance between an input image and its positive counterpart is minimized, while the distance between the input and negative images is maximized by a predefined margin value also known as a threshold value of 0.5, as it tends to generalize better. This triplet-based loss formulation enables the network to learn discriminative embeddings that can effectively separate instances of different classes in the feature space. It has the ability to directly optimize for similarity or dissimilarity between samples rather than focusing solely on class labels. We enable the network to learn from a discriminative feature space where samples from the same class are grouped closely together, and samples from different classes are positioned farther apart. This structured feature space enhances the network’s ability to accurately classify a single pattern into its respective class. Next in the inference method, the parameters of the pretrained model were fixed. Using the same feature extractor, the inference images were converted into feature vectors. These feature vectors were classified into our mentioned, classes ensuring robust and effective classification performance. This combination transforms the high-dimensional feature representations into a lower-dimensional space. This method was employed to perform multiclass classification by fitting a linear function to the embedded feature space while penalizing large weight values to prevent overfitting. This architechture works well particularly in scenarios with limited training data. By utilizing the advantages of each component, we aimed to achieve high accuracy, independency of hyperparameter selection, and robustness, thereby facilitating the development of an effective system for real-world applications.

4. Experimental Results

The experimental results section is divided into the following subsections: Experimental Parameter Setup, Peer Competitors, and Comparison Experiments. A detailed explanation of all the subsections is given below.

4.1. Experimental Parameter Setup

We conducted our experiment on our own developed dataset comprising images of handloom textile samples gathered from varied sources, as illustrated in Section 3.1. The dataset includes total six classes of clothes such as Pure Pat, Kesa Pat, Nuni Pat, Pure Muga, Toss Muga, and Dry Toss Muga. As mentioned in Section 3.1, we split the data samples into 70–20% for training and validation and the remaining 10% images for testing. We used our designed network for the classification experiment with a batch size of 32, learning rate of 0.001, and using Adam optimizer. The model architecture is shown in Table 3.
The experimental results illustrate the efficacy of our deep metric learning approach to handloom textile type identification. After 48 epochs of using the dataset, the architecture’s training accuracy was approximately 97.8%, and its validation accuracy was 93%. It showed robustness to variations in lighting conditions, texture patterns, and fiber orientations. The training, validation accuracy, and loss are represented graphically in Figure 6. After this, the model was evaluated with the remaining 10% of the dataset, (i.e., 421 images of each handloom textile class), resulting in a confusion matrix that is shown in Figure 7. A comparison of the proposed method with other approaches in terms of accuracy and loss over a range of 50 epochs for our dataset is shown in Figure 8. The size, number of parameters, and depth are interconnected aspects of a learning model’s architecture [34]. Expansion of the parameter quantity often leads to increased space occupancy due to the additional memory required for storage. However, our model achieved a balanced compromise by maintaining a reasonable depth. This balance ensures an equitable trade-off between computational cost and performance. Thus, it meets the demands for significant computing tools for interpretation and training while effectively managing the network’s load on learning data. In contrast to other models, our suggested model performed rather well in validation accuracy and loss. This model offers adaptability and sturdiness in spite of minimum training data and handles intraclass variations smoothly.

4.2. Peer Competitors

The cutting-edge techniques were chosen as the peer rivals in order to demonstrate the efficacy and efficiency of the suggested solution. The competitors were mostly chosen from two distinct groups. Traditional architectures like LS-SVM, PSVM, and Gabor filter with LBP were primarily included in the first group. Interpretability and reliable baseline models were provided by this method, which can be used to assess how well more sophisticated learning architectures work. The second group included different CNN architectures like PCNN, DCNN with Adaptive Wiener filter, Faster-RCNN, and FabricNet. These CNN architectures have won numerous large-scale ImageNet visual recognition competitions and have been applied to a variety of classification-based experiments. It is imperative to note that our suggested approach primarily concentrates on offering respectable accuracy with the least amount of resource consumption.

4.3. Comparison Experiments

As shown in Table 4, we used various assessment measures, such as precision [35], recall [36], and F1-score [37], as shown in Equation (1), Equation (2), and Equation (3), respectively, to estimate the comparing results using our dataset. It is apparent that our model outperformed other existing models. It shows that our proposed method is more accurate than others at predicting favorable outcomes. It makes a big impact in this situation based on the false negative (FN) scenario. High recall ensures that important instances of the positive class are not missed by the model. Our model achieved comparable results to others with high rates. Its high precision of 0.895 indicates a low false positive (FP) rate, meaning it accurately identifies relevant instances of true positive (TP) and true negative (TN) values. The impressive recall of 0.883 showcases its ability to find all relevant instances, minimizing false negatives. Moreover, the F1-score of 0.943 harmonizes precision and recall, indicating a well-balanced model with minimal trade-offs between the two metrics.
P r e c i s i o n = T P T P + F P
R e c a l l = T P T P + F N
P r e c i s i o n = 2 × P r e c i s i o n × R e c a l l P r e c i s i o n + R e c a l l
Our method addresses the limitations found in existing approaches by leveraging the strengths of the VGG architecture for robust feature extraction, preserving spatial information that is often lost in decomposition-based methods like discrete wavelet transform. By integrating an MLP, we achieved optimal hyperparameter tuning without the computational overhead associated with the LS-SVM. The use of triplet margin loss effectively managed structural dependencies and generalization issues that affect models such as HMAX and PCNN. Furthermore, our approach enhanced feature selection and computational efficiency, overcoming the challenges faced by FabricNet and Faster-RCNN while providing explicit control over the feature weights and providing a significant improvement over DCNN + AWF methods. Our method proves to be the optimal choice due to its exceptional performance, high efficiency, and suitability to our specific classification task, offering a comprehensive solution to the diverse limitations of prior techniques in textile analysis.
To investigate the robustness of our proposed method, k-fold crossvalidation techniques have been adopted. Using this method, instead of splitting the dataset in advance, the model gets affected by random variations in the data split, resulting in a reliable measure of the model’s actual performance. To address this, we have plotted a Table 5 of k-fold crossvalidation (CV) accuracy in our approach with respect to different numbers of k. The k-fold crossvalidation (CV) technique divides the dataset into k equal parts. In each iteration, k-1 parts are used to train the model, while the remaining part is used for testing. This process is repeated k times, ensuring each part serves as the testing set once. The outcomes of these k iterations are then averaged to obtain a more accurate and dependable estimate of the model’s performance. This crossvalidation method enhances the assessment of the model’s generalizability and reduces the risk of overfitting, ensuring that the evaluation is not biased by any particular train–test split. In the case of our approach, the results show that except for k values 2 and 3, there was an average validation accuracy of more than 95%, proving the methods robustness and reliability. Based on the above results, it is clear that in both the validation methods the proposed technique achieved an average accuracy that was better than all the methods in comparisons. This result proves the robustness and effectiveness of the proposed method compared to the other state of the art methods.

5. Conclusions

Handloom textile products play an essential role in both the financial and cultural landscape of Assam and the northeastern part of India. Automated identification of the original textile plays a significant role in authenticating originality against replicated power loom textiles. This work presents a significant advancement in the automated identification of handloom textiles using the deep metric learning technique. To conduct the experiment, we generated a dataset consisting of 25,216 images from six different categories such as Pure Pat, Kesa Pat, Nuni Pat, Pure Muga, Toss Muga, and Dry Toss Muga. By leveraging the approach in our own labeled dataset development, we have showcased its effectiveness in accurately identifying the different types of textiles. Our method not only outshines existing techniques but also achieves a remarkable accuracy rate of 97.8%, as verified through rigorous experimentation and comparison with baseline methods. This result not only contributes to advancing automated textile identification systems but also has broader implications for preserving cultural heritage and ensuring the sustainability of traditional industries. Future research in this field could refine the deep metric learning framework and enhance the identification system’s comprehension and resilience by incorporating complementary techniques like image augmentation and domain adaptations.

Author Contributions

Conceptualization, A.D. (Anindita Das), A.D. (Aniruddha Deka), K.M. and M.J.S.; methodology, A.D. (Anindita Das), A.D. (Aniruddha Deka) and K.M.; software, A.D. (Anindita Das); validation, A.D. (Aniruddha Deka) and K.M.; formal analysis, A.D. (Anindita Das) and A.D. (Aniruddha Deka); investigation, M.J.S.; resources, A.D. (Aniruddha Deka); data curation, A.D. (Anindita Das), writing—original draft preparation, A.D. (Anindita Das), A.D. (Aniruddha Deka) and K.M.; writing—review and editing, M.J.S.; visualization, A.D. (Anindita Das) and M.J.S.; supervision, A.D. (Aniruddha Deka) and M.J.S.; project administration, M.J.S. All authors have read and agreed to the published version of the manuscript.

Funding

This research received no external funding.

Institutional Review Board Statement

Not applicable.

Informed Consent Statement

Not applicable.

Data Availability Statement

The dataset used in this article is not readily available due to trademark protection.

Acknowledgments

The authors thank the anonymous indigenous handloom weavers from Assam, Northeast India for supporting this research. They also thank the Directorate of Handloom & Textile, Govt of Assam. The authors thank Biomedical Sensors & Systems Lab for supporting the APC.

Conflicts of Interest

The authors declare no conflicts of interest.

References

  1. Khatoon, S. Make in India: A platform to Indian handloom market. IOSR J. Bus. Manag. 2016, 18, 36–40. [Google Scholar] [CrossRef]
  2. Office of The Development Commissioner for Handlooms Ministry of Textiles Government of India. Fourth All India Handloom Census Report 2019–2020; Office of The Development Commissioner for Handlooms Ministry of Textiles Government of India: Delhi, India, 2019. [Google Scholar]
  3. Goverment of Assam. Directorate of Handloom & Textile. Available online: https://dht.assam.gov.in/ (accessed on 11 May 2024).
  4. Bajpeyi, C.M.; Padaki, N.V.; Mishra, S.N. Review of silk handloom weaving in Assam. Text. Rev. 2010, 2010, 29–35. [Google Scholar]
  5. Jain, D.C.; Miss, R.G. An analytical study of handloom industry of India. In Proceedings of the International Conference on Innovative Research in Science, Technology and Management, Singapore, 16–17 September 2017; Volume 6. [Google Scholar]
  6. Chakravartty, P.; Keshab, B. Sualkuchi Village of Assam: The Country of Golden Thread. IOSR J. Bus. Manag. 2018, 20, 12–16. [Google Scholar]
  7. Muthan, P.; Sabeenian, R.S. Handloom silk fabric defect detection using first order statistical features on a NIOS II processor. In Proceedings of the Information and Communication Technologies: International Conference, ICT 2010, Kochi, India, 7–9 September 2010; Springer: Berlin/Heidelberg, Germany, 2010. [Google Scholar]
  8. Thanikodi, S.; Meena, M.; Dwivedi, Y.D.; Aravind, T.; Giri, J.; Samdani, M.S.; Kansal, L.; Shahazad, M.; Ilyas, M. Optimizing the selection of natural fibre reinforcement and polymer matrix for plastic composite using LS-SVM technique. Chemosphere 2024, 349, 140971. [Google Scholar] [CrossRef] [PubMed]
  9. Frei, M.; Kruis, F.E. FibeR-CNN: Expanding Mask R-CNN to improve image-based fiber analysis. Powder Technol. 2021, 377, 974–991. [Google Scholar] [CrossRef]
  10. Shuyuti, N.A.S.A.; Salami, E.; Dahari, M.; Arof, H.; Ramiah, H. Application of Artificial Intelligence in Particle and Impurity Detection and Removal: A Survey. IEEE Access 2024, 12, 31498–31514. [Google Scholar] [CrossRef]
  11. Mahanta, L.B.; Mahanta, D.R.; Rahman, T.; Chakraborty, C. Handloomed fabrics recognition with deep learning. Sci. Rep. 2024, 14, 7974. [Google Scholar] [CrossRef] [PubMed]
  12. Cay, A.; Vassiliadis, S.; Rangoussi, M. On the use of image processing techniques for the estimation of the porosity of textile fabrics. Int. J. Mater. Text. Eng. 2007, 1, 421–424. [Google Scholar]
  13. Wang, X.; Georganas, N.D.; Petriu, E.M. Fabric texture analysis using computer vision techniques. IEEE Trans. Instrum. Meas. 2010, 60, 44–56. [Google Scholar] [CrossRef]
  14. Jamali, N.; Sammut, C. Majority voting: Material classification by tactile sensing using surface texture. IEEE Trans. Robot. 2011, 27, 508–521. [Google Scholar] [CrossRef]
  15. Zheng, D.; Han, Y.; Hu, J.L. A new method for classification of woven structure for yarn-dyed fabric. Text. Res. J. 2014, 84, 78–95. [Google Scholar] [CrossRef]
  16. Pawening, R.E.; Dijaya, R.; Brian, T.; Suciati, N. Classification of textile image using support vector machine with textural feature. In Proceedings of the 2015 International Conference on Information & Communication Technology and Systems (ICTS), Surabaya, Indonesia, 16 September 2015; IEEE: Piscataway, NJ, USA, 2015. [Google Scholar]
  17. Jing, J.; Fan, X.; Li, P. Automated fabric defect detection based on multiple Gabor filters and KPCA. Int. J. Multimed. Ubiquitous Eng. 2016, 11, 93–106. [Google Scholar] [CrossRef]
  18. Khan, B.; Wang, Z.-J.; Han, F.; Hussain, M.A.I. Fabric weave pattern and yarn color recognition and classification using a deep ELM network. Algorithms 2017, 10, 117. [Google Scholar] [CrossRef]
  19. Huang, M.-L.; Fu, C.-C. Applying image processing to the textile grading of fleece based on pilling assessment. Fibers 2018, 6, 73. [Google Scholar] [CrossRef]
  20. Sabeenian, R.S.; Palanisamy, V. Texture Image Classification using Multi Resolution Combined Statistical and Spatial Frequency Method. Int. J. Technol. Eng. Syst. (IJTES) 2011, 2, 167–171. [Google Scholar]
  21. Kaplan, K.; Kaya, Y.; Kuncan, M.; Ertunç, H.M. Brain tumor classification using modified local binary patterns (LBP) feature extraction methods. Med. Hypotheses 2020, 139, 109696. [Google Scholar] [CrossRef]
  22. Yildirim, P.; Birant, D.; Alpyildiz, T. Data mining and machine learning in textile industry. Wiley Interdiscip. Rev. Data Min. Knowl. Discov. 2018, 8, e1228. [Google Scholar] [CrossRef]
  23. Bora, K.; Mahanta, L.B.; Chakraborty, C.; Borah, P.; Rangpi, K.; Barua, B.; Sharma, B.; Mala, R. Computer-Aided Identification of Loom Type of Ethnic Textile, the Gamusa, Using Texture Features and Random Forest Classifier. In Proceedings of the International Conference on Data, Electronics and Computing, Shillong, India, 7–9 September 2022; Springer Nature Singapore: Singapore, 2022. [Google Scholar]
  24. Ghosh, A.; Guha, T.; Bhar, R.B. Identification of handloom and powerloom fabrics using proximal support vector machines. Indian J. Fibre Text. 2015, 40, 87–93. [Google Scholar]
  25. Ohi, A.Q.; Mridha, M.F.; Hamid, M.A.; Monowar, M.M.; Kateb, F.A. Fabricnet: A fiber recognition architecture using ensemble convnets. IEEE Access 2021, 9, 13224–13236. [Google Scholar] [CrossRef]
  26. Bhattacharjee, R.K.; Nandi, M.; Jha, A.; Kalita, G. Handloom design generation using generative networks. In Proceedings of the 2020 IEEE International Conference on Image Processing (ICIP), Abu Dhabi, United Arab Emirates, 25–28 October 2020; IEEE: Piscataway, NJ, USA, 2020. [Google Scholar]
  27. Lin, T.-Y.; Maire, M.; Belongie, S.; Hays, J.; Perona, P.; Ramanan, D.; Dollár, P.; Zitnick, C.L. Microsoft coco: Common objects in context. In Proceedings of the Computer Vision–ECCV 2014: 13th European Conference, Zurich, Switzerland, 6–12 September 2014; Proceedings, Part V 13. Springer International Publishing: Berlin/Heidelberg, Germany, 2014. [Google Scholar]
  28. Çam, K.; Aydın, C.; Tarhan, C. Classification of fabric defects using deep learning algorithms. In Proceedings of the 2022 Innovations in Intelligent Systems and Applications Conference (ASYU), Antalya, Turkey, 7–9 September 2022; IEEE: Piscataway, NJ, USA, 2022. [Google Scholar]
  29. Deng, J.; Dong, W.; Socher, R.; Li, L.-J.; Li, K.; Li, F.-F. Imagenet: A large-scale hierarchical image database. In Proceedings of the 2009 IEEE Conference on Computer Vision and Pattern Recognition, Miami, FL, USA, 20–25 June 2009; IEEE: Piscataway, NJ, USA, 2009. [Google Scholar]
  30. Sabeenian, R.S.; Paul, E.; Prakash, C. Fabric defect detection and classification using modified VGG network. J. Text. Inst. 2023, 114, 1032–1040. [Google Scholar] [CrossRef]
  31. Shah, S.R.; Qadri, S.; Bibi, H.; Shah, S.M.W.; Sharif, M.I.; Marinello, F. Comparing inception V3, VGG 16, VGG 19, CNN, and ResNet 50: A case study on early detection of a rice disease. Agronomy 2023, 13, 1633. [Google Scholar] [CrossRef]
  32. Popescu, M.-C.; Balas, V.E.; Perescu-Popescu, L.; Mastorakis, N. Multilayer perceptron and neural networks. WSEAS Trans. Circuits Syst. 2009, 8, 579–588. [Google Scholar]
  33. Hoffer, E.; Ailon, N. Deep metric learning using triplet network. In Proceedings of the Similarity-Based Pattern Recognition: Third International Workshop, SIMBAD 2015, Copenhagen, Denmark, 12–14 October 2015; Proceedings 3. Springer International Publishing: Berlin/Heidelberg, Germany, 2015. [Google Scholar]
  34. Rhu, M.; Gimelshein, N.; Clemons, J.; Zulfiqar, A.; Keckler, S.W. vDNN: Virtualized deep neural networks for scalable, memory-efficient neural network design. In Proceedings of the 2016 49th Annual IEEE/ACM International Symposium on Microarchitecture (MICRO), Taipei, Taiwan, 15–19 October 2016; IEEE: Piscataway, NJ, USA, 2016. [Google Scholar]
  35. Yu, H.; Li, H.; Shi, H.; Huang, T.S.; Hua, G. Any-precision deep neural networks. In Proceedings of the AAAI Conference on Artificial Intelligence, Online, 2–9 February 2021; Volume 35. [Google Scholar]
  36. Buckland, M.; Gey, F. The relationship between recall and precision. J. Am. Soc. Inf. Sci. 1994, 45, 12–19. [Google Scholar] [CrossRef]
  37. Lipton, Z.C.; Elkan, C.; Narayanaswamy, B. Thresholding classifiers to maximize F1 score. arXiv 2014, arXiv:1402.1892. [Google Scholar]
Figure 1. (a) Assam weaving loom operated by a native woman and (b) a handloom textile sample.
Information 15 00465 g001
Figure 2. Representation of our proposed model.
Information 15 00465 g002
Figure 3. A schematic depiction of the proposed workflow.
Information 15 00465 g003
Figure 4. Our dataset development process resulted in a total of 25,166 images from six classes of handloom textile samples (Pure Pat, Kesa Pat, Nuni Pat, Pure Muga, Toss Muga, and Dry Toss Muga).
Information 15 00465 g004
Figure 5. Architecture of the proposed deep metric learning (DML) network model for classification of various handloom textiles.
Information 15 00465 g005
Figure 6. Performance evaluation of the proposed method during training and validation in terms of (a) accuracy and (b) loss with respect to epochs.
Information 15 00465 g006
Figure 7. Confusion matrix: performance evaluation using the independent test dataset.
Information 15 00465 g007
Figure 8. Comparative evaluation of different existing models and our proposed model for classification of handloom textiles in terms of (a) accuracy and (b) loss.
Information 15 00465 g008
Table 1. Some existing handloom textile classification models, datasets used, and limitations.
MethodologyDatasetLimitation
Discrete Wavelet Transform [7]Silk textile dataset (3501 Images)The method utlizes decomposition progresses to finer scales, resulting in loss in spatial information
LS-SVM [8]Plain weaving fibers dataset (245 Images)Optimal hyperparameter tuning is computationally expensive
HMAX model [18]Fabric weave pattern dataset (5640 Images)Structural dependencies exhibited in intricate patterns
Gabor filters and LBP [21]Textile fabric dataset (40,000 Images)Limited variations inherent in extracting texture at various orientations and scales
DCNN + AWF [9]ImageNet dataset (51,300 Images)Lack of explicit control over feature weights in the network
PCNN [10]Warp knitted fabric dataset (1000 Images)Generalization issue occurs in the training samples
Faster-RCNN [11]Own created dataset (3000 Images)Computational inefficiencies of the designed network
FabricNet [25]Normal fabric dataset (2000 Images)Key features selection is difficult in the network
PSVM [24]Woven fabric dataset (130 Images)Limited to noisy data in training phase
KPCA [17]TILDA dataset (3200 Images)Complex parameter selection cause bias in the network
Table 2. The detail of our dataset.
CategoryHandloom Fabic SamplesCaptured ImagesCropped ImagesAugmented Images
Pure Pat10060018004210
Kesa Pat10060018004166
Nuni Pat10060018004210
Pure Muga10060018004210
Toss Muga10060018004210
Dry Toss Muga10060018004210
Table 3. Details of the proposed model architecture.
LayerKernel & UnitsActivationStridePool Size
Conv1_13 × 3 × 64ReLU2-
Conv1_23 × 3 × 64ReLU2-
MaxPool1--22 × 2
Conv2_13 × 3 × 128ReLU2-
Conv2_23 × 3 × 128ReLU2-
MaxPool2--22 × 2
Conv3_13 × 3 × 256ReLU2-
Conv3_23 × 3 × 256ReLU2-
Conv3_33 × 3 × 256ReLU2-
MaxPool3--22 × 2
Conv4_13 × 3 × 512ReLU2-
Conv4_23 × 3 × 512ReLU2-
Conv4_33 × 3 × 512ReLU2-
MaxPool4--22 × 2
Flatten----
Dense1Units: 4096ReLU--
Dropout10.5---
Dense2Units: 4096ReLU--
Dropout20.5---
Output6Softmax--
Table 4. Performance comparison of the proposed method with state-of-the-art techniques in terms of precision, recall, F1-score, and accuracy.
MethodPrecisionRecallF1-ScoreAccuracy
LS-SVM0.1210.3440.2300.620
GF and LBP0.7540.6710.7540.648
PCNN0.6280.3850.7580.855
DCNN + AWF0.9700.9870.7750.890
FabricNet0.8440.7840.9210.925
Proposed Method0.8950.8830.9430.978
Table 5. Resulting k-fold cross validation accuracy values with respect to different numbers of k and their average (Avg.) and standard deviation (Std.) values.
k ValueAccuracy
288.04
390.24
493.84
596.44
697.34
798.64
897.66
996.75
1098.14
Avg.95.23
Std.3.56
Disclaimer/Publisher’s Note: The statements, opinions and data contained in all publications are solely those of the individual author(s) and contributor(s) and not of MDPI and/or the editor(s). MDPI and/or the editor(s) disclaim responsibility for any injury to people or property resulting from any ideas, methods, instructions or products referred to in the content.

